Article

PM2.5 Pollution Levels and Chemical Components at Teahouses along the Poon Hill Trek in Nepal

by
James D. Johnston
1,*,
John D. Beard
1,
M. Lelinneth B. Novilla
1,
Frank X. Weber
2 and
Ryan T. Chartier
2
1
Department of Public Health, Brigham Young University, Provo, UT 84602, USA
2
RTI International, Research Triangle Park, NC 27709, USA
*
Author to whom correspondence should be addressed.
Atmosphere 2022, 13(7), 1018; https://doi.org/10.3390/atmos13071018
Submission received: 26 May 2022 / Revised: 15 June 2022 / Accepted: 23 June 2022 / Published: 24 June 2022
(This article belongs to the Special Issue Feature Papers in Air Quality)

Abstract

:
Unhealthy levels of fine particulate matter (PM2.5) from the local burning of solid fuels, and from regional transport of pollutants, remain a major public health problem in the Himalayan foothill villages in Nepal. Teahouses (i.e., mountain lodges) along popular hiking trails in the lower Himalayas commonly use wood as the primary energy source for heating; however, little is known about teahouse air quality. The purpose of this study was to characterize the levels and chemical constituents of indoor and ambient PM2.5 at three villages along the Poon Hill circuit trek in the Annapurna Conservation Area in Nepal. A convenience sample of five PM2.5 measurements was collected with portable MicroPEM V.3.2A exposure monitors. Filters were analyzed for black and brown carbon using integrating sphere optical transmittance and 33 elemental constituents using energy-dispersive X-ray fluorescence. Median indoor PM2.5 over the sampling period was 41.3 µg/m3, whereas median ambient PM2.5 over the sampling period was 34.7 µg/m3. Chemical species associated with wood smoke, such as potassium (GM = 0.88 µg/m3), predominated. High indoor and ambient PM2.5 levels may pose a significant occupational health risk to teahouse workers, who may experience chronic exposures during trekking seasons. Our findings warrant additional research to characterize teahouse air pollution exposures more fully and to evaluate intervention measures.

1. Introduction

Nepal is among the 10 worst countries in the world for air quality [1]. Outdoor and indoor air pollution remain significant public health and environmental concerns with particulate pollution being a major problem [2,3,4]. “Fine” particles, or PM2.5, present the most serious threat to health compared to other pollutants [5,6]. According to the 2020 State of Global Air Report, Nepal’s average annual PM2.5 level is the second highest in the world after India [1]. India and Nepal have similar 2019 population-weighted average annual PM2.5 exposure levels at 83.2 and 83.1 μg/m3, respectively [1], which is more than 16 times the World Health Organization’s (WHO) 2021 recommended air quality guideline annual level of 5.0 μg/m3 [7]. Air pollution is a major risk factor for premature death and disability in Nepal [2]. In 2019, 17,900 deaths in Nepal were attributable to PM2.5 exposure [1]. The loss of productivity and subsequent rise in healthcare utilization associated with air pollution poses a serious economic burden on the country [2].
Urban air pollution in cities such as Kathmandu, Nepal’s economic and cultural hub, is well documented [3,4,8,9]. The hazardous air quality in Kathmandu is attributed to a mix of human and geological factors that render the valley vulnerable to air pollution [8,9,10,11]. Human factors are among the major causes of outdoor and indoor air pollution [1,11]. These include vehicular emissions; open burning of refuse, organic waste, and crop residues; use of wood stoves, fossil fuels, and biomass for cooking and heating; smoke from the burning of wood and plastic; industrial and brick kiln emissions; and dust [8,9,10,11]. These factors combine to cause elevated levels of outdoor and indoor particulate matter (particulate matter less than 10 µg in aerodynamic diameter (PM10) and PM2.5) and other pollutants, such as nitrogen dioxide (NO2) and sulfur dioxide (SO2) [4,8,12].
Although urban air pollution is well documented, few studies have considered air pollution in remote villages in the Himalayan foothills. There is evidence that urban air pollution from the lower valleys is transported into Himalayan villages through diurnal wind patterns [13,14]. In addition, local emissions in villages from cooking and heating with solid fuels (e.g., wood) contribute to indoor residential and outdoor PM2.5 and other air pollutants [15,16]. One facet of air pollution exposure in Himalayan villages that has not been studied is related to the trekking industry. Trekking is a major tourist industry in Nepal. Some areas, such as the Annapurna Conservation Area, receive over 100,000 tourists per year [17]. Many popular trekking routes in Nepal have no western-style hotels. Instead, accommodations are available through family-run mountainside lodges, or teahouses, which are located along hiking trails. These wooden and/or stone cottages offer overnight accommodations and other amenities for hikers. Teahouses typically have a centrally located wood-burning stove that is used for indoor heating in a communal dining area, and meals are cooked in kitchens with wood fuel or liquefied petroleum gas (LPG). This presents a risk of indoor air pollution exposure, especially in poorly ventilated teahouses.
Globally, air pollution from burning solid fuels indoors is responsible for approximately 3.8 million deaths annually, many of which occur in South-East Asian countries, such as Nepal [18]. Among pollutants generated from burning solid fuels, PM2.5 may be the most important contributor to this excess mortality [5,6]. The primary chemical constituents of PM2.5 from wood burning are carbon species (elemental and organic), elemental components such as metals and metalloids, and sulfates (SO4) and nitrates (NO3) [19,20,21]. Studies suggest the chemical composition of PM2.5, not just the mass concentration, is an important factor for understanding the health effects associated with exposure. Specific chemical species in PM2.5 are associated with unique adverse health outcomes, including increased respiratory and cardiovascular hospitalization and mortality among the elderly (aluminum (Al), black carbon (BC), calcium (Ca), chlorine (Cl), iron (Fe), nickel (Ni), silicon (Si), SO4, titanium (Ti), vanadium (V), and zinc (Zn)) [22,23], respiratory hospital admissions among children (copper (Cu), elemental carbon (EC), Fe, potassium (K), NO3, Si, SO4, and organic carbon (OC)) [24], and low birth weight in infants from prenatal exposure (Al, EC, Ni, Si, Ti, Zn, and V) [25,26]. Thus, understanding the chemical composition of PM2.5 in teahouse indoor air may provide important data for understanding health risks associated with exposure.
During the trekking season, teahouse workers may experience chronic exposure to high levels of PM2.5 from wood stoves used for heating, and, in some cases, from wood cookstoves used in teahouse kitchens. This study aimed to add to the relatively scant literature on air quality assessments in Himalayan villages at higher altitudes by: (1) collecting a convenience sample of PM2.5 measurements to identify trends in indoor and outdoor PM2.5 pollution at teahouses along the Poon Hill trail in the Annapurna Conservation Area and (2) characterizing the elemental composition of indoor and outdoor PM2.5. Monitoring indoor PM2.5 pollution in teahouses may help guide future public health responses directed at reducing exposures among teahouse workers and guests.

2. Materials and Methods
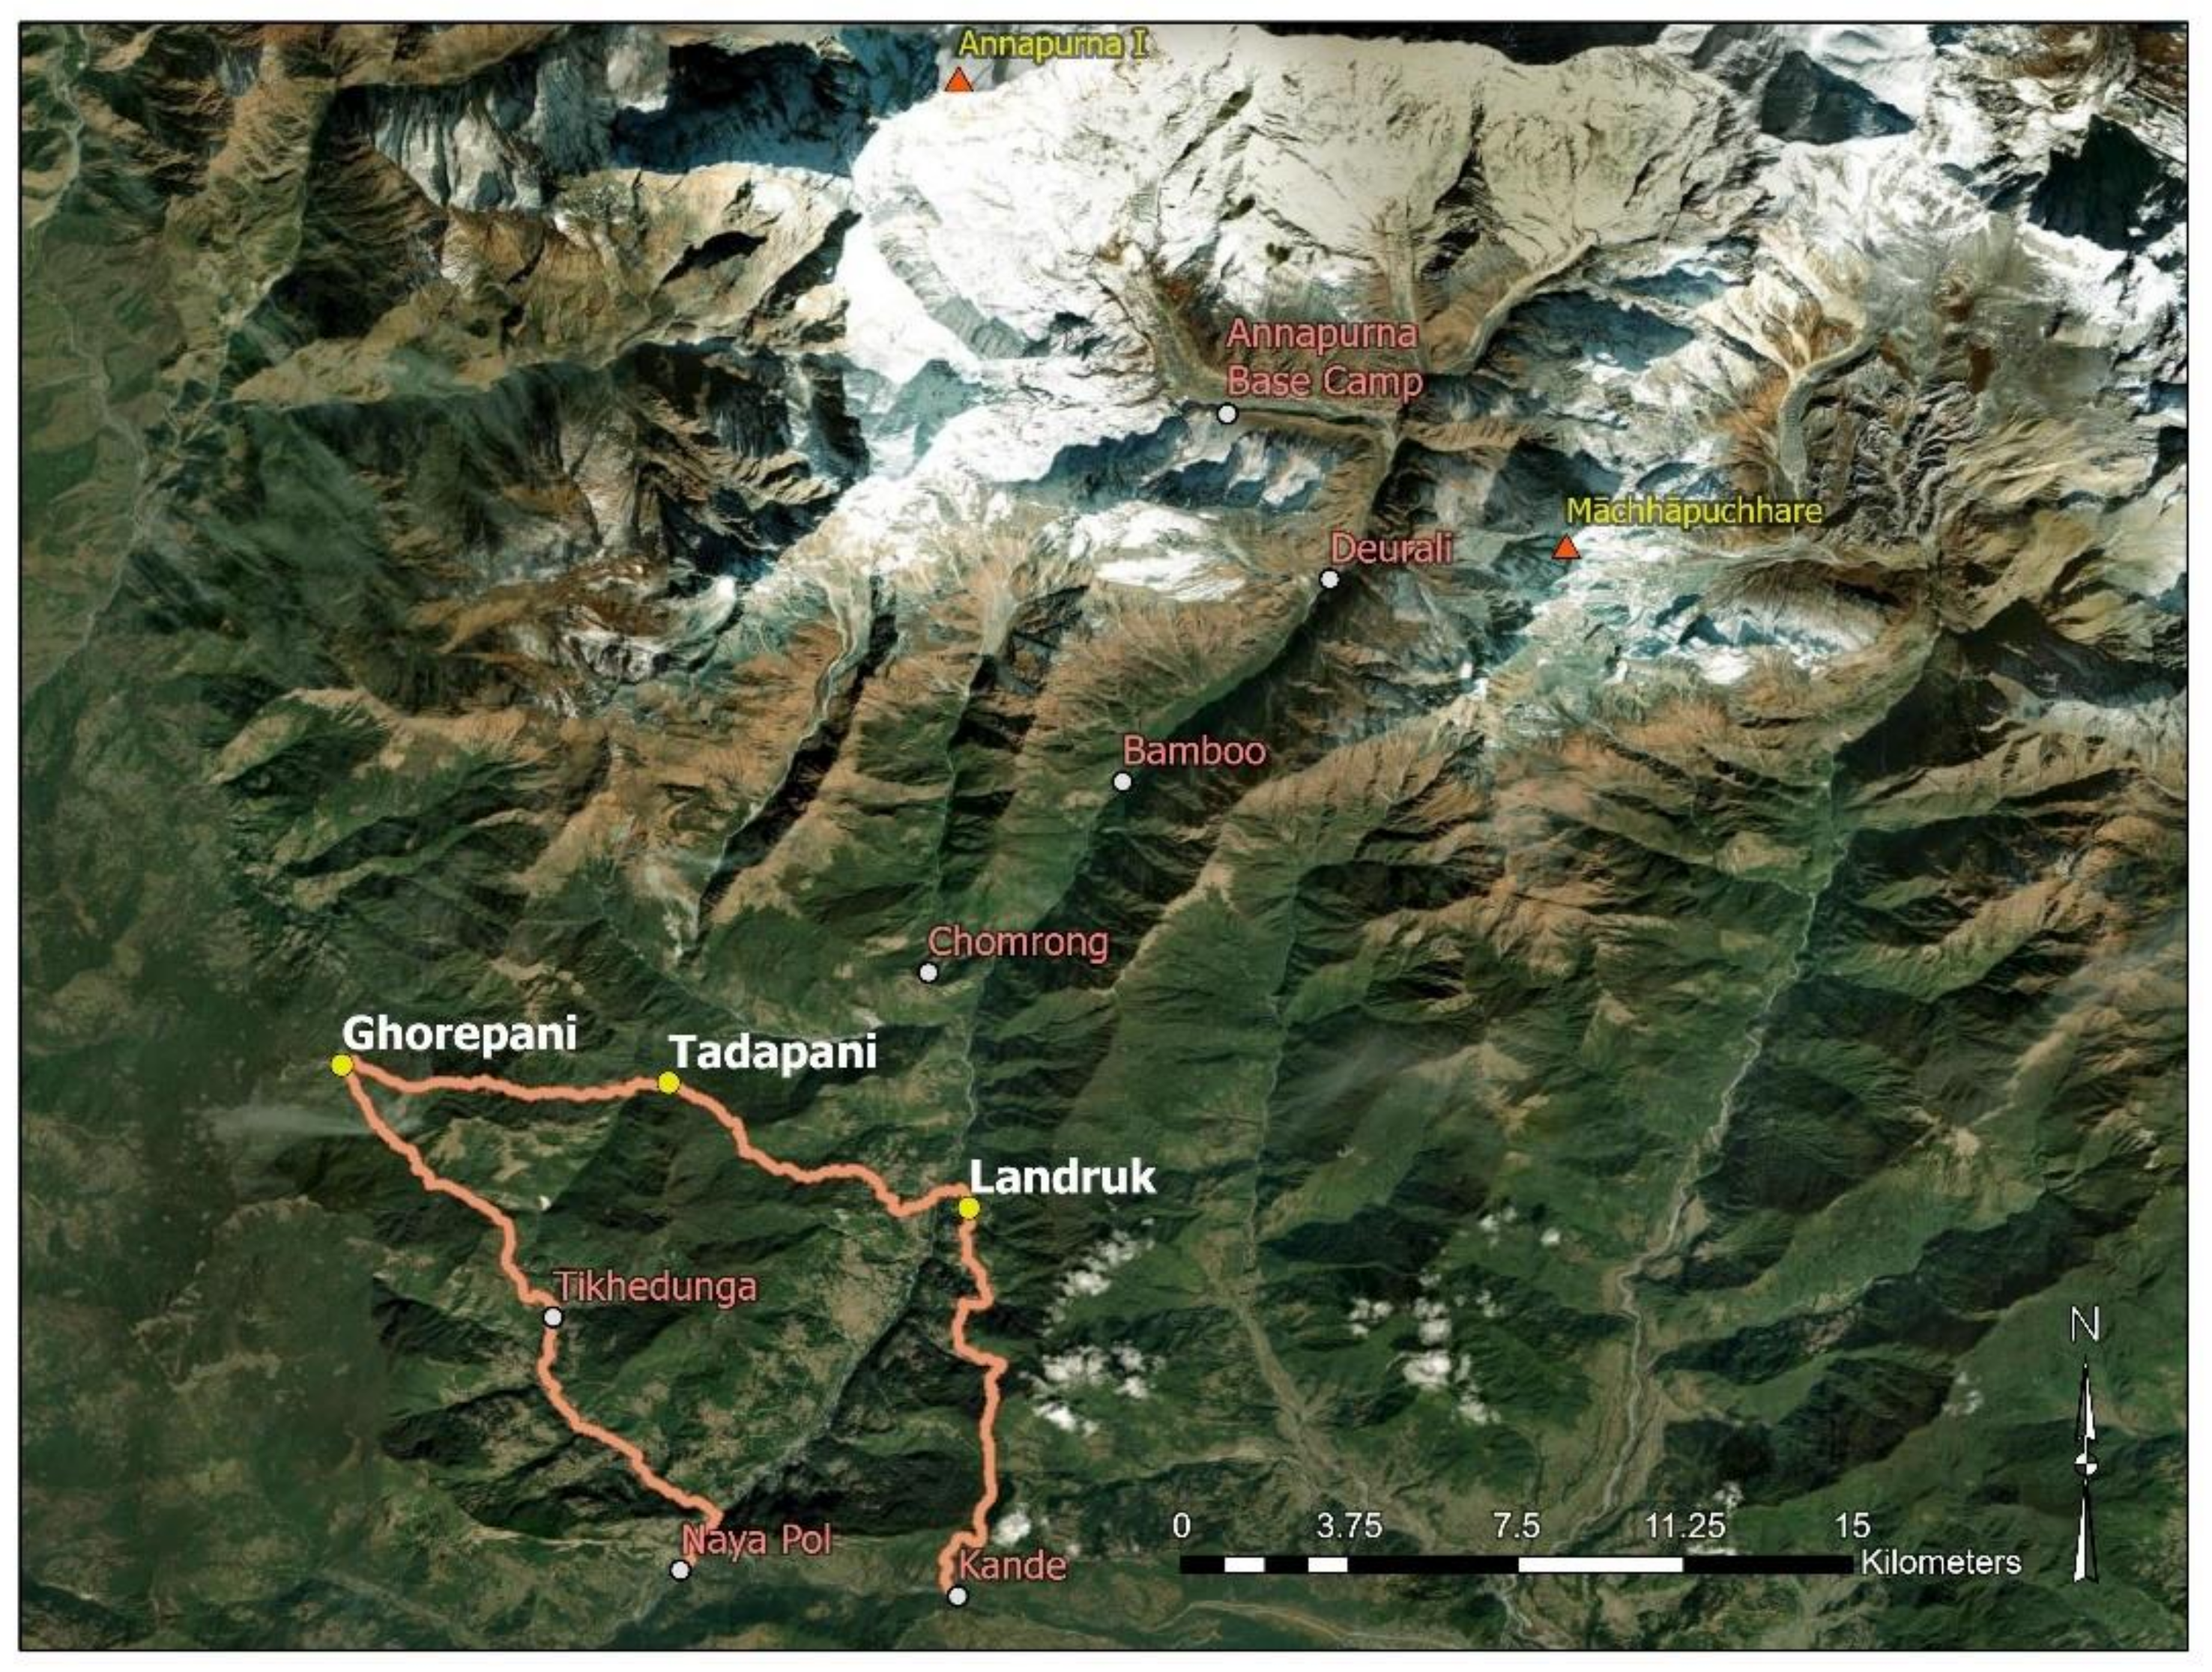
2.1. Study Design

In this cross-sectional study, we measured indoor and outdoor PM2.5, air temperature (°C), and relative humidity (RH) based on a total of five samples from three villages (Tadapani, Landruk, and Ghorepani) along the Poon Hill circuit trek in Nepal (Figure 1). Coordinates for these villages are: Ghorepani 28.402494° N 83.699928° E, Tadapani 28.396519° N 83.765274° E, Landruk 28.371269° N 83.825821° E. At each village, monitoring instruments were calibrated and deployed upon arrival in the afternoon and were collected the following morning. Verbal permission was obtained from the teahouse manager prior to collecting the indoor samples. One indoor and one outdoor sample were collected at Ghorepani (2874 m) and Tadapani (2610 m). At Landruk (1628 m), an indoor sample was collected inside the teahouse, but the outdoor instrument failed, for a total of five air samples. Samples were collected from 5–8 May 2019. The teahouses at which the air monitors were placed were similar in size and construction. Exempt approval was granted by Brigham Young University’s (BYU) Institutional Review Board (IRB) as the study did not meet the definition of human subjects’ research outlined in 45 CFR 46 [27].

2.2. Indoor and Outdoor PM2.5, Temperature, and Relative Humidity Measurements

Portable MicroPEM V.3.2A exposure monitors (RTI International, Research Triangle Park, NC, USA) were used to collect PM2.5 on a filter while simultaneously measuring PM2.5 concentration with a nephelometer. We used 25 mm 3.0 µm PTFE filters (Zefon International, Ocala, FL, USA) in the MicroPEMs. Filters were pre- and post-weighed after being conditioned for temperature and humidity in a controlled environment for 24 h. For both pre- and post-weights, each filter was weighed three times and the average was used as the final weight. Filters were weighed on a Mettler Toledo XP2U microbalance (Mettler Toledo, Columbus, OH, USA) after being passed through a U-bar deionizer (Haug North America, Williamsville, NY, USA) to remove static electricity. Filters were transported to and from Nepal in SKC filter keepers (SKC, Inc., Eighty Four, PA, USA). The MicroPEM also collects temperature and RH data. Indoor samples were collected by hanging the MicroPEM in a pouch at approximately breathing zone height (while standing) in the main dining area of the teahouse. The pouch was constructed of low-dander ripstop nylon [28]. MicroPEMs were placed approximately 3.5 m from wood-burning stoves in the teahouse dining areas. Outdoor samples were placed on tripods at approximately 1.2 m from the ground. Outdoor samples were placed in open-air locations approximately 100 m from village buildings to reduce the collection of source-specific pollution. Detailed methods describing MicroPEM calibration, preparation, and filter handling were described previously [28]. For this study, MicroPEMs were calibrated to 0.50 L/min in teahouse dining rooms prior to sample collection using a TSI model 4140 mass flowmeter (TSI, Shoreview, MN, USA) and Docking Station software version 2.0 (RTI International, Research Triangle Park, NC, USA). Due to our trekking itinerary, samples were collected from approximately 5:00 p.m. to 7:30 a.m. the following morning. PM2.5 concentrations were calculated as mass in µg of PM2.5 divided by volume (V) of air sampled in m3 (1). PM2.5 mass was determined by subtracting filter pre-weights (M1) from filter post-weights (M2). Air volume (2) was calculated as the MicroPEM flow rate (Q) in L/min multiplied by time in minutes (T), divided by a conversion factor (1000 L/m3).
PM 2.5 = M 2 M 1 V
V = Q × T / 1000

2.3. Elemental and Carbon Analyses

Filters were analyzed at RTI International for 35 PM2.5 chemical constituents. Filters were first analyzed for BC and brown carbon (BrC) using RTI International’s integrating sphere optical transmittance technique, as previously described [29,30]. In brief, filters were challenged at seven wavelengths ranging from 940 nm to 430 nm. Transmittance through the filters was adjusted using 10 blank samples from the same lot as the filters used to collect the samples. Transmittance values were used to quantify BC and BrC using an empirically derived algorithm. For 33 elemental constituents, we used Compendium Method IO3.3 [31]. This method is described previously (see [32]), but, in brief, IO3.3 was modified for use with the Thermo Scientific™ ARL™ QUANT’X EDXRF Spectrometer (Thermo Fisher Scientific, Waltham, MA, USA) equipped with a silicon drift detector. Thin-film standards (Micromatter Technologies Inc., Surrey, BC, Canada) were used to calibrate the XRF instrument.

2.4. Statistical Analyses

We used SAS, version 9.4 (SAS Institute, Inc., Cary, NC, USA), to conduct all statistical analyses. As recommended by RTI International [33], we multiplied all PM2.5 data by a correction factor, which was calculated as the gravimetric filter concentration divided by the mean nephelometer concentration of the sampling period. For all variables, we determined the frequencies and percentages of samples that had mean (of the sampling period) measurements below or above lower detection limits (LDL). We also calculated minimums and maximums of mean (of the sampling period) measurements from samples that had values above LDLs. For sampling time, RH, and temperature, we used separate intercept-only linear regression models to calculate arithmetic means (AM) and 95% confidence intervals (CI) of mean (of the sampling period) measurements because the distributions of these variables were approximately normally distributed. For PM2.5 and PM2.5 chemical components, we used separate intercept-only linear (if all measurements were above LDLs) or Tobit (if at least one measurement was below LDLs) regression models to calculate geometric means (GM) and 95% CI of mean (of the sampling period) measurements because the distributions of these variables were right-skewed.
For the 15 variables that had all measurements above LDLs, we used separate two-sample Wilcoxon signed-rank tests (t approximation) of the original values to estimate unadjusted p-values for associations between sample location (indoor, outdoor) and median average (of the sampling period) measurements. For the 11 variables that had at least one measurement above LDLs, we used separate simple exact unconditional logistic regression models to estimate unadjusted exact odds ratios (OR), 95% CI, and p-values for associations between sample location and having mean (of the sampling period) measurements above LDLs. We used line graphs to explore trends in mean (over location categories) PM2.5 concentration, RH, and temperature during the sampling period.

3. Results

3.1. Summary Statistics for PM2.5, PM2.5 Chemical Components, Temperature, and Relative Humidity

The AM sampling time was 815.37 min (13.59 h), the AM average (of the sampling period) RH and temperature were 55.1% and 17.5 °C, respectively, and the GM average (of the sampling period) PM2.5 concentration was 44.4 μg/m3 (Table 1). All measurements were below LDLs for 12 PM2.5 chemical components (Supplementary Materials, Table S1). For the other 23 PM2.5 chemical components, the GM average (of the sampling period) concentrations ranged from 0.0019 (chromium (Cr)) to 14.4 (BrC) μg/m3 with a median of 0.016 (Ti) (Table 1).

3.2. Associations between Sample Location and PM2.5, PM2.5 Chemical Components, Temperature, and Relative Humidity

The sample location was not significantly associated with median average (of the sampling period) measurements or having mean (of the sampling period) measurements above LDLs for any variable (Table 2 and Table 3); however, median average (of the sampling period) concentrations for PM2.5 were higher for indoor (41.3 μg/m3) than outdoor (34.7 μg/m3) samples (Table 2). Similarly, all 12 PM2.5 chemical components that had all measurements above LDLs had higher median average (of the sampling period) concentrations for indoor than outdoor samples (e.g., Al: indoor: 0.30 μg/m3; outdoor: 0.26 μg/m3). Indoor samples had a lower median average (of the sampling period) RH (47.9%) compared to outdoor samples (63.0%), but indoor samples had a higher median average (of the sampling period) temperature (19.9 °C) compared to outdoor samples (11.8 °C). For the 11 PM2.5 chemical components that had at least one measurement above LDLs, outdoor samples were more likely than indoor samples to have mean (of the sampling period) measurements above LDLs for seven chemical components (e.g., Ba: exact OR: 1.73; exact 95% CI: 0.01, 234.50), but less likely for four chemical components (e.g., Mn: exact OR: 0.58; exact 95% CI: <0.01, 78.17; Table 3).

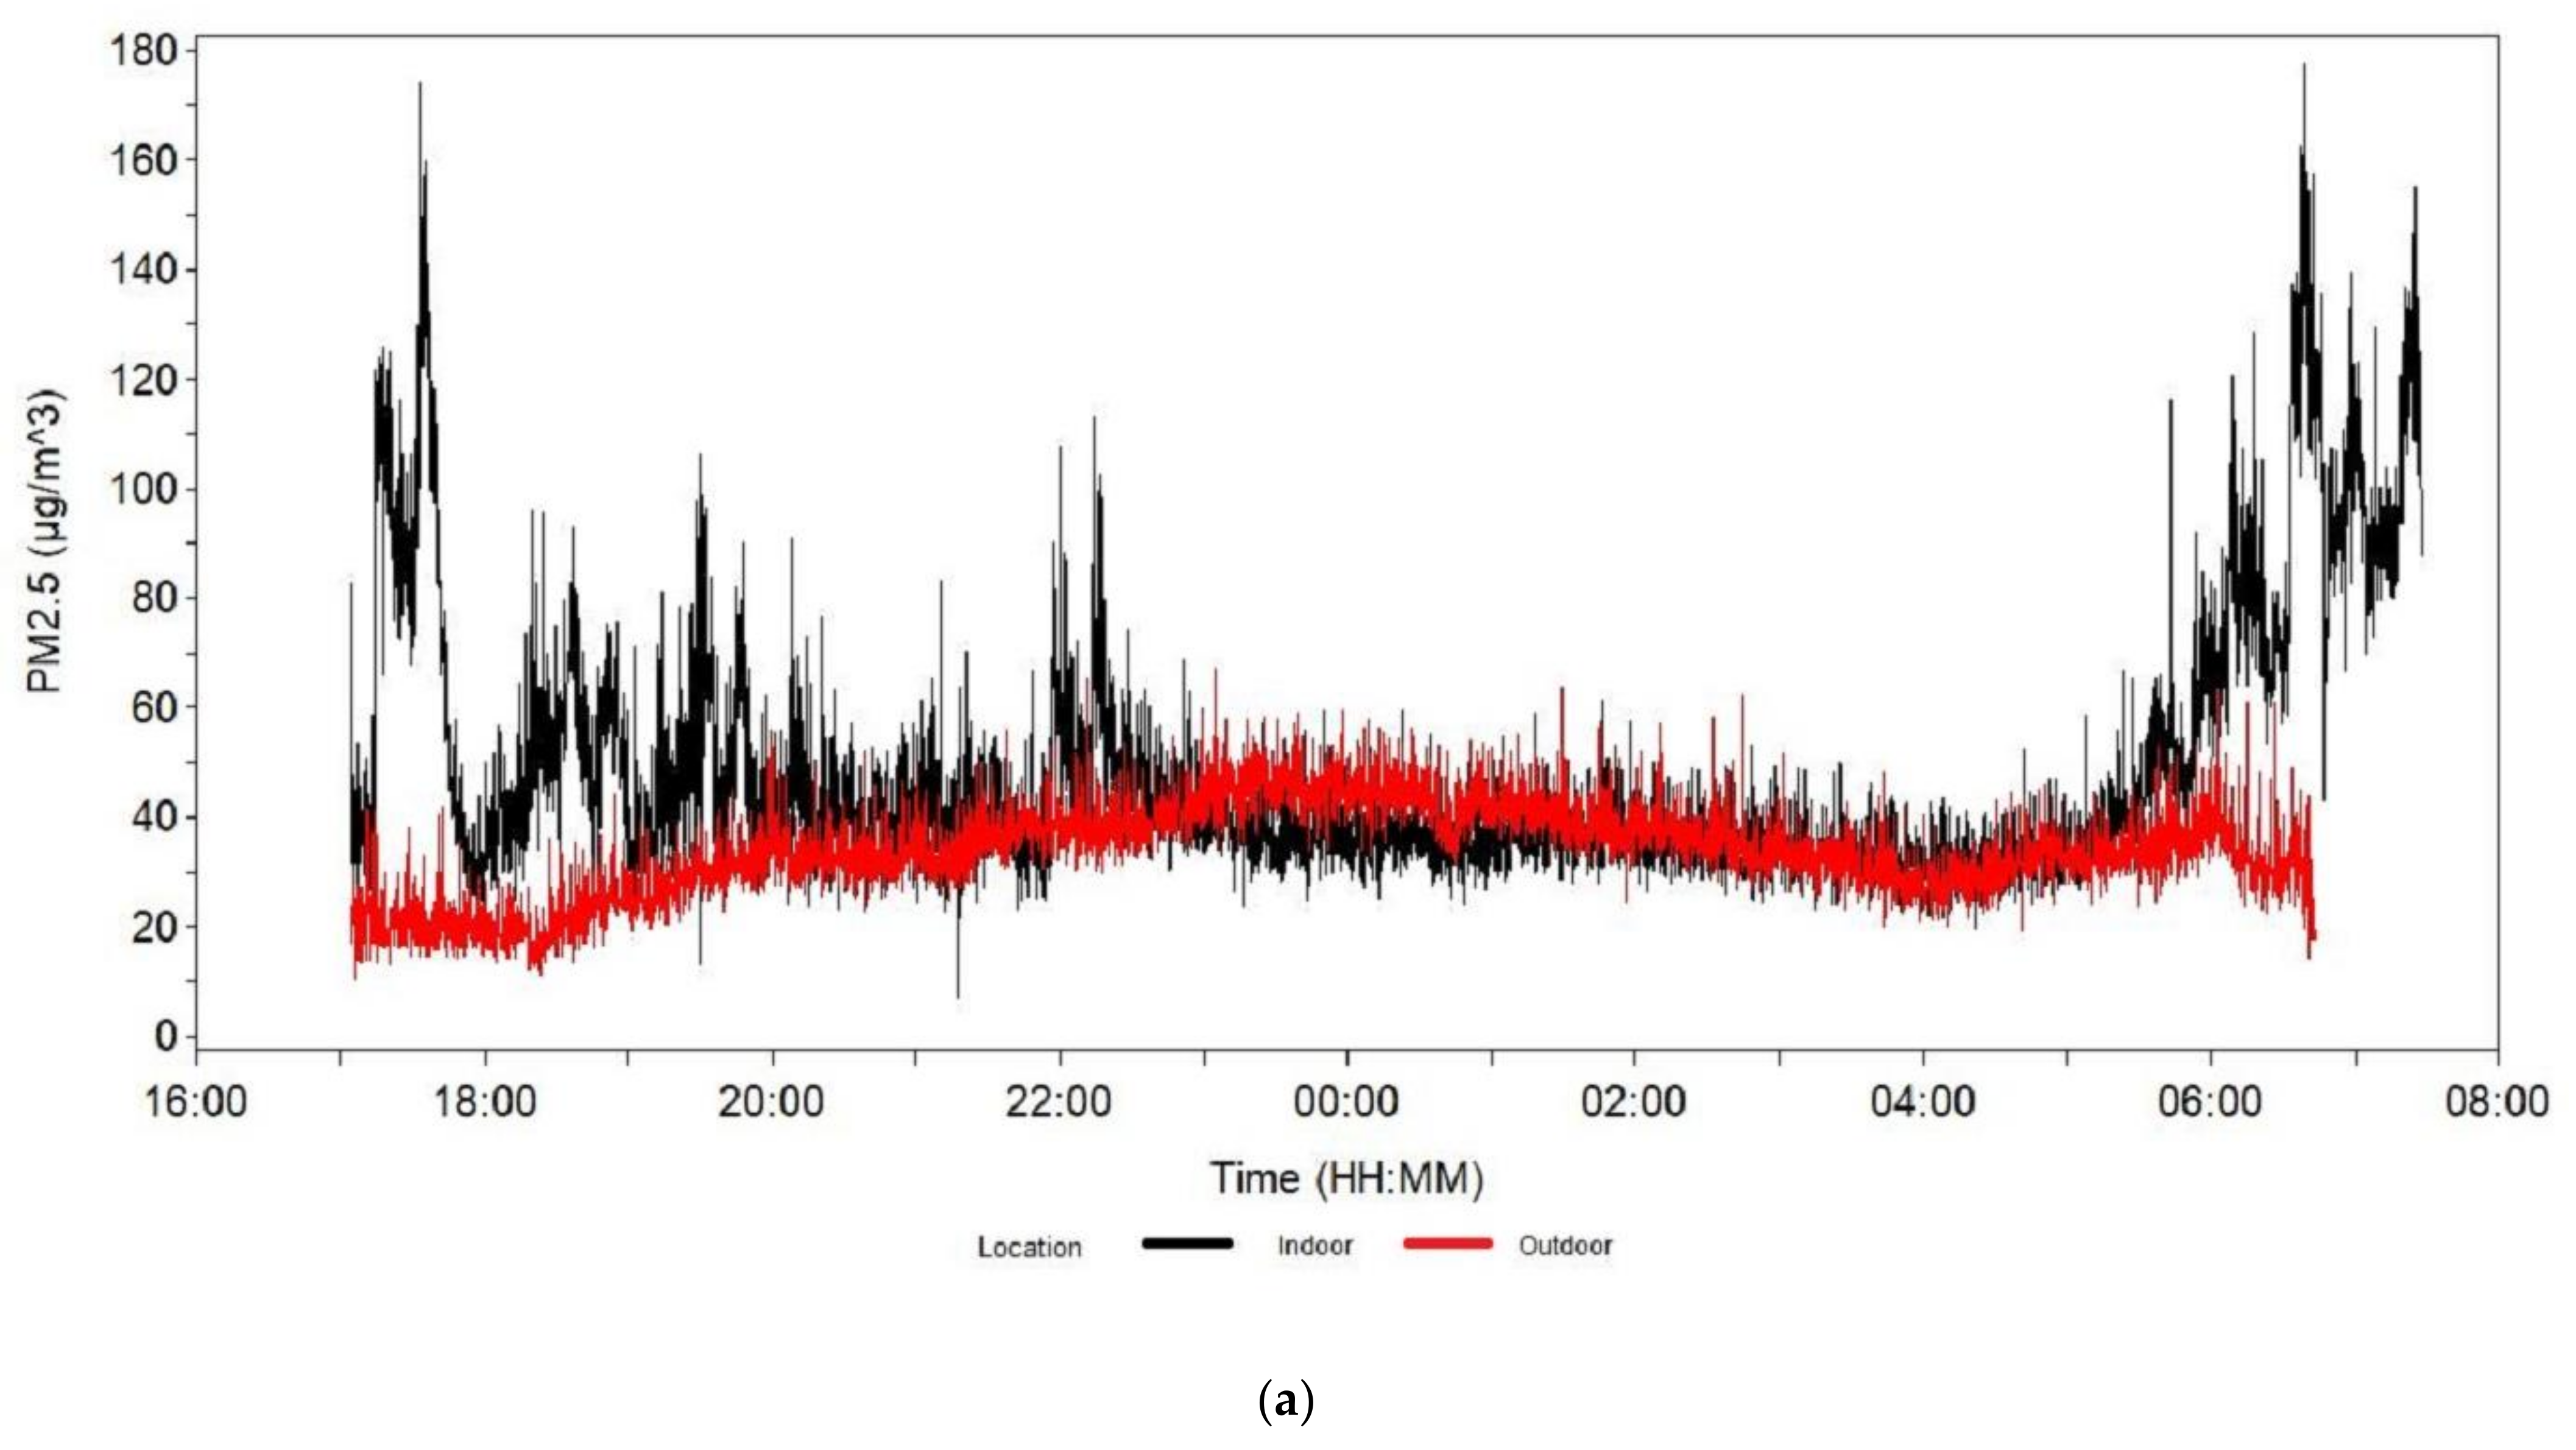
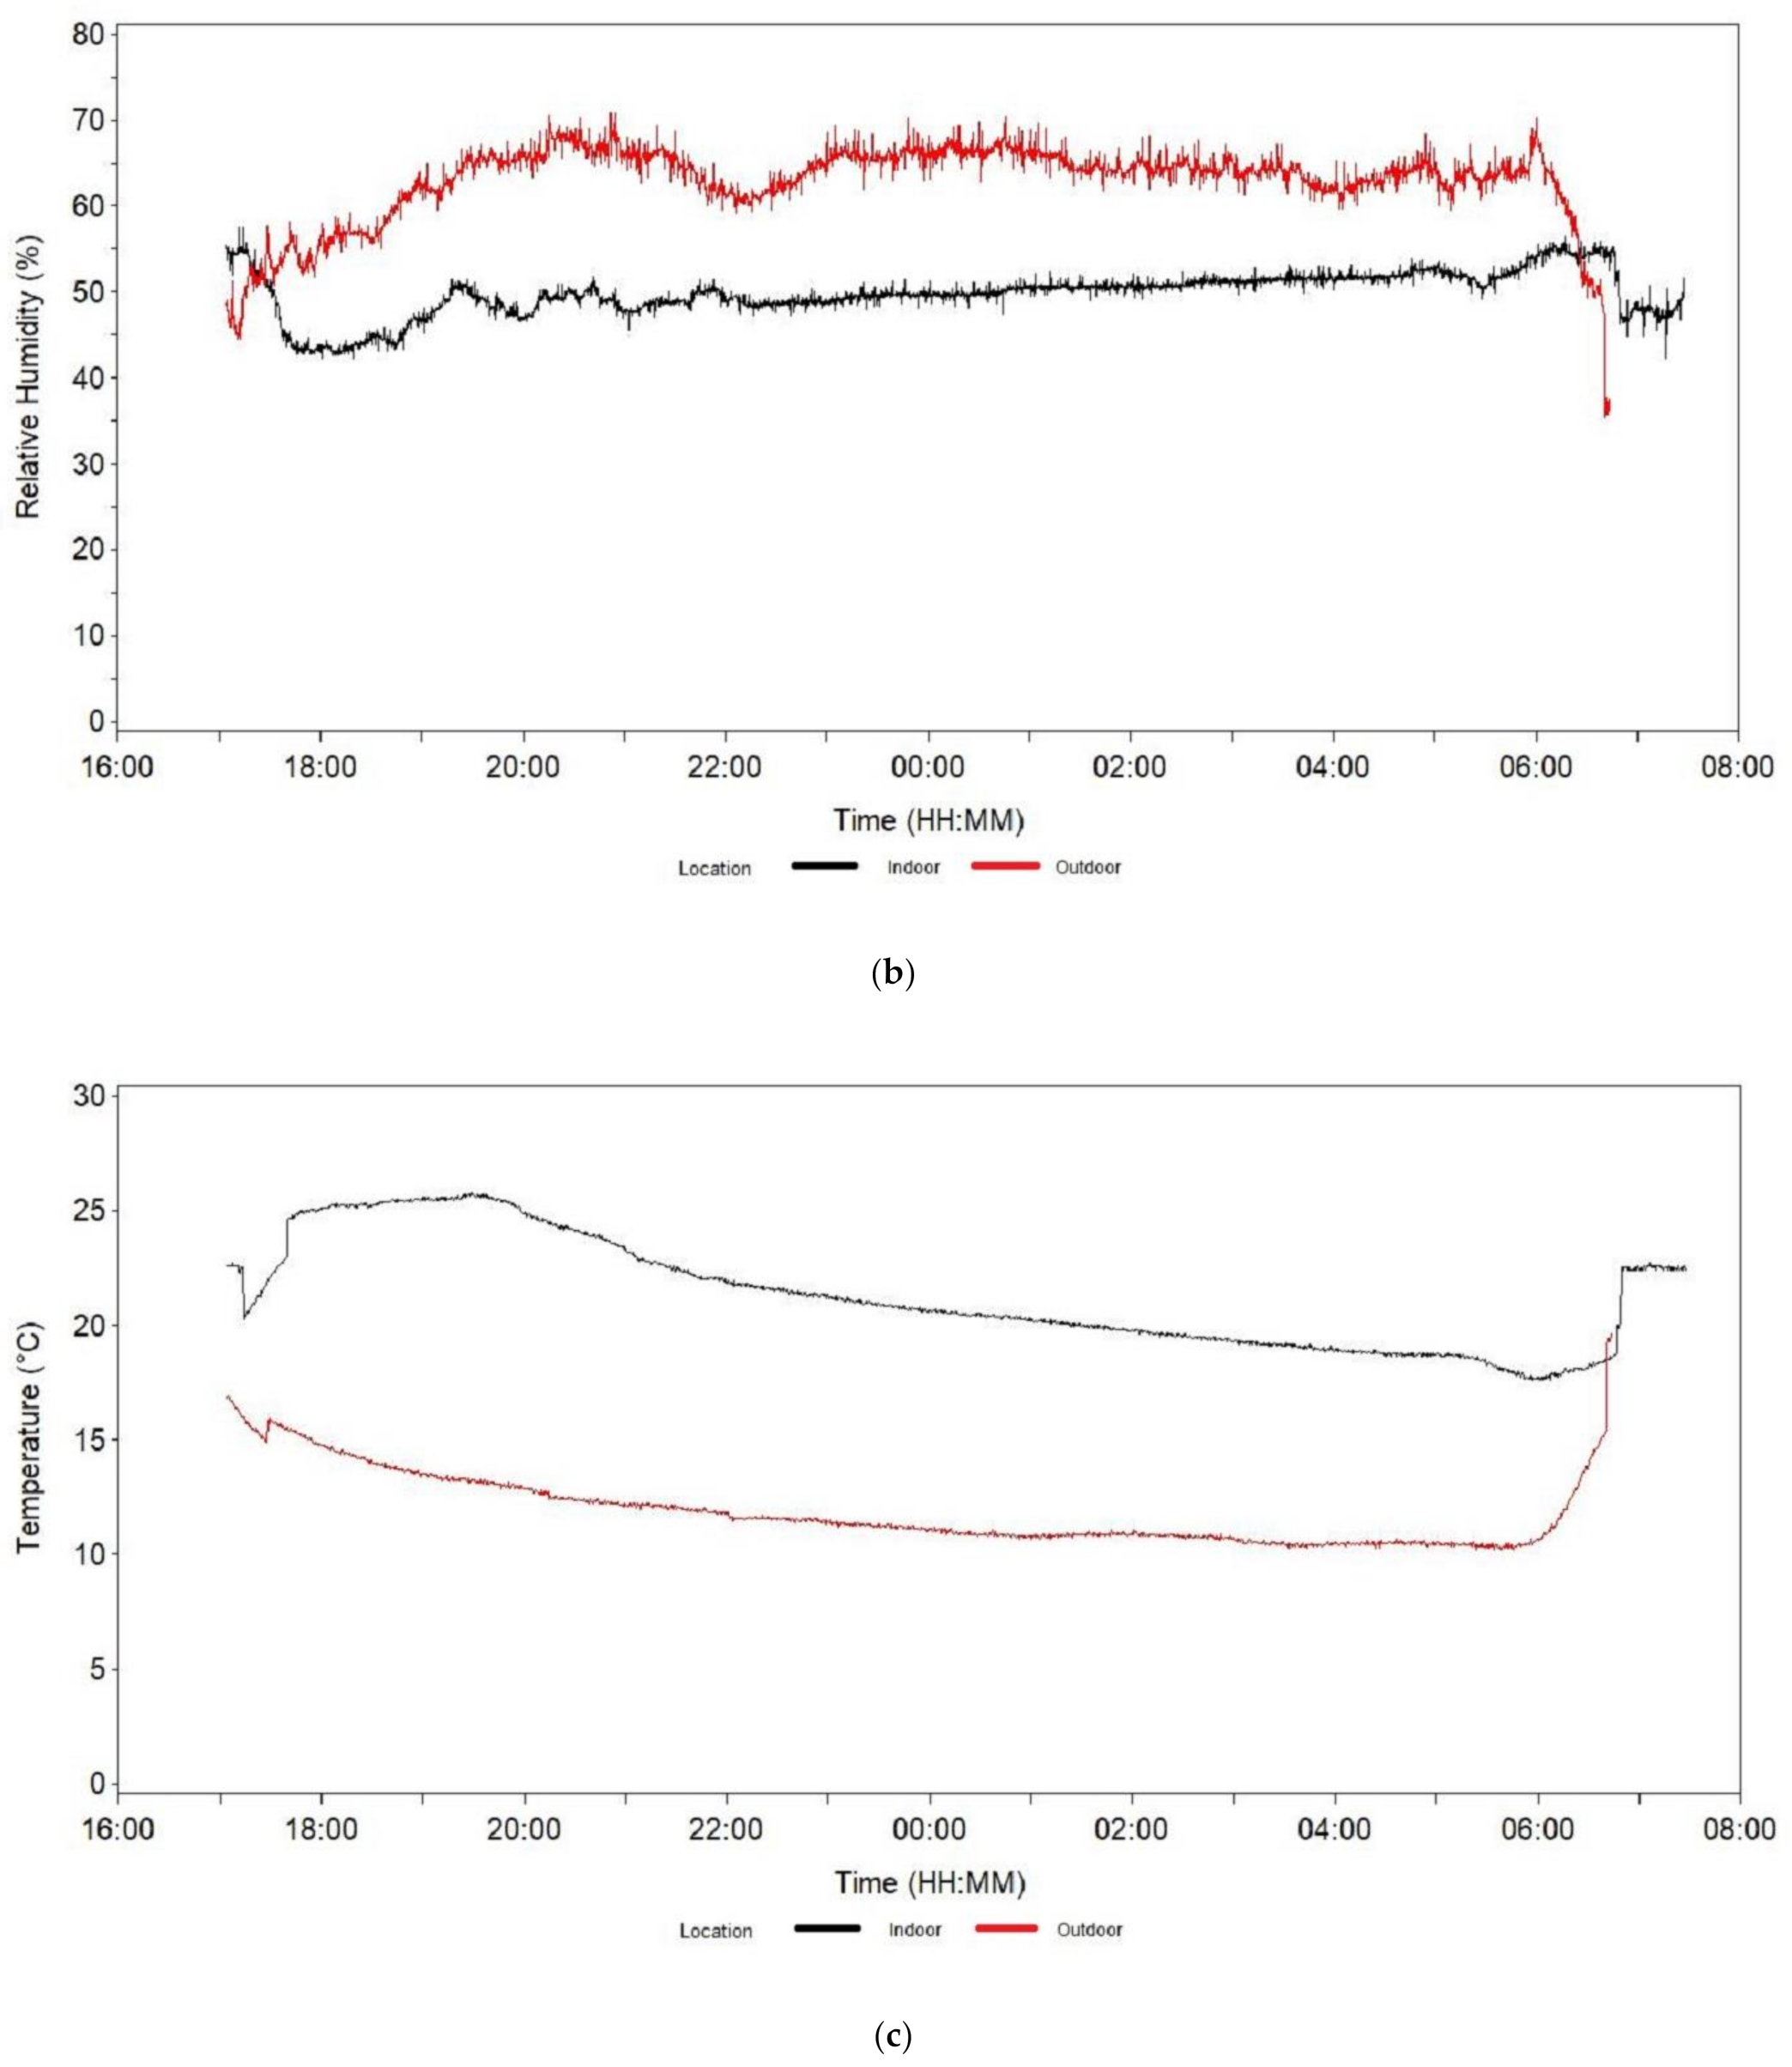
3.3. Line Graphs of PM2.5, PM2.5 Chemical Components, Temperature, and Relative Humidity during the Sampling Period

Mean (over location categories) PM2.5 concentrations during the sampling period were generally higher for indoor than outdoor samples, particularly during mealtimes when indoor mean concentrations peaked at 174.0 μg/m3 at 17:33:00 and at 177.4 μg/m3 at 06:39:00 (the highest outdoor mean concentration was 67.1 μg/m3 at 23:04:20; Figure 2). Indoor samples generally had mean (over location categories) RH between approximately 45% and 55% during the sampling period, which was lower than outdoor samples, which generally had a mean (over location categories) RH between approximately 60% and 70% during the sampling period. In contrast, the mean (over location categories) temperature for indoor samples was generally between approximately 20 °C and 25 °C during the sampling period, which was higher than for outdoor samples, which generally had a mean (over location categories) temperature between approximately 10 °C and 15 °C during the sampling period. For both indoor and outdoor samples, mean (over location categories) temperatures decreased during the sampling period until the morning mealtime, when they increased.

4. Discussion

4.1. PM2.5

Previous studies show high levels of indoor air pollution in residences in Himalayan villages in Nepal caused by the indoor burning of biomass fuels [15,16]. The current study adds to the literature by documenting high PM2.5 pollution levels at teahouses along a popular trekking route in the Annapurna Conservation Area [17]. The teahouses included in this study used LPG for cooking. Thus, indoor pollution appears to originate primarily from smoke from wood-burning stoves used to heat the central dining areas. Teahouse air quality may also be affected by the infiltration of outdoor air pollution. Bai et al. (2020) found that 31–66% of indoor PM2.5 can be attributed to outdoor air pollution in a university dormitory, depending on the season [34]. The contribution rate (%) of outdoor to indoor PM2.5 was higher during the spring and summer months when natural ventilation (window opening) was more common. We did not conduct a formal assessment of building envelopes as part of this study, but, in general, the rustic concrete, wood, and stone construction of the teahouses allowed ample gaps for exchange between indoor and outdoor air, warranting a more in-depth future study. Indoor and outdoor PM2.5 concentrations measured in this study showed the potential for teahouses to exceed the 15 µg/m3 short-term (24 h) limit recommended by WHO [35]. Over the sampling period, PM2.5 concentrations were ~2.5–6.3 times the WHO limit across the three teahouses. Long-term exposure to wood smoke is associated with multiple poor health outcomes [36,37,38]. Our findings raise concern primarily for teahouse workers, who likely experience chronic occupational PM2.5 exposures during the spring and fall trekking seasons, when the Annapurna Conservation Area receives over 100,000 tourists per year [17].
Overall, PM2.5 concentrations in teahouses were higher than residential levels reported in a high-altitude Sherpa village in Nepal. Pratali et al. (2019), in a study of 32 non-smoking homes in Chaurikharka (2562 m), reported an average 24-h PM2.5 concentration of 35 µg/m3 [16]. Homes in their study relied on solid fuels (i.e., wood) for cooking and heating. In our study, the median indoor PM2.5 concentration over the sampling period was 41.3 µg/m3. PM2.5 trends in teahouses were similar to the diurnal trends reported by Pratali et al., with morning and evening peaks that coincided with meal preparation [16]. Chimney ventilation has been shown to significantly reduce indoor pollution levels in buildings in Himalayan villages [39]. Wood-burning stoves in the three teahouses we monitored were equipped with chimneys, but indoor concentrations were still ~1.2 times the ambient levels.
Interestingly, we found the highest indoor concentration of PM2.5 in the teahouse in Landruk (94.8 µg/m3), where the wood-burning stove was not being used. It is possible that the high PM2.5 levels originated from nearby buildings and infiltrated into the dining area. Another plausible explanation is that Landruk, which is at a lower elevation (1628 m), is located closer to urban centers. The Himalayan mountain wind system is well-documented [13,14] and the high indoor PM2.5 measurement in Landruk may have partially resulted from regional transport of pollution from the more densely populated valley below. Similar phenomena have been observed in other parts of Nepal. For instance, the diurnal “Kathmandu Chimney” effect is responsible for warm, polluted air from the Kathmandu valley being drawn upward into the Dudh Kosi mountain valley during the day, contributing to air pollution in high-altitude villages, such as Lukla (2860 m) [13]. At night, cool mountain air flows down the Himalayas into the mountain valleys and villages, decreasing pollution concentrations overnight. Unfortunately, the outdoor monitor at Landruk failed, so we were unable to compare indoor and ambient pollution at this site. Furthermore, as mentioned previously, we did not formally assess building factors associated with pollution infiltration.
Due to the exploratory nature of this study and the small sample size, we were not able to identify and apportion sources of ambient pollution. We did find that ambient PM2.5 concentrations in both Ghorepani and Tadapani were more than twice the WHO 24-hr recommended limit, with concentrations at 35.2 and 34.1 µg/m3, respectively. Although there is vehicle access to Landruk, there are no roads leading to the two remote villages of Ghorepani and Tadapani. Thus, the mountain wind system may explain these results, at least in part; however, overnight particle concentrations remained fairly stable, with a slight peak around midnight. This trend is opposite of what we would have expected based on data from Hindman et al. (2002), who suggested that morning air would have less pollution while evening air would have more [13]. A plausible explanation is that the relatively stable PM2.5 levels in our outdoor samples originated from local sources, primarily biomass burning, in village residences and teahouses [15]. Boundary layer height decreases at night, decreasing the volume of air in which the pollutants are mixed, which increases the concentration [40]. It is possible that decreases in pollution from wind currents were masked by boundary layer effects, which increased PM2.5 concentrations overnight.

4.2. PM2.5 Chemical Components

The elemental composition of our samples suggests that much of the PM2.5 in both indoor and outdoor air in Ghorepani and Tadapani originated from wood smoke. Elemental K and Cl are commonly emitted in aerosols from burning wood [20,41]. Both of these aerosol-phase tracers were present indoors and outdoors in all of our samples. For both elements, indoor concentrations were ~1.2 and 2.5 times the outdoor levels for K and Cl, respectively. Among the 33 elemental constituents in our samples, K had the second-highest concentration (median indoor = 0.85 µg/m3, outdoor = 0.69), behind elemental sulfur (S; median indoor = 1.49, outdoor = 1.33 µg/m3), which is also a marker of wood smoke [42,43]. Similar indoor and outdoor concentrations of K and Cl were reported by Jorquera et al. (2018) for urban homes in Temuco, Chile, where wood is commonly used for cooking and heating. Their reported indoor concentrations of K and Cl were 1.07 and 1.06 µg/m3, and outdoor concentrations were 0.75 and 0.94 µg/m3, respectively [44]. In their study, homes with wood cookstoves also had significantly higher levels of Si, Ca, Ti, Fe, Zn, and arsenic (As). Our findings mirror these results. With the exception of As, which had measurements below LDL for all five samples, our indoor samples had higher concentrations than our outdoor samples for Si, Ca, Ti, Fe, and Zn. In addition, all of these elements had measurements that were above the LDLs in all five samples. Several other elemental constituents were identified in our samples that are associated with burning wood at high temperatures, including Al, magnesium (Mg), and phosphorus (P) [21,45].
Non-exhaust emissions from vehicles primarily come from brake wear and tire fading. Studies show antimony (Sb), barium (Ba), Cu, Fe, strontium (Sr), and Zn are common markers of brake wear [46,47,48], while cadmium (Cd) and Zn are markers of tire fading [46,47]. For Cd, Sr and Sb, all samples were below the LDL. For Cu, outdoor samples in Tadapani and Ghorepani were below the LDL. Tire fading and brake wear both release Zn, and brake wear releases Fe. We found Zn and Fe in both indoor and outdoor samples; however, as mentioned previously, Zn is also released in wood smoke, and Fe is a common crustal element [44,48]. Considering Zn levels were higher indoors, we suggest wood smoke is the primary source of this element in our samples. In addition, we saw little evidence of vehicle emissions in outdoor air. Specifically, Cr, Cu, and Ni, which are commonly associated with vehicle emissions [46,49,50], all measured below the LDLs in outdoor samples. One exception to this is Pb, which we detected in outdoor but not indoor samples. Pb can be an indicator of vehicle exhaust, but it can also be produced from coal combustion and garbage burning [49,51]. Additional monitoring over extended periods of time is needed to more fully understand indoor and outdoor pollution sources in remote Himalayan villages.
We were surprised to find that all five of our samples measured below the LDL for BC, which is typically a major constituent of wood smoke [52]. BC, and associated polycyclic aromatic hydrocarbon exposures, may be of particular interest for teahouse employees and patrons because it is associated with several cardiac and respiratory diseases, as well as lung cancer [53]. Pratali et al. (2019) reported the average BC level in homes in a Sherpa village in the Himalayas in Nepal was 4.63 µg/m3. In their study, BC levels predicted cardiovascular arterial stiffness measured as pulse wave velocity and total peripheral resistance [16]. These findings were more pronounced in study participants older than 30 years, suggesting long-term exposure to BC may cause cardiovascular damage. Black carbon is formed during the incomplete combustion of wood, often via the condensation of gases to form soot [54]. This process occurs above the flames and a possible explanation for the lack of observable BC on our sample filters could be the presence of chimneys directly above the cooking area; the BC particles could have been entrained in the plume of hot gases directly above the fire and exfiltrated the teahouse via the chimney before reaching our monitors. Additionally, we did not record the combustion conditions during sampling. It is possible that the fire was left to smolder rather than burning with hotter, open flames, which more readily produce BC. A smoldering fire would release more OC/BrC than BC. While the lack of BC on the filters was unexpected, this is a very small data set and combustion conditions were not a focal point during sampling. Additional research is needed to more readily quantify typical combustion conditions and the resulting composition of the emissions of cooking fires in Nepalese teahouses.
Although BC findings in this study were unexpected, BrC levels inside teahouses (median = 19.0 µg/m3) were similar to levels in brick workers’ homes in Bhaktapur, Nepal, where LPG cookstoves (12.03 µg/m3) and wood fires (17.52 µg/m3) are used for cooking [55]. Potential indoor sources of BrC include wood burning, tobacco smoking, and stir fry cooking [56]. Wood-burning stoves in the teahouse dining areas, and possibly stir fry cooking and smoking in the kitchens, may explain the BrC levels detected on the MicroPEM filters in our study.
Recent studies suggest that some cardiac and respiratory health outcomes from PM2.5 exposure are due to chemical constituents found in the particles, not the mass concentration alone. In addition to total mass PM2.5, the chemical constituents Ca, BC, V, and Zn were found to be associated with cardiovascular hospital admissions among people ≥ 65 years of age [22]. In the same study, Bell et al. (2014) found associations between hospital admissions for respiratory problems and increased levels of total mass PM2.5, Al, Ca, Cl, BC, Ni, Si, Ti, and V. Interestingly, the mean total mass PM2.5 concentration (44.4 µg/m3) in our study was more than three times the mean level (14.0 µg/m3) reported by Bell et al. In addition, mean levels of Al, Ca, Cl, Si, Ti, and Zn were all higher in our study than mean levels reported by Bell et al. In some cases, such as with Al, Ca, and Si, levels in our study were around an order of magnitude higher. Similarly, Ostro et al. (2009) found PM2.5 metal constituents (Cu, Fe, K, Si, and Zn) were associated with respiratory hospital admissions among children < 19 years of age [24]. In our study, all of these metals, with the exception of Cu, were found at higher levels than those reported by Ostro et al. Although we did not measure the ages of teahouse workers in this study, we did observe children working in the teahouses, as well as adults of varying ages. Our findings, although based on a limited number of samples, suggest additional research on cardiovascular and respiratory health effects among teahouse workers is warranted.

4.3. Limitations

This study was limited by a small number of samples and short duration sampling times. Thus, it is difficult to draw any generalizable conclusions about air pollution in and around teahouses in lower Himalayan villages. Due to our trekking itinerary, sampling times were limited to approximately 13.5 h in each village/teahouse, which restricted our ability to observe PM2.5 trends over a 24-h period or longer. In addition, much of the sampling period occurred during sleeping hours, and thus our findings may underestimate worker exposures. Long-term sampling across seasons may be particularly interesting to understand exposures to workers and visitors. This study was also limited to particle-phase pollutants. Understanding gas and vapor phase pollutants may shed important light on other exposures to teahouse workers and patrons. The elemental composition of PM2.5 from wood smoke will vary depending on the species of wood being burned and the burn temperature [19,20,21]. In this study, we did not determine the source or species of wood being used in teahouses, which complicates comparisons with other studies. One strength of this study is the robust analysis of PM2.5 constituents. Although the small sample size of this study did not allow for principal component analyses, it did provide confirmatory evidence of wood smoke as the primary pollution source in and around teahouses in the Annapurna Conservation Area.

5. Conclusions

Based on our brief sampling durations, it appears that indoor and outdoor PM2.5 at teahouses in Himalayan villages could exceed the 15 µg/m3 short-term (24 h) limit recommended by WHO [35]. This poses the greatest risk to teahouse workers, whose exposures may be exacerbated during trekking seasons. Analyses of particles captured on the MicroPEM filters suggest that wood smoke is a major contributor to both indoor and outdoor PM2.5. Cleaner burning fuels for cooking and heating, such as LPG, may significantly reduce PM2.5 in teahouses, which may reduce worker and patron exposures.

Supplementary Materials

The following are available online at https://www.mdpi.com/article/10.3390/atmos13071018/s1, Table S1: LDLs and summary statistics for the mean (of the sampling period) of samples inside or outside teahouses in villages along the Poon Hill circuit trek, Nepal, May 2019.

Author Contributions

Conceptualization, J.D.J., J.D.B., M.L.B.N., F.X.W. and R.T.C.; methodology, J.D.J., J.D.B., F.X.W. and R.T.C.; validation, F.X.W. and R.T.C.; formal analysis, J.D.B., F.X.W., R.T.C. and J.D.J.; investigation, J.D.J.; resources, J.D.J., F.X.W. and R.T.C.; data curation, J.D.B., F.X.W. and R.T.C.; writing—original draft preparation, M.L.B.N., J.D.J., J.D.B., F.X.W. and R.T.C.; writing—review and editing, M.L.B.N., J.D.J., J.D.B., F.X.W. and R.T.C.; supervision, J.D.J. and J.D.B.; project administration, J.D.J. All authors have read and agreed to the published version of the manuscript.

Funding

This research received no external funding.

Institutional Review Board Statement

The unit of study in this project was the teahouse, rather than individual workers or patrons; therefore, Brigham Young University’s Institutional Review Board determined this study did not meet the definition of human subject research.

Informed Consent Statement

Not applicable.

Data Availability Statement

The data presented in this study are available upon request from the corresponding author.

Acknowledgments

Our special thanks to our guide and interpreter, Jagat Lama, and to the teahouse managers for allowing us to place our instruments in their establishments, and to Teresa Gomez for her expert assistance in mapping our sampling locations.

Conflicts of Interest

The authors declare no conflict of interest.

References

  1. Health Effects Institute. Global Burden of Disease. State of Global Air 2020: A Special Report on Global Exposure to Air Pollution and Its Health Impacts. 2020. Available online: https://www.stateofglobalair.org/sites/default/files/documents/2020-10/soga-2020-report.pdf (accessed on 12 March 2022).
  2. World Health Organization. Kathmandu, Nepal. 2022. Available online: https://www.who.int/initiatives/urban-health-initiative/pilot-projects/kathmandu (accessed on 12 March 2022).
  3. Gurung, A.; Bell, M.L. The state of scientific evidence on air pollution and human health in Nepal. Environ. Res. 2013, 124, 54–64. [Google Scholar] [CrossRef]
  4. Shakya, K.M.; Rupakheti, M.; Shahi, A.; Maskey, R.; Pradhan, B.; Panday, A.; Puppala, S.P.; Lawrence, M.; Peltier, R.E. Near-road sampling of PM2.5, BC, and fine-particle chemical components in Kathmandu Valley, Nepal. Atmos. Chem. Phys. 2017, 17, 6503–6516. [Google Scholar] [CrossRef] [Green Version]
  5. Mannucci, P.M.; Harari, S.; Martinelli, I.; Franchini, M. Effects on health of air pollution: A narrative review. Intern. Emerg. Med. 2015, 10, 657–662. [Google Scholar] [CrossRef]
  6. GBD 2013 Risk Factors Collaborators; Forouzanfar, M.H.; Alexander, L.; Anderson, H.R.; Bachman, V.F.; Biryukov, S.; Brauer, M.; Burnett, R.; Casey, D.; Coates, M.M.; et al. Global, regional, and national comparative risk assessment of 79 behavioural, environmental and occupational, and metabolic risks or clusters of risks in 188 countries, 1990–2013: A systematic analysis for the Global Burden of Disease Study 2013. Lancet 2015, 386, 2287–2323. [Google Scholar]
  7. World Health Organization. WHO Global Air Quality Guidelines: Particulate Matter (PM2.5 and PM10), Ozone, Nitrogen Dioxide, Sulfur Dioxide and Carbon Monoxide. Available online: https://apps.who.int/iris/bitstream/handle/10665/345329/9789240034228-eng.pdf?sequence=1&isAllowed=y (accessed on 12 March 2022).
  8. Saud, B.; Paudel, G. The Threat of Ambient Air Pollution in Kathmandu, Nepal. J. Environ. Public Health 2018, 2018, 1504591. [Google Scholar] [CrossRef] [Green Version]
  9. Panday, A.K.; Prinn, R.G. Diurnal cycle of air pollution in the Kathmandu Valley, Nepal: Observations. J. Geophys. Res. Atmos. 2009, 114, D09305. [Google Scholar] [CrossRef]
  10. Ministry of Population and Environment, Government of Nepal. Biomass Energy Strategy 2017. 2017. Available online: https://www.aepc.gov.np/uploads/docs/2018-07-29_Biomass%20Energy%20Strategy%202073%20BS%20(2017)%20English.pdf (accessed on 12 March 2022).
  11. Awale, S. Breathing Can Kill You. Nepali Times. 2022. Available online: https://www.nepalitimes.com/banner/breathing-can-kill-you/ (accessed on 22 June 2022).
  12. Kitada, T.; Regmi, R.P. Dynamics of Air Pollution Transport in Late Wintertime over Kathmandu Valley, Nepal: As Revealed with Numerical Simulation. J. Appl. Meteorol. 2003, 42, 1770–1798. [Google Scholar] [CrossRef]
  13. Hindman, E.E.; Upadhyay, B.P. Air pollution transport in the Himalayas of Nepal and Tibet during the 1995–1996 dry season. Atmos. Environ. 2002, 36, 727–739. [Google Scholar] [CrossRef]
  14. Egger, J.; Bajrachaya, S.; Egger, U.; Heinrich, R.; Reuder, J.; Shayka, P.; Wendt, H.; Wirth, V. Diurnal Winds in the Himalayan Kali Gandaki Valley. Part I: Observations. Mon. Weather Rev. 2000, 128, 1106–1122. [Google Scholar] [CrossRef]
  15. Davidson, C.I.; Lin, S.F.; Osborn, J.F.; Pandey, M.R.; Rasmussen, R.A.; Khalil, M.A.K. Indoor and outdoor air pollution in the Himalayas. Environ. Sci. Technol. 1986, 20, 561–567. [Google Scholar] [CrossRef]
  16. Pratali, L.; Marinoni, A.; Cogo, A.; Ujka, K.; Gilardoni, S.; Bernardi, E.; Bonasoni, P.; Bruno, R.M.; Bastiani, L.; Vuillermoz, E.; et al. Indoor air pollution exposure effects on lung and cardiovascular health in the High Himalayas, Nepal: An observational study. Eur. J. Intern. Med. 2019, 61, 81–87. [Google Scholar] [CrossRef]
  17. Michael, A.S.; Smriti, D.; Sanjay, N.; Schuett, M.A.; Dahal, S.; Nepal, S. Local perspectives on benefits of an integrated conservation and development project: The Annapurna conservation area in Nepal. Int. J. Biodivers. Conserv. 2016, 8, 138–146. [Google Scholar] [CrossRef] [Green Version]
  18. World Health Organization. Household Air Pollution and Health. 2018. Available online: https://www.who.int/news-room/fact-sheets/detail/household-air-pollution-and-health (accessed on 21 May 2021).
  19. Fine, P.M.; Cass, G.R.; Simoneit, B.R.T. Chemical Characterization of Fine Particle Emissions from Fireplace Combustion of Woods Grown in the Northeastern United States. Environ. Sci. Technol. 2001, 35, 2665–2675. [Google Scholar] [CrossRef]
  20. Rau, J.A. Composition and Size Distribution of Residential Wood Smoke Particles. Aerosol Sci. Technol. 1989, 10, 181–192. [Google Scholar] [CrossRef] [Green Version]
  21. Bølling, A.K.; Pagels, J.; Yttri, K.E.; Barregard, L.; Sallsten, G.; Schwarze, P.E.; Boman, C. Health effects of residential wood smoke particles: The importance of combustion conditions and physicochemical particle properties. Part. Fibre Toxicol. 2009, 6, 29. [Google Scholar] [CrossRef] [Green Version]
  22. Bell, M.L.; Ebisu, K.; Leaderer, B.P.; Gent, J.F.; Lee, H.J.; Koutrakis, P.; Wang, Y.; Dominici, F.; Peng, R.D. Associations of PM2.5 Constituents and Sources with Hospital Admissions: Analysis of Four Counties in Connecticut and Massachusetts (USA) for Persons ≥ 65 Years of Age. Environ. Health Perspect. 2014, 122, 138–144. [Google Scholar] [CrossRef] [Green Version]
  23. Burnett, R.T.; Brook, J.; Dann, T.; Delocla, C.; Philips, O.; Cakmak, S.; Vincent, R.; Goldberg, M.S.; Krewski, D. Association between Particulate- and Gas-Phase Components of Urban Air Pollution and Daily Mortality in Eight Canadian Cities. Inhal. Toxicol. 2000, 12 (Suppl. 4), 15–39. [Google Scholar] [CrossRef]
  24. Ostro, B.; Roth, L.; Malig, B.; Marty, M. The Effects of Fine Particle Components on Respiratory Hospital Admissions in Children. Environ. Health Perspect. 2009, 117, 475–480. [Google Scholar] [CrossRef] [Green Version]
  25. Ebisu, K.; Bell, M.L. Airborne PM2.5 Chemical Components and Low Birth Weight in the Northeastern and Mid-Atlantic Regions of the United States. Environ. Health Perspect. 2012, 120, 1746–1752. [Google Scholar] [CrossRef] [Green Version]
  26. Bell, M.L.; Belanger, K.; Ebisu, K.; Gent, J.F.; Lee, H.J.; Koutrakis, P.; Leaderer, B.P. Prenatal Exposure to Fine Particulate Matter and Birth Weight: Variations by Particulate Constituents and Sources. Epidemiology 2010, 21, 884–891. [Google Scholar] [CrossRef] [Green Version]
  27. Code of Federal Regulations Title 45, Public Welfare. Protection of Human Subjects; Definitions for Purposes of This Policy. Available online: https://www.law.cornell.edu/cfr/text/45/46.102 (accessed on 22 June 2022).
  28. Johnston, J.D.; Hawks, M.E.; Johnston, H.B.; Johnson, L.A.; Beard, J.D. Comparison of Liquefied Petroleum Gas Cookstoves and Wood Cooking Fires on PM2.5 Trends in Brick Workers’ Homes in Nepal. Int. J. Environ. Res. Public Health 2020, 17, 5681. [Google Scholar] [CrossRef]
  29. Lawless, P.A.; Rodes, C.E.; Ensor, D.S. Multiwavelength absorbance of filter deposits for determination of environmental tobacco smoke and black carbon. Atmos. Environ. 2004, 38, 3373–3383. [Google Scholar] [CrossRef]
  30. Sloan, C.D.; Weber, F.; Bradshaw, R.K.; Philipp, T.J.; Barber, W.B.; Palmer, V.L.; Graul, R.J.; Tuttle, S.C.; Chartier, R.T.; Johnston, J.D. Elemental analysis of infant airborne particulate exposures. J. Expo. Sci. Environ. Epidemiol. 2017, 27, 526–534. [Google Scholar] [CrossRef]
  31. United States Environmental Protection Agency. Compendium Method IO3.3: Determination of Metals in Ambient Particulate Matter Using X-ray Fluorescence (XRF) Spectroscopy; United States Environmental Protection Agency: Washington, DC, USA, 1999. [Google Scholar]
  32. Thygerson, S.M.; Beard, J.D.; House, M.J.; Smith, R.L.; Burbidge, H.C.; Andrus, K.N.; Weber, F.X.; Chartier, R.; Johnston, J.D. Air-Quality Assessment of On-Site Brick-Kiln Worker Housing in Bhaktapur, Nepal: Chemical Speciation of Indoor and Outdoor PM2.5 Pollution. Int. J. Environ. Res. Public Health 2019, 16, 4114. [Google Scholar] [CrossRef] [Green Version]
  33. Rodes, C.E. Standard Operating Procedure MicroPEM v 3.2A [Gates Foundation Version] Aerosol Exposure SOP M-300: Setup, Preparation, Calibration, Deployment, Data Processing and Servicing; RTI International: Research Triangle Park, NC, USA, 2013; pp. 1–46. [Google Scholar]
  34. Bai, L.; He, Z.; Li, C.; Chen, Z. Investigation of yearly indoor/outdoor PM2.5 levels in the perspectives of health impacts and air pollution control: Case study in Changchun, in the northeast of China. Sustain. Cities Soc. 2020, 53, 101871. [Google Scholar] [CrossRef]
  35. World Health Organization. What Are the WHO Air Quality Guidelines? Available online: https://www.who.int/news-room/feature-stories/detail/what-are-the-who-air-quality-guidelines (accessed on 12 March 2022).
  36. Fullerton, D.G.; Bruce, N.; Gordon, S. Indoor air pollution from biomass fuel smoke is a major health concern in the developing world. Trans. R. Soc. Trop. Med. Hyg. 2008, 102, 843–851. [Google Scholar] [CrossRef] [Green Version]
  37. Zhang, J.; Smith, K.R. Household Air Pollution from Coal and Biomass Fuels in China: Measurements, Health Impacts, and Interventions. Environ. Health Perspect. 2007, 115, 848–855. [Google Scholar] [CrossRef]
  38. Kim, K.-H.; Jahan, S.A.; Kabir, E. A review of diseases associated with household air pollution due to the use of biomass fuels. J. Hazard. Mater. 2011, 192, 425–431. [Google Scholar] [CrossRef]
  39. Duo, E.; Bruno, R.M.; Basnyat, B.; Neupane, M.; Pomidori, L.; Thapa, G.B.; Pratali, L.; Cogo, A. Indoor pollution in high-altitude dwellings: An assessment of affecting factors across four Sherpa villages in the Khumbu region, Nepal. Indoor Built Environ. 2018, 27, 442–451. [Google Scholar] [CrossRef]
  40. Raatikainen, T.; Hyvärinen, A.-P.; Hatakka, J.; Panwar, T.; Hooda, R.; Sharma, V.; Lihavainen, H. The effect of boundary layer dynamics on aerosol properties at the Indo-Gangetic plains and at the foothills of the Himalayas. Atmos. Environ. 2014, 89, 548–555. [Google Scholar] [CrossRef]
  41. Khalil, M.; Rasmussen, R. Tracers of wood smoke. Atmos. Environ. 2003, 37, 1211–1222. [Google Scholar] [CrossRef]
  42. Molnár, P.; Gustafson, P.; Johannesson, S.; Boman, J.; Barregard, L.; Sällsten, G. Domestic wood burning and PM2.5 trace elements: Personal exposures, indoor and outdoor levels. Atmos. Environ. 2005, 39, 2643–2653. [Google Scholar] [CrossRef]
  43. Watson, J.G.; Chow, J.C.; Houck, J.E. PM2.5 chemical source profiles for vehicle exhaust, vegetative burning, geological material, and coal burning in Northwestern Colorado during 1995. Chemosphere 2001, 43, 1141–1151. [Google Scholar] [CrossRef]
  44. Jorquera, H.; Barraza, F.; Heyer, J.; Valdivia, G.; Schiappacasse, L.N.; Montoya, L.D. Indoor PM2.5 in an urban zone with heavy wood smoke pollution: The case of Temuco, Chile. Environ. Pollut. 2018, 236, 477–487. [Google Scholar] [CrossRef]
  45. Lind, T.; Vaimari, T.; Kauppinen, E.; Nilsson, K.; Sfiris, G.; Maenhaut, W. ASH formation mechanisms during combustion of wood in circulating fluidized beds. Proc. Combust. Inst. 2000, 28, 2287–2295. [Google Scholar] [CrossRef]
  46. Hong, N.; Zhu, P.; Liu, A.; Zhao, X.; Guan, Y. Using an innovative flag element ratio approach to tracking potential sources of heavy metals on urban road surfaces. Environ. Pollut. 2018, 243, 410–417. [Google Scholar] [CrossRef]
  47. Hjortenkrans, D.S.T.; Bergbäck, B.G.; Häggerud, A.V. Metal Emissions from Brake Linings and Tires: Case Studies of Stockholm, Sweden 1995/1998 and 2005. Environ. Sci. Technol. 2007, 41, 5224–5230. [Google Scholar] [CrossRef]
  48. Jeong, C.-H.; Wang, J.M.; Hilker, N.; Debosz, J.; Sofowote, U.; Su, Y.; Noble, M.; Healy, R.M.; Munoz, T.; Dabek-Zlotorzynska, E.; et al. Temporal and spatial variability of traffic-related PM2.5 sources: Comparison of exhaust and non-exhaust emissions. Atmos. Environ. 2019, 198, 55–69. [Google Scholar] [CrossRef]
  49. Kumari, S.; Jain, M.K.; Elumalai, S.P. Assessment of Pollution and Health Risks of Heavy Metals in Particulate Matter and Road Dust Along the Road Network of Dhanbad, India. J. Health Pollut. 2021, 11, 210305. [Google Scholar] [CrossRef]
  50. Bilos, C.; Colombo, J.; Skorupka, C.; Presa, M.R. Sources, distribution and variability of airborne trace metals in La Plata City area, Argentina. Environ. Pollut. 2000, 111, 149–158. [Google Scholar] [CrossRef]
  51. Jayarathne, T.; Stockwell, C.E.; Bhave, P.V.; Praveen, P.S.; Rathnayake, C.M.; Islam, M.R.; Panday, A.K.; Adhikari, S.; Maharjan, R.; Goetz, J.D.; et al. Nepal Ambient Monitoring and Source Testing Experiment (NAMaSTE): Emissions of particulate matter from wood-and dung-fueled cooking fires, garbage and crop residue burning, brick kilns, and other sources. Atmos. Chem. Phys. 2018, 18, 2259–2286. [Google Scholar] [CrossRef] [Green Version]
  52. LaRosa, L.E.; Buckley, T.J.; Wallace, L.A. Real-Time Indoor and Outdoor Measurements of Black Carbon in an Occupied House: An Examination of Sources. J. Air Waste Manag. Assoc. 2002, 52, 41–49. [Google Scholar] [CrossRef] [PubMed]
  53. Ali, M.U.; Siyi, L.; Yousaf, B.; Abbas, Q.; Hameed, R.; Zheng, C.; Kuang, X.; Wong, M.H. Emission sources and full spectrum of health impacts of black carbon associated polycyclic aromatic hydrocarbons (PAHs) in urban environment: A review. Crit. Rev. Environ. Sci. Technol. 2021, 51, 857–896. [Google Scholar] [CrossRef]
  54. Shrestha, G.; Traina, S.J.; Swanston, C.W. Black Carbon’s Properties and Role in the Environment: A Comprehensive Review. Sustainability 2010, 2, 294–320. [Google Scholar] [CrossRef] [Green Version]
  55. Johnston, J.; Beard, J.; Montague, E.; Sanjel, S.; Lu, J.; McBride, H.; Weber, F.; Chartier, R. Chemical Composition of PM2.5 in Wood Fire and LPG Cookstove Homes of Nepali Brick Workers. Atmosphere 2021, 12, 911. [Google Scholar] [CrossRef]
  56. Sankhyan, S.; Patel, S.; Katz, E.F.; DeCarlo, P.F.; Farmer, D.K.; Nazaroff, W.W.; Vance, M.E. Indoor black carbon and brown carbon concentrations from cooking and outdoor penetration: Insights from the HOMEChem study. Environ. Sci. Process. Impacts 2021, 23, 1476–1487. [Google Scholar] [CrossRef]
Figure 1. Trekking route starting at Naya Pol showing Ghorepani (2874 m), Tadapani (2610 m), and Landruk (1628 m) where indoor and outdoor air pollution samples were collected. Annapurna I (8091 m) and Machhapuchhare (6993 m) are shown for reference.
Atmosphere 13 01018 g001
Figure 2. Line graphs of the geometric (PM2.5) or arithmetic (relative humidity, temperature) mean (over location categories) of samples inside or outside teahouses in villages along the Poon Hill circuit trek, Nepal, May 2019: (a) PM2.5, (b) relative humidity, (c) temperature. Abbreviation: PM2.5, particulate matter with an aerodynamic diameter less than 2.5 μm.
Atmosphere 13 01018 g002aAtmosphere 13 01018 g002b
Table 1. Summary statistics for the mean (of the sampling period) of samples inside or outside teahouses in villages along the Poon Hill circuit trek, Nepal, May 2019.
Above LDL b
Variable aBelow LDL b, n (%)n (%)GMc95% CI cMin dMax d
Sampling time, minutesNA5 (100)815.37 e798.05, 832.68 e792.50827.33
PM2.5, μg/m30 (0)5 (100)44.426.1, 75.734.194.8
PM2.5 aluminum (Al), μg/m30 (0)5 (100)0.300.21, 0.440.240.50
PM2.5 barium (Ba), μg/m33 (60)2 (40)0.010 f0.0046, 0.022 f0.00150.025
PM2.5 bromine (Br), μg/m31 (20)4 (80)0.010 f0.0059, 0.019 f0.00730.020
PM2.5 brown carbon (BrC), μg/m30 (0)5 (100)14.48.5, 24.67.320.9
PM2.5 cesium (Cs), μg/m34 (80)1 (20)0.0038 f0.0012, 0.012 f0.00830.0083
PM2.5 calcium (Ca), μg/m30 (0)5 (100)0.230.15, 0.370.140.39
PM2.5 chlorine (Cl), μg/m30 (0)5 (100)0.0570.025, 0.130.0230.13
PM2.5 chromium (Cr), μg/m34 (80)1 (20)0.0019 f0.00049, 0.0075 f0.00490.0049
PM2.5 copper (Cu), μg/m34 (80)1 (20)0.0032 f0.0019, 0.0052 f0.00450.0045
PM2.5 iron (Fe), μg/m30 (0)5 (100)0.240.14, 0.410.180.48
PM2.5 lead (Pb), μg/m34 (80)1 (20)0.0068 f0.0015, 0.032 f0.0190.019
PM2.5 magnesium (Mg), μg/m30 (0)5 (100)0.0720.053, 0.0990.0530.10
PM2.5 manganese (Mn), μg/m32 (40)3 (60)0.0057 f0.0028, 0.012 f0.00690.016
PM2.5 nickel (Ni), μg/m34 (80)1 (20)0.0024 f0.0022, 0.0026 f0.00250.0025
PM2.5 phosphorus (P), μg/m32 (40)3 (60)0.0078 f0.0045, 0.014 f0.00870.014
PM2.5 potassium (K), μg/m30 (0)5 (100)0.880.46, 1.690.602.19
PM2.5 rubidium (Rb), μg/m34 (80)1 (20)0.0044 f0.0022, 0.0090 f0.00720.0072
PM2.5 silicon (Si), μg/m30 (0)5 (100)0.760.53, 1.090.621.18
PM2.5 sodium (Na), μg/m30 (0)5 (100)0.220.16, 0.300.150.29
PM2.5 sulfur (S), μg/m30 (0)5 (100)1.411.06, 1.881.071.99
PM2.5 titanium (Ti), μg/m30 (0)5 (100)0.0160.0091, 0.0290.00890.028
PM2.5 vanadium (V), μg/m33 (60)2 (40)0.0025 f0.0018, 0.0036 f0.00310.0037
PM2.5 zinc (Zn), μg/m30 (0)5 (100)0.0770.058, 0.100.0550.093
Relative humidity, %NA5 (100)55.1 e44.4, 65.8 e47.568.6
Temperature, °CNA5 (100)17.5 e10.4, 24.6 e10.725.0
Abbreviations: CI, confidence interval; GM, geometric mean; LDL, lower detection limit; Max, maximum; Min, minimum; NA, not applicable; PM2.5, particulate matter with an aerodynamic diameter less than 2.5 μm. a Twelve PM2.5 chemical components had all measurements below LDLs. The names, LDLs, and summary statistics for these PM2.5 chemical components are included in Supplementary Materials, Table S1. b LDLs are included in Supplementary Materials, Table S1. c Estimated via simple linear regression models of the natural logarithm transformed values. d Calculated from samples that had values above LDLs. e Arithmetic mean and 95% CI. f Estimated via simple Tobit regression models of the natural logarithm transformed values.
Table 2. Associations between the mean (of the sampling period) and location of samples from teahouses in villages along the Poon Hill circuit trek, Nepal, May 2019.
Variablen (%)Medianp-Value a
PM2.5, μg/m3
Indoor3 (60)41.3
Outdoor2 (40)34.70.22
PM2.5 aluminum (Al), μg/m3
Indoor3 (60)0.30
Outdoor2 (40)0.260.44
PM2.5 brown carbon (BrC), μg/m3
Indoor3 (60)19.0
Outdoor2 (40)9.80.22
PM2.5 calcium (Ca), μg/m3
Indoor3 (60)0.27
Outdoor2 (40)0.180.44
PM2.5 chlorine (Cl), μg/m3
Indoor3 (60)0.081
Outdoor2 (40)0.0320.22
PM2.5 iron (Fe), μg/m3
Indoor3 (60)0.28
Outdoor2 (40)0.190.79
PM2.5 magnesium (Mg), μg/m3
Indoor3 (60)0.081
Outdoor2 (40)0.0590.22
PM2.5 potassium (K), μg/m3
Indoor3 (60)0.85
Outdoor2 (40)0.690.79
PM2.5 silicon (Si), μg/m3
Indoor3 (60)0.87
Outdoor2 (40)0.630.79
PM2.5 sodium (Na), μg/m3
Indoor3 (60)0.28
Outdoor2 (40)0.210.79
PM2.5 sulfur (S), μg/m3
Indoor3 (60)1.49
Outdoor2 (40)1.330.79
PM2.5 titanium (Ti), μg/m3
Indoor3 (60)0.022
Outdoor2 (40)0.0130.44
PM2.5 zinc (Zn), μg/m3
Indoor3 (60)0.091
Outdoor2 (40)0.0770.79
Relative humidity, %
Indoor3 (60)47.9
Outdoor2 (40)63.00.22
Temperature, °C
Indoor3 (60)19.9
Outdoor2 (40)11.80.22
Abbreviations: LDL, lower detection limit; PM2.5, particulate matter with an aerodynamic diameter less than 2.5 μm. a Estimated via the two-sample Wilcoxon signed-rank test (t approximation) of the original values.
Table 3. Associations between having mean (of the sampling period) measurements above LDLs and location of samples from teahouses in villages along the Poon Hill circuit trek, Nepal, May 2019.
VariableBelow LDL, n (%)Above LDL, n (%)Exact OR aExact 95% CI aExact p-Value a
PM2.5 barium (Ba)
Indoor2 (67)1 (50)1.00Reference
Outdoor1 (33)1 (50)1.730.01, 234.501.00
PM2.5 bromine (Br)
Indoor1 (100)2 (50)1.00Reference
Outdoor0 (0)2 (50)0.67 b0.04, Infinity1.00
PM2.5 cesium (Cs)
Indoor2 (50)1 (100)1.00Reference
Outdoor2 (50)0 (0)1.50 b0.00, 28.501.00
PM2.5 chromium (Cr)
Indoor2 (50)1 (100)1.00Reference
Outdoor2 (50)0 (0)1.50 b0.00, 28.501.00
PM2.5 copper (Cu)
Indoor2 (50)1 (100)1.00Reference
Outdoor2 (50)0 (0)1.50 b0.00, 28.501.00
PM2.5 lead (Pb)
Indoor3 (75)0 (0)1.00Reference
Outdoor1 (25)1 (100)1.50 b0.08, Infinity0.80
PM2.5 manganese (Mn)
Indoor1 (50)2 (67)1.00Reference
Outdoor1 (50)1 (33)0.58<0.01, 78.171.00
PM2.5 nickel (Ni)
Indoor2 (50)1 (100)1.00Reference
Outdoor2 (50)0 (0)1.50 b0.00, 28.501.00
PM2.5 phosphorus (P)
Indoor0 (0)3 (100)1.00Reference
Outdoor2 (100)0 (0)0.16 b0.00, 1.710.20
PM2.5 rubidium (Rb)
Indoor2 (50)1 (100)1.00Reference
Outdoor2 (50)0 (0)1.50 b0.00, 28.501.00
PM2.5 vanadium (V)
Indoor1 (33)2 (100)1.00Reference
Outdoor2 (67)0 (0)0.46 b0.00, 5.120.60
Abbreviations: CI, confidence interval; LDL, lower detection limit; OR, odds ratio; PM2.5, particulate matter with an aerodynamic diameter less than 2.5 μm. a Estimated via simple exact unconditional logistic regression models that model the probability of mean (of the sampling period) measurements above the LDL. b Median unbiased estimate.
Publisher’s Note: MDPI stays neutral with regard to jurisdictional claims in published maps and institutional affiliations.

