Abstract
We present the development of a physically-based dust source map for the GOCART-AFWA dust module in WRF-Chem model. The new parameterization is based on MODIS-NDVI and an updated emission strength map is computed every 15 days from the latest satellite observations. Modeling simulations for the period April–May 2017 over the Mediterranean, north Africa, and the Middle East are compared with observations of AOD at 31 AERONET stations. The new module is capable of reproducing the dust sources at finer detail. The overall performance of the model is improved, especially for stronger dust episodes with AOD > 0.25. For this threshold the model BIAS decreases from −0.20 to −0.02, the RMSE from 0.38 to 0.30, the Correlation Coefficient improves from 0.21 to 0.47, the fractional gross error (FGE) from 0.62 to 0.40, and the mean fractional bias (MFB) from −0.49 to −0.08. Similar improvement is also found for the lower AOD thresholds (>0.0 and >0.1), especially for the stations in Europe, the Mediterranean, Sahel, the Middle East, and Arabian Peninsula, which are mostly affected by dust transport during the experimental period. An overprediction of AOD, compared to the original dust-source scheme, is found for some stations in the Sahara desert, the Atlantic Ocean, and the Iberian Peninsula. In total, 124 out of the 170 statistical scores that are calculated indicate improvement of model performance.
1. Introduction
Desert dust is considered as a key climate factor, interacting directly and indirectly with the natural and human environment from regional to global scales, and the importance of these interactions has been underlined in all contemporary studies e.g. [1]. At any given time, a staggering amount of about twenty million metric tons of mineral dust aerosols are suspended in the atmosphere, injected by the wind erosion of dry soils into the system [2], most of which originate from the Sahara. Dust affects radiation [3,4] and alters liquid and ice cloud properties as well as precipitation processes [5,6,7] and atmospheric water content [8]. Once dust particles are deposited on the earth’s surface, aerosols provide micronutrients to the ocean or to land ecosystems [9,10], affecting fishery and local agriculture activities. Additionally, under favorable conditions, the smaller PM2.5 particles can be easily inhaled and deposited on the lungs and are related to human health disorders [11,12]. All the aforementioned impacts of desert dust are strongly dependent on the chemical composition of the particles which in turn is a function of the soil mineralogy at the desert sources. For example, iron and phosphorus deposition modulates ocean biogeochemistry, and can be just as important as changes in climate as they can impact ocean productivity [13]. For instance, the amount of iron alters the dust absorption properties, affecting direct radiative interactions in the atmosphere and dust climate impacts [14].
For the reasons stated above, mineral dust and the associated uncertainties in climate projections are key topics for the highly polluted area of the Mediterranean (especially the Eastern part), where the largest climate change effects are expected during the upcoming decades [15]. This area is mostly affected by dust particles originating from the Saharan desert, which acts as the major source of atmospheric dust on Earth [16]. Dust sources are commonly identified as topographic depressions containing dry lake deposits and playas in extremely arid regions, based on qualitative analysis of remote sensing [17,18]. In order to represent the dust lifecycle in the atmosphere and accurately quantify the links and feedbacks of natural aerosols, the first step is to properly define dust sources in Numerical Weather Prediction (NWP) models (regional, general circulation, and climate models).
Common practice in modeling dust sources and emission strength is by using global static datasets, like the 24 category U.S. Geological Survey (USGS) land use/cover system [19] used by the SKIRON/Dust regional model [20], the 21-category MODIS (Moderate Resolution Imaging Spectroradiometer), and 30-arc-second USGS GMTED2010 data used in a default WRF (Weather Research and Forecasting Model) configuration [21,22], the Laboratoire Interuniversitaire des Systèmes Atmosphériques (LISA) database, which gives information on the Sahara/Middle East sources and the Asian deserts and is used by the CHIMERE-DUST air quality model [23,24,25], the LEAF soil and vegetation sub-model of the RAMS/ICLAMS system (Integrated Community Limited Area Modeling System based on the Regional Atmospheric Modeling System) [6,26], and others. All these datasets benefit from global coverage and relative simplicity in using them. However, an important shortcoming is that dust source emission strength is not constant in nature. Mineral dust emissions from the Sahara are highly sensitive to changes in the regional hydroclimate and land surface. Wetter conditions and more vegetation limit the emissions, while drier conditions and reduced vegetation increase dust production [27]. Such time-variant modifications cannot be represented in static and often outdated datasets, which do not contain these recent land-use changes. In addition to a successful representation of dust sources in NWP models, methods to localize these important features on larger scales are also required [28].
To overcome these limitations, several new studies have proposed the use of remote sensing in order to define the variability of soil properties and subsequently the emission strength of the dust sources: [29] used a combination of monthly of MODIS land data, wind speed, soil moisture, and absolute air humidity data from GLDAS (Global Land Data Assimilation System) [30] and monthly Tropical Rainfall Measuring Mission (TRMM) precipitation to define areas susceptible to dust storm formation. In [31], the Normalized Difference Vegetation Index (NDVI) was used to identify the seasonal dust sources that caused the severe Phoenix haboob of July 2011 in the US., In [28], the EUMETSATs (European Organisation for the Exploitation of Meteorological Satellites) Desert-Dust-RGB product along with Sentinel-2 data and MODIS NDVI were used to determinate dust activity and dust Hot-Spots. The Enhanced Vegetation Index (EVI) of MODIS has been also used for the development of the Global Sand and Dust Storms Source Base Map (G-SDS-SBM) by the United Nations Convention to Combat Desertification (UNCCD) in collaboration with the United Nations Environment Program (UNEP) and the World Meteorological Organization (WMO) [32,33]. In [34], the NDVI was used to assess the respective roles of wind and vegetation on dust emission during the wet season in the Sahel. In [35], the MODIS NDVI was used to represent land-use changes due to the war in Syria and describe their contribution to the extreme convectively driven dust-storm of September 2015. In [36], a novel methodology has been proposed, in which a dynamic dust source map NDVI was created for the NMME-DREAM (Nonhydrostatic Mesoscale Model-Dust Regional Atmospheric Model) model and applied over the Arabian Peninsula.
In this work, we extend the methodology of [36] to cover the Saharan Desert, using the WRF-Chem regional modeling system [21,22]. The newly developed system, dubbed WRF-NDVI, is applied over a large area covering Africa, the Mediterranean, the Middle East, and Europe during a highly active dust period (March to May 2017) and the results are evaluated using the Aerosol Optical Depth (AOD) measurements from the AERONET project (AErosol RObotic NETwork) [37,38]. The manuscript is further organized as follows: Section 2 provides a description of the datasets and models used, as well as an overview of the statistical metrics. In Section 3, the results of the simulations and the statistical evaluation are presented, and Section 4 contains a summary and conclusions of the study.
2. Experimental Design
2.1. NDVI Datasets
The NDVI is an indicator of the greenness of the biomass. Even though it is not a physical property of the vegetation cover, it is a simple formulation and is widely used for ecosystems and land use change monitoring [39]. NDVI is calculated as the normalized difference of reflectance in the red and near-infrared channels [40,41] i.e.,
where is the reflectance in the near infrared channel and is the reflectance in the red channel. NDVI values range from −1.0 to 1.0. Areas of barren rock, sand, or snow usually show very low NDVI values (0.1 or less) [41] and can be used to define barren areas, potentially acting as dust sources. Sparse vegetation, such as shrubs and grasslands or senescing crops, may result in moderate NDVI values (0.2 to 0.5). High NDVI values (approximately 0.6 to 0.9) correspond to dense vegetation, such as that found in temperate and tropical forests or crops at their peak growth stage. Since it is expressed as a ratio, the NDVI minimizes certain types of band-correlated noise (positively-correlated) and influences attributed to variations in irradiance, clouds, atmospheric attenuation, and other parameters [42]. In this work, we use the 1000 m × 1000 m 16 day averaged NDVI from MODIS/Terra instrument [43] to calculate high-resolution barren soil, as described in the next section.
2.2. The WRF-Chem Model
The numerical model used in this work is the Advanced Research Weather version of the Weather Research and Forecasting (WRF-ARW) ver4.2 model [21], coupled with the Chem sub-model [22]. For the description of the desert dust cycle, we use the Georgia Institute of Technology-Goddard Global Ozone Chemistry Aerosol Radiation and Transport (GOCART) aerosol submodel [44] with the Air Force Weather Agency (AFWA) dust emission scheme [45]. WRF-Chem is suitable for use in a broad range of applications, across scales ranging from meters to thousands of kilometers. Since the cycle of dust in the atmosphere is also governed by multiple scale processes (e.g., synoptic forcing, mesoscale systems, low level jets, convection, radiative transfer, cloud microphysics), this model is very appropriate as a basic tool for dust research. The ARW solver includes several key features, such as: fully compressible non-hydrostatic equations with hydrostatic option, two-way nesting with multiple nests and nest levels, monotonic transport and positive-definite advection option for moisture, scalar, tracer, and turbulent kinetic energy, full physics options for land-surface, planetary boundary layer, atmospheric and surface radiation, microphysics and cumulus convection, orographic gravity wave drag, stochastic kinetic-energy backscatter scheme, and more [21].
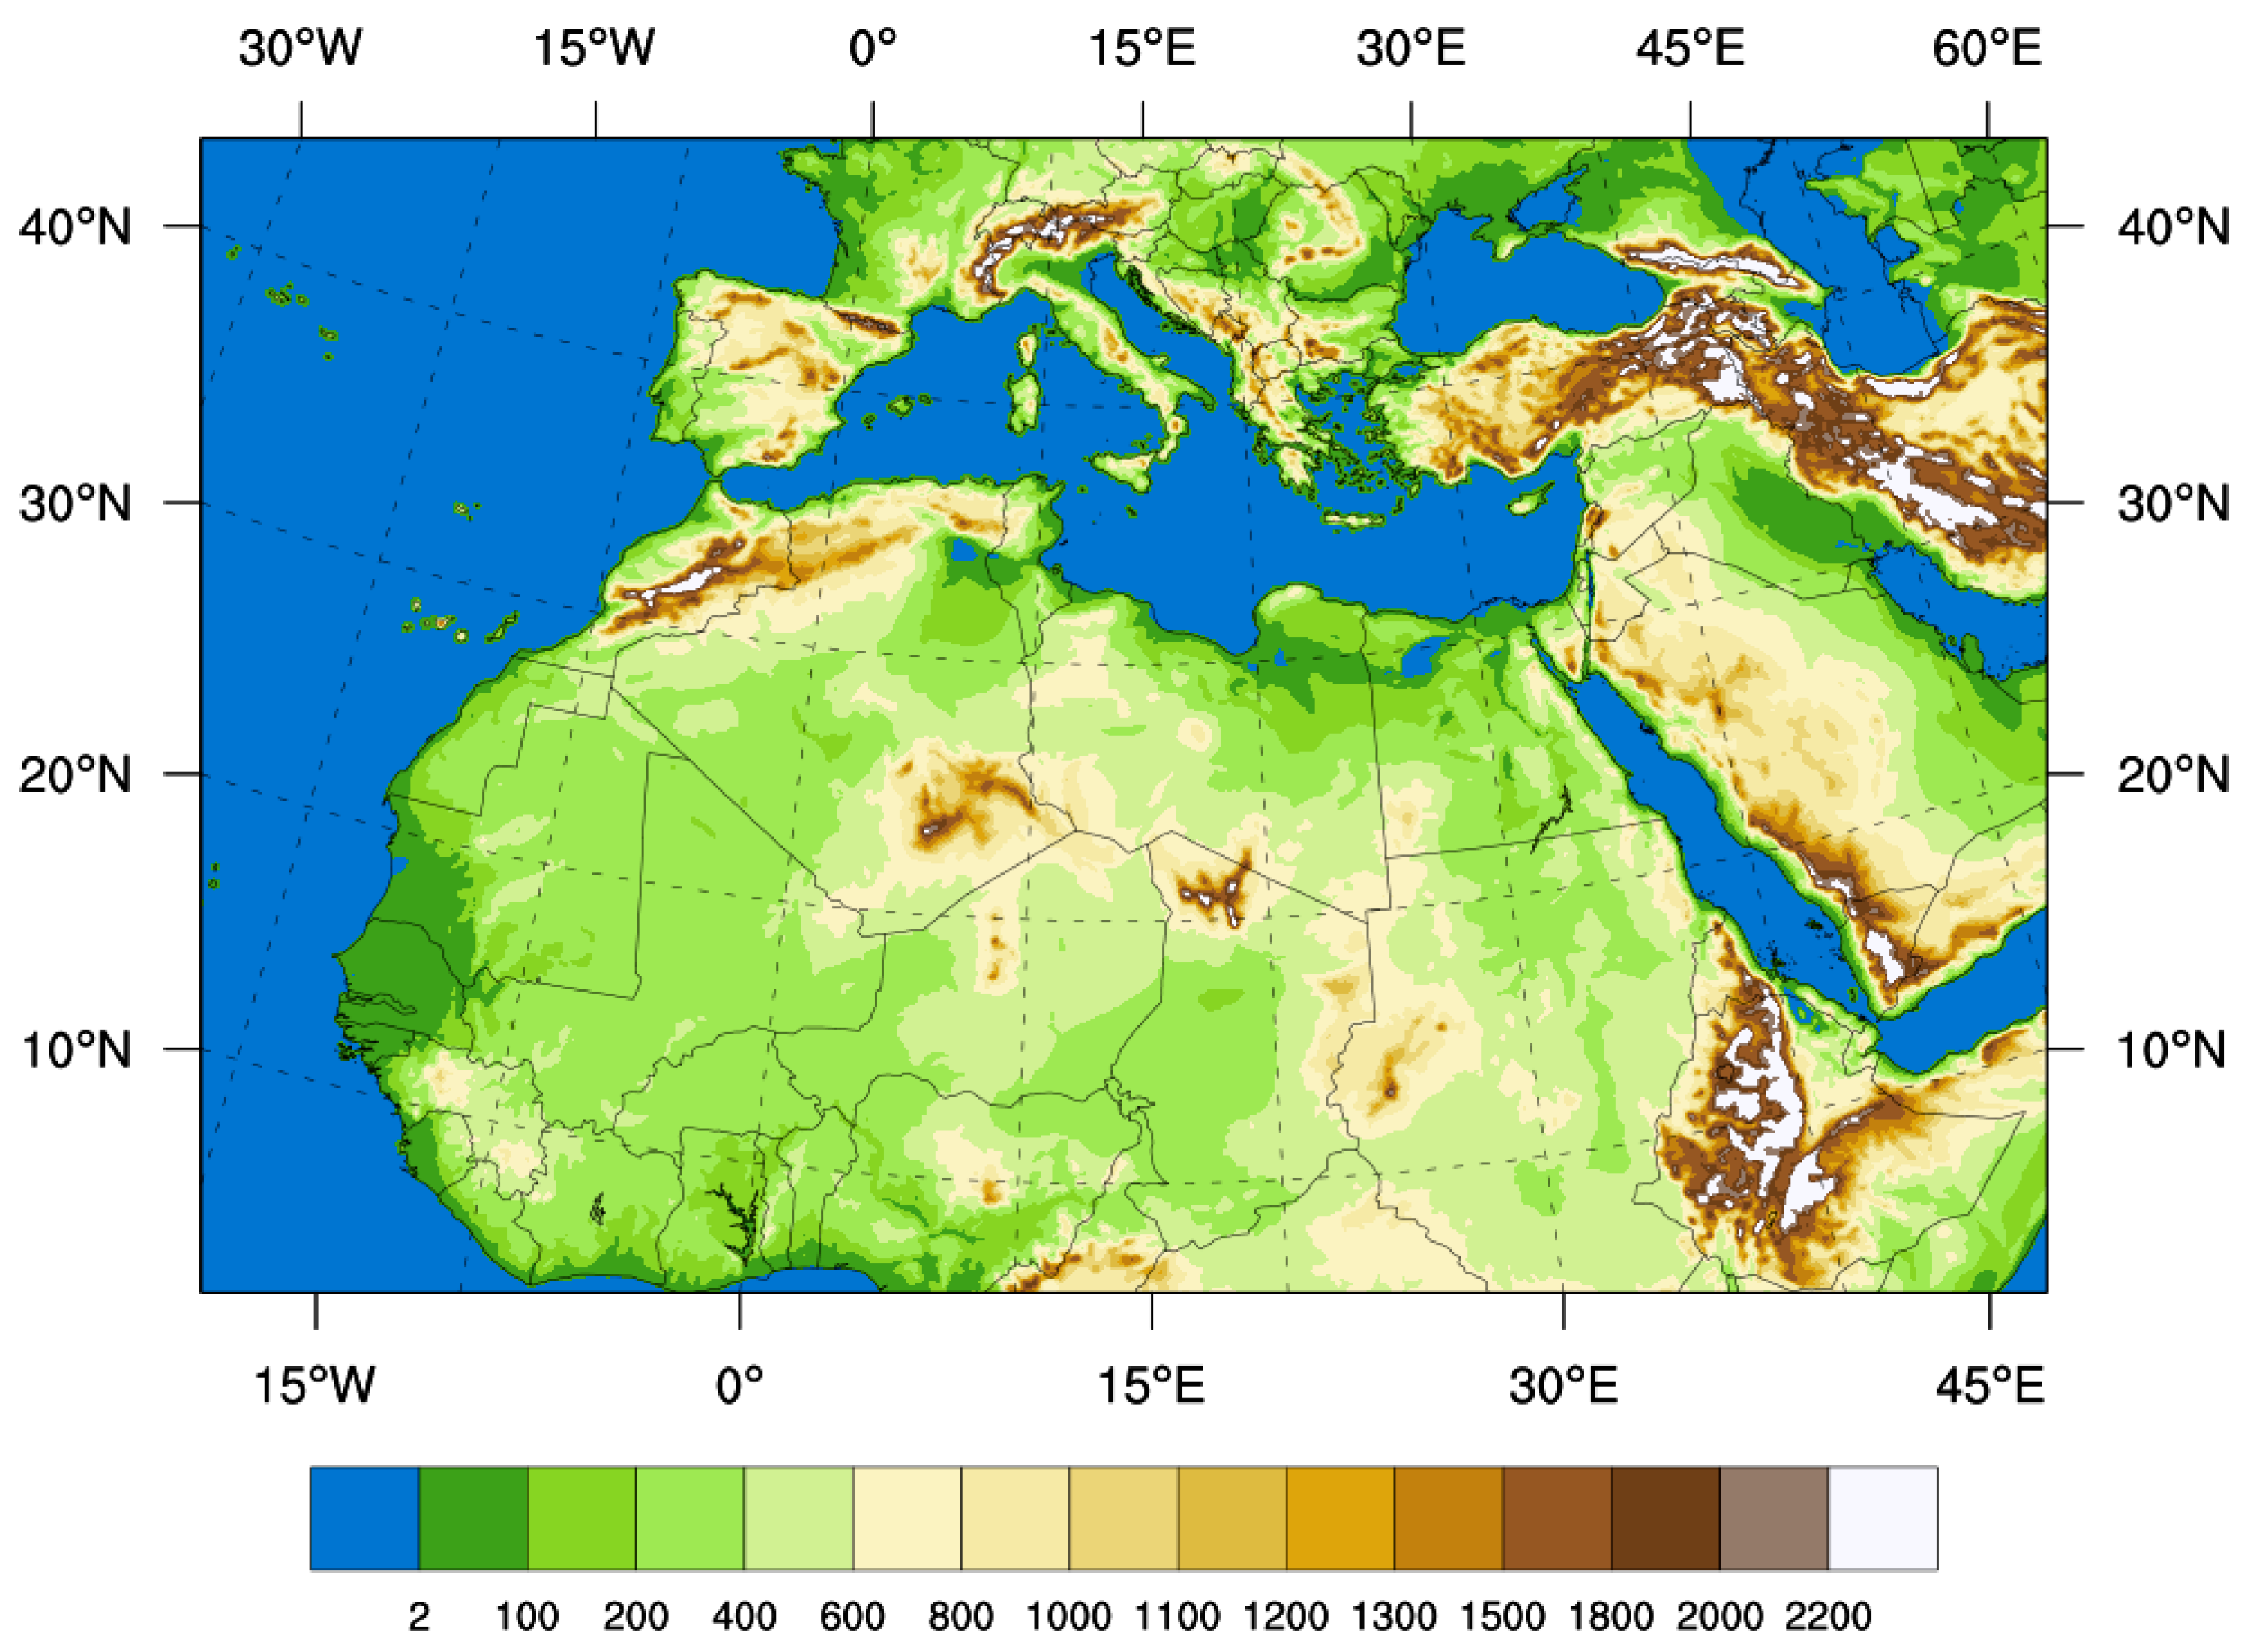
The computational domain is presented in Figure 1 and includes the entire Sahara Desert, the arid areas of the Middle East and Arabian Peninsula, the Mediterranean, and most of Europe. The model resolution is set at 12 km × 12 km and on the vertical 38 levels are used, stretching from the surface to the top of the atmosphere at 50 hPa. The selected meso-γ grid space is appropriate for resolving the long range transport of desert dust from Sahara towards the Mediterranean and it is similar to the configuration used in earlier studies such as [8,46]. The physical parameterizations chosen for the model setup are described in Table 1 and presented in detail in [21,22]. The 6-hour initial and boundary conditions for the simulations are taken from the NCEP FNL (National Centers for Environmental Prediction Final Analysis) operational global analysis on a 0.25° × 0.25° grid. This product is from the Global Data Assimilation System (GDAS), which continuously collects observational data to create analyses [47].

Figure 1.
WRF-Chem computational domain used in the study. The topography (in meters) is also depicted.

Table 1.
Physical parameterizations used in this work.
As described in [45], the AFWA scheme for dust emissions uses a source strength function to define soil erodibility, which is fixed to a constant mix of sand, silt, and clay, and is interpolated to the host model grid. This source emission strength is determined based on the degree of topographic relief surrounding a model grid cell, which is provided at 0.25° × 0.25° resolution. Even though this approach provides a reliable methodology to calculate dust fluxes, this dataset remains constant in time and thus it is not possible to represent any temporal changes in land use.
To overcome the above shortcomings, we propose a methodology to incorporate the observational NDVI data in WRF-Chem, considering that areas with NDVI less than 0.1 denote bare soil and thus can be assumed as active and efficient dust sources [35,36]. Even though NDVI < 0.15 is generally assumed to define bare soil [56], a smaller threshold of NDVI < 0.1 is chosen here for the extremely bare Sahara Desert, following the results of [36]. To redefine the dust source strength in the model, we use the fine resolution NDVI dataset (1000 m × 1000 m) for scaling the soil erodibility factor from 0 to 1. The 1000 m resolution dataset of NDVI provides a computationally efficient way to represent the vegetation conditions at adequate detail over the vast modeling domain. Similar to [36], we define the grid points with NDVI < 0.1 as active dust-points. For these active dust-points, the new erodibility factor is calculated as: and ranges from 0 to 1. In areas with NDVI > 0.1, the original erodibility () is used unmodified. This way, the model erodibility is adjusted depending on the changes in NDVI, which in turn reflects the changes in land-use, vegetation, etc. As a result, all the physical processes used by the AFWA dust production scheme are retained and the soil erodibility is nudged closer to the satellite observations. Additionally, since the NDVI dataset is updated every 16 days, the dust source strength is redefined accordingly. The result is a more detailed, high-resolution, and dynamic map of dust source strength. A comparison between the original and the new erodibility factors is presented in Figure 2 for both simulation periods (1–16 April 2017 and 15–31 May 2017). The difference in erodibility factor between those two periods is also shown to highlight the dynamic nature of the proposed methodology.
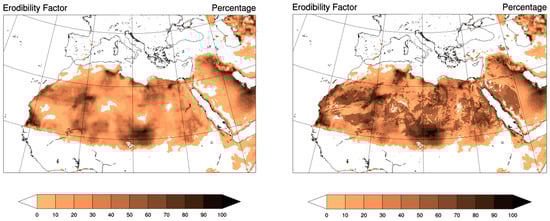
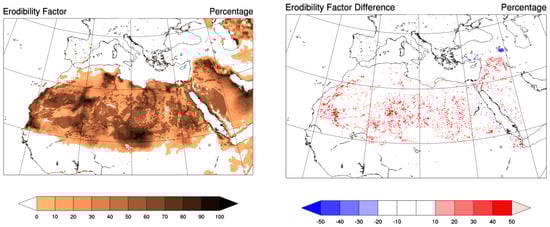
Figure 2.
Erodibility factor (%) for the original WRF-Chem setup (top left) and the updated erodibility based on NDVI for the period 1–16 of April (top right). Additionally, the updated erodibility based on NDVI for the period 17–31 of May is presented (bottom left). The difference in erodibility between 1–16 of April and 17–31 of May is shown in the (bottom right) plot. All the maps are at 12 km × 12 km resolution.
In order to test the validity of the developed methodology we performed two simulations: (1) using the static [45] dust source database (WRF-CTRL) and (2) using the updated dataset by scaling the erodibility using the NDVI datasets (WRF-NDVI). The simulation period for both runs lasts from March 2017 to May 2017, which is a very active transitional period where dust plumes generated in the Sahara are transported across the Mediterranean towards Europe. Transport of Saharan dust towards the South is also evident in this period [57,58]. The erodibility factor is modified every 16 simulation days based on the corresponding NDVI dataset. The two simulations are evaluated against AERONET data for the period 1 April 2017 to 31 May 2017. The runs start on 15 March to allow for a 15 day model spin-up period.
2.3. AERONET Data and Evaluation Metrics
AERONET is a vast network of autonomously operated Cimel Electronique Sun–sky photometers, which are used to measure Sun-collimated direct beam irradiance and directional sky radiance and provide scientific-quality column-integrated aerosol properties of AOD and aerosol microphysical and radiative properties [37,38]. Level 2.0 datasets were retrieved for all AERONET stations (using the Version 3 algorithm). For cases where AOD data is not available at 550 nm, values are estimated following [20]. First, we calculate the Ångström exponent, which is derived from the ratio between the AOD of two adjacent wavelengths:
where and are two adjacent wavelengths with available data, and then we interpolate at 550 nm using the formula described in [59]. This step is skipped for stations that provide AOD values directly at 550 nm. The model retrievals are also interpolated in time to match the AERONET measurement time, considering only dust-relevant measurements with an Ångström coefficient less than 0.6 [37]. The AERONET measurements are compared with WRF-Chem AOD at 550 nm to create statistical indexes based on [60]. The chosen indexes include the mean bias (BIAS), root mean square error (RMSE), correlation coefficient (CORR), mean fractional bias (MFB), and fractional gross error (FGE). These indexes are defined as follows, assuming the observations and the model results, for number of pairs:
In total, 34 AERONET stations with available Level 2.0 data are used in our study, as shown in Figure 3. In order to investigate the sensitivity of the new methodology to the severity of the dust events, we assume three AOD limits for the AERONET data: (1) AOD > 0.0, (2) AOD > 0.1, and (3) AOD > 0.25. The AOD > 0.0 limit provides a means to compare with all available data from all stations. The limit, if AOD > 0.1 is appropriate for defining dust transport towards Europe [61] and AOD > 0.25, implies dust episodes.
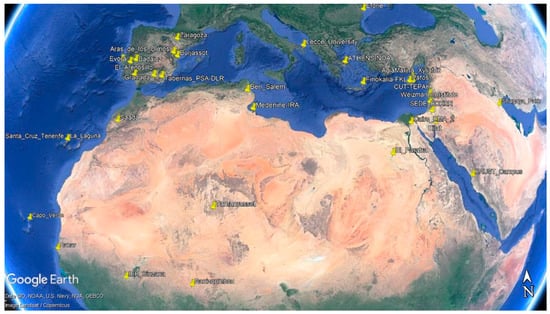
Figure 3.
Positions of the 34 AERONET stations used for this study.
3. Results
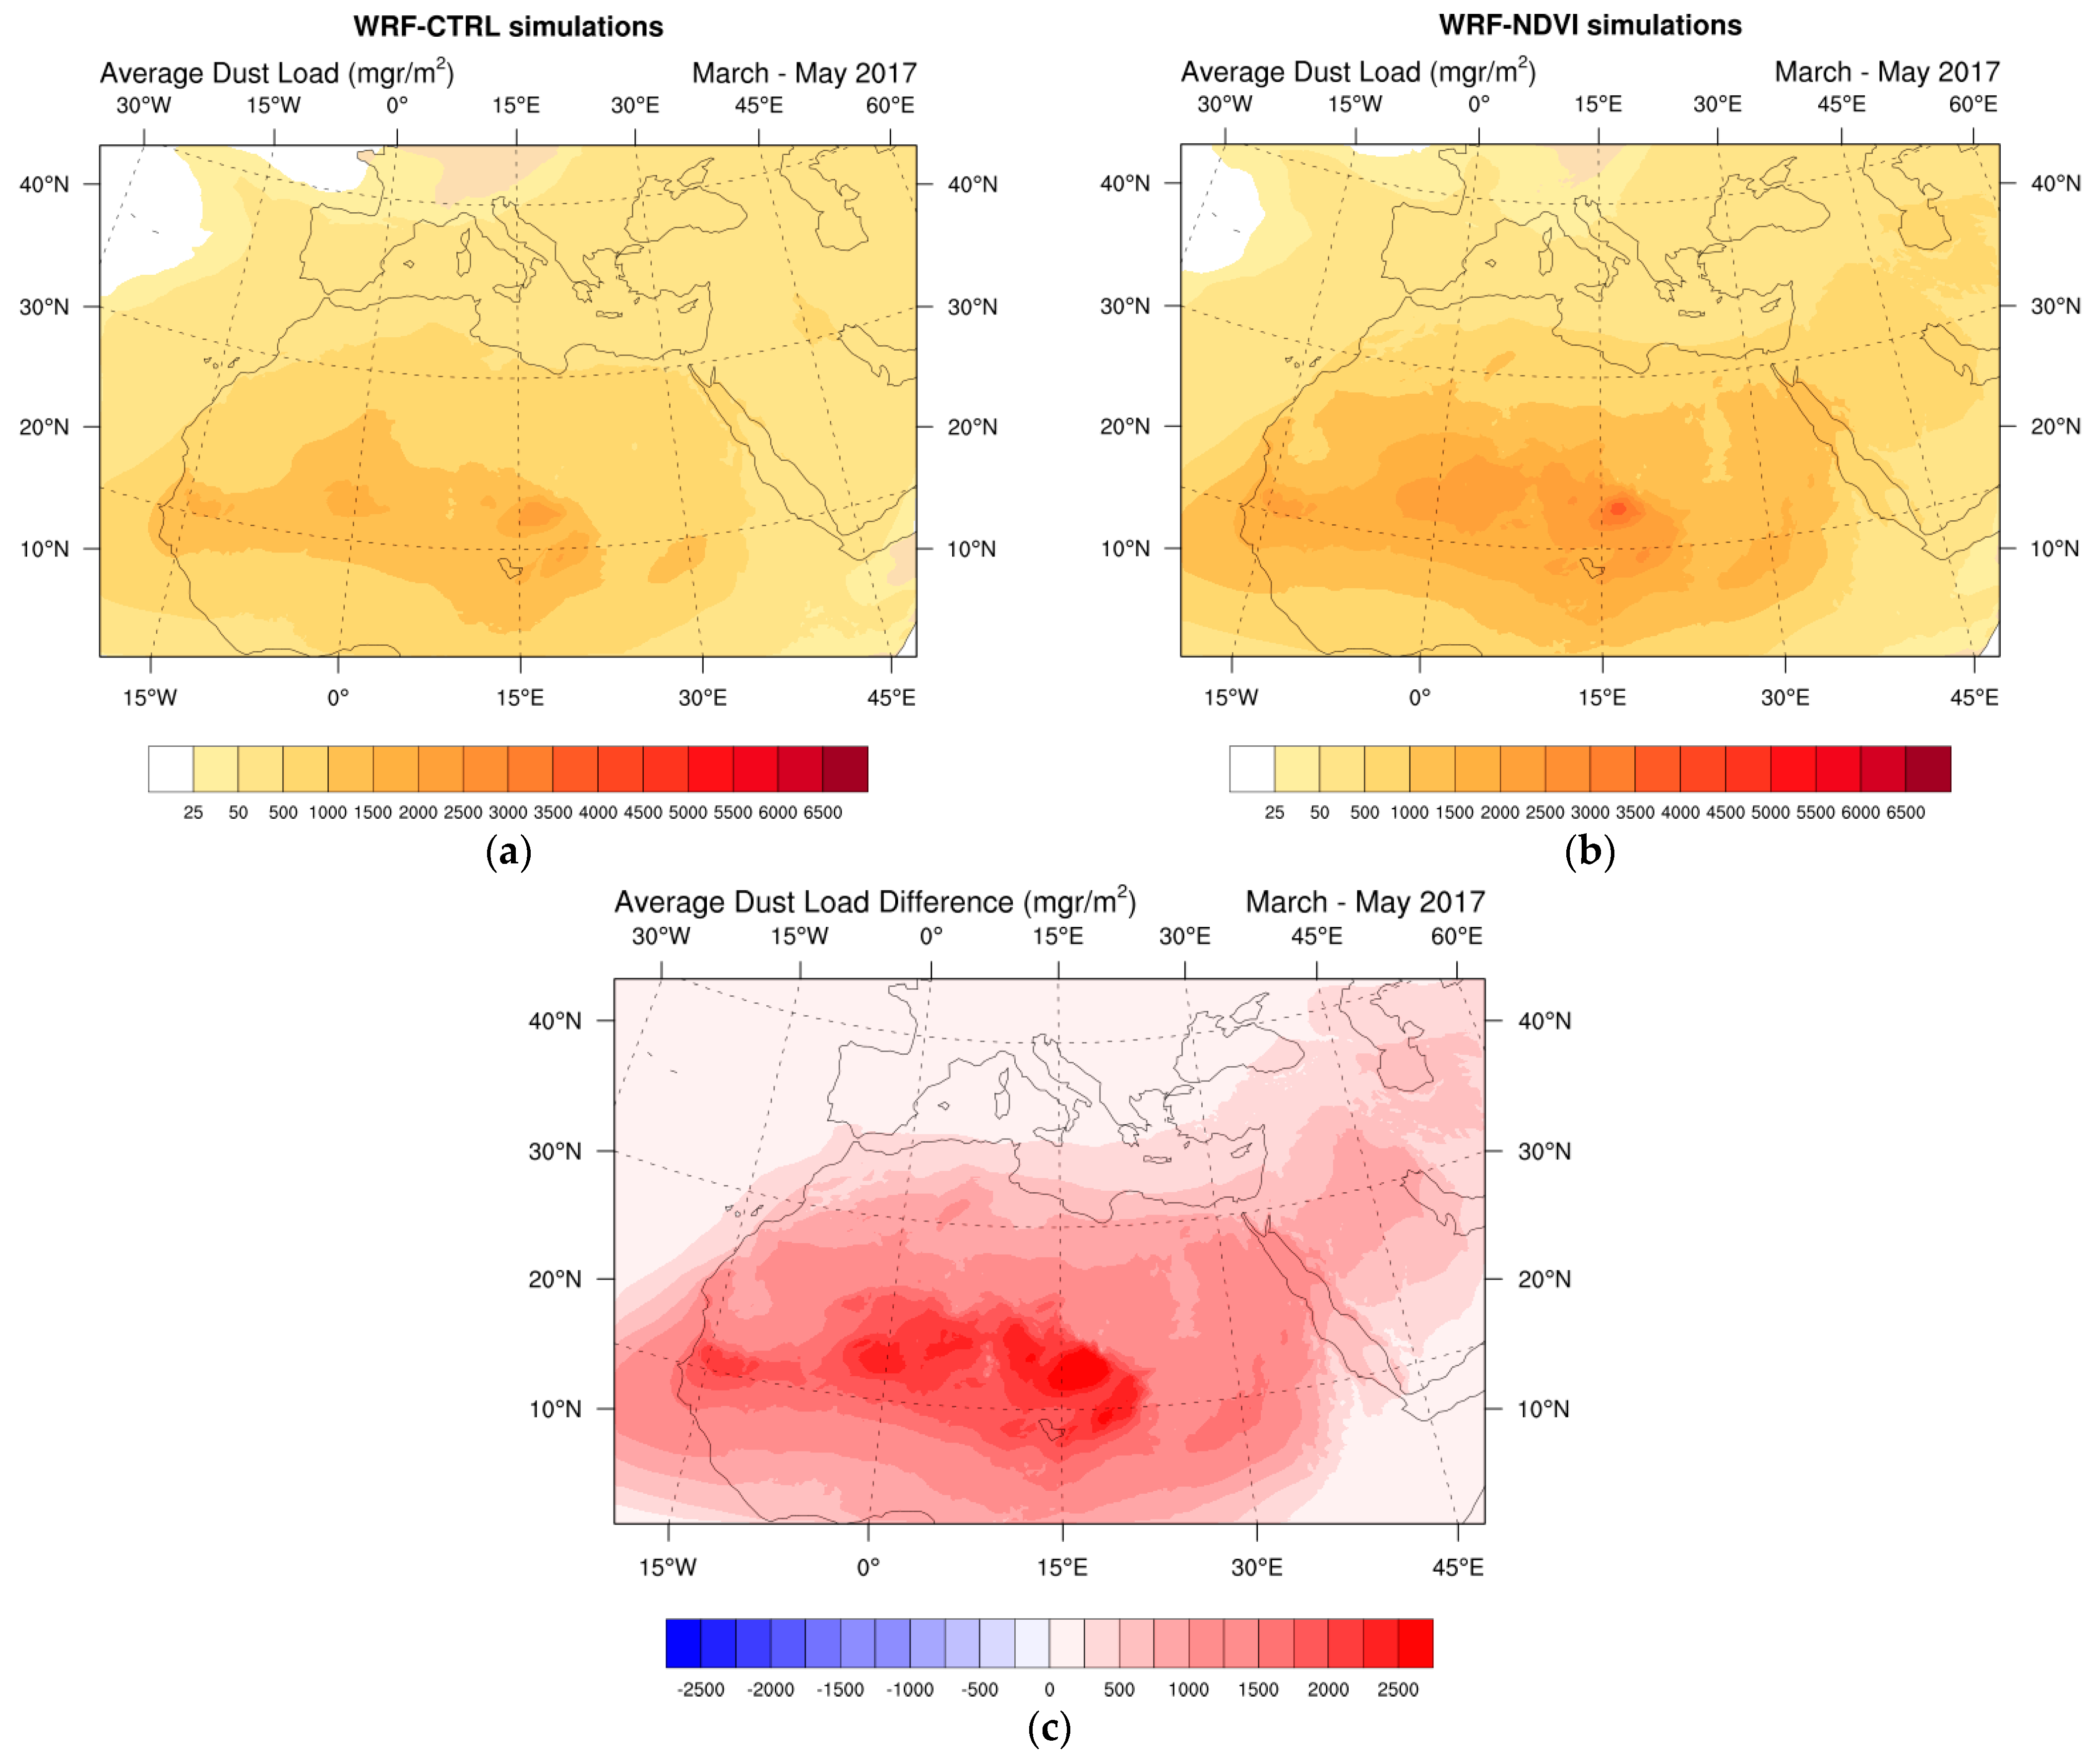
First, we calculate the daily average dust load for the entire simulation period (March 2017 to May 2017) for both WRF-NDVI (Figure 4a) and WRF-CTRL (Figure 4b) runs. The differences between the two simulations are presented in Figure 4c. It becomes apparent that in WRF-NDVI the amount of airborne dust is increased for the entire computational domain, especially near the dust source areas, but also in remote regions as well (the Mediterranean, Europe, and the Middle East). This is a first indication of overall improvement, since the numerical dust models are in general reported to underestimate the aerosol concentrations in the atmospheric column i.e., [20,62] and others).
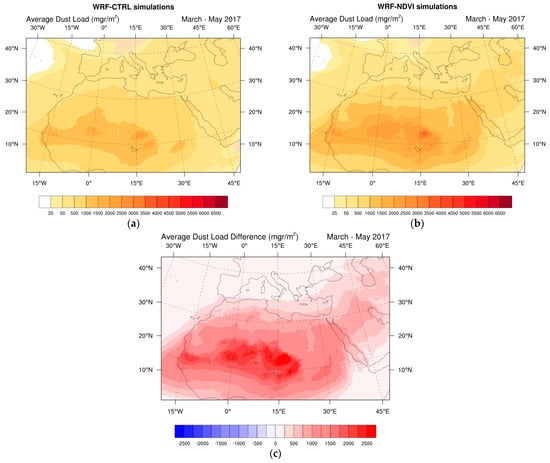
Figure 4.
Average dust load in mgr/m2 for (a) the WRF-CTRL simulations, (b) the WRF-NDVI simulations and (c) their difference.
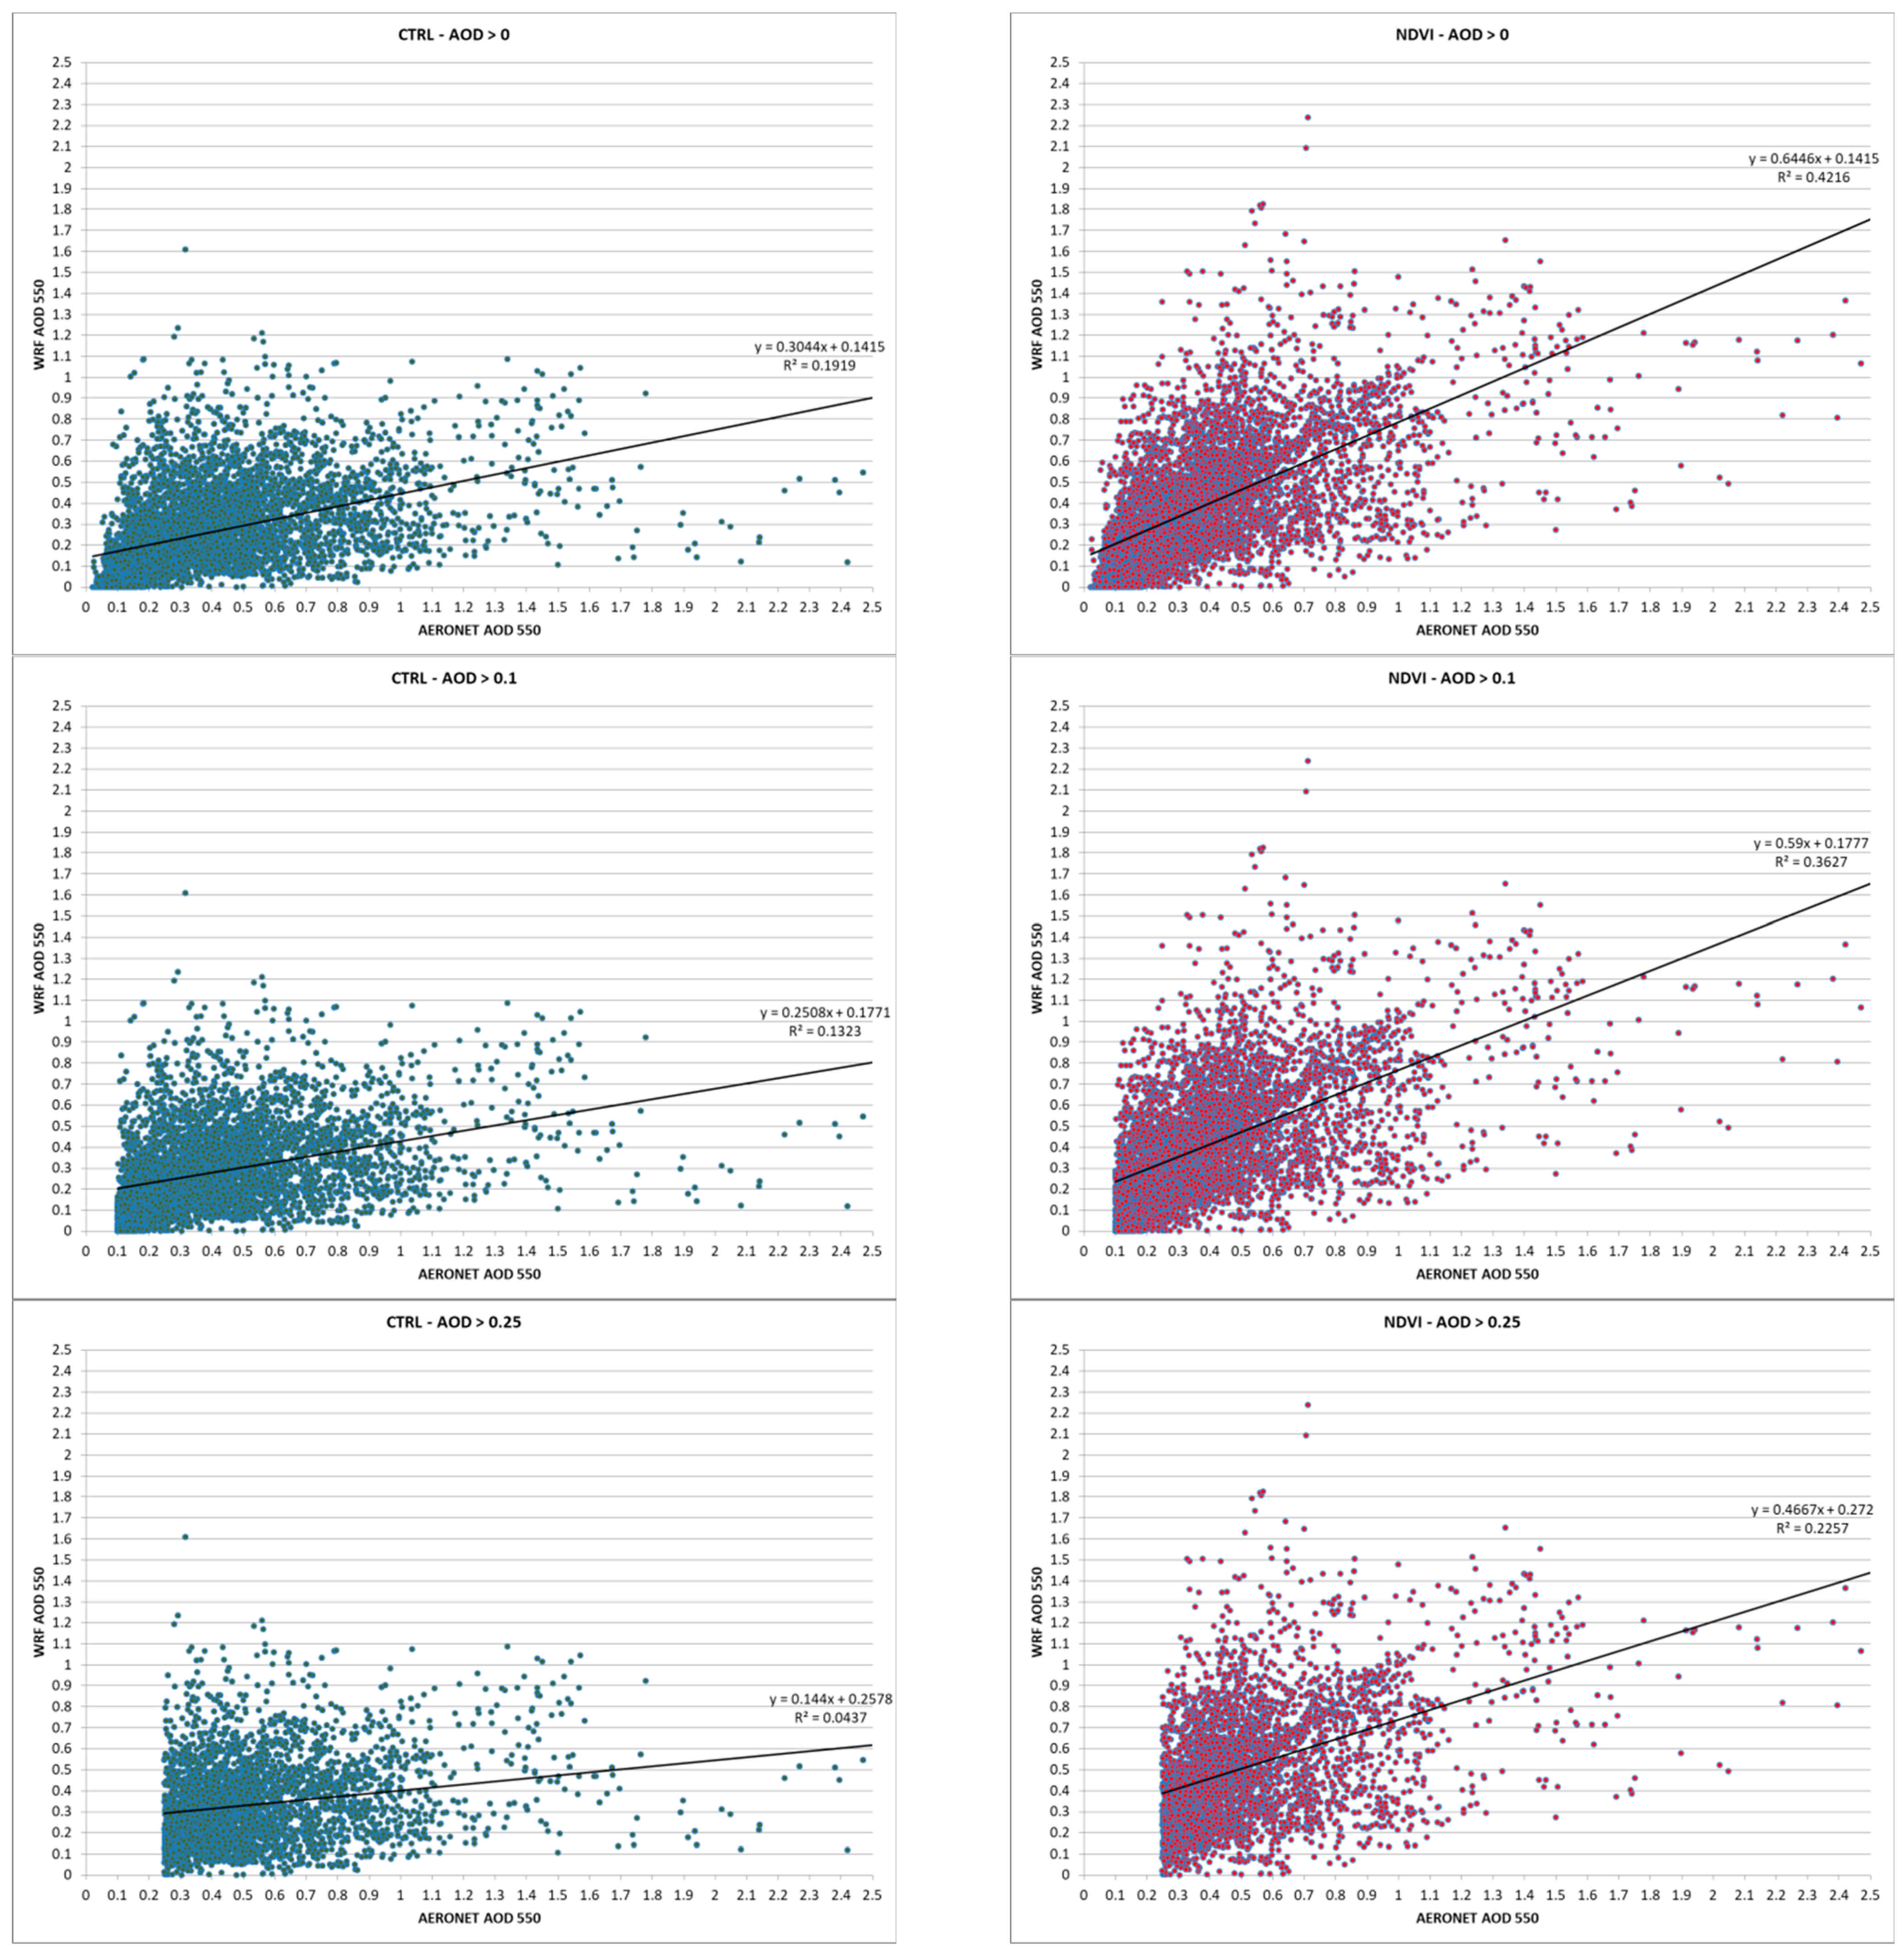
The comparison between modeled and station AOD for the entire dataset (all the stations) is shown on Figure 5 for both simulations (WRF-CTRL and WRF-NDVI). As discussed, in Section 2.3 we create scatterplots for (1) AOD > 0.0, (2) AOD > 0.1, and (3) AOD > 0.25. The corresponding scatterplots, along with their trend lines, are presented in Figure 5.
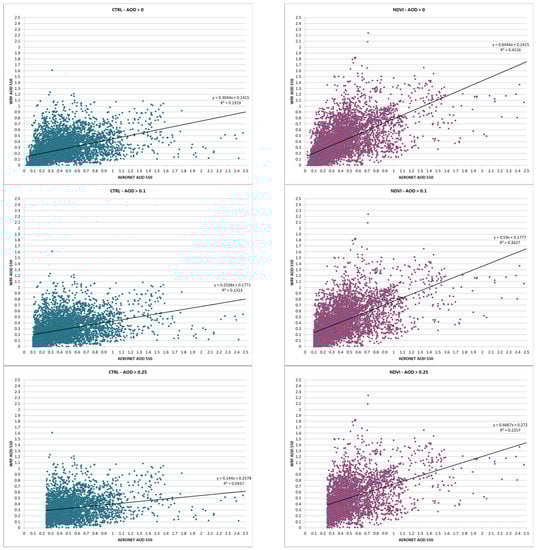
Figure 5.
Scatterplots of Modeled AOD and AERONET data for all stations and for WRF-CTRL (left) and WRF-NDVI (right) simulations. Results are presented for three AOD limits: AOD > 0.0 (top), AOD > 0.1 (middle), and AOD > 0.25 (bottom).
The above comparison with station measurements and the corresponding trend lines and R2 coefficients indicate an overall improvement of the modeled AOD in the domain by using the dynamical NDVI dataset. In order to quantify this improvement, the statistical indexes presented in Section 2.3 are calculated and presented in Table 2.
Table 2.
Statistical indexes for the two simulation sets (WRF-CTRL and WRF-NDVI) for the three AOD limits used. The total number of data pairs used for the calculation of the statistics are presented in the last column. Bold fonts indicate model improvement for the corresponding statistical value.
As shown in Table 2, the model performance is improved for all AOD thresholds in the WRF-NDVI runs, since all the statistics improve. The AOD is still underestimated, but this underestimation is limited, especially for high AOD values (>0.25) where the negative BIAS decreases from −0.20 to −0.02. At the same AOD threshold of 0.25, the RMSE, CORR, FGR, and MFB are also improved by 0.08, 0.26, 0.22, and 0.41, respectively. Similar improvements in all the statistical indexes are also found for the AOD thresholds of 0.0 and 0.1; however, the most prominent improvements are found for the higher AOD values. For instance, for AOD values > 0.0 the BIAS improves from −0.12 to −0.01, the RMSE from 0.30 to 0.25, and the CORR, FGE, and MFB from 0.44, 0.68, and −0.48 to 0.65, 0.53, and −0.13 respectively. For AOD values > 0.1, the BIAS improves from −0.13 to −0.01, the RMSE form 0.32 to 0.26, and the CORR, FGE, and MFB from 0.36, 0.61, and −0.41 to 0.60, 0.45, and −0.05, respectively.
In order to further quantify the performance of WRF-NDVI simulations, we calculate the above statistical indexes for each AERONET station separately and for AOD greater than 0.1 (Table 3).
Table 3.
Statistical indexes for the 34 AERONET stations used in this study. Green color cells denote model improvement for the NDVI simulations, while red cells denote that the CTRL simulations give better results for each station. For each station, the country is also added.
In total, we calculate 170 statistical metrics (BIAS, RMSE, CORR, FGE, MFB, for 34 stations). From these, 124 metrics are improved in the WRF-NDVI runs and 46 deteriorate. These statistics also reflect the previous results on the overall improvement of model performance for the entire domain. Of note are the stations located in Israel (Weizmann_Institute, SEDE_BOKER, Eilat, and Technion_Haifa_IL) and the Arabian Peninsula (Shagaya_Park and KAUST_Campus), all of which show considerable improvement in WRF-NDVI, especially in metrics that are related to the quantity of transported dust particles, like BIAS, FGE, and MFB. The Israeli stations lie in the pathway of desert dust transport from the Saharan towards the Eastern Mediterranean, which is typical for the transitional periods of the year, such as the modeling period in our study. For the Arabian Peninsula, the WRF-NDVI simulations improve the spatial distribution of AOD over the area, as was also found in [36].
For Europe, the most distant station from the Saharan is in Eforie in Romania, where the statistical values also improve: the BIAS decreases from −0.135 to −0.092, the RMSE from 0.193 to 0.179, the FGE from 0.631 to 0.484, and the MFB from −0.615 to −0.398. The correlation coefficient remains practically unchanged (i.e., it decreases by 0.01). These results imply that the WRF-NDVI correctly describes increased dust concentrations into the atmosphere, originating from a more appropriate definition of dust source strength. Accordingly, three stations in Eastern Europe (ATHENS-NOA, Finokalia-FKL, and Lecce_University) all have mostly improved scores when factoring NDVI. This is to be expected, as these stations lie in the pathways of desert dust transport and are particularly affected by Saharan particles during spring. However, there are certain AERONET stations that need to be examined in greater detail, since they show a general deterioration of statistical scores for the WRF-NDVI runs. These stations include Tabernas_PSA-DLR in Spain, Santa_Cruz_Tenerife, and La_Laguna in the Western part of Africa and Tamanrasset_INM and El_Farafra, in the Saharan desert.
For Tabernas_PSA-DLR, all the statistical indexes are worse for WRF-NDVI. It is worth noting that the neighboring station of Granada shows improved scores for the same period and the same number of data pairs as Tabernas_PSA-DLR. The main difference between these two stations is that Tabernas_PSA-DLR is located in a more complex topographic position close to a mountain range. As shown in an earlier study by [46], the transport of dust over complex terrain can be strongly affected by local wind patterns (e.g., Foehn flows) which cannot be reproduced at the relatively coarse model resolution of 12 × 12 km grid that is used in our study. For both Tamanrasset_INM and El_Farafra, the WRF-NDVI overestimates the AOD. In Tamanrasset_INM, the BIAS changes from −0.087 to 0.128 and in El_Farafra from −0.055 to 0.136, denoting a change from underestimation to overestimation. The same applies for the other statistical indexes as well. A possible reason is that the NDVI limit of 0.1 results in unrealistically high strength of the dust sources and further fine tuning of this limit may be needed at local scale. However, the scarcity of measuring stations near the dust sources limits our capability to accurately quantify NDVI changes at local scale. The stations of Santa_Cruz_Tenerife and La_Laguna are not in the immediate pathways of dust transport during this time of the year (March to May). A more pronounced effect of the developed WRF-NDVI methodology is probably expected for the summer season in these stations due to increased Atlantic outflows. However, the performance of WRF-NDVI is improved for the third Atlantic station of Cape Verde.
Finally, the 3 stations located near the Sahel, namely Banizoumbou, IER_Cinzana, and Dakar, all show considerable improvements when using the NDVI dataset. For Banizoumbou, the BIAS and RMSE are improved from −0.12 to 0.09 and from 0.28 to 0.24, respectively. CORR shows a significant improvement from 0.19 to 0.51 and FGE and MFB change from 0.37 to 0.33 and from −0.18 to 0.17, respectively. Dakar station exhibits significant improvement, with BIAS changing from −0.20 to 0.07, RMSE from 0.48 to 0.35, CORR from −0.08 to 0.45, and FGE and MFB from 0.69 to 0.42 and −0.41 to 0.12, respectively. These stations are affected by dust emissions originating from the complex Sahel savanna. Therefore, the improved representation of erodibility factor in this region results in a more detailed description of dust mobilization.
4. Summary and Conclusions
In this work we use the NDVI as an indicator of the dust source emission strength. NDVI is a simple formulation that is widely used for ecosystems and land-use change monitoring. Here we use it to dynamically scale the erodibility factor in WRF-Chem. Areas with NDVI less than 0.1 denote bare soil and are assumed to be active dust sources in the model. For evaluating the effects of the methodology applied, two sets of simulations are performed and evaluated against the AERONET data for the period 1 April 2017 to 31 May 2017, which is a very active period for dust transport over the Mediterranean. The first simulation (WRF-CTRL) uses the static dust source database of [45], which is the default configuration of the WRF-Chem model. The second simulation uses the updated high-resolution database with NDVI-scaled erodibility (WRF-NDVI).
The modeling results are evaluated in terms of AOD using typical evaluation statistics. It is found that, in general, the NDVI dust source definition improves the spatial variability of desert dust transport over the entire computational domain. For instance, at the AOD > 0.25 threshold, the BIAS decreases from −0.20 to −0.02, the RMSE decreases from 0.38 to 0.30, the CORR improves from 0.21 to 0.47, FGE improves from 0.62 to 0.40, and MFB improves from −0.49 to −0.08. Improvements in all the statistical indexes are recorded for AOD values greater than 0.0 and 0.1 as well, but not as significant as when considering higher AOD thresholds. This indicates that the methodology adopted here has a greater impact on more severe dust events and episodes, as it more accurately describes the dust source emission strength.
The 34 AERONET stations in our study are also examined separately in order to further analyze the impact of the NDVI-scaled emissions at different areas. From the 170 calculated statistical scores, 124 indicate better performance of the WRF-NDVI simulations and 46 indicate better performance of the WRF-CTRL runs. Of note are the stations located in the Middle East (Weizmann_Institute, SEDE_BOKER, Eilat, and Technion_Haifa_IL) and the Arabian Peninsula (Shagaya_Park and KAUST_Campus), all of which show considerable improvement when using NDVI to define the dust source strength, especially in metrics that are related to the quantity of transported dust particles. In Europe, the most distant station from Sahara is Eforie in Romania, where the statistical values also indicate improved performance of WRF-NDVI compared to WRF-CTRL: BIAS decreases from −0.16 to −0.09, RMSE from 0.19 to 0.18, FGE from 0.63 to 0.48 and MFB from −0.62 to −0.40. Accordingly, in Central and Eastern Mediterranean, which are mainly affected by increased dust activity along the north African coast (ATHENS-NOA, Finokalia-FKL and Lecce_University), the statistical scores also indicate improved model performance in WRF-NDVI runs. Additionally, the three stations that are located at the Southern border of the Sahara Desert, near the Sahel zone (Banizoumbou, IER_Cinzana and Dakar), all present improved statistical scores when using the NDVI dataset.
However, at some AERONET stations the performance of WRF-NDVI is worse than the WRF-CTRL control run. These stations are located at the northwest parts of the domain: Tabernas_PSA-DLR in Spain, Santa_Cruz_Tenerife, and La_Laguna in the Atlantic Ocean, as well as Tamanrasset_INM and El_Farafra in the Saharan desert. In general, the statistical metrics for the above stations indicate an overestimation of AOD in the WRF-NDVI runs that is probably attributed to unrealistic representation of the dust sources affecting these areas. However, the limited number of measuring stations in Sahara does not allow for a proper evaluation of NDVI variability on a local scale.
In conclusion, the NDVI-scaling methodology that was previously developed to describe the dust sources in NMME-DREAM model [36] has been successfully implemented in WRF-Chem. The time-varying scaling of dust source strength with MODIS NDVI provides a physically-based method to describe both the permanent dust sources and those that present seasonal or longer-term variability. The new model parameterization in WRF-Chem improves the simulation of desert dust production over arid and semi-arid areas by considering the finer scale spatiotemporal changes in land use. More detailed studies regarding the effects of land-use on convectively driven dust-storms (haboobs) are also possible due to the high-resolution nesting capabilities of the model. Additional satellite products may also be assimilated in the model to further constrain the dust simulations. Nevertheless, longer testing periods and case studies are needed in order to fine-tune the parameterization and improve our understanding on dust emissions, especially over the very active dust source areas.
Author Contributions
C.S. contributed to conceptualization, data curation, formal analysis, investigation, methodology, software, validation, visualization, writing original draft, writing, review and editing. S.S. contributed to conceptualization, data curation, formal analysis, funding acquisition, investigation, methodology, project administration, resources, software, supervision, validation, visualization, writing original draft, writing, review and editing. N.S.B. contributed to conceptualization, data curation, formal analysis, investigation, methodology, software, validation, visualization, writing original draft, writing, review and editing. K.C.D. contributed to data curation, visualization, writing, review and editing. S.N. contributed to conceptualization, formal analysis, investigation, methodology, software, supervision, validation, visualization, writing original draft, writing, review and editing. All authors have read and agreed to the published version of the manuscript.
Funding
This study is supported by the Hellenic Foundation for Research and Innovation project MegDeth (HFRI no. 703).
Institutional Review Board Statement
Not applicable.
Informed Consent Statement
Not applicable.
Data Availability Statement
All the data used in this study is available upon request.
Acknowledgments
We thank the Pl(s) and Co PI(s) and their staff for establishing and maintaining the AERONET sites used in this investigation.
Conflicts of Interest
The authors declare that they have no conflict of interest.
References
- Myhre, G.; Shindell, D.; Bréon, F.-M.; Collins, W.; Fuglestvedt, J.; Huang, J.; Koch, D.; Lamarque, J.-F.; Lee, D.; Mendoza, B.; et al. Anthropogenic and Natural Radiative Forcing. In Climate Change 2013: The Physical Science Basis. Contribution of Working Group I to the Fifth Assessment Report of the Intergovernmental Panel on Climate Change; Stocker, T.F., Qin, D., Plattner, G.-K., Tignor, M., Allen, S.K., Boschung, J., Nauels, A., Xia, Y., Bex, V., Midgley, P.M., Eds.; Cambridge University Press: Cambridge, UK; New York, NY, USA, 2013. [Google Scholar]
- Gassó, S.; Grassian, V.H.; Miller, R.L. Interactions between Mineral Dust, Climate, and Ocean Ecosystems. Elements 2010, 6, 247–252. [Google Scholar] [CrossRef]
- Spyrou, C.; Kallos, G.; Mitsakou, C.; Athanasiadis, P.; Kalogeri, C.; Iacono, M.J. Modeling the radiative effects of desert dust on weather and regional climate. Atmos. Chem. Phys. 2013, 13, 5489–5504. [Google Scholar] [CrossRef] [Green Version]
- Mahowald, N.M.; Albani, S.; Kok, J.F.; Engelstaedter, S.; Scanza, R.; Ward, D.S.; Flanner, M.G. The size distribution of desert dust aerosols and its impact on the Earth system. Aeol. Res. 2014, 15, 53–71. [Google Scholar] [CrossRef] [Green Version]
- Kumar, P.; Sokolik, I.N.; Nenes, A. Measurements of cloud condensation nuclei activity and droplet activation kinetics of fresh unprocessed regional dust samples and minerals. Atmos. Chem. Phys. 2011, 11, 3527–3541. [Google Scholar] [CrossRef] [Green Version]
- Solomos, S.; Kallos, G.; Kushta, J.; Astitha, M.; Tremback, C.; Nenes, A.; Levin, Z. An integrated modeling study on the effects of mineral dust and sea salt particles on clouds and precipitation. Atmos. Chem. Phys. 2011, 11, 873–892. [Google Scholar] [CrossRef] [Green Version]
- Creamean, J.M.; Suski, K.J.; Rosenfeld, D.; Cazorla, A.; DeMott, P.J.; Sullivan, R.C.; White, A.B.; Ralph, F.M.; Minnis, P.; Comstock, J.M.; et al. Dust and biological aerosols from the Sahara and Asia influence precipitation in the western U.S. Science 2013, 339, 1572–1578. [Google Scholar] [CrossRef] [Green Version]
- Spyrou, C. Direct radiative impacts of desert dust on atmospheric water content. Aerosol Sci. Technol. 2018, 52, 693–701. [Google Scholar] [CrossRef]
- Duce, R.A.; Liss, P.S.; Merrill, J.T.; Atlas, E.L.; Buat-Menard, P.; Hicks, B.B.; Miller, J.M.; Prospero, J.M.; Arimoto, R.; Church, T.M.; et al. The Atmospheric Input of Trace Species to the World Ocean. Glob. Biogeochem. Cycles 1991, 5, 193–259. [Google Scholar] [CrossRef]
- Jickells, T.D.; An, Z.S.; Andersen, K.K.; Baker, A.R.; Bergametti, G.; Brooks, N.; Cao, J.J.; Boyd, P.W.; Duce, R.A.; Hunter, K.A.; et al. Global Iron Connections between Desert Dust, Ocean Biogeochemistry, and Climate. Science 2005, 308, 67–71. [Google Scholar] [CrossRef] [Green Version]
- Goudie, S.A. Desert Dust and Human Health Disorders. Environ. Int. 2013, 63, 101–113. [Google Scholar] [CrossRef]
- Esmaeil, N.; Gharagozloo, M.; Rezaei, A.; Grunig, G. Dust events, pulmonary diseases and immune system. Am. J. Clin. Exp. Immunol. 2014, 3, 20–29. [Google Scholar] [PubMed]
- Guieu, C.; Shevchenko, V.P. Dust in the Ocean. In Encyclopedia of Marine Geosciences; Springer: Dordrecht, The Netherlands, 2015. [Google Scholar] [CrossRef]
- Scanza, R.A.; Mahowald, N.; Ghan, S.; Zender, C.S.; Kok, J.F.; Liu, X.; Zhang, Y.; Albani, S. Modeling dust as component minerals in the Community Atmosphere Model: Development of framework and impact on radiative forcing. Atmos. Chem. Phys. 2015, 15, 537–561. [Google Scholar] [CrossRef] [Green Version]
- Intergovernmental Panel on Climate Change (IPCC); Ranasinghe, R.; Ruane, A.C.; Vautard, R.; Arnell, N.; Coppola, E.; Cruz, F.A.; Dessai, S.; Islam, A.S.; Rahimi, M.; et al. Climate Change Information for Regional Impact and for Risk Assessment. In Climate Change 2021: The Physical Science Basis. Contribution of Working Group I to the Sixth Assessment Report of the Intergovernmental Panel on Climate Change; Masson-Delmotte, V., Zhai, P., Pirani, A., Connors, S.L., Péan, C., Berger, S., Caud, N., Chen, Y., Goldfarb, L., Gomis, M.I., et al., Eds.; Cambridge University Press: Cambridge, UK; New York, NY, USA, 2021; pp. 1767–1926. [Google Scholar] [CrossRef]
- Prospero, J.M.; Ginoux, P.; Torres, O.; Nicholson, S.E.; Gill, T.E. Environmental Characterization of Global Sources of Atmospheric Soil Dust Identified with the Nimbus 7 Total Ozone Mapping Spectrometer (Toms) Absorbing Aerosol Product. Rev. Geophys. 2002, 40, 1002. [Google Scholar] [CrossRef]
- Tegen, I.; Harrison, S.; Kohfeld, K.; Prentice, I.C.; Coe, M.; Heimann, M. Impact of vegetation and preferential source areas on global dust aerosol: Results from a model study. J. Geophys. Res. 2002, 107, 4576. [Google Scholar] [CrossRef] [Green Version]
- Crouvi, O.; Schepanski, K.; Amit, R.; Gillespie, A.R.; Enzel, Y. Multiple dust sources in the Sahara Desert: The importance of sand dunes. Geophys. Res. Lett. 2012, 39, L13401. [Google Scholar] [CrossRef]
- Anderson, J.; Hardy, E.; Roach, J.; Witmer, R. A Land Use and Land Cover Classification System for Use with Remote Sensing Data, U.S. Geological Survey; USGS Professional Paper 964; United States Government Printing Office: Washington, DC, USA, 1976.
- Spyrou, C.; Mitsakou, C.; Kallos, G.; Louka, P.; Vlastou, G. An improved limited area model for describing the dust cycle in the atmosphere. J. Geophys. Res. 2010, 115, D17211. [Google Scholar] [CrossRef]
- Skamarock, W.C.; Klemp, J.B.; Dudhia, J.; Gill, D.O.; Liu, Z.; Berner, J.; Wang, W.; Powers, J.G.; Duda, M.G.; Barker, D.M.; et al. A Description of the Advanced Research WRF Version 4; NCAR Technical Note NCAR/TN-556+STR; NCAR: Boulder, CO, USA, 2019. [Google Scholar]
- Grell, G.A.; Peckham, S.E.; Schmitz, R.; McKeen, S.A.; Frost, G.; Skamarock, W.C.; Eder, B. Fully coupled ‘online’ chemistry in the WRF model. Atmos. Environ. 2005, 39, 6957–6976. [Google Scholar] [CrossRef]
- Schmechtig, C.; Marticorena, B.; Chatenet, B.; Bergametti, G.; Rajot, J.L.; Coman, A. Simulation of the Mineral Dust Content over Western Africa from the Event to the Annual Scale with the CHIMERE DUST Model. Atmos. Chem. Phys. 2011, 11, 7185–7207. [Google Scholar] [CrossRef] [Green Version]
- Menut, L.; Bessagnet, B.; Khvorostyanov, D.; Beekmann, M.; Blond, N.; Colette, A.; Coll, I.; Curci, G.; Foret, G.; Hodzic, A.; et al. CHIMERE 2013: A model for regional atmospheric composition modelling. Geosci. Model Dev. 2013, 6, 981–1028. [Google Scholar] [CrossRef] [Green Version]
- Escribano, J.; Boucher, O.; Chevallier, F.; Huneeus, N. Subregionalinversion of North Africandust sources. J. Geophys. Res. Atmos. 2016, 121, 8549–8566. [Google Scholar] [CrossRef] [Green Version]
- Walko, R.L.; Band, L.E.; Baron, J.; Kittel, T.G.F.; Lammers, R.; Lee, T.J.; Ojima, D.; Pielke, R.A., Sr.; Taylor, C.; Tague, C.; et al. Coupled atmosphere- biophysicshydrology models for environmental modeling. J. Appl. Meteorol. 2000, 39, 931–944. [Google Scholar] [CrossRef]
- Pausata, F.S.R.; Gaetani, M.; Messori, G.; Berg, A.; de Souza, D.M.; Sage, R.F.; DeMenocal, P.B. The Greening of the Sahara: Past Changes and Future Implications. One Earth 2020, 2, 235–250. [Google Scholar] [CrossRef]
- Feuerstein, S.; Schepanski, K. Identification of Dust Sources in a Saharan Dust Hot-Spot and Their Implementation in a Dust-Emission Model. Remote Sens. 2018, 11, 4. [Google Scholar] [CrossRef] [Green Version]
- Boloorani, A.D.; Kazemi, Y.; Sadeghi, A.; Shorabeh, S.N.; Argany, M. Identification of dust sources using long term satellite and climatic data: A case study of Tigris and Euphrates basin. Atmos. Environ. 2020, 224, 117299. [Google Scholar] [CrossRef]
- Rodell, M.; Houser, P.R.; Jambor, U.; Gottschalck, J.; Mitchell, K.; Meng, C.-J.; Arsenault, K.; Cosgrove, B.; Radakovich, J.; Bosilovich, M.; et al. The Global Land Data Assimilation System. Bull. Am. Meteorol. Soc. 2004, 85, 381–394. [Google Scholar] [CrossRef] [Green Version]
- Vukovic, A.; Vujadinovic, M.; Pejanovic, G.; Andric, J.; Kumjian, M.R.; Djurdjevic, V.; Dacic, M.; Prasad, A.K.; El-Askary, H.M.; Paris, B.C.; et al. Numerical simulation of “an American haboob”. Atmos. Chem. Phys. 2014, 14, 3211–3230. [Google Scholar] [CrossRef] [Green Version]
- Vukovic, A. Report on Consultancy to Develop Global Sand and Dust Source Base Map, No. CCD/18/ERPA/21; UNCCD: Belgrade, Serbia, 2019. [Google Scholar]
- Vukovic, A.; UNCCD. Sand and Dust Storms Source Base-Map. Visualization Tool. 2021. Available online: https://maps.unccd.int/sds/ and https://www.youtube.com/watch?v=4tsbspJvuAs (accessed on 26 April 2022).
- Bergametti, G.; Marticorena, B.; Rajot, J.L.; Siour, G.; Feron, A.; Gaimoz, C.; Coman, A.; Chatenet, B.; Coulibaly, M.; Maman, A.; et al. The Respective Roles of Wind Speed and Green Vegetation in Controlling Sahelian Dust Emission during the Wet Season. Geophys. Res. Lett. 2020, 47, e2020GL089761. [Google Scholar] [CrossRef]
- Solomos, S.; Ansmann, A.; Mamouri, R.-E.; Binietoglou, I.; Patlakas, P.; Marinou, E.; Amiridis, V. Remote sensing and modelling analysis of the extreme dust storm hitting the Middle East and eastern Mediterranean in September 2015. Atmos. Chem. Phys. 2017, 17, 4063–4079. [Google Scholar] [CrossRef] [Green Version]
- Solomos, S.; Abuelgasim, A.; Spyrou, C.; Binietoglou, I.; Nickovic, S. Development of a dynamic dust source map for NMME-DREAM v1.0 model based on MODIS Normalized Difference Vegetation Index (NDVI) over the Arabian Peninsula. Geosci. Model Dev. 2019, 12, 979–988. [Google Scholar] [CrossRef] [Green Version]
- Holben, B.N.; Eck, T.F.; Slutsker, I.; Tanré, D.; Buis, J.P.; Setzer, A.; Vermote, E.; Reagan, J.A.; Kaufman, Y.J.; Nakajima, T.; et al. AERONET—A Federated Instrument Network and Data Archive for Aerosol Characterization. Remote Sens. Environ. 1998, 66, 1–16. [Google Scholar] [CrossRef]
- Giles, D.; Sinyuk, M.; Sorokin, A.; Schafer, M.G.; Smirnov, J.S.; Slutsker, A.; Eck, I.; Holben, T.F.; Lewis, B.N.; Campbell, J.R.; et al. Advancements in the Aerosol Robotic Network (AERONET) Version 3 database—Automated near-real-time quality control algorithm with improved cloud screening for Sun photometer aerosol optical depth (AOD) measurements. Atmos. Meas. Technol. 2019, 12, 169–209. [Google Scholar] [CrossRef] [Green Version]
- Pettorelli, N.; Ryan, S.; Mueller, T.; Bunnefeld, N.; Jedrzejewska, B.; Lima, M.; Kausrud, K. The Normalized Difference Vegetation Index (NDVI): Unforeseen successes in animal ecology. Clim. Res. 2011, 46, 15–27. [Google Scholar] [CrossRef]
- Rouse, R., Jr.; Haas, H.; Schell, J.A.; Deering, D.W. Monitoring vegetation systems in the Great Plains with ERTS. In Goddard Space Flight Center 3D ERTS-1 Symp.; Sect. A; NASA: Washington, DC, USA, 1974; Volume 1, pp. 309–317. [Google Scholar]
- Huete, A.R.; Justice, C.; van Leeuwen, W. MODIS Vegetation Index (MOD 13): Algorithm Theoretical Basis Document; NASA Goddard Space Flight Center: Greenbelt, MD, USA, 1999.
- Solano, R.; Didan, K.; Jacobson, A.; Huete, A. MODIS Vegetation Index User’s Guide, Ver. 2.0, Vegetation Index and Phenology Lab; The University of Arizona: Tucson, AZ, USA, 2010; Available online: https://vip.arizona.edu (accessed on 26 April 2022).
- Didan, K. MOD13A2 MODIS/Terra Vegetation Indices 16-Day L3 Global 1 km SIN Grid V006 [Data Set]. NASA EOSDIS Land Processes DAAC. 2015. Available online: https://ladsweb.modaps.eosdis.nasa.gov/missions-and-measurements/products/MOD13A2 (accessed on 4 February 2022).
- Ginoux, P.; Chin, M.; Tegen, I.; Prospero, J.M.; Holben, B.; Dubovik, O.; Lin, S.-J.S. Sources and distributions of dust aerosols simulated with the GOCART model. J. Geophys. Res. 2001, 106, 20255–20273. [Google Scholar] [CrossRef]
- LeGrand, S.L.; Polashenski, C.; Letcher, T.W.; Creighton, G.A.; Peckham, S.E.; Cetola, J.D. The AFWA Dust Emission Scheme for the GOCART Aerosol Model in WRF-Chem v3.8.1; Cold Regions Research and Engineering Laboratory (U.S.): Hanover, NH, USA; Engineer Research and Development Center (U.S.): Vicksburg, MI, USA, 2019; Volume 12, pp. 131–166. [Google Scholar] [CrossRef] [Green Version]
- Solomos, S.; Kalivitis, N.; Mihalopoulos, N.; Amiridis, V.; Kouvarakis, G.; Gkikas, A.; Binietoglou, I.; Tsekeri, A.; Kazadzis, S.; Kottas, M.; et al. From Tropospheric Folding to Khamsin and Foehn Winds: How Atmospheric Dynamics Advanced a Record-Breaking Dust Episode in Crete. Atmosphere 2018, 9, 240. [Google Scholar] [CrossRef] [Green Version]
- National Centers for Environmental Prediction; National Weather Service; NOAA; U.S. Department of Commerce. NCEP GDAS/FNL 0.25 Degree Global Tropospheric Analyses and Forecast Grids, Research Data Archive at the National Center for Atmospheric Research; Computational and Information Systems Laboratory: Boulder, CO, USA, 2015. [Google Scholar] [CrossRef]
- Thompson, G.; Field, P.R.; Rasmussen, R.M.; Hall, W.D. Explicit Forecasts of Winter Precipitation Using an Improved Bulk Microphysics Scheme. Part II: Implementation of a New Snow Parameterization. Mon. Weather Rev. 2008, 136, 5095–5115. [Google Scholar] [CrossRef]
- Tiedtke, M. A comprehensive mass flux scheme for cumulus parameterization in large–scale models. Mon. Weather Rev. 1989, 117, 1779–1800. [Google Scholar] [CrossRef] [Green Version]
- Zhang, C.; Wang, Y.; Hamilton, K. Improved representation of boundary layer clouds over the southeast pacific in ARW–WRF using a modified Tiedtke cumulus parameterization scheme. Mon. Weather Rev. 2011, 139, 3489–3513. [Google Scholar] [CrossRef] [Green Version]
- Iacono, M.J.; Delamere, J.S.; Mlawer, E.J.; Shephard, M.W.; Clough, S.A.; Collins, W.D. Radiative forcing by long-lived greenhouse gases: Calculations with the AER radiative transfer models. J. Geophys. Res. Atmos. 2008, 113, D13103. [Google Scholar] [CrossRef]
- Mesinger, F. Forecasting upper tropospheric turbulence within the framework of the Mellor-Yamada 2.5 closure. Res. Activ. Atmos. Ocean. Mod. 1993, 18, 4–28. [Google Scholar]
- Janjic, Z.I. The Step–Mountain Eta Coordinate Model: Further developments of the convection, viscous sublayer, and turbulence closure schemes. Mon. Weather Rev. 1994, 122, 927–945. [Google Scholar] [CrossRef] [Green Version]
- Janjic, Z.I. Nonsingular Implementation of the Mellor-Yamada Level 2.5 Scheme in the NCEP Meso Model; NCEP Office Note No. 437; National Centers for Environmental Prediction (U.S.): College Park, MD, USA, 2002; 61p. [Google Scholar]
- Tewari, M.; Chen, F.; Wang, W.; Dudhia, J.; LeMone, M.A.; Mitchell, K.; Ek, M.; Gayno, G.; Wegiel, J.; Cuenca, R.H. Implementation and verification of the unified NOAH land surface model in the WRF model. In Proceedings of the 20th Conference on Weather Analysis and Forecasting/16th Conference on Numerical Weather Prediction, Seattle, WA, USA, 14 January 2004; pp. 11–15. [Google Scholar]
- Kim, D.; Chin, M.; Bian, H.; Tan, Q.; Brown, M.E.; Zheng, T.; You, R.; Diehl, T.; Ginoux, P.; Kucsera, T. The effect of the dynamic surface bareness on dust source function, emission, and distribution. J. Geophys. Res.-Atmos. 2013, 118, 871–886. [Google Scholar] [CrossRef]
- Slingo, A.; Ackerman, T.P.; Allan, R.P.; Kassianov, E.I.; Mcfarlane, S.A.; Robinson, G.J.; Barnard, J.C.; Miller, M.A.; Harries, J.E.; Russell, J.E.; et al. Observations of the Impact of a Major Saharan Dust Storm on the Atmospheric Radiation Balance. Geophys. Res. Lett. 2006, 33, L24817. [Google Scholar] [CrossRef] [Green Version]
- Tulet, P.; Mallet, M.; Pont, V.; Pelon, J.; Boone, A. The 7–13 March 2006 Dust Storm over West Africa: Generation, Transport, and Vertical Stratification. J. Geophys. Res. 2008, 113, DOOC08. [Google Scholar] [CrossRef] [Green Version]
- Iqbal, M. An Introduction to Solar Radiation; Academic: Toronto, ON, Canada, 1983. [Google Scholar]
- Wilks, D.S. 2011 Statistical Methods in the Atmospheric Sciences; International Geophysics Series; Academic Press: Cambridge, MA, USA, 2011; Volume 100, ISSN 0074-6142. [Google Scholar]
- Binietoglou, I.; Basart, S.; Alados-Arboledas, L.; Amiridis, V.; Argyrouli, A.; Baars, H.; Baldasano, J.M.; Balis, D.; Belegante, L.; Bravo-Aranda, J.A.; et al. A methodology for investigating dust model performance using synergistic EARLINET/AERONET dust concentration retrievals. Atmos. Meas. Techol. 2015, 8, 3577–3600. [Google Scholar] [CrossRef] [Green Version]
- Eltahan, M.; Shokr, M.; Sherif, A.O. Simulation of Severe Dust Events over Egypt Using Tuned Dust Schemes in Weather Research Forecast (WRF-Chem). Atmosphere 2018, 9, 246. [Google Scholar] [CrossRef] [Green Version]


Publisher’s Note: MDPI stays neutral with regard to jurisdictional claims in published maps and institutional affiliations. |
© 2022 by the authors. Licensee MDPI, Basel, Switzerland. This article is an open access article distributed under the terms and conditions of the Creative Commons Attribution (CC BY) license (https://creativecommons.org/licenses/by/4.0/).