Abstract
Radiosoundings are essential for weather and climate applications, as well as for calibration and validation of remote sensing observations. Vaisala RS92 radiosondes have been widely used on a global scale until 2016; although in the fall of 2013, Vaisala introduced the RS41 model to progressively replace the RS92. To ensure the highest quality and homogeneity of measurements following the transition from RS92 to RS41, intercomparisons of the two radiosonde models are needed. A methodology was introduced to simultaneously test and compare the two radiosonde models inside climatic chambers, in terms of noise, calibration accuracy, and bias in temperature measurements. A pair of RS41 and RS92 radiosondes has been tested at ambient pressure under very different temperature and humidity conditions, reproducing the atmospheric conditions that a radiosonde can meet at the ground before launch. The radiosondes have also been tested before and after fast (within ≈ 10 s) temperature changes of about ±20 °C, simulating a scenario similar to steep thermal changes that radiosondes can meet when passing from indoor to outdoor environment during the pre-launch phase. The results show that the temperature sensor of RS41 is less affected by noise and more accurate than that of RS92, with noise values less than 0.06 °C for RS41 and less than 0.1 °C for RS92. The deviation from the reference value, referred to as calibration error, is within ±0.1 °C for RS41 and the related uncertainty (hereafter with coverage factor k = 1) is less than 0.06 °C, while RS92 is affected by a cold bias in the calibration, which ranges from 0.1 °C up to a few tenths of a degree, with a calibration uncertainty less than 0.1 °C. The temperature bias between RS41 and RS92 is within ±0.1 °C, while its uncertainty is less than 0.1 °C. The fast and steep thermal changes that radiosondes can meet during the pre-launch phase might lead to a noise increase in temperature sensors during radiosoundings, up to 0.1 °C for RS41 and up to 0.3 °C for RS92, with a similar increase in their calibration uncertainty, as well as an increase in the uncertainty of their bias up to 0.3 °C.
1. Introduction
Atmospheric profiles of temperature, humidity, and wind (speed and direction) measured by radiosoundings are essential for a wide variety of scientific applications, such as studies of atmospheric thermodynamic structure and related processes [1,2], analysis of trends to detect and monitor signals of climate change both in troposphere and stratosphere [3,4,5,6,7,8,9,10,11], calibration and validation of ground-based and satellite remote sensing measurements [12,13,14,15,16], improvement of weather forecasting, climate models, and atmospheric reanalysis [17,18,19].
Vaisala RS92 radiosondes, introduced in 2003, have been mostly used on a global scale until 2016 [20]. In particular, within the Global Climate Observing System (GCOS) Reference Upper-Air Network (GRUAN) [21,22], these radiosondes have been adopted by the majority of sites to provide reference measurements, i.e., traceable to SI (International System of units of measurements [23]), and with a comprehensive uncertainty analysis and quantification [24,25]. To improve measurement accuracy, in the fall of 2013 Vaisala introduced the RS41 radiosonde to progressively replace the RS92, whose production was terminated late in 2017, although some time was clearly needed to have the majority of global radiosounding stations operating the new RS41 at the same time. Sensors’ changes typically lead to inhomogeneities in data records, which may systematically alter the climate signal contained in the data and potentially affect radiosounding historical time series and associated applications and analysis, as demonstrated by several studies [17,20,26,27,28,29,30,31]. Intercomparison experiments, such as the last WMO CIMO (World Meteorological Organization Commission for Instruments and Methods of Observation) radiosondes’ intercomparison [32], are one of the most effective approaches to quantify and adjust these inhomogeneities, as well as to evaluate improvements in sensors’ measurement accuracy. Intercomparisons of radiosondes, based on both atmospheric and laboratory measurements, represent a unique opportunity to characterize the differences between their sensors in terms of biases, errors, and uncertainty contributions of the measurements.
Regarding the recent transition from RS92 to RS41, the most relevant measurement errors and related uncertainties for both radiosonde models have been characterized through laboratory tests performed by the manufacturer [33,34,35,36]. The evaluated errors include:
- -
- Those corrected by means of calibration, evaluated as the difference with respect to traceable reference values and hereafter reported as calibration errors;
- -
- The radiation errors due to the heating of sensors by solar radiation, which introduces a warm bias in temperature sensors and a dry bias in humidity sensors;
- -
- The time lag errors due to the increased response time of sensors at low temperatures, mainly below −40 °C (negligible for temperature sensors).
Furthermore, manufacturer-independent laboratory tests have been performed as part of GRUAN activities for both RS92 [24] and RS41 [37,38].
On the other hand, the difference (bias) between RS92 and RS41 measurements has only been quantified via dual soundings, i.e., simultaneous atmospheric measurements performed with a pair of RS92 and RS41 radiosondes attached to a payload and lifted by the same balloon. Dual soundings have been performed in different locations and time periods, in order to assess sensors’ difference depending on regional climate, seasons, daytime, and nighttime conditions. Examples are provided both by the manufacturer [35,39] and by the GRUAN community [37,40,41,42,43]. In this regard, starting from 2014, several GRUAN sites have performed dual soundings for periods of different duration and launch frequency, from long-term campaigns (more than one year), typically with weekly or bi-weekly launch frequency, to short intensive campaigns (less than 1 month), typically with daily launch frequency, up to sporadic launches [37].
In support of the GRUAN intercomparison strategy for managing the transition from RS92 to RS41, only a few dedicated experiments in a laboratory-controlled environment have been carried out. This type of experiments requires the expertise and equipment from both radio-sounding stations and metrology community. At the CNR-IMAA (National Research Council of Italy—Institute of Methodologies for Environmental Analysis) Atmospheric Observatory (CIAO), Vaisala radiosondes are launched since 2004, with the aim to monitor atmospheric thermodynamic parameters, calibrate a ground-based Raman lidar for the retrieval of atmospheric humidity profiles [44,45] and validate satellite observations and retrieval algorithms [13,46]. CIAO became a GRUAN site in 2010 and, since then, routine weekly nighttime radiosoundings are performed, using the RS92 sondes until December 2016 and the RS41 sondes thereafter. Until 2016, RS92 radiosondes have been launched at CIAO using both a manual system and an automatic launcher. The database of automatic launchers operated by CIAO and other GRUAN sites has been recently used to assess the reliability and the technical performance of automatic launchers compared to the most common manual systems [47]. The Italian National Institute of Metrology (Istituto Nazionale di Ricerca Metrologica—INRiM) is deeply involved in metrology projects by leading international initiatives dedicated to the investigation of temperature measurements and their uncertainties for meteorology and climate applications, such as the MeteoMet projects of the European Metrology Research Programme [48,49].
Merging the expertise and experimental equipment from both the GRUAN station at CIAO and INRiM, a methodology based on laboratory tests inside climatic chambers has been drafted with the aim to characterize RS92 and RS41 performances and differences in terms of noise, calibration error and uncertainty, as well as bias in temperature measurements. These quantities have been evaluated for a pair of RS92 and RS41 radiosondes at ambient pressure under different controlled temperature and humidity conditions, using sensors traceable to SI standards as reference. The methodology and results of this assessment are described and discussed in this paper.
All the known systematic errors and the related uncertainty contributions should be properly quantified to provide high quality measurements. The calibration error and uncertainty for RS92 e RS41 temperature sensors represent a major uncertainty contribution for radiosoundings, and they have so far been evaluated only based on manufacturer’s ground checks and specifications summarized in Table 1. In this work, these quantities have been estimated for the first time independently of the manufacturer. Such an independent assessment is a necessary step to develop a transparent, reproducible, and manufacturer-independent processing of radiosondes’ data from raw measurements to final products, following the GRUAN approach for providing reference measurements.

Table 1.
Manufacturer specifications for RS92 and RS41 temperature sensors [33,34].
As for the bias between the temperature measurements of the two radiosondes, its evaluation is needed to detect and adjust inhomogeneities in data records due to sensors’ change and, for the first time, it has been evaluated using laboratory tests in a climatic chamber and not via dual soundings. The bias values resulting from dual soundings are typically less than 0.1 °C throughout the atmosphere for nighttime soundings, less than 0.2 °C in the troposphere and gradually increasing with altitude (up to about 0.5 °C) above the tropopause, for daytime soundings [35,37,39,40,41,43]. These values are smaller than radiosondes’ combined measurement uncertainties, indicating that the change of these radiosondes should not significantly affect the homogeneity of their temperature measurements’ time series. Comparing radiosondes in climatic chambers has a few advantages compared to dual soundings. First, the bias repeatability can be evaluated under the controlled conditions of a climatic chamber; this is not possible in dual soundings, as the atmospheric conditions the two radiosondes meet at any given altitude are not controllable nor comparable within a sounding, and not repeatable in different soundings. Second, for a given measurement scenario, the number of measurements that can be collected in a climatic chamber, even with a single pair of radiosondes, is much higher compared to dual soundings, due to the limited number of dual soundings available for that scenario. Thus, to characterize the bias between the two radiosondes’ measurements, a few pairs of radiosondes are sufficient using a climatic chamber, while many more pairs of radiosondes (and higher costs) are required for dual soundings, both to represent a wide variety of measurement scenarios and to collect for each scenario a sufficient number of measurements to minimize the effects on the bias of the different atmospheric conditions that the two radiosondes meet at each altitude level during each sounding. Finally, it is much easier to compare radiosondes of the same production batches in climatic chambers rather than in dual sounding datasets, thus reducing the uncertainty due to the variability of production batches. On the other hand, the main disadvantage of using climatic chambers is the difficulty of reproducing the atmospheric conditions that radiosondes meet during radiosoundings.
The remainder of the paper is organized as follows. In Section 2, the experimental equipment and setup, as well as the applied methodology, are described. Section 3 reports the results of laboratory tests performed using climatic chambers. In Section 4, the results with their interpretation and implications are discussed. Finally, Section 5 provides summary and conclusions.
2. Experimental Setup and Methodology
INRiM’s laboratories feature facilities and equipment dedicated to the investigation of uncertainties in the measurements of meteorological and climate parameters, and for the calibration of several types of instruments. In the present study, two climatic chambers have been used for radiosonde testing. The first one is a Kambic MeteoCal KK-105 shown in Figure 1 [50], specifically adapted by the manufacturer to address a wide range of environmental temperatures (and beyond, range −40 °C < T < 180 °C) and relative humidities (10% < RH < 98% in the temperature range 10 °C < T < 95 °C). The chamber has been designed to achieve a temperature stability better than 0.1 °C and a uniformity in the measurement space within 0.3 °C, while for relative humidity the stability is 0.5%. The second climatic chamber, shown in Figure 2, is manufactured by Weiss Technik with a temperature stability of 0.2 °C, a uniformity within 0.5 °C and no humidity control capability.
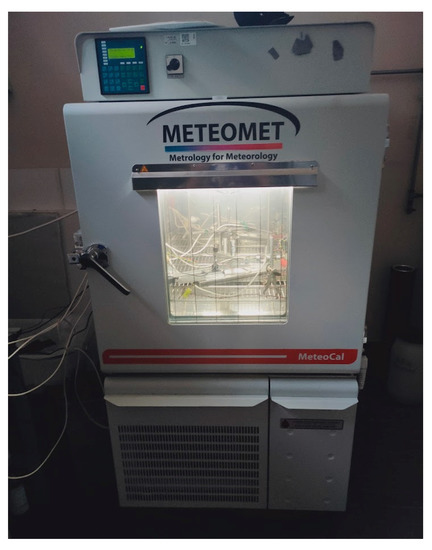
Figure 1.
Climatic chamber Kambic MeteoCal KK-105 in operation at INRiM and used to test RS92 and RS41 under various temperature and humidity conditions and ambient pressure. The chamber simultaneously and independently controls temperature (range −40 °C < T < 180 °C) and relative humidity (range 10% < RH < 98% in the temperature range 10 °C < T < 95 °C).
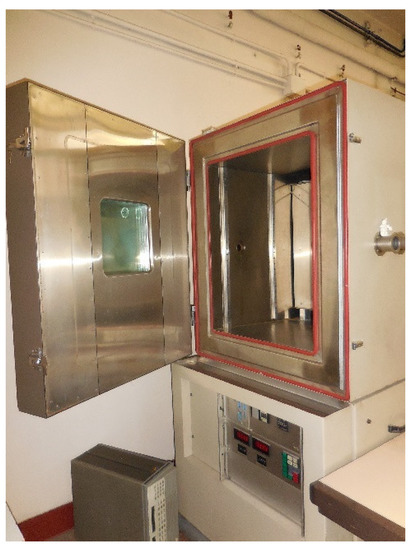
Figure 2.
Climatic chamber Weiss Technik in operation at INRiM and used, coupled with the Kambic chamber, to test RS92 and RS41 before and after fast temperature changes.
In order to compare the temperature readings from the radiosondes with the reference temperatures inside the climatic chambers, a number of CalPower custom-made reference Platinum resistance sensors (Pt100 with metal coating) have been used. Before their calibration, the Pt100 thermometers were thermally cycled between −20 °C and 50 °C to evaluate the repeatability of the instruments. The thermometers were calibrated in a highly stable and homogeneous liquid bath, by comparison with a standard resistance thermometer calibrated at the fixed points of the ITS-90 (the International Temperature Scale of 1990 [51]). The thermometers were calibrated at six temperature points: −40 °C, 0 °C, 20 °C, 30 °C, 40 °C, and 60 °C, with two hysteresis-check points at 0 °C and 20 °C. The final calibration uncertainty (given here and hereafter with coverage factor k = 1, unless specified differently) was evaluated as 0.005 °C for T > 0 °C and 0.01 °C for T < 0 °C. The reference sensors have been read using a multimeter Fluke 1586A Super DAQ with a multichannel scanner, capable of a measurement uncertainty better than 0.005 °C.
The intercomparison experiment has been carried out by using two separate Vaisala DigiCORA MW41 sounding systems [52], consisting of a computer and a laptop, running the Vaisala MW41 sounding software v2.4.0 and v2.6.0 respectively, each connected to its sounding processing subsystem SPS311 [53] via a network adapter and to its radiosonde ground check device (Figure 3). The latter was a Ground Check set GC25 [54], connected to the computer via a serial cable, for the RS92, and a Ground Check Device RI41 [55], connected to the laptop via a USB cable, for the RS41. Both systems were connected to an omnidirectional ultra-high frequency (UHF) antenna by a splitter, and they were configured to separately receive and process the signals transmitted by the two radiosonde models at two different frequencies, 402 MHz for the RS92 and 405 MHz for the RS41. The distance between the two selected frequencies and the bandwidth of the telemetry signals, which is less than 20 kHz, ensure there is no interference between the signals received from the two radiosondes. On the other hand, no interference was reported in similar receiving systems used for dual or multiple soundings [32,40], even with the two transmitting radiosondes in a closer proximity than in the present experiment [41].
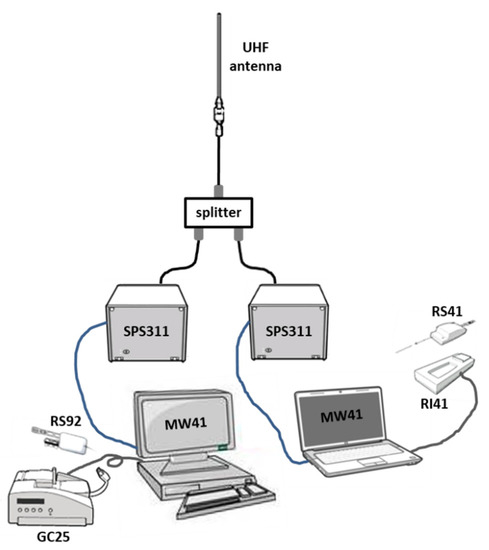
Figure 3.
Scheme of Vaisala sounding systems used for the intercomparison, consisting of a computer and a laptop, running the MW41 software, each connected to its sounding processing subsystem (SPS311) and radiosonde ground check device (GC25 for RS92 and RI41 for RS41). Both systems are connected to an omnidirectional ultra-high frequency (UHF) antenna by a splitter.
GC25 and RI41 devices are used in ground check procedures recommended by the manufacturer before radiosondes’ launch. In the ground check of RS92 with GC25, humidity sensors are heated with integrated heating elements to remove possible contamination affecting humidity measurements. Moreover, RS92 temperature and humidity measurements are compared to reference values in order to check the factory calibration and determine the possible correction factors to be applied to radiosounding temperature and humidity profiles. The reference values for temperature are provided by a Pt100 thermometer located inside the GC25 chamber, while a 0% humidity reference is obtained using a desiccant in the same chamber. When RS41 is checked with RI41, as for the check of RS92 with GC25, the humidity sensor is heated to remove any residual contamination, using the integrated heating element on the sensor chip. Unlike the check with GC25, RS41 temperature measurements are not compared to reference values and no correction factor to be applied to radiosounding temperature profiles is determined. However, a functionality check of the temperature sensor is performed, by comparing its readings with those of the additional temperature sensor integrated on the humidity sensor chip. Conversely, RS41 humidity measurements are compared to a 0% humidity reference generated in open air by heating the humidity sensor and taking advantage of the fact that for a given water vapor content, the relative humidity decreases toward zero when the temperature rises enough. This allows to determine a correction factor applicable to radiosounding humidity profiles.
In order to simultaneously test both radiosonde types inside a climatic chamber, a customized prototype frame has been used. A light and robust plastic grid was mounted on a metal plate using two cylindrical steel holders fixed both to the metal plate and to the grid with screws and bolts. Two holes have been created on the grid suitable to lodge the sensors’ booms of both radiosonde types through two adapters, which are the same used to test radiosondes’ sensors in the standard humidity chamber SPRH-100 [56] during the manufacturer-independent pre-launch ground check regularly performed for GRUAN radiosoundings [57]. The adapters were fixed to the grid with plastic ties and the two radiosondes of different type were kept in a fixed position with their sensor booms vertically oriented opposite each other at a distance of about 15 cm. Both radiosonde types were connected by electrical wires to their power supplies located outside the climatic chamber, which replaced the alkaline batteries normally used during atmospheric radiosoundings. This enabled the acquisition of measurements, with the radiosondes both outside and inside the climatic chambers, for many hours without interruptions for replacing the batteries. Figure 4 shows the measurement layout inside the Kambic chamber. At a distance of 3 cm from the temperature sensor of each radiosonde, a Pt100 reference thermometer traceable to SI standards was placed and fixed to the plastic grid. Moreover, an additional Pt100 reference thermometer was placed in the middle of the measurement frame, at the same distance of about 7.5 cm from the two radiosondes’ temperature sensors. The reference thermometers were also connected to their own reading unit located outside the chambers. Figure 5 shows a schematic of the measurement layout, where the reference thermometers and their position with respect to radiosondes’ sensors are also represented.
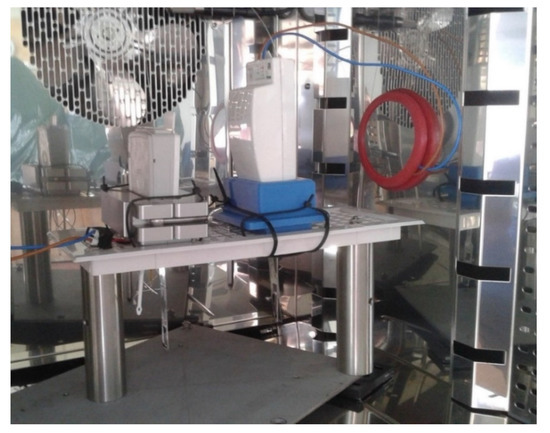
Figure 4.
Photo of the measurement layout inside the Kambic chamber, with the frame including the plastic grid, the metal plate at the basis, the cylindrical steel holders, the radiosondes RS92 (left) and RS41 (right) with their sensor booms vertically oriented each in opposition to the other. The two radiosondes, supported by two adapters fixed to the grid with plastic ties passing through the holes of the grid, were connected by electrical wires to their power supplies located outside the chamber.
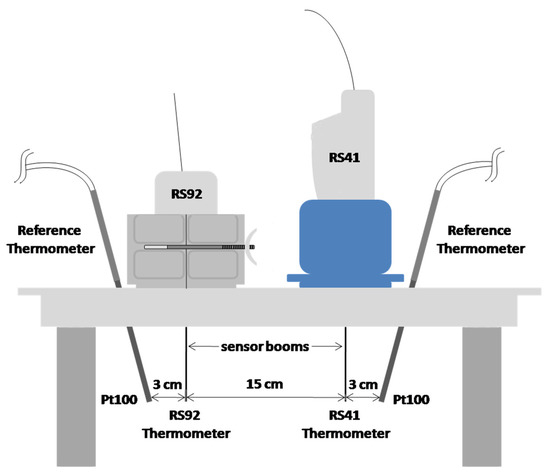
Figure 5.
Scheme of the measurement layout: the sensor booms of the two radiosondes and their thermometers were located at 15 cm distance, while a Pt100 reference thermometer was at 3 cm from the temperature sensor of each radiosonde. An additional Pt100 reference thermometer (not shown) was placed in the middle, at a distance of about 7.5 cm from each radiosonde’s temperature sensor.
The intercomparison experiment was carried out in two separate stages described in the following Section 2.1 and Section 2.2.
2.1. Tests Using a Single Climatic Chamber
At the first stage, a pair of RS41 and RS92 radiosondes has been tested inside the Kambic chamber at different temperature and humidity conditions, at ambient pressure. A fan, placed on the inner back wall of the chamber, blows the air in, which, after passing through the chamber internal components, is conveyed inside the chamber measurement volume, where it is distributed uniformly. In this way, the temperature and humidity are kept homogeneous inside the chamber. The ventilation speed in the chamber at the location of radiosondes’ sensor booms was estimated in the order of 2 m/s, using a portable digital anemometer (wind speed range 0.3 < w < 30 m/s, uncertainty 5%). Simultaneous measurements from the radiosondes and the reference thermometers were acquired at nine conditions of temperature (T) and relative humidity (RH), as reported in Table 2. The chamber cannot dynamically control the relative humidity at T ≤ 0 °C, while for positive temperatures three different RH values have been set, corresponding to low (RH = 20%), moderate (RH = 60%), and very high (RH = 98/95%) humidity conditions. The above conditions of T and RH have been selected to reproduce the atmospheric conditions that radiosondes can meet at the ground, at different climatic regions and seasons.

Table 2.
Temperature and relative humidity values corresponding to the nine different measurement conditions reproduced in the Kambic chamber (Kambic settings).
For each T and RH condition, measurements from all the sensors in the chamber have been acquired only after thermal stability was achieved, which required a time period up to several hours. The thermal stability within the chamber was considered achieved when the minimum temporal variability was observed in readings of all reference thermometers. The temporal resolution of measurements was 1 s for radiosondes and 3 s for reference thermometers, while the duration of the acquisition loop ranged from 5–10 min, corresponding to at least 300 repeated measurements for each radiosonde sensor. Before placing the radiosondes in the climatic chamber, the pre-launch ground check procedure recommended by the manufacturer was performed, using GC25 and RI41 devices for RS92 and RS41, respectively. In this way, the radiosondes have been tested inside the chamber simulating the complete pre-launch phase in radiosoundings. Moreover, the raw data of radiosonde temperature measurements have been used, without the corrections applied by the Vaisala or GRUAN data processing algorithms (i.e., the correction for warm/cold bias due to solar/infrared radiation in daytime/nighttime launches, the time lag correction, and the ground check correction for RS92 measurements).
As an example, Figure 6 shows the plots of temperature measurements from both the radiosondes and the reference thermometers acquired at T = 20 °C and RH = 20% for a period of 8 min, corresponding to 480 repeated measurements for radiosondes’ temperature sensors. For the RS92, the periodic structure of the temperature signal with a period of about 140 s, which is related to the swapping cycle of the two humidity sensors and their heaters over the same time period, is evident. More specifically, the two humidity sensors are alternately heated to remove contamination and one of these sensors is located closer to the temperature sensor than the other. The periodic peaks in the temperature signal are due to the heating of the latter humidity sensor, that leaks through to the temperature sensor by conduction. For the RS41, where the single humidity sensor with its integrated heater is quite distant from the temperature sensor, the temperature signal does not seem to be affected by a similar disturbance. During the balloon ascent in radiosoundings, it is expected that the higher ventilation on the temperature sensors compared to that in the climatic chamber mitigates the effects of the heating of the humidity sensors on the RS92 temperature signal, by attenuating or suppressing the periodic peaks. However, the observed temperature signals from both radiosondes are representative of the sensors’ behavior under conditions they meet at the ground before launch, under which they were tested.
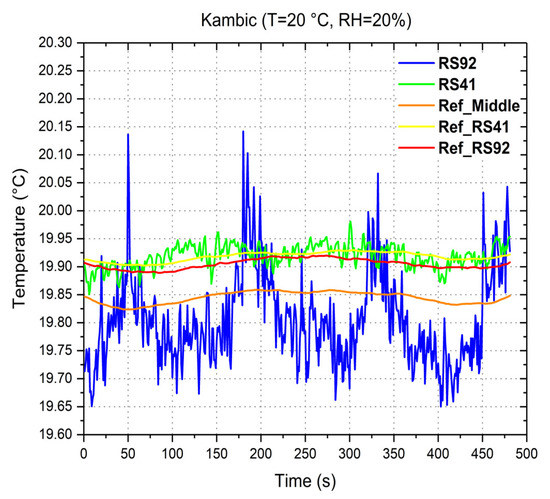
Figure 6.
Time series of temperature measurements (vertical axis) from all the sensors in the Kambic chamber set at T = 20 °C and RH = 20%. The duration of the acquisition was 480 s (8 min), corresponding to 480 repeated measurements for radiosondes’ sensors. The blue line refers to the RS92, the green to the RS41, the red and yellow to the reference thermometer close to the temperature sensor of RS92 and RS41, respectively, the orange to the reference thermometer in the middle of the measurement frame (i.e., between radiosondes’ temperature sensors).
In order to compare RS41 and RS92 and characterize their differences, the mean and standard deviation of measurements from all the temperature sensors in the chamber, as well as of other derived quantities (detailed below in this section), have been calculated over the whole acquisition period for each condition of T and RH set in the chamber. The standard deviation of readings from each temperature sensor results from the combination of sensor’s noise and chamber instability. The latter was measured as the standard deviation of reference thermometers’ readings in the points where these thermometers were placed, assuming their noise negligible. This measure of the chamber instability made the estimation of the radiosondes’ temperature sensors noise possible.
The chamber temperature inhomogeneity (or uniformity) through the measurement volume was measured as the maximum difference between the mean values of reference thermometers’ measurements.
From the results of the laboratory tests (Section 3.1.2), it was found that the chamber inhomogeneity through the portion of the measurement volume between the temperature sensor of each radiosonde and the co-located Pt100 reference thermometer is typically less than 0.05 °C and does not affect the temperature difference between these sensors, . The latter can be considered as an estimate of the sonde calibration error, , that is:
The calibration errors of radiosondes’ temperature sensors have been evaluated by calculating the mean of over the acquisition period for each T and RH condition and can be expressed as:
The repeatability in calibration errors of radiosondes’ temperature sensors has been calculated as the standard deviation of .
The temperature difference (i.e., bias) between RS41 and RS92, , can be affected by the chamber inhomogeneity through the measurement volume and it may not represent the real temperature difference between the two sondes. Therefore, instead of this difference, it was considered the temperature absolute difference between the two sondes, , defined, at any instant, as the difference between their calibration errors:
is not affected by the chamber inhomogeneity, being the inhomogeneity between the thermometer of each radiosonde and the co-located reference thermometer negligible. The temperature bias between RS41 and RS92 has been evaluated by calculating the mean of , that is:
The repeatability in the temperature bias has been calculated as the standard deviation of .
2.2. Fast Temperature Changes Using Two Climatic Chambers
In the second stage of the experiment, the same pair of radiosondes was tested before and after fast temperature changes, generated by quickly moving (within ≈ 10 s) the measurement frame from the Kambic chamber to the adjacent Weiss Technik chamber and vice versa, with the two chambers set at different temperatures. Each chamber was also equipped with a Pt100 reference thermometer fixed to an inner wall. The ventilation conditions in the chambers were the same as those described in Section 2.1. Both rising and dropping temperature changes of about 20 °C were performed, and more specifically two rising changes from 0 °C to 20 °C and two dropping changes from 20 °C to 0 °C and −5 °C. The Kambic was set at 0 °C and −5 °C, the Weiss Technik at 20 °C. The aim was to study the effects of such changes on the temperature sensors of both radiosondes. A step of about 20 °C was selected to simulate a steep thermal change that a radiosonde can meet when passing from the indoor of a laboratory or inflation chamber to outdoor conditions before launch.
Simultaneous measurements from radiosondes’ temperature sensors and reference thermometers have been acquired before and after each change as in the first stage, after thermal stability was achieved in the respective chamber, with same temporal resolutions and similar acquisition durations. A period of about 2 h, longer than the typical duration of a radiosounding, preceded the acquisition before each change. In order to study the potential effects of the temperature changes on the measurements of radiosoundings, i.e., within their duration, the acquisition period considered after each change was started as soon as the thermal stability was reached in the chamber, typically about 15 min after the change. The achievement of thermal stability was checked by the standard deviation of reference thermometers’ readings representing the chamber stability. As in the first stage, the manufacturer ground check procedures were performed before the tests in the climatic chambers, in order to test the radiosondes under conditions similar to those before launch in radiosoundings, and only raw measurements from radiosondes were acquired.
As an example, Figure 7 shows the plots of temperature measurements from both the radiosondes and the reference thermometers acquired before and after a fast change from 0 °C to 20 °C for a period of about 27 min.
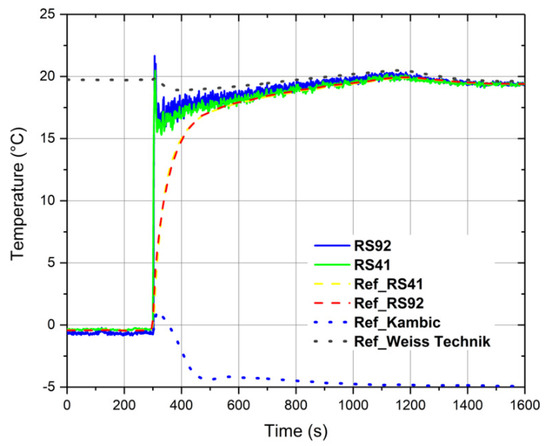
Figure 7.
Time series of temperature measurements (vertical axis) from both the radiosondes and the reference thermometers acquired before and after a change from 0 °C to 20 °C for a period of 1600 s (about 27 min). Solid lines refer to the radiosondes (blue for RS92, green for RS41), dashed lines refer to the reference thermometers close to radiosondes’ sensors (red for RS92 and yellow for RS41), dotted lines refer to the reference thermometers fixed to chambers’ inner walls (blue for the Kambic chamber set at 0 °C before the change and gray for the Weiss Technik chamber set at 20 °C).
The effects of the fast temperature changes on the temperature sensors of both radiosondes have been studied and compared by considering the same quantities described in Section 2.1, that is, in terms of sensors’ noise, as well as of their calibration error and bias with related repeatability. These quantities were calculated over the acquisition period under thermal stability conditions in the chambers, both before and after each change. For example, for the change shown in Figure 7 the acquisition period under stability conditions in the first chamber (set at 0 °C) before the change was 5 min (from 0–300 s in Figure 7), while the corresponding acquisition period in the second chamber (set at 20 °C) after the change was the last 5 min of acquisition (from 1300–1600 s in Figure 7), starting about 17 min after the change.
3. Results
3.1. Tests in the Kambic Chamber
In this section, the results obtained during the first stage of the experiment, described in Section 2.1, are reported. More specifically, Section 3.1.1 concerns the noise characterization of RS92 and RS41 temperature sensors, Section 3.1.2 refers to RS92 and RS41 calibration errors with their uncertainties, Section 3.1.3 refers to the temperature bias between RS92 and RS41 and the related uncertainty.
3.1.1. Noise of RS92 and RS41 Temperature Sensors
The standard deviations of temperature measurements from all the sensors in the chamber for all T and RH conditions considered (see Table 2) are plotted in Figure 8.
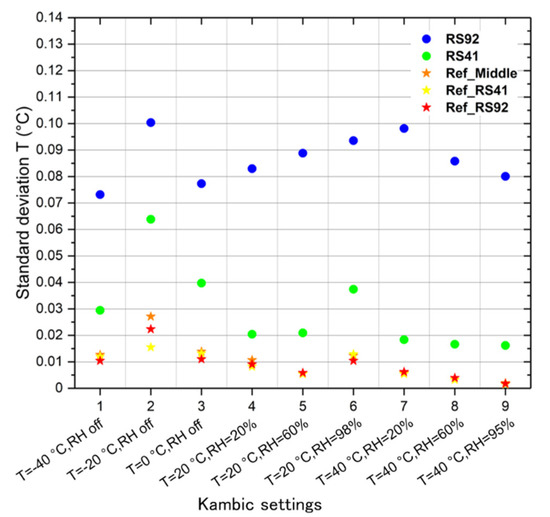
Figure 8.
Standard deviations of temperature measurements (vertical axis) from the radiosondes (circles) and the reference thermometers (stars) calculated at the different temperature (T) and relative humidity (RH) conditions in the Kambic chamber (horizontal axis). At T ≤ 0 °C there is no relative humidity control in the chamber (RH off). The blue and green circles refer to RS92 and RS41, respectively. The red, yellow and orange stars refer to the reference thermometer close to RS92, to RS41 and in the middle of measurement frame, respectively.
The standard deviations from reference thermometers (red, yellow and orange stars for the thermometer close to RS92, to RS41 and in the middle of measurement frame, respectively) represent an estimate of the chamber instability in the points where these thermometers were placed. For each T and RH condition, the chamber instability is uniform through the measurement volume, being the standard deviations from all reference thermometers very similar, and significantly lower than the standard deviation from both radiosondes’ temperature sensors (blue and green circles for RS92 and RS41, respectively). More specifically, for each condition of T and RH the chamber instability is lower than 0.014 °C, with uniformity of instability (measured as maximum difference between the chamber instabilities) within ±0.006 °C, except for T = −20 °C, where the instability is slightly higher, while remaining less than 0.03 °C, and less uniform (within ±0.012 °C). These values of the chamber instability are significantly lower than those reported in the manufacturer specifications, typically lower than 0.1 °C.
The high chamber stability compared to the standard deviations from radiosondes’ temperature sensors, together with the high uniformity in the chamber instability, allowed to characterize the noise of these sensors and related differences. Indeed, the standard deviations from radiosondes’ sensors, resulting from the combination of sensors’ noise and chamber instability, represent an estimate of that noise. Moreover, the difference or the ratio between the noise estimates for the two radiosondes’ sensors is not affected by a different chamber instability in the points where these sensors were placed. The plots shown in Figure 8 reveal that for each T and RH condition, the noise of RS41 temperature sensor (green circles) is lower than that of RS92 (blue circles). More specifically, the noise for RS41 ranges from 0.016 °C (T = 40 °C, RH = 95%) to 0.064 °C (T = −20 °C), while the noise for RS92 ranges from 0.073 °C (T = −40 °C) to 0.1 °C (T = −20 °C). In terms of noise ratio, the RS92 temperature sensor is from 1.6 (T = −20 °C) to 5.3 (T = 40 °C, RH = 20%) times noisier than that of RS41. At T = −20 °C, where the noise is maximum for both the radiosondes (≈0.06 °C for RS41 and ≈0.1 °C for RS92) the chamber instability is also maximum (ranging from 0.015 °C to 0.027 °C). In this case, a higher chamber instability leads to overestimating the noise of both radiosondes’ sensors, being this noise estimated as the standard deviation of sensors’ measurements, which is more contaminated by the chamber instability.
3.1.2. RS92 and RS41 Calibration Errors and Uncertainties
In Figure 9, mean and standard deviation of calculated for each T and RH condition set in the chamber are plotted (blue and green plot for RS92 and RS41, respectively). The chamber inhomogeneity through the measurement volume, measured as the maximum difference between the mean values of reference thermometers’ readings, is also reported for all the measurement conditions (red vertical bars). The values of this inhomogeneity are within ±0.15 °C, with a minimum of ±0.07 °C (T = 0 °C; T = 20 °C, RH = 20%), except for T = −40 °C where the inhomogeneity is within ±0.29 °C. These values are significantly lower than those reported in the manufacturer specifications, typically within ±0.3 °C. It is reasonable to assume that the chamber inhomogeneity between each radiosonde’s temperature sensor and the co-located reference thermometer is significantly lower than the above values and does not appreciably affect the values of . Indeed, assuming the chamber inhomogeneity linearly dependent on the distance and considering the distances between the reference thermometers and between each radiosonde’s temperature sensor and the co-located reference thermometer, the inhomogeneity between these latter sensors can be estimated from three to seven times lower than the above values and typically less than 0.05 °C. Thus, Equations (1) and (2) can be considered valid and the means and standard deviations of shown in Figure 9 represent, respectively, the calibration errors and related repeatabilities of radiosondes’ temperature sensors.
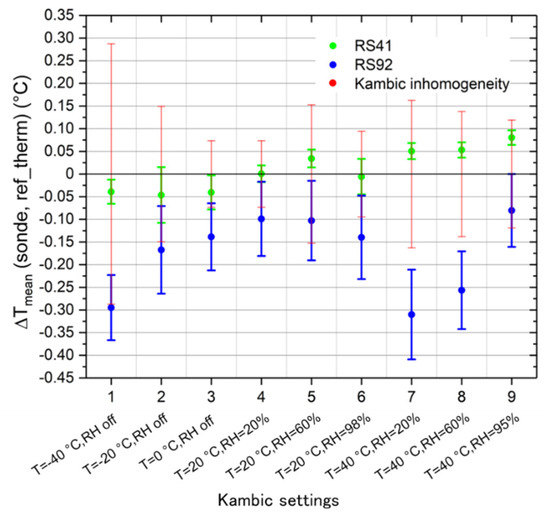
Figure 9.
Mean (circles) and standard deviation (vertical bars) of the temperature difference between each sonde and its co-located reference thermometer (vertical axis), for all the temperature (T) and relative humidity (RH) conditions set in the Kambic chamber (horizontal axis). The green plot refers to the RS41, the blue plot to the RS92. Red vertical bars represent the chamber inhomogeneity through the measurement volume.
The plots in Figure 9 show that, for each T and RH condition set in the chamber, the calibration error and related repeatability of RS41 temperature sensor are smaller than those of RS92, indicating that RS41 is more accurate than RS92. The lower repeatability in the calibration error for RS41 is due to the lower noise level of its temperature sensor compared to RS92, as shown in the previous section.
More specifically, the calibration error of RS41 temperature sensor, , assumes both negative and positive values, ranging from −0.05 °C (T = −20 °C) to 0.08 °C (T = 40 °C, RH = 95%), indicating the absence of systematic bias in the calibration and a correction factor less than 0.1 °C for all considered T and RH conditions. The repeatability in the calibration error of this sensor is lower than 0.04 °C at all conditions, except for T = −20 °C, where it reaches the maximum value of 0.06 °C, which represents an overestimation due to a higher chamber instability observed at this temperature. The total calibration uncertainty results from the combination of repeatability (A-type uncertainty) and further B-type uncertainty contributions. The latter comprise the calibration uncertainty of the reference thermometer (0.01 °C for T < 0 °C and 0.005 °C for T > 0 °C), the uncertainty of sensors’ reading systems (0.01 °C for both the radiosonde’s sensor and the reference thermometer) and the uncertainty due to the chamber inhomogeneity between the radiosonde’s sensor and the reference thermometer. The B-type uncertainty contributions are small compared to repeatability and do not significantly contribute to the total calibration uncertainty.
For RS92 temperature sensor, the calibration error estimated in our experiment, , is negative under all T and RH conditions set in the chamber, ranging from -0.31 °C (T = 40 °C, RH = 20%) to -0.08 °C (T = 40 °C, RH = 95%), indicating a cold bias in the calibration, with a correction factor ranging from at least 0.1 °C up to a few tenths of a degree. The repeatability in the calibration error is less than 0.1 °C under all considered conditions. The total calibration uncertainty results from the combination of the repeatability and the same B-type uncertainty contributions described above, which are negligible compared to repeatability, as for RS41.
Finally, Table 3 provides the values of the temperature correction factor for the RS92, , resulting from the ground check performed with the GC25 before testing the radiosondes inside the climatic chamber. The same values of for different T and RH conditions refer to a single ground check procedure performed before testing the radiosondes under those conditions during a single measurement session without interruptions. is always negative, ranging from −0.27 °C to −0.15 °C, indicating a warm bias of RS92 temperature sensor compared to the Pt100 thermometer inside the GC25 chamber. Therefore, the application of this correction to RS92 temperature sensor leads to an increase (up to 0.6 °C) of the difference between this sensor and the co-located reference thermometer, that is the calibration error (blue circles in Figure 9), making its measurement accuracy worse. This is due to possible long-term instability or drifts in the calibration of the Pt100 thermometer inside the GC25 chamber, which requires further investigation.

Table 3.
Values of the correction factor for RS92 temperature sensor, resulting from the GC25 and determined before testing the radiosondes inside the Kambic chamber under different temperature and humidity conditions (Kambic settings).
3.1.3. RS41 and RS92 Temperature Bias and Uncertainty
Figure 10 shows the mean temperature absolute bias between RS41 and RS92, , as defined in Equation (4), and the related repeatability (vertical bars) calculated for all T and RH conditions set in the chamber. ) is positive under all conditions, ranging from 0.1 °C (T = 0 °C; T = 20 °C, RH = 20%) to 0.36 °C (T = 40 °C, RH = 20%), which indicates that RS92 is colder than RS41, mainly due to the cold bias in the calibration of RS92 temperature sensor reported in Section 3.1.2. The repeatability in , as defined in Section 2.1, is less than 0.1 °C under all considered conditions and it represents the total uncertainty in the temperature absolute bias, being all B-type uncertainty contributions negligible.
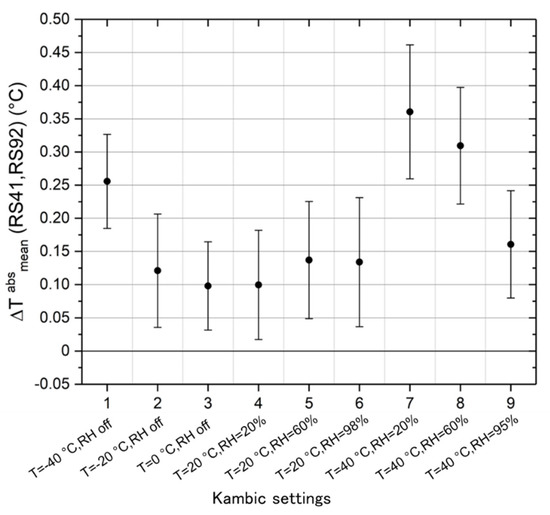
Figure 10.
Mean temperature absolute difference between RS41 and RS92, (vertical axis), for all the temperature (T) and relative humidity (RH) conditions set in the Kambic chamber (horizontal axis); the vertical bars represent the repeatability in , calculated as the standard deviation.
The above results for the temperature bias between RS41 and RS92 are not directly comparable with those resulting from dual soundings, carried out both by the manufacturer and within GRUAN, due to the different calculation methods and measurements conditions. In dual soundings, the average and standard deviation of the measurement differences from multiple pairs of RS41 and RS92 radiosondes are calculated at each altitude level, assuming the two radiosondes exposed to the same atmospheric conditions during each sounding. Moreover, the measurement profiles are smoothed (with a vertical resolution ranging from 10 m up to 2 km) and the measurement data used to calculate the differences are processed with Vaisala or GRUAN algorithms, where the corrections mentioned in Section 2.1 are applied to raw measurements. In our laboratory tests inside the Kambic chamber, the mean and the standard deviation of the difference between the calibration errors of the considered pair of RS41 and RS92, , have been calculated using repeated radiosondes’ raw measurements over time, to which no correction was applied. On the other hand, in dual soundings the measurements are performed at decreasing pressure levels and with the sensors exposed to solar radiation, for daytime soundings only, and the ventilation resulting from the combination of the balloon lifting vertical speed (typically 5 m/s), the horizontal wind, as well as radiosonde’s pendulum motions and rotations. Differently, in the Kambic the measurements are performed at laboratory ambient pressure and with the ventilation on the sensors generated by the chamber described in Section 2.1.
Despite these differences between dual soundings and our tests in the climatic chamber, we can compare to some extent the results of our experiment with those resulting from nighttime dual soundings at the ground. In such conditions, the corrections of temperature measurements due to the time lag and infrared radiation implemented in Vaisala and GRUAN data processing are negligible [24,34,58]. Thus, the difference between the raw measurements in the climatic chamber and the measurements used in dual soundings is essentially due to the ground check correction applied to RS92 measurements in dual soundings only. Therefore, recalculating by applying to RS92 measurements the ground check correction , a temperature bias comparable to that of nighttime dual soundings at the ground should in principle be obtained. However, the values of reported in Table 3 are not reliable and worsen the measurement accuracy of RS92 temperature sensor rather than improving it, as shown in the previous section. As a consequence, the correction corresponding to the mean calibration error of RS92 temperature sensor, (blue circles in Figure 9), was applied instead of . Such a correction is appropriate instead of , as it comes from the comparison of RS92 temperature sensor with the co-located Pt100 reference thermometer. Applying this correction, by replacing with , the corrected temperature absolute bias, comparable to that in nighttime dual soundings at the ground, was obtained:
Figure 11 shows the mean and the standard deviation or repeatability (vertical bars) of the corrected temperature bias, as defined in Equation (5), for each measurement condition set in the chamber. The standard deviation represents the uncertainty in the corrected temperature bias. The values of range from −0.05 °C (T = −20 °C) to 0.08 °C (T = 40 °C, RH = 95%), indicating that RS41 can be colder or warmer than RS92, with a temperature bias less than 0.1 °C in absolute value. The uncertainty in the temperature bias is lower than 0.1 °C.
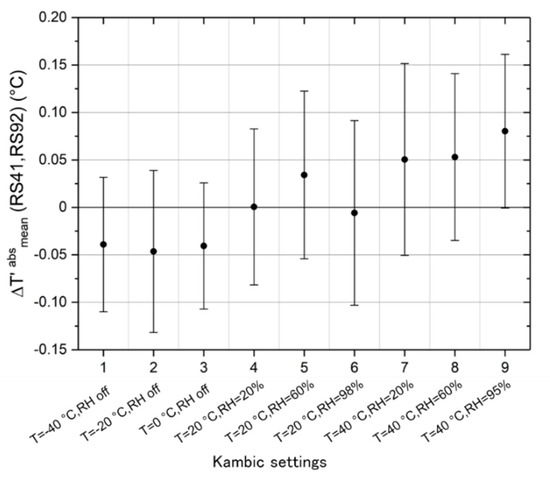
Figure 11.
Mean corrected temperature bias between RS41 and RS92, (vertical axis), for all the temperature (T) and relative humidity (RH) conditions set in the Kambic chamber (horizontal axis); the vertical bars represent the repeatability in , calculated as the standard deviation.
3.2. Fast Temperature Changes
In this section, the outcome of the second stage of the experiment, described in Section 2.2, is reported. The effects of fast temperature changes on RS92 and RS41 temperature sensors have been investigated in terms of noise (Section 3.2.1), calibration error and its uncertainty (Section 3.2.2), bias and related uncertainty (Section 3.2.3).
3.2.1. Noise of RS92 and RS41 Temperature Sensors
Table 4 reports the values of chamber instability and noise of RS41 and RS92 temperature sensors before and after the fast temperature changes described in Section 2.2 (i.e., two rising changes from 0 °C to 20 °C and two dropping changes from 20 °C to 0 °C and −5 °C). The temporal sequence of changes is also reported. As in Section 3.1.1, the chamber instability and the noise of radiosondes’ sensors are measured as the standard deviation of readings from reference thermometers and radiosondes’ sensors, respectively.

Table 4.
Chamber instability and noise of RS41 and RS92 temperature sensors before and after the two rising changes from 0 °C to 20 °C (yellow rows) and the two dropping changes from 20 °C to 0 °C and −5 °C (gray rows). The numbers next to each temperature change in the left column indicate the time sequence of changes.
The results reported in Table 4 show that before each temperature change, the noise of both RS41 and RS92 temperature sensors is the same as in the first stage of the experiment, with values lower than 0.05 °C and 0.1 °C for RS41 and RS92, respectively. After each change, an increase in the noise of both radiosondes’ temperature sensors is observed and this increase is maximum for the RS92 and dropping changes. The values of noise after changes are typically of 0.1 °C for RS41 and from 0.1 °C to 0.3 °C for RS92. However, the noise increase after each change is a transient effect observed as soon as the thermal stability was reached in the chamber (typically about 15 min after the change), fading within the following 2 h, as it is evident from the noise values observed before the next change. Finally, it is to be noted that the chamber stability values during the acquisition periods before and after each change, reported in Table 4, are very similar. This indicates that the higher noise values measured in radiosondes’ temperature readings after each change are due to the radiosondes’ sensors properties and not to the instability of the measurement setup.
3.2.2. RS92 and RS41 Calibration Errors and Uncertainties
Table 5 reports the values of calibration error Errcal and related uncertainty U(Errcal) of both RS41 and RS92 temperature sensors before and after the temperature changes described in Section 2.2. For each radiosonde, the calibration error is evaluated as in Section 3.1.2, while the calibration uncertainty results from the combination in quadrature of the repeatability in the calibration error (A-type uncertainty) and the B-type uncertainty contributions. The repeatability is calculated as in Section 3.1.2, while the B-type uncertainty contributions are described in the same section. Among these contributions, the uncertainty due to the chamber inhomogeneity between the radiosonde’s sensor and the co-located reference thermometer has been estimated from the chamber inhomogeneity through the measurement volume, measured as the mean temperature difference between the two reference thermometers close to the radiosondes’ sensors, assuming the chamber homogeneity linearly dependent on the distance and considering the distances between the two reference thermometers (≈20 cm) and between each radiosonde’s sensor and the co-located reference thermometer (≈3 cm).

Table 5.
Calibration error Errcal and related uncertainty U(Errcal) for RS41 and RS92 temperature sensors before and after the two rising changes from 0 °C to 20 °C (yellow rows) and the two dropping changes from 20 °C to 0 °C and −5 °C (gray rows). The numbers next to each temperature change in the left column indicate the time sequence of changes.
The values of calibration errors and related uncertainties reported in Table 5 are also plotted in Figure 12.
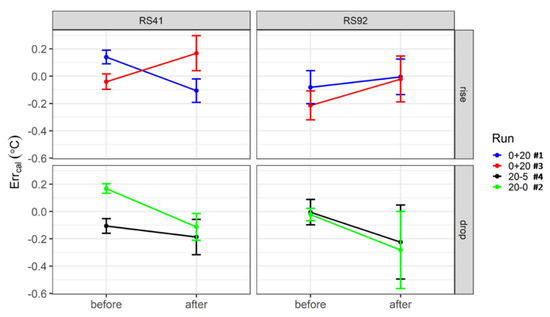
Figure 12.
Plots of calibration errors Errcal and related uncertainties (vertical bars) for RS41 and RS92 temperature sensors before and after the temperature changes (vertical axis). Top panels refer to rising changes, bottom panels to dropping changes, left panels to RS41 and right panels to RS92.
The results reported in Table 5 and plotted in Figure 12 show how the calibration error of RS41 temperature sensor ranges from −0.1 °C to 0.2 °C before all the considered temperature changes and it does not change significantly after the changes, where it ranges from −0.2 °C to 0.2 °C. These values of calibration error for RS41 are slightly higher than those observed at the first stage of the experiment, where the corresponding calibration error was less than 0.1 °C in absolute value. For the temperature sensor of RS92, the calibration error is negative (cold bias), with absolute value less than 0.2 °C before all the changes and less than 0.3 °C after all the changes. Therefore, also for RS92 the temperature changes considered do not significantly change the calibration error, which assumes values similar to those observed at the first stage of the experiment.
The calibration uncertainties of RS41 and RS92 temperature sensors before and after each temperature change are very similar to their respective noises reported in Table 4, being their values less than 0.06 °C before the changes and less than 0.1 °C after the changes, for RS41, less than 0.1 °C before the changes and ranging from 0.1 °C up to 0.3 °C after the changes, for RS92. Therefore, the calibration uncertainties for both radiosondes increase as much as their respective noises following the temperature changes considered.
3.2.3. RS41 and RS92 Temperature Bias and Uncertainty
The values of temperature absolute bias between RS92 and RS41, ΔTabs(RS92, RS41), and of the related uncertainty, U[ΔTabs(RS92, RS41)], before and after each of the temperature changes considered in the previous sections are reported in Table 6. ΔTabs(RS92, RS41) is measured as the difference between the calibration errors reported in Section 3.2.2, while its uncertainty is evaluated by combining in quadrature the corresponding calibration uncertainties. The same values reported in Table 6 are also plotted in Figure 13.

Table 6.
Temperature absolute bias between RS92 and RS41, ΔTabs(RS92, RS41), and related uncertainty, U [ΔTabs(RS92, RS41)], before and after the two rising changes from 0 °C to 20 °C (yellow rows) and the two dropping changes from 20 °C to 0 °C and −5 °C (gray rows). The numbers next to each temperature change in the left column indicate the time sequence of changes.
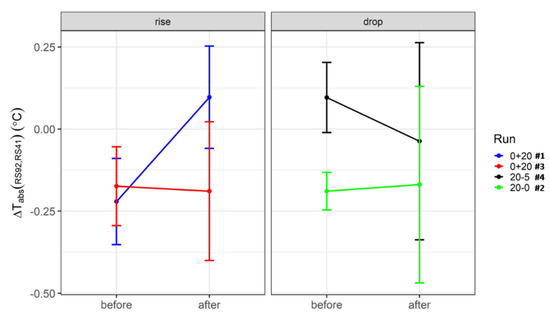
Figure 13.
Plots of temperature absolute bias between RS92 and RS41, ΔTabs(RS92, RS41), and related uncertainty (vertical bars) before and after the temperature changes (vertical axis). The left panel refers to rising changes, the right panel to dropping changes.
The results reported in Table 6 and plotted in Figure 13 show that ΔTabs (RS92, RS41) does not change significantly as a result of the temperature changes, with values ranging from −0.2 °C to 0.1 °C both before and after the changes. These values of temperature bias are similar to those observed at the first stage of the experiment under similar temperature conditions (see Figure 10), where the corresponding bias was negative (RS92 colder than RS41) and less than 0.15 °C in absolute value.
The bias uncertainty U[ΔTabs (RS92, RS41)] increases as a result of the temperature changes, being its values within 0.1 °C before changes and ranging from 0.2 °C to 0.3 °C after changes.
4. Discussion
For the first time independently of the manufacturer, the noise and the calibration accuracy of RS92 and RS41 temperature sensors have been quantified with laboratory tests in a climatic chamber. These tests revealed that the temperature sensor of RS41 is less noisy and more accurate than that of RS92, with noise values less than 0.06 °C and 0.1 °C for RS41 and RS92 respectively. For RS41, the calibration error ranges from −0.05 °C to 0.08 °C and the related uncertainty is less than 0.06 °C for all considered T and RH conditions. RS92 is affected by a cold bias in the calibration up to 0.3 °C, with a calibration uncertainty less than 0.1 °C. The values of calibration error and related uncertainty estimated for RS41 are in very good agreement with those measured in laboratory tests performed by the manufacturer, who reports a calibration error ranging from −0.08 °C to 0.06 °C, resulting from tests with five different RS41 units at various temperatures from −98 °C to 39 °C [34], and a calibration repeatability (k = 2) less than 0.1 °C [34,36]. Moreover, there is also consistency with GRUAN laboratory tests, carried out with more than 150 RS41 units at room temperature under various humidity conditions inside multiple standard humidity chambers equipped with Pt100 reference thermometers. The GRUAN tests indicate a cold bias in the calibration of 0.025 °C and a calibration uncertainty (k = 1) less than 0.2 °C [37]. The value of calibration uncertainty estimated for RS92 is 0.025 °C higher than that provided by the manufacturer, who reports a calibration repeatability (k = 2) of 0.15 °C [33,35]. This uncertainty contribution has never been characterized with manufacturer-independent laboratory tests, and in the GRUAN data processing it is evaluated by combining the value provided by the manufacturer with the correction factor resulting from the pre-launch ground check performed with the GC25 [24].
The results of our tests confirm, independently of the manufacturer, that the calibration error and uncertainty of RS41 temperature sensor meet the highest quality standards of reference platinum resistance thermometers and that this sensor type does not need of a pre-launch ground check correction to be applied to radiosounding temperature measurements. The fact that a platinum resistance thermometer does not require periodical recalibration is not obvious, as the sensing platinum element is a delicate piece of equipment, and mechanical and thermal shocks can significantly alter its nominal resistance at a given temperature [59]. Conversely, RS92 temperature sensor requires both such a recalibration with the GC25 and periodic high quality assurance checks of the calibration of the Pt100 reference thermometer inside the GC25 chamber, to avoid potential biases in radiosounding temperature measurements in the order of a few tenths of a degree or higher. Indeed, an unreliable ground check correction with the GC25 can make the measurement accuracy worse rather than improving it, as occurred in our experiment. This clearly shows the usefulness of both assessing the calibration accuracy and processing radiosondes’ raw data independently of the manufacturer, in order to detect and possibly estimate these types of biases. However, the calibration uncertainty of RS92 temperature sensor is higher than that of RS41.
From the same tests carried out to assess the noise and calibration accuracy of RS92 and RS41 temperature sensors, the bias in the measurements of these sensors has also been evaluated, by simulating pre-launch nighttime conditions, without exposing the sensors to solar radiation. It is the first time that such an evaluation has been performed using laboratory tests in a climatic chamber instead of dual soundings. The values for the bias and the related uncertainty resulted in within ±0.1 °C and less than 0.1 °C, respectively. These values are similar to the means and standard deviations of temperature differences between RS41 and RS92, typically within ±0.1 °C and 0.2 °C respectively, calculated in nighttime dual soundings performed at different latitudes both by the manufacturer [35,39] and independently within GRUAN [37,40,41,43], not only at near surface, but throughout the troposphere. The corresponding evaluation under daytime conditions and comparison with daytime dual soundings require both simulating in a climatic chamber the solar radiation on the sensors during radiosoundings and applying to radiosondes’ raw measurements the solar radiation correction provided by the manufacturer or resulting from independent laboratory tests. This simulation of solar radiation was not reproduced in our experimental setup and represents a challenge for designing the next laboratory tests using climatic chambers.
The values for the bias and the related uncertainty resulting from our tests indicate, independently of dual soundings, that the inhomogeneity in temperature measurements of the two radiosondes is within the combined uncertainties of these measurements and it should not significantly affect their time series and applications, following the transition from RS92 to RS41 already occurred at most radiosounding stations around the world. Moreover, the above values in principle refer to the conditions that radiosondes meet at the ground before launch, while the corresponding values resulting from dual soundings never refer to the radiosondes at the ground, but at higher altitudes after launch. Thus, the values from the tests in the climatic chamber can represent an additional information to that provided by dual soundings for the characterization of the temperature bias between RS41 and RS92.
All the results discussed above on both the noise and calibration accuracy, as well as on the bias, refer to a specific pair of RS41 and RS92 radiosondes and they should be consolidated by further tests with multiple pairs of radiosondes, in order to obtain results applicable to the different production batches. Moreover, the same results are obtained from testing the radiosondes at the different temperature and humidity conditions reported in Table 2, with ambient pressure and ventilation on the sensors in the order of 2 m/s, which reproduce the atmospheric conditions that radiosondes meet at the ground before launch at different climatic regions and seasons. Therefore, further laboratory tests are needed in order to characterize the radiosondes’ sensors under conditions more similar to those of radiosoundings and assess if and to what extent the results of this study may change under those conditions. These tests should be performed using climatic chambers able to reproduce inside decreasing pressure levels and ventilations on the sensors stronger than that of our tests, ranging from 2 to 10 m/s (considering that radiosondes are typically operated with a balloon lifting vertical speed of 5 m/s).
The potential effects on the results of our tests due to a stronger ventilation on the sensors might to some extent be estimated from the dataset of these tests, by removing the periodic peaks observed in RS92 temperature signals (mentioned in Section 2.1) and recalculating all the statistical quantities used to assess the noise, the calibration accuracy and the bias in sensors’ temperature measurements. This estimate assumes that a stronger ventilation on the sensors, similar to that in radiosoundings, suppresses the periodic peaks in RS92 temperature signals, due to the heating of the humidity sensors, but does not change significantly the RS41 temperature signals, which do not seem to be affected by a similar disturbance. The results of such an estimate indicate that the values of calibration errors and bias do not change significantly. On the other hand, the noise and calibration uncertainty for RS92 temperature sensor, as well as the uncertainty in radiosondes’ temperature bias take values up to 0.03 °C lower than those obtained in our tests, which, therefore, are presumably overestimated up to 0.03 °C compared to those with a stronger ventilation on the sensors, more similar to that in radiosoundings.
Finally, RS41 and RS92 radiosondes were simultaneously tested before and after fast (≈10 s) temperature changes of about ±20 °C, by simulating with two climatic chambers a scenario similar to steep thermal changes that radiosondes can meet when passing from indoor to outdoor environment during the pre-launch phase. To our knowledge, it is the first time that this type of tests has been performed with the aim to investigate the potential effects of these thermal changes on radiosondes’ temperature sensors, in terms of noise, calibration accuracy and bias of their measurements. The results showed that the thermal changes do not affect sensors’ calibration errors and bias, but they can lead to an increase of noise, up to 0.1 °C for RS41 and up to 0.3 °C for RS92, with similar increases in calibration uncertainties, as well as an increase in bias uncertainty up to 0.3 °C. These increases are transient effects, observed typically 15−20 min after each change and fading within the following 2 h. Thus, the above increases might affect the radiosondes’ measurements, at least during the first part of radiosoundings where the radiosondes meet a fast and steep thermal change when passing from the indoor of a laboratory or inflation chamber, where the ground check procedures are usually performed, to outdoor condition before launch. These effects can be of interest for metrology, meteorology, and climate communities, as they might inform on a possible underestimation of the above uncertainty contributions in the algorithms currently used to process the raw measurements of both radiosonde models.
As for the tests performed with a single climatic chamber, the results of these dynamic tests carried out with two climatic chambers refer to a specific pair of RS41 and RS92 radiosondes and measurement conditions (pressure and ventilation on the sensors) which reproduce those that radiosondes meet at the ground before launch. Therefore, the outcome of these tests needs to be confirmed by further laboratory tests with multiple pairs and production batches of radiosondes and under conditions more similar to those of radiosoundings, with decreasing pressure levels and stronger ventilation on the sensors.
5. Conclusions
A methodology was introduced to simultaneously test and compare inside climatic chambers RS92 and RS41 radiosondes, in terms of noise, calibration accuracy, and bias in their temperature measurements. In a first stage of the experiment, a pair of RS41 and RS92 radiosondes has been tested, by simulating the different atmospheric conditions that radiosondes can meet at the ground before launch. The data analysis revealed the following results:
- The temperature sensor of RS41 is less noisy than that of RS92, with noise values less than 0.06 °C for RS41 and within 0.1 °C for RS92;
- The calibration accuracy of RS41 temperature measurements is better than that of RS92, with an absolute value of RS41 calibration error less than 0.1 °C and a calibration uncertainty less than 0.06 °C, while RS92 is affected by a cold bias in the calibration, which ranges from 0.1 °C up to a few tenths of a degree, with a calibration uncertainty less than 0.1 °C and 0.025°C larger than that provided by the manufacturer. For RS92, both the noise and the calibration uncertainty are presumably overestimated up to 0.03 °C compared to those with a ventilation on the sensors similar to radiosoundings, due to the heating of the humidity sensors affecting the temperature measurements collected in the chamber. However, the results confirm, independently of the manufacturer, the better performance of RS41compared to RS92, in terms of both higher accuracy in pre-launch temperature measurements and less demanding procedures for the quality assurance of pre-launch ground check;
- The temperature bias between RS41 and RS92 and the bias uncertainty is within ±0.1 °C and less than 0.1 °C, respectively. These values are in agreement with those reported in literature for nighttime dual soundings and indicate that the change of these radiosondes should not significantly affect the homogeneity of their temperature measurements’ time series. It is the first time that such a bias has been evaluated using laboratory tests in a climatic chamber instead of dual soundings, which suggests the possibility to integrate laboratory and dual soundings measurements for managing sensor changes within observing networks.
In a second stage of the experiment, the potential effects on radiosondes’ temperature sensors of the steep thermal changes that radiosondes can meet during the pre[launch phase have been for the first time investigated, by simulating these changes with two climatic chambers. The data analysis revealed that these thermal changes might increase the noise of temperature measurements collected at least during the first part of radiosoundings, with noise values up to 0.1 °C for RS41 and up to 0.3 °C for RS92. This noise increase leads to a similar increase in the calibration uncertainty of radiosondes’ temperature sensors, as well as an increase in the uncertainty of their bias up to 0.3 °C. These results suggest a possible underestimation of the above uncertainty contributions in the current radiosoundings’ data processing algorithms.
The results reported in this paper refer to a specific pair of RS41 and RS92 radiosondes and atmospheric conditions that radiosondes meet at the ground before launch. Further tests are needed to investigate the validity of our results in atmospheric conditions more similar to those in radiosoundings. For these tests, it is recommended to use multiple pairs and production batches of radiosondes and measurement configurations suitable for simulating in climatic chambers decreasing pressure levels, as well as different and stronger ventilations on the sensors.
The methodology and the experimental setup described in this study can also be applied and adapted for testing RS41 and RS92 humidity sensors, using reference hygrometers instead of the reference thermometers, as well as for testing the sensors of other radiosonde models.
Finally, it appears clear that further experiments in climatic chambers will be needed in the future to corroborate the results obtained from the analysis of radiosondes’ intercomparisons and dual soundings’ datasets. The overall goal of this analysis is to evaluate, within a level of known uncertainty, the effect of radiosondes models’ change in climate data series, which is one of the goals of the WMO efforts in facing technology improvements and instrument changes.
Author Contributions
Conceptualization, A.M. and F.M.; methodology, M.R., G.C., A.M. and F.M.; formal analysis, M.R. and G.C.; investigation, M.R., G.C. and C.M.; data curation, M.R. and G.C.; writing—original draft preparation, M.R. and G.C.; writing—review and editing, M.R., G.C., A.M., C.M. and F.M.; visualization, M.R. and G.C. All authors have read and agreed to the published version of the manuscript.
Funding
This research received no external funding.
Institutional Review Board Statement
Not applicable.
Informed Consent Statement
Not applicable.
Data Availability Statement
The measurement data supporting the results reported in this study are available on request from the corresponding author.
Acknowledgments
The authors wish to thank the GRUAN Lead Centre for providing a Vaisala MW41 sounding system, the UHF antenna and the splitter, which allowed the simultaneous acquisition of measurements from RS92 and RS41 radiosondes.
Conflicts of Interest
The authors declare no conflict of interest.
References
- Seidel, D.J.; Ao, C.O.; Li, K. Estimating climatological planetary boundary layer heights from radiosonde observations: Comparison of methods and uncertainty analysis. J. Geophys. Res. 2010, 115, D16113. [Google Scholar] [CrossRef] [Green Version]
- Rapp, A.D.; Kummerow, C.D.; Fowler, L. Interactions between warm rain clouds and atmospheric preconditioning for deep convection in the tropics. J. Geophys. Res. 2011, 116, D23210. [Google Scholar] [CrossRef]
- Gaffen, D.J.; Sargent, M.; Habermann, R.E.; Lanzante, J.R. Sensitivity of tropospheric and stratospheric temperature trends to radiosonde data quality. J. Clim. 2000, 13, 1776–1796. [Google Scholar] [CrossRef]
- Free, M.; Seidel, D.J.; Angell, J.K.; Lanzante, J.; Durre, I.; Peterson, T.C. Radiosonde Atmospheric Temperature Products for Assessing Climate (RATPAC): A new data set of large-area anomaly time series. J. Geophys. Res. Atmos. 2005, 110, D22101. [Google Scholar] [CrossRef]
- McCarthy, M.P. Spatial sampling requirements for monitoring upper-air climate change with radiosondes. Int. J. Climatol. 2008, 28, 985–993. [Google Scholar] [CrossRef]
- Sherwood, S.C.; Meyer, C.L.; Allen, R.J.; Titchner, H.A. Robust tropospheric warming revealed by iteratively homogenized radiosonde data. J. Clim. 2008, 21, 5336–5350. [Google Scholar] [CrossRef]
- McCarthy, M.P.; Thorne, P.W.; Titchner, H.A. An analysis of tropospheric humidity trends from radiosondes. J. Clim. 2009, 22, 5820–5838. [Google Scholar] [CrossRef] [Green Version]
- Thorne, P.W.; Brohan, P.; Titchner, H.A.; McCarthy, M.P.; Sherwood, S.C.; Peterson, T.C.; Haimberger, L.; Parker, D.E.; Tett, S.F.B.; Santer, B.D.; et al. A quantification of uncertainties in historical tropical tropospheric temperature trends from radiosondes. J. Geophys. Res. Atmos. 2011, 116, D12116. [Google Scholar] [CrossRef]
- Philipona, R.; Mears, C.; Fujiwara, M.; Jeannet, P.; Thorne, P.; Bodeker, G.; Haimberger, L.; Hervo, M.; Popp, C.; Romanens, G.; et al. Radiosondes show that after decades of cooling, the lower stratosphere is now warming. J. Geophys. Res. Atmos. 2018, 123, 12509–12522. [Google Scholar] [CrossRef] [Green Version]
- Sy, S.; Madonna, F.; Rosoldi, M.; Tramutola, E.; Gagliardi, S.; Proto, M.; Pappalardo, G. Sensitivity of trends to estimation methods and quantification of subsampling effects in global radiosounding temperature and humidity time series. Int. J. Climatol. 2020, 41, E1992–E2014. [Google Scholar] [CrossRef]
- Madonna, F.; Summa, D.; Di Girolamo, P.; Marra, F.; Wang, Y.; Rosoldi, M. Assessment of Trends and Uncertainties in the Atmospheric Boundary Layer Height Estimated Using Radiosounding Observations over Europe. Atmosphere 2021, 12, 301. [Google Scholar] [CrossRef]
- Whiteman, D.N.; Melfi, S.H.; Ferrare, R.A. Raman lidar system for the measurement of water vapor and aerosols in the Earth’s atmosphere. Appl. Opt. 1992, 31, 3068–3082. [Google Scholar] [CrossRef] [PubMed]
- Zhou, D.K.; Smith, W.L.; Cuomo, V.; Taylor, J.P.; Barnet, C.D.; Di Girolamo, P.; Pappalardo, G.; Larar, A.M.; Liu, X.; Newman, S.M.; et al. Retrieval validation during the European Aqua Thermodynamic Experiment. Q. J. R. Meteorol. Soc. 2007, 133, 203–215. [Google Scholar] [CrossRef]
- Pougatchev, N.; August, T.; Calbet, X.; Hultberg, T.; Oduleye, O.; Schlüssel, P.; Stiller, B.; Germain, K.S.; Bingham, G. IASI temperature and water vapor retrievals—Error assessment and validation. Atmos. Chem. Phys. 2009, 9, 6453–6458. [Google Scholar] [CrossRef] [Green Version]
- Loew, A.; Bell, W.; Brocca, L.; Bulgin, C.E.; Burdanowitz, J.; Calbet, X.; Donner, R.V.; Ghent, D.; Gruber, A.; Kaminski, T.; et al. Validation practices for satellite-based Earth observation data across communities. Rev. Geophys. 2017, 55, 779–817. [Google Scholar] [CrossRef] [Green Version]
- Finazzi, F.; Fassò, A.; Madonna, F.; Negri, I.; Sun, B.; Rosoldi, M. Statistical harmonization and uncertainty assessment in the comparison of satellite and radiosonde climate variables. Environmetrics 2019, 30, e2528. [Google Scholar] [CrossRef]
- Haimberger, L.; Tavolato, C.; Sperka, S. Homogenization of the Global Radiosonde Temperature Dataset through Combined Comparison with Reanalysis Background Series and Neighboring Stations. J. Clim. 2012, 25, 8108–8131. [Google Scholar] [CrossRef]
- Hersbach, H.; de Rosnay, P.; Bell, B.; Schepers, D.; Simmons, A.; Soci, C.; Abdalla, S.; Alonso-Balmaseda, M.; Balsamo, G.; Bechtold, P.; et al. Operational global reanalysis: Progress, future directions and synergies with NWP. ERA Rep. Ser. 2018, 27. [Google Scholar] [CrossRef]
- Hersbach, H.; Bell, B.; Berrisford, P.; Hirahara, S.; Horányi, A.; Muñoz-Sabater, J.; Nicolas, J.; Peubey, C.; Radu, R.; Schepers, D.; et al. The ERA5 Global Reanalysis. Q. J. R. Meteorol. Soc. 2020, 146, 1999–2049. [Google Scholar] [CrossRef]
- Madonna, F.; Tramutola, E.; Sy, S.; Serva, F.; Proto, M.; Rosoldi, M.; Gagliardi, S.; Amato, F.; Marra, F.; Fassò, A.; et al. The new Radiosounding HARMonization (RHARM) data set of homogenized radiosounding temperature, humidity and wind profiles with uncertainties. J. Geophys. Res. Atmos. 2022, 127, e2021JD035220. [Google Scholar] [CrossRef]
- Bodeker, G.E.; Bojinski, S.; Cimini, D.; Dirksen, R.J.; Haeffelin, M.; Hannigan, J.W.; Hurst, D.F.; Leblanc, T.; Madonna, F.; Maturilli, M.; et al. Reference upper-air observations for climate: From concept to reality. Bull. Am. Meteorol. Soc. 2016, 97, 123–135. [Google Scholar] [CrossRef]
- GCOS Reference Upper-Air Network (GRUAN)—The Climate Reference Network. Available online: https://www.gruan.org/ (accessed on 4 April 2022).
- BIPM. Le Système International d’Unités/The International System of Units (‘The SI Brochure’), 9th ed.; International Bureau of Weights and Measures: Paris, France, 2019; ISBN 978-92-822-2272-0. Available online: http://www.bipm.org/en/si/si_brochure/ (accessed on 4 April 2022).
- Dirksen, R.J.; Sommer, M.; Immler, F.J.; Hurst, D.F.; Kivi, R.; Vömel, H. Reference quality upper-air measurements: GRUAN data processing for the Vaisala RS92 radiosonde. Atmos. Meas. Tech. 2014, 7, 4463–4490. [Google Scholar] [CrossRef] [Green Version]
- Thorne, P.W.; Madonna, F.; Schulz, J.; Oakley, T.; Ingleby, B.; Rosoldi, M.; Tramutola, E.; Arola, A.; Buschmann, M.; Mikalsen, A.C.; et al. Making better sense of the mosaic of environmental measurement networks: A system-of-systems approach and quantitative assessment. Geosci. Instrum. Methods Data Syst. 2017, 6, 453–472. [Google Scholar] [CrossRef] [Green Version]
- Gaffen, D.J. Temporal inhomogeneities in radiosonde temperature records. J. Geophys. Res. 1994, 99, 3667–3676. [Google Scholar] [CrossRef]
- Parker, D.E.; Cox, D.I. Toward a consistent global climatological rawinsonde database. Int. J. Climatol. 1995, 15, 473–496. [Google Scholar] [CrossRef]
- Lanzante, J.R. Resistant, robust and non-parametric techniques for the analysis of climate data: Theory and examples, including applications to historical radiosonde station data. Int. J. Climatol. 1996, 16, 1197–1226. [Google Scholar] [CrossRef]
- Sherwood, S.; Lanzante, J.; Meyer, C. Radiosonde daytime biases and late 20th century warming. Science 2005, 309, 1556–1559. [Google Scholar] [CrossRef] [Green Version]
- Sherwood, S.C.; Nishant, N. Atmospheric changes through 2012 as shown by iteratively homogenised radiosonde temperature and wind data (IUKv2). Environ. Res. Lett. 2015, 10, 054007. [Google Scholar] [CrossRef]
- Haimberger, L.; Tavolato, C.; Sperka, S. Toward Elimination of the Warm Bias in Historic Radiosonde Temperature Records—Some New Results from a Comprehensive Intercomparison of Upper-Air Data. J. Clim. 2008, 21, 4587–4606. [Google Scholar] [CrossRef]
- Nash, J.; Oakley, T.; Vomel, H.; Wei, L.I. WMO Intercomparison of High Quality Radiosonde Systems Yangjiang, China, 12 July–3 August 2010. In WMO Instruments and Observing Methods; Report No. 107; World Meteorological Organization: Geneva, Switzerland, 2011; Available online: https://library.wmo.int/doc_num.php?explnum_id=9467 (accessed on 4 April 2022).
- Vaisala. Vaisala Radiosonde RS92-SGP. Available online: https://www.vaisala.com/sites/default/files/documents/RS92SGP-Datasheet-B210358EN-F-LOW.pdf (accessed on 4 April 2022).
- Vaisala. Vaisala Radiosonde RS41 Measurement Performance. Available online: https://www.vaisala.com/sites/default/files/documents/WEA-MET-RS41-Performance-White-paper-B211356EN-B-LOW-v3.pdf (accessed on 4 April 2022).
- Jauhiainen, H.; Survo, P.; Lehtinen, R.; Lentonen, J. Radiosonde RS41 and RS92 Key Differences and Comparison Test Results in Different Locations and Climates. In Proceedings of the TECO-2014, WMO Technical Conference on Meteorological and Environmental Instruments and Methods of Observations, Saint Petersburg, Russia, 7–9 July 2014. [Google Scholar]
- Survo, P.; Lehtinen, R.; Kauranen, J. SI traceability of Vaisala Radiosonde RS41 Sounding Data—Calibration and Uncertainty Analysis. In Proceedings of the TECO-2014, WMO Technical Conference on Meteorological and Environmental Instruments and Methods of Observations, Saint Petersburg, Russia, 7–9 July 2014. [Google Scholar]
- Dirksen, R.J.; Bodeker, G.E.; Thorne, P.W.; Merlone, A.; Reale, T.; Wang, J.; Hurst, D.F.; Demoz, B.B.; Gardiner, T.D.; Ingleby, B.; et al. Managing the transition from Vaisala RS92 to RS41 radiosondes within the Global Climate Observing System Reference Upper-Air Network (GRUAN): A progress report. Geosci. Instrum. Methods Data Syst. 2020, 9, 337–355. [Google Scholar] [CrossRef]
- Von Rohden, C.; Sommer, M.; Naebert, T.; Motuz, V.; Dirksen, R.J. Laboratory characterisation of the radiation temperature error of radiosondes and its application to the GRUAN data processing for the Vaisala RS41. Atmos. Meas. Tech. 2022, 15, 383–405. [Google Scholar] [CrossRef]
- Vaisala. Comparison of Vaisala Radiosondes RS41 and RS92. Available online: https://www.vaisala.com/sites/default/files/documents/RS-Comparison-White-Paper-B211317EN.pdf (accessed on 4 April 2022).
- Jensen, M.P.; Holdridge, D.J.; Survo, P.; Lehtinen, R.; Baxter, S.; Toto, T.; Johnson, K.L. Comparison of Vaisala radiosondes RS41 and RS92 at the ARM Southern Great Plains site. Atmos. Meas. Tech. 2016, 9, 3115–3129. [Google Scholar] [CrossRef] [Green Version]
- Kawai, Y.; Katsumata, M.; Oshima, K.; Hori, M.E.; Inoue, J. Comparison of Vaisala radiosondes RS41 and RS92 launched over the oceans from the Arctic to the tropics. Atmos. Meas. Tech. 2017, 10, 2485–2498. [Google Scholar] [CrossRef] [Green Version]
- Sun, B.; Reale, T.; Schroeder, S.; Pettey, M.; Smith, R. On the Accuracy of Vaisala RS41 versus RS92 Upper-Air Temperature Observations. J. Atmos. Ocean. Technol. 2019, 36, 635–653. [Google Scholar] [CrossRef]
- Jing, X.; Shao, X.; Liu, T.-C.; Zhang, B. Comparison of GRUAN RS92 and RS41 Radiosonde Temperature Biases. Atmosphere 2021, 12, 857. [Google Scholar] [CrossRef]
- Mona, L.; Cornacchia, C.; D’Amico, G.; Di Girolamo, P.; Pappalardo, G.; Pisani, G.; Summa, D.; Wang, X.; Cuomo, V. Characterization of the variability of the humidity and cloud fields as observed from a cluster of ground-based lidar systems. Q. J. R. Meteorol. Soc. 2007, 133, 257–271. [Google Scholar] [CrossRef]
- Rosoldi, M.; Gumà Claramunt, P.; Madonna, F.; Amodeo, A.; Binietoglou, I.; D’Amico, G.; Giunta, A.; Mona, L.; Papagiannopoulos, N.; Pappalardo, G. Study of thin clouds at CNR-IMAA Atmospheric Observatory (CIAO). Ann. Geophys. 2013, 56. [Google Scholar] [CrossRef]
- Madonna, F.; Burlizzi, P.; Giunta, A.; Binietoglou, I.; Perrone, M.R.; Pappalardo, G. Validation of COSMIC Water Vapor Profiles Using Raman Lidar Measurements Performed at CIAO. In Proceedings of the SPIE Remote Sensing, Volume 8182, Lidar Technologies, Techniques, and Measurements for Atmospheric Remote Sensing VII, Prague, Czech Republic, 19–22 September 2011. [Google Scholar] [CrossRef]
- Madonna, F.; Kivi, R.; Dupont, J.-C.; Ingleby, B.; Fujiwara, M.; Romanens, G.; Hernandez, M.; Calbet, X.; Rosoldi, M.; Giunta, A.; et al. Use of automatic radiosonde launchers to measure temperature and humidity profiles from the GRUAN perspective. Atmos. Meas. Tech. 2020, 13, 3621–3649. [Google Scholar] [CrossRef]
- Merlone, A.; Lopardo, G.; Sanna, F.; Bell, S.; Benyon, R.; Bergerud, R.; Bertiglia, F.; Bojkovski, J.; Böse, N.; Brunet, M.; et al. The MeteoMet project—Metrology for meteorology: Challenges and results. Meteorol. Appl. 2015, 22, 820–829. [Google Scholar] [CrossRef] [Green Version]
- Merlone, A.; Sanna, F.; Beges, G.; Bell, S.; Beltramino, G.; Bojkovski, J.; Brunet, M.; del Campo, D.; Castrillo, A.; Chiodo, N.; et al. The MeteoMet2 project—Highlights and results. Meas. Sci. Technol. 2018, 29, 025802. [Google Scholar] [CrossRef] [Green Version]
- Merlone, A.; Al-Dashti, H.; Faisal, N.; Cerveny, R.S.; AlSarmi, S.; Bessemoulin, P.; Brunet, M.; Driouech, F.; Khalatyan, Y.; Peterson, T.C.; et al. Temperature extreme records: World Meteorological Organization metrological and meteorological evaluation of the 54.0 °C observations in Mitribah, Kuwait and Turbat, Pakistan in 2016/2017. Int. J. Climatol. 2019, 39, 5154–5169. [Google Scholar] [CrossRef]
- Preston-Thomas, H. The International Temperature Scale of 1990 (ITS-90). Metrologia 1990, 27, 3. [Google Scholar] [CrossRef]
- Vaisala. DigiCORA Sounding System MW41. Available online: https://www.vaisala.com/sites/default/files/documents/B211221EN-F-Brochure.pdf (accessed on 18 November 2021).
- Vaisala. Vaisala Sounding Processing Subsystem SPS311G. Available online: https://www.vaisala.com/sites/default/files/documents/WEA-MET-SPS311-Datasheet-B210492EN.pdf (accessed on 4 April 2022).
- Vaisala. Vaisala Ground Check Set GC25. Available online: https://www.vaisala.com/en/search?k=gc25&items_per_page=20&countyAddresmqihz= (accessed on 20 August 2021).
- Vaisala. Ground Check Device RI41/RI41-B. Available online: https://www.vaisala.com/sites/default/files/documents/RI41-Datasheet-B211322EN.pdf (accessed on 4 April 2022).
- Dr. Schulz & Partner GmbH. Available online: http://www.drschulz.com (accessed on 20 August 2021).
- Immler, F.; Miloshevich, L. GRUAN Task Team on Radiosondes. Pre-Launch Procedures for Vaisala RS92 Radiosonde Observations for GRUAN. Technical Document GRUAN-TD-5. Available online: https://gruan.files.wordpress.com/2011/06/gruan-td-5_rs92-pre-launch_v022.pdf (accessed on 4 April 2022).
- Vaisala. 2010–12|Revised Solar Radiation Correction Table RSN2010|T, RS92 Data Continuity. Available online: https://www.vaisala.com/en/sounding-data-continuity (accessed on 4 April 2022).
- Kowal, A.; Merlone, A.; Sawiński, T. Long-term stability of meteorological temperature sensors. Meteorol. Appl. 2020, 27, e1795. [Google Scholar] [CrossRef] [Green Version]
Publisher’s Note: MDPI stays neutral with regard to jurisdictional claims in published maps and institutional affiliations. |
© 2022 by the authors. Licensee MDPI, Basel, Switzerland. This article is an open access article distributed under the terms and conditions of the Creative Commons Attribution (CC BY) license (https://creativecommons.org/licenses/by/4.0/).