Article

Sources and Variability of Plutonium in Chinese Soils: A Statistical Perspective with Moving Average

1
State Key Laboratory of Nuclear Physics and Technology, School of Physics, Peking University, Beijing 100871, China
2
Institute of Nuclear Physics and Chemistry, China Academy of Engineering Physics, Mianyang 621900, China
*
Authors to whom correspondence should be addressed.
Atmosphere 2022, 13(5), 769; https://doi.org/10.3390/atmos13050769
Submission received: 15 April 2022 / Revised: 30 April 2022 / Accepted: 1 May 2022 / Published: 10 May 2022

Abstract

:
We investigated the different sources and their corresponding impact areas of Pu in Chinese surface soils to illustrate the state-of-the-art of the sources, levels and distributions of 240 Pu/ 239 Pu atom ratios as well as 239 + 240 Pu activity concentrations in China. For the first time a moving average strategy in combination with statistical analysis was employed to partition geographic areas in China based on the reported 240 Pu/ 239 Pu atom ratio and 239 + 240 Pu concentration data from public literature. During the partitioning, the median (MED) of the dataset was basically employed as a criteria in place of the commonly used arithmetic average (AM). Concisely, three areas were partitioned according to the different influences of Pu from the Lop Nor (LNTS) and Semipalatinsk (STS) test sites and the global fallout. The partitioned Ternary area (80° E–105° E, 35° N–50° N) was supposed to have multiple sources of Pu including the STS and LNTS besides the global fallout, which was characterized with slightly lower 240 Pu/ 239 Pu atom ratios (MED = 0.174) as well as elevated 239 + 240 Pu concentrations (MED = 0.416 mBq/g). Meanwhile, the Binary area (35° N–45° N, 100° E–115° E) was considered to have received the extra contribution from the high-yield nuclear tests at the LNTS besides the global fallout, resulting in the highest 240 Pu/ 239 Pu atom ratios (MED = 0.200) across China. The remaining area was marked as the Unitary area, where it only received the exclusive contribution of global fallout. Furthermore, through the statistical analysis of the 240 Pu/ 239 Pu data in the Unitary area, we recommended a value of 0.186 ± 0.021 (AM ± SD) as a representative or area-specific 240 Pu/ 239 Pu atom ratio baseline to characterize the global fallout derived Pu in Chinese soils.

1. Introduction

Plutonium (Pu) is a crucial actinide which is basically produced by nuclear activities. The common known ways of Pu entering into the environment include nuclear weapon detonations, releases or leakages from nuclear reprocessing facilities and nuclear power plant accidents [1,2]. Among these origins, atmospheric nuclear weapon tests conducted in the last century were the most contributive and presented worldwide deposition of Pu into the environment, which was the well-known global fallout. According to the UNSCEAR [2], there were around 2000 nuclear weapon tests including 543 atmospheric tests carried out in the last century that released around 11 PBq 239 + 240 Pu.
In the environment, the two typical Pu isotopes, i.e., 239 Pu (T 1 / 2 = 24,110 y) and the 240 Pu (T 1 / 2 = 6563 y) exist stably due to their long half-lives. On the one hand, Pu was highly radiotoxic and has the opportunity to be transferred from environmental matrices to the human body through various pathways such as the inhalation of suspended aerosols or ingestion from food chains [3,4]. Hence, from the perspective of public health and radioactivity assessment, having a general knowledge of the level and distribution of Pu in the environment is imperative. On the other hand, since the isotopic composition of Pu is source dependent, the related atom ratios such as 240 Pu/ 239 Pu could be used as characteristic fingerprints to discriminate different radioactive sources even after decades. The isotopic ratios of Pu are crucial especially when there is urgent need for source term analysis and contamination assessment if a nuclear accident happens. Lessons from the Fukushima Daiichi Nuclear Power Plant (FDNPP) accident have highlighted the significance of building a robust and representative baseline database in preparedness for such possible scenarios [5,6,7].
In China, Pu in the terrestrial environment was dominantly from the global fallout. Meanwhile, due to the nuclear tests at the Lop Nor test site (LNTS) in China and the neighboring Semipalatinsk test site (STS) of the former Soviet Union, these two sites also caused certain contribution of Pu to the Chinese terrestrial environment while their influences might be regional [8,9,10]. Facilitated by the advancement in analytical techniques and the growing attention on radioactivity safety, studies on Pu in the Chinese environment have been rapidly mounting in the recent two decades. To date, different teams and/or researchers have endeavored to investigate the sources, distributions and behaviors of Pu in the Chinese environment. For example, the team of Guo et al. [8,9,11] from Peking University systematically collected soil samples in the upwind and downwind of the LNTS for Pu analysis to study its impact; while in recent years Hou and his coworkers made significant contributions to enlarge the database of Pu concentration and isotopic composition in China by analyzing Pu in soils collected from the Northwest, North and East China [10,12,13].
Despite the plentiful and increasing data of Pu in Chinese soil samples, a statistical analysis of the determined data has been of less concern. Most studies were scattered which focused on certain sampling sites or regions, while a general and statistical view of the state-of-the-art the Pu in Chinese soils is required to illustrate the variability of Pu. Current problems that should be solved included the rough understanding of the impact areas of STS and/or LNTS as well as the lack of representative 240 Pu/ 239 Pu atom ratio baseline in different areas. In the last century, Krey et al. [14] and Kelley et al. [15] compiled the 240 Pu/ 239 Pu atom ratios in soils from worldwide. They proposed the arithmetic mean value of 240 Pu/ 239 Pu atom ratio for 30° S–71° N was 0.180 ± 0.014 (2 σ ), which was hereafter referred by subsequent researchers as the typical global fallout values. Nevertheless, this value was based on a rather small number of samples and only one dataset in China has been compiled. A more representative 240 Pu/ 239 Pu atom ratio to characterize the global fallout in China is imperative. So far, only Huang et al. [16,17] have recently examined the data of 240 Pu/ 239 Pu atom ratio and 239 + 240 Pu concentration in Chinese soils from 34 different literature sources to investigate the spatial distribution of Pu. However, their geographical partitioning was rather complicated which resulted in seven natural regions in China, while the weighted average of 240 Pu/ 239 Pu ratios was used as the only criteria for inter-comparison between regions. Consequently, it is inconvenient and to some extent inaccurate to illustrate representative baseline in different areas in China.
The main goal of this work is to investigate the variability of the 240 Pu/ 239 Pu atom ratio and 239 + 240 Pu activity concentration in surface soils in China to study the sources and distribution of Pu, especially to refine the impact areas of STS and LNTS besides the global fallout. In addition, the area-specific 240 Pu/ 239 Pu atom ratios were evaluated by means of statistics to provide a representative baseline of Pu in Chinese terrestrial environment.

2. Materials and Methods

2.1. Data Collection

In total, there are 383 undisturbed surface soil samples compiled from 20 published works referring to Pu in the Chinese environment [8,9,10,11,12,18,19,20,21,22,23,24,25,26,27,28,29,30,31,32]. The corresponding soil sampling sites were illustrated in Figure 1. Both of the 240 Pu/ 239 Pu atom ratios and 239 + 240 Pu activity concentrations in the abovementioned references were collected. Due to the lack of general criteria for the “surface soil” in different studies, we employed the Pu data of soils which were within a 10 cm depth. The final collected data sizes of the 240 Pu/ 239 Pu dataset and the 239 + 240 Pu dataset were 374 and 248, respectively. More information on the compiled surface soils are available in the Supplementary Material.

2.2. Basic Statistics

The collected datasets were firstly sorted from the smallest to the biggest, respectively. For illustration, the set { x 1 , x 2 , , x i , , x n } is the data of either 240 Pu/ 239 Pu atom ratio or 239 + 240 Pu concentration (mBq/g), and n is the number of data. Different basic statistics were employed to characterize the datasets. These included the arithmetic mean (AM) and the standard deviation (SD), which was calculated according to Equations (1) and (2), respectively.
AM ( x ) = i = 1 n x i n
SD ( x ) = i = 1 n ( x i AM ( x ) ) 2 n 1 .
Besides, the median (MED) and the lower and upper percentiles (LP and UP) were calculated as Equations (3)–(5), respectively.
MED ( x ) = x ( n + 1 ) / 2 , for n is odd x n / 2 + x ( n + 1 ) / 2 2 , for n is even
LP ( x ) = MED ( { x i MED ( x ) } )
UP ( x ) = MED ( { x i MED ( x ) } ) .

2.3. Statistical Analysis

Several statistical analyses were conducted during data processing because different statistical methods have certain prerequisites. The non-parametric rank sum test was carried out between Pu data from two regions to check their differences. For three-group comparison when comparing global fallout Pu data distribution in the different latitude bands, the Kruskal–Wallis test was used. Furthermore, for data groups which satisfied the homogeneity in variances, parametric tests including the student’s t test and the one-way ANOVA were employed to further compare the differences among the means of two and/or more data groups (specifically, including the comparison between the dataset of Ternary and Unitary areas, and the dataset of different latitude bands). Besides, we calculated the rank correlation coefficient, i.e., Kendall’s τ between the 239 + 240 Pu concentration and 240 Pu/ 239 Pu atom ratio datasets in the Ternary and Unitary area to examine the contribution of STS and LNTS.

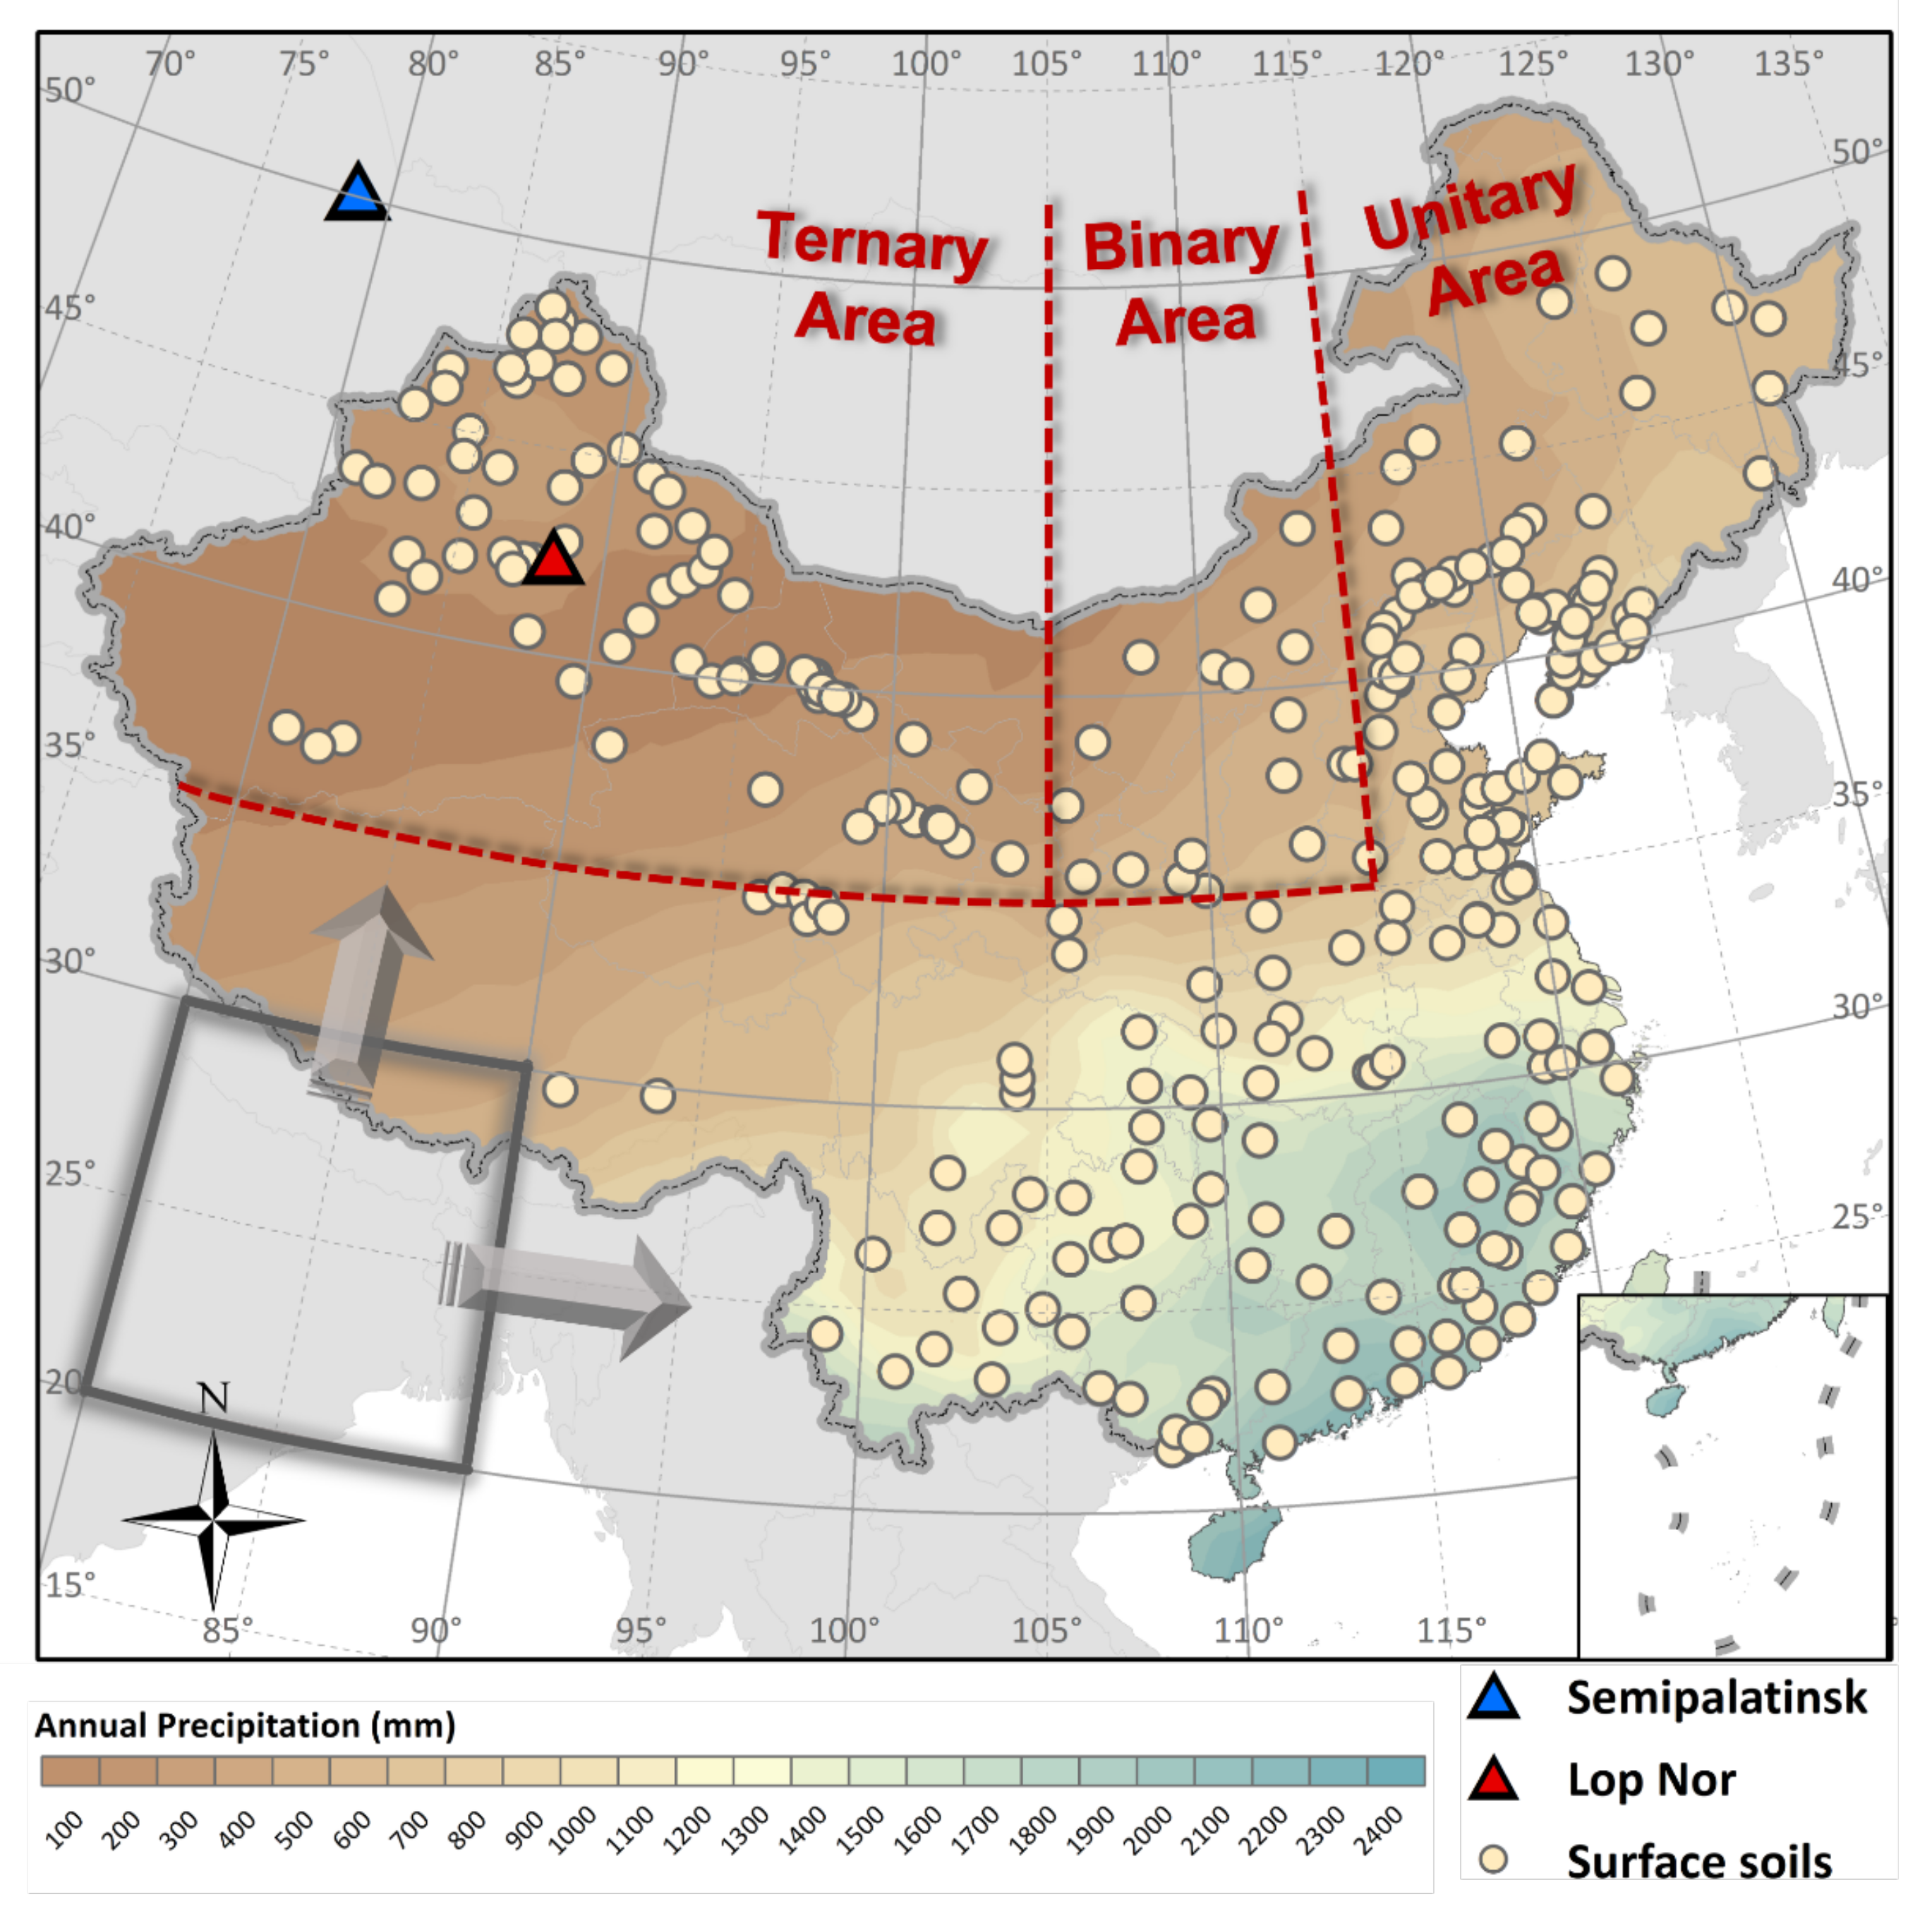
2.4. Geographical Partitioning and Visualization

The geographical partitioning was realized with the spatial distribution of the 240 Pu/ 239 Pu atom ratio dataset based on the strategy of Moving Average. Since the sampling sites scattered across the 20° N–50° N region. The partitioning proceeds via moving a window that was set 10° in both latitudinal and longitudinal direction as Figure 1 illustrated. The window started at (20° N, 80° E), stepped through the area at the same latitudinal range (20° E–30° E) with a stepping length of 5°. The window was then moved by a length of 5° in the longitudinal direction. And the above procedure of the latitudinal moving repeated. The width and the stepping length of the window were chosen for the sake of guaranteeing enough data in each window for statistical analysis meanwhile reducing redundant shots with too many repeated records. By moving the window through 80° E–130° E in each latitude band, we obtained overall 37 successive shots of regions. Furthermore, three shots with less than ten of 240 Pu/ 239 Pu data were excluded to guarantee the robustness of the statistical analysis. In fact, these shots were all at or outside the edge of Chinese territory, which has few impacts on accessing the variability of 240 Pu/ 239 Pu across China. The remaining 34 shots were presented in Figure 2. Every small colored rectangle in the subfigures represented a shot, and the titles upon the subfigures represented the coordinates of the target shot’s (small white rectangle with dashed line) lower left corner. For example, the title of (40° N, 80° E) for subfigure (1) indicated the corresponding region for the target shot was 20° N–30° N, 95° N–105° E (as the width of the window was 10° in both latitudinal and longitudinal direction).
Based on these shots, we further visualized the variation of 240 Pu/ 239 Pu atom ratio in different areas. In detail, for every shot, the MED of 240 Pu/ 239 Pu atom ratio data in the corresponding region was calculated. As in Figure 2, the divergences among the MED of every target shot (the shot with dashed line in each subfigure) with another 33 shots were represented with different colors. Besides, in each of the subfigures, rank sum tests between the target shot and the other 33 shots were conducted. If the test result was significant (at 95% level), the line of the other shot in comparison was bolded.

3. Results and Discussion

3.1. General Sources of Pu in Chinese Soils

In the Chinese soils, Pu was primarily derived from the global fallout, while the STS and LNTS might present regional contribution. Extremely low 240 Pu/ 239 Pu ratios down to 0.08 in some soils and archived lake sediments in northwest China were anomalous compared with the characteristic ratio of 0.18 for the global fallout [8,33]. Besides, Bu et al. [8] also found the deposition inventory of 239 + 240 Pu in the Jiuquan region in the downwind of LNTS were significantly higher (up to 546 Bq/m 2 ) than the global fallout. These findings indicated the regional influence of LNTS in its downwind direction [8,9]. Recently, Zhao et al. [10] reported distinctly lower 240 Pu/ 239 Pu atom ratios of 0.118–0.133 and higher 239 + 240 Pu/ 137 Cs activity ratios of 0.065–0.215 compared to the global fallout values in soil samples from the northwest part of Xinjiang Province in China. Because these regions are located in the upwind direction of the LNTS, the extra burden of Pu besides the global fallout was most likely from the STS, which were inferred to be transported by the west and northwest wind through the river valley among mountains in the Northern Xinjiang region [10].
Although the general source terms of Pu in Chinese soils have been well recognized, the knowledge about the specific impact areas of different sources was rather rough. In order to obtain a schematic view of the sources, levels and distributions of Pu in Chinese soils, we partitioned three areas across China based on the use of moving average and statistics. For simplicity, three areas were partitioned and were marked as the Ternary area, the Binary area and the Unitary area according to the mixing of different source terms of Pu. Arguments on the reasonability for partitioning of these three areas as well as the statistics of the Pu data within each area were discussed as follows.

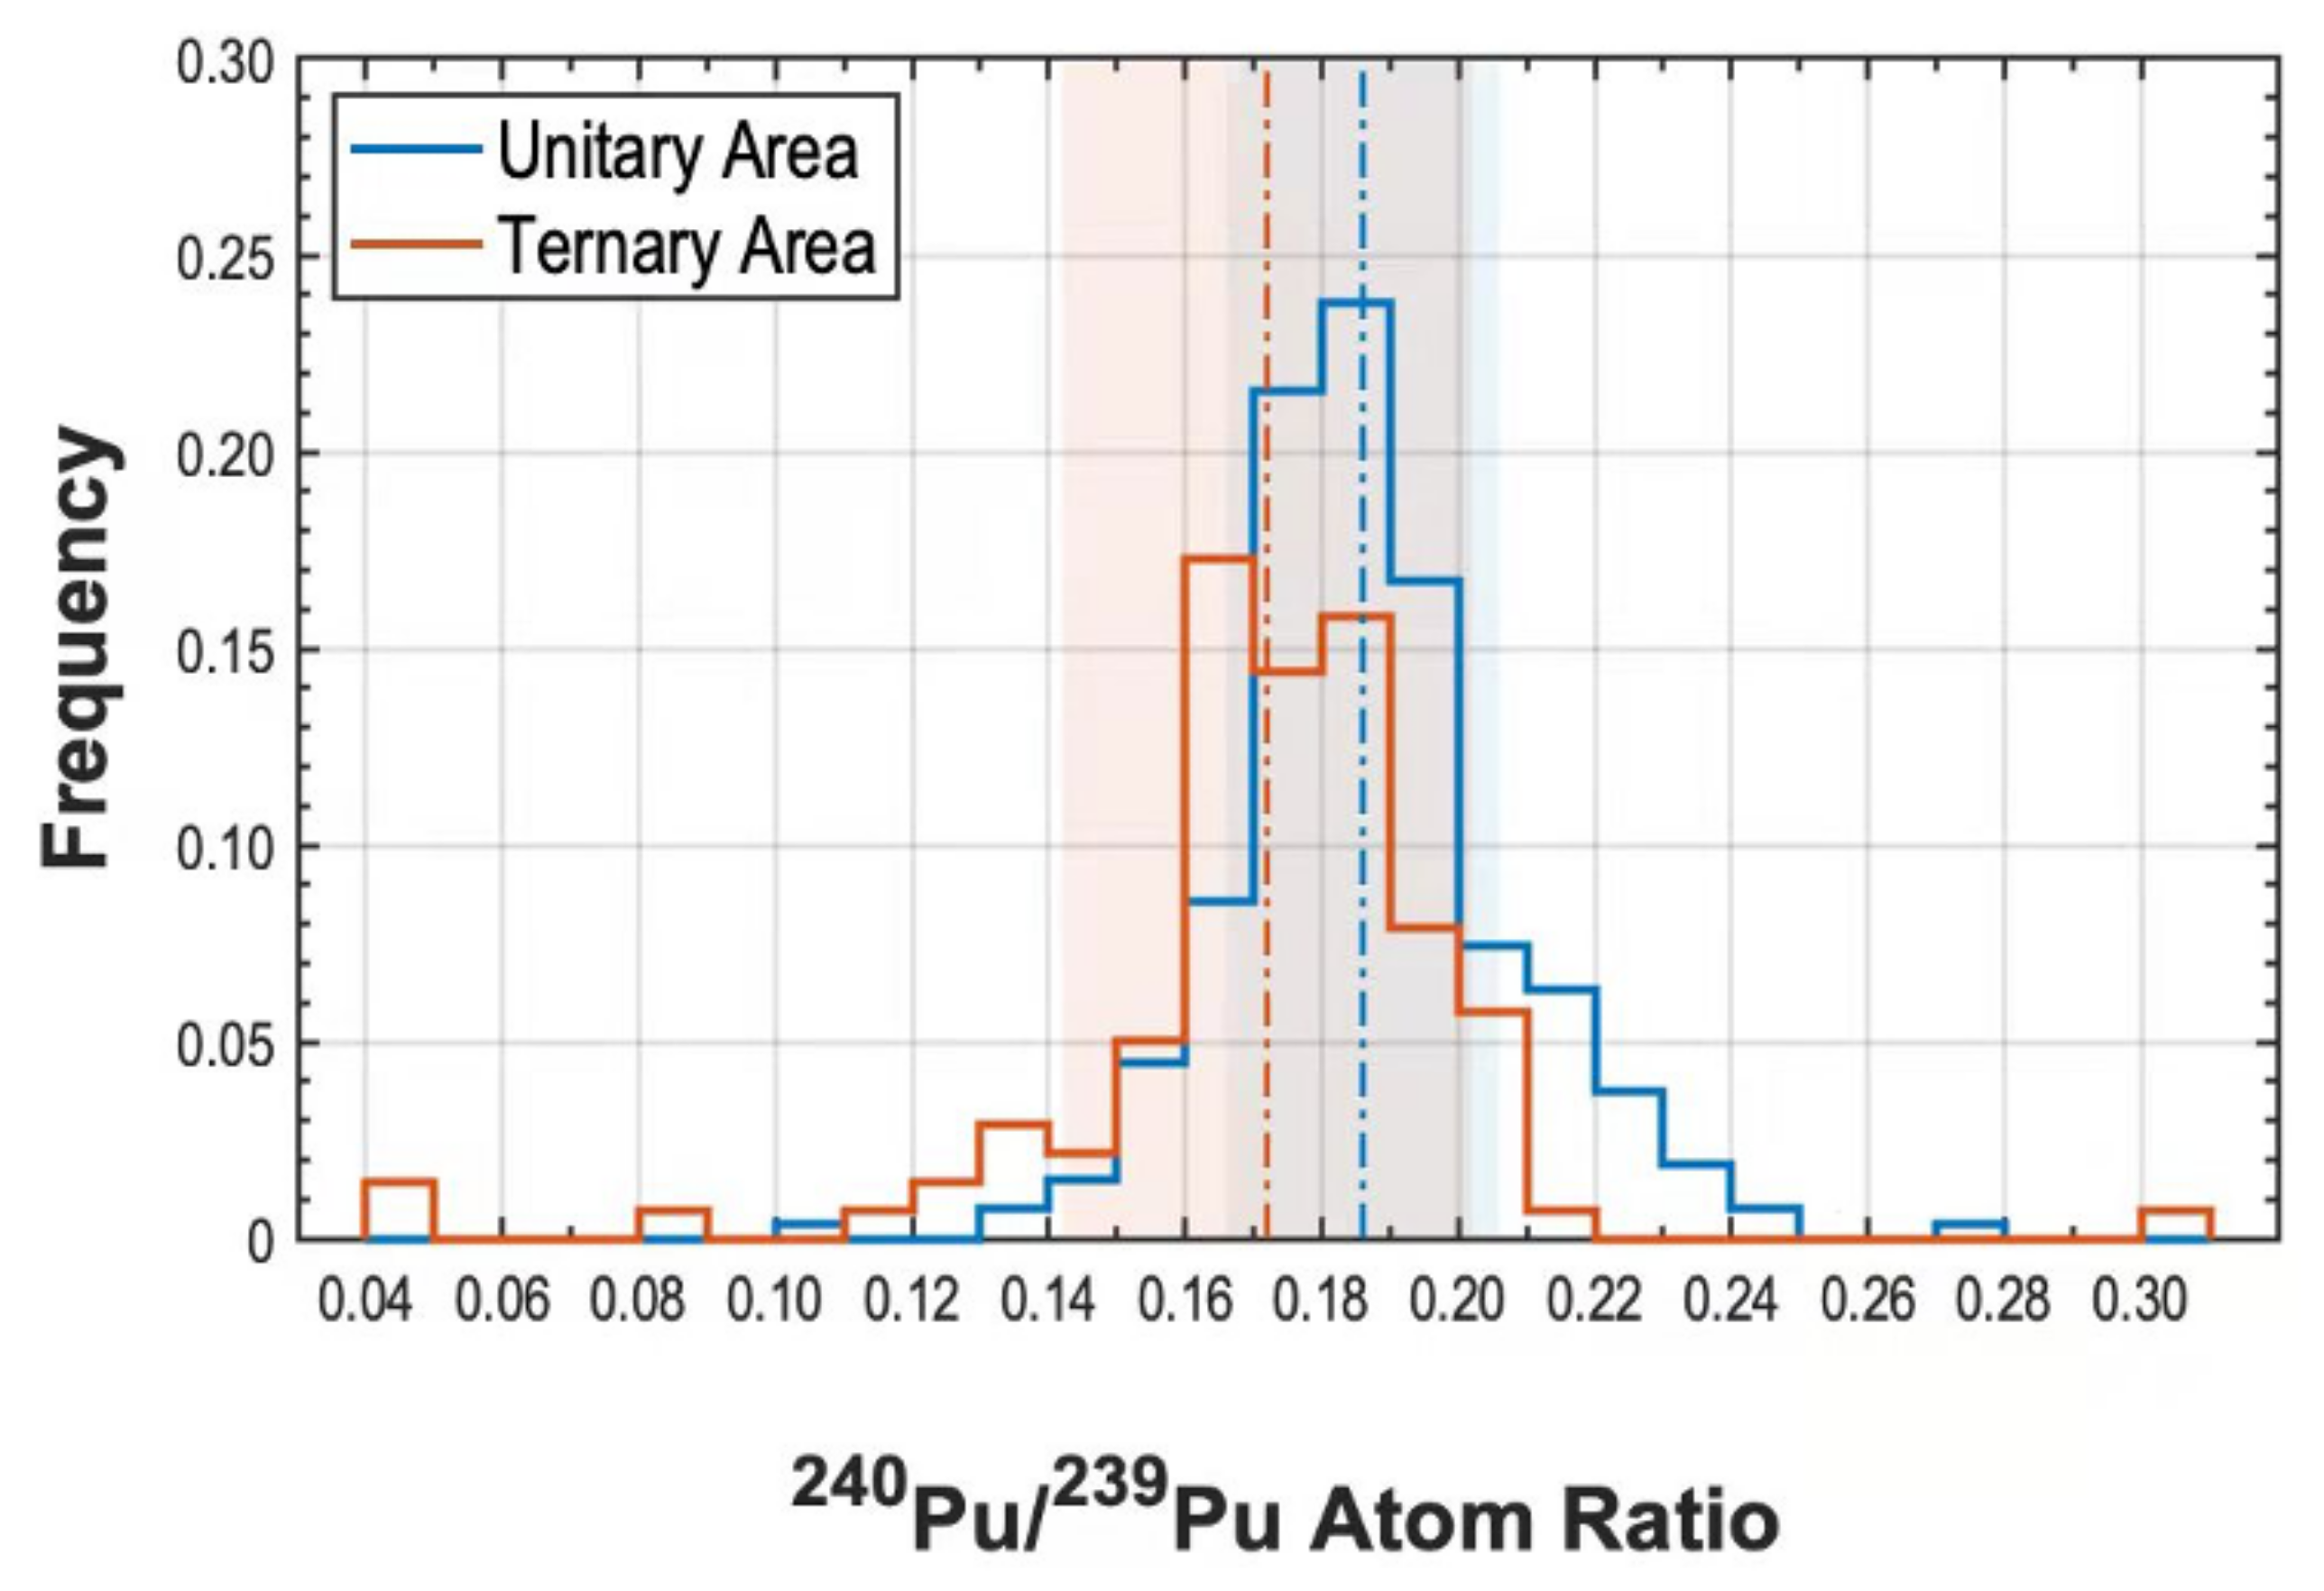
3.2. The Ternary Area

3.2.1. Multiple Influences of the STS, LNTS and the Global Fallout
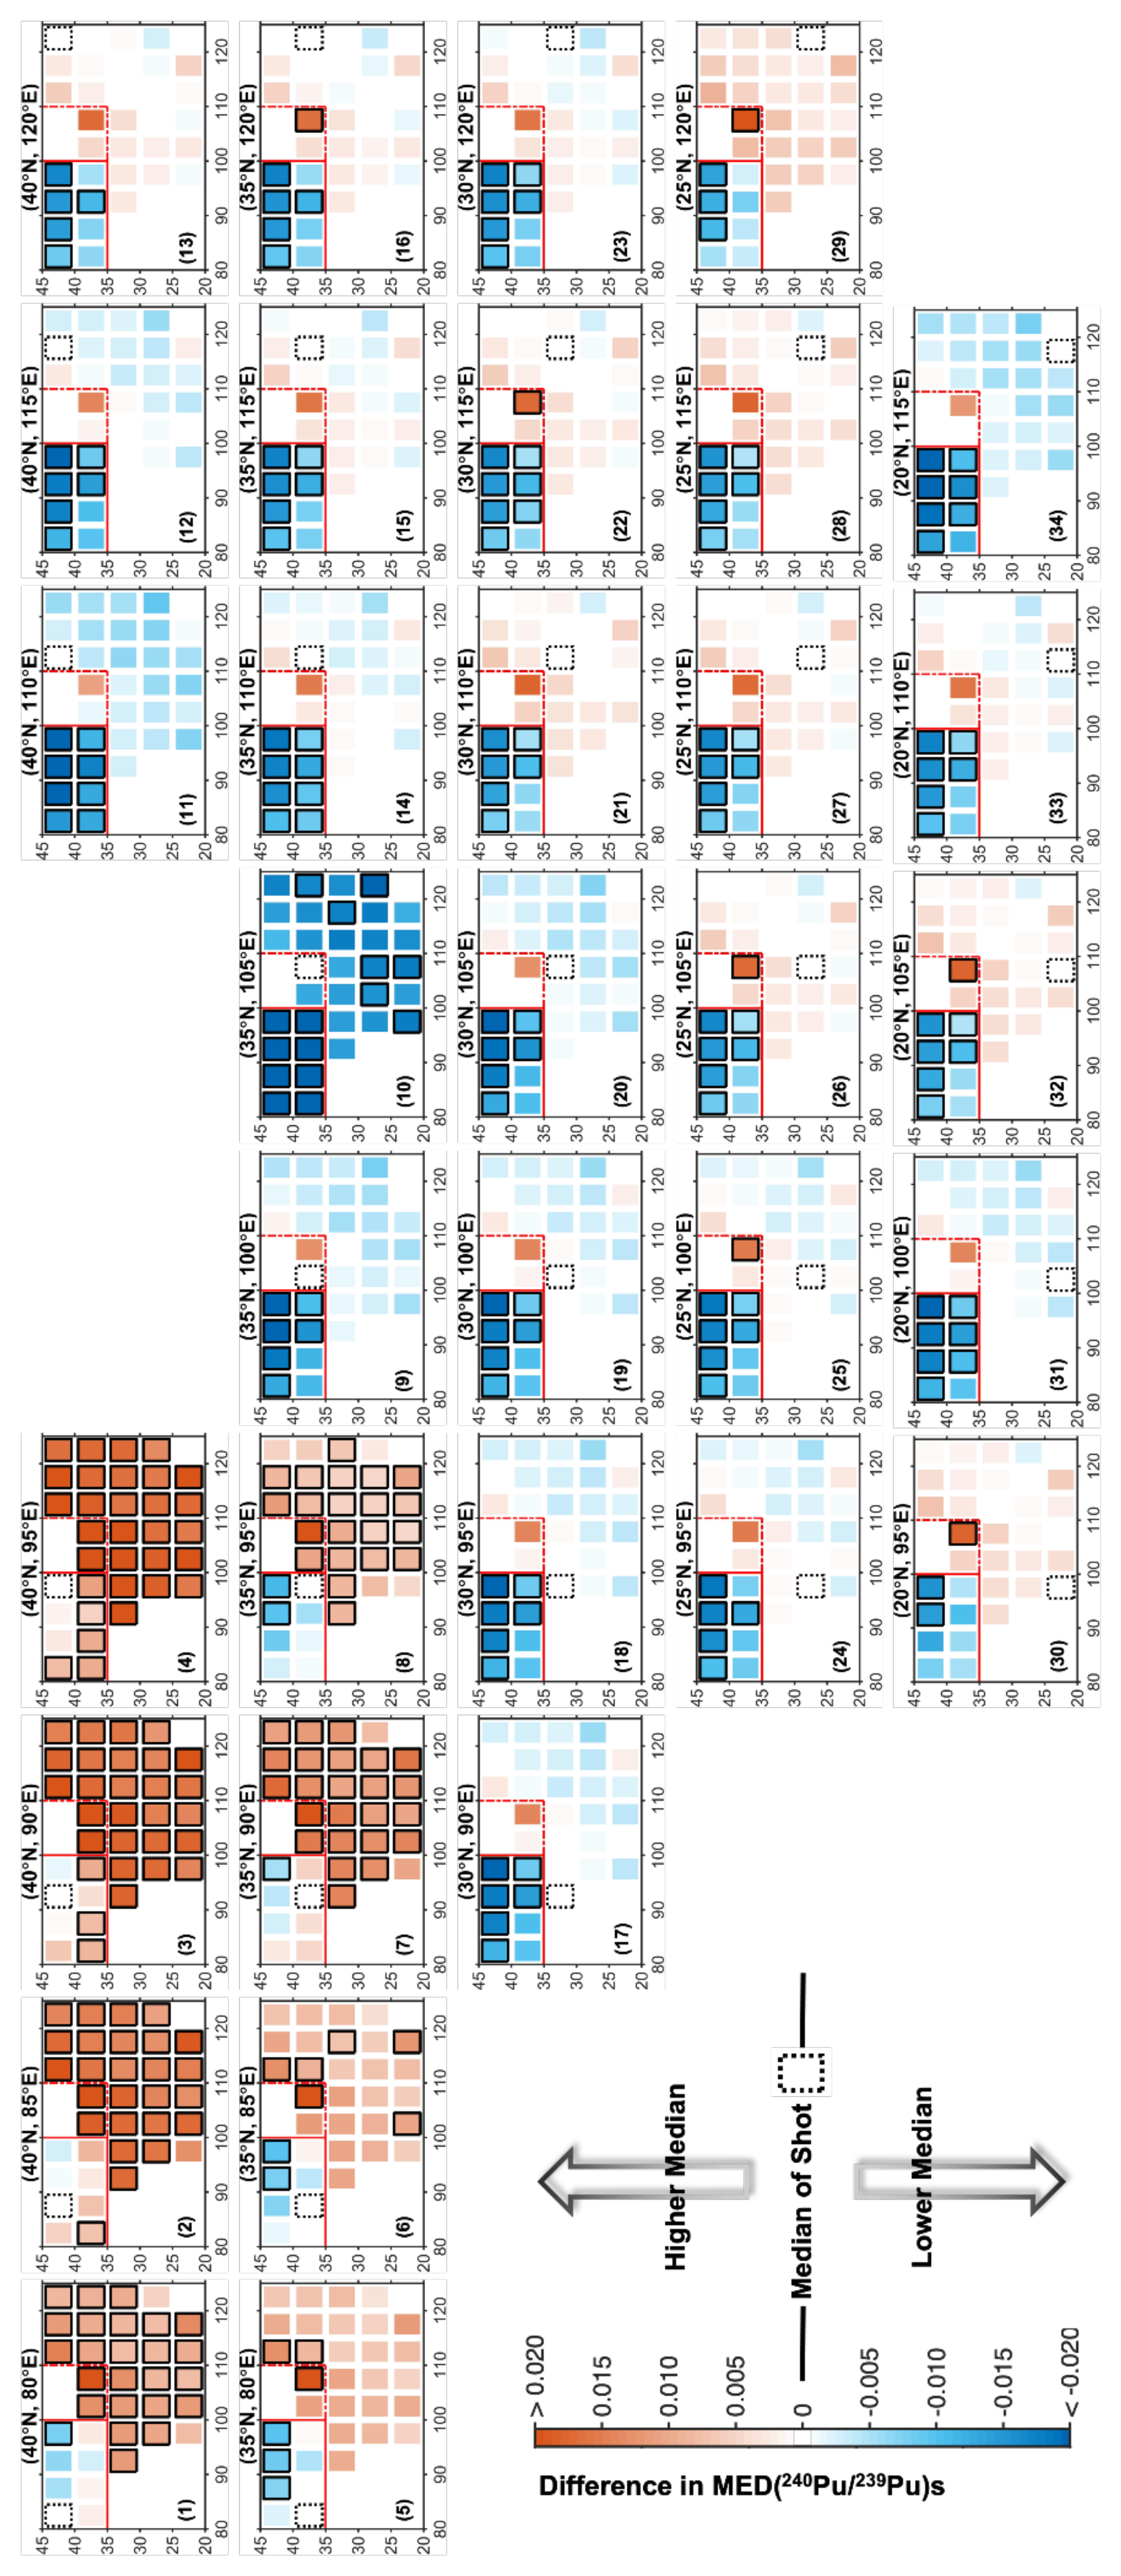
The STS of the former Soviet Union is located only about 700 km northwest of the north part of Xinjiang Province, China. And 86 air and 30 surface nuclear tests were conducted in the STS during the period of 1949–1962 with a total yield of 5.89 Mt [2]. The typical 240 Pu/ 239 Pu atom ratios in the close-in fallout at the SNTS were reported to be 0.025–0.072 [34]. Regarding the LNTS, twenty-two atmospheric nuclear tests were conducted between 1964 and 1980 with wide variation of yields from 0.02 Mt to 4 Mt [2].
Wu et al. [33] observed extremely low 240 Pu/ 239 Pu (0.103 ± 0.010) in the deep layer of the sediment in the Sugan Lake, which is located in the 500 km downwind direction of the LNTS. Beside, Dong et al. [11] concluded that the influence of the LNTS in the upwind region were negligible based on their analyzing of soil samples from 200–400 km northwest of the LNTS. However, in the 250 km northwest of LNTS, which was also the upwind direction of the LNTS meanwhile the downwind direction of the STS, anomalous Pu ( 240 Pu/ 239 Pu = 0.103 ± 0.010) in the well-preserved lake sediment has been detected by Liao et al. [35]. Similarly, Zhao et al. [10] also found distinctly lower 240 Pu/ 239 Pu atom ratios of 0.118-0.133 in the upwind region of the LNTS compared the global fallout. These studies indicated the northwest part of China has received the deposition of Pu from both the STS and the LNTS, while the influence of the LTS most likely occurred in the downwind LNTS. Since both of the STS and the LNTS have varied and similarly low 240 Pu/ 239 Pu atom ratios, further identifying the separate contribution of the STS and LNTS from a given sample might be difficult. As an alternative, the mixing impact of STS and LNTS besides the global fallout background was discussed.
In order to identify the influence area of STS and LNTS in the Chinese soils, we presented the variability of the MED( 240 Pu/ 239 Pu) in Figure 2. The MED and AM ± SD for each shot was provided in the Table A1 and Table A2. We noted that the MED instead of the AM of the 240 Pu/ 239 Pu dataset in each of the shot was used because MED is generally more representative for an unknown data distribution. The following features of geographical variability of the 240 Pu/ 239 Pu atom ratios in Chinese surface soils were observed:
  • As in Figure 2(1)–(8), the MED( 240 Pu/ 239 Pu) of the eight target shots (black dashed line) were all lower than the other 26 shots, illustrating the MED( 240 Pu/ 239 Pu) in the corresponding area were systematically lower that other areas of China;
  • The rank sum tests were conducted between the 240 Pu/ 239 Pu datasets in each of the eight target shot with those in the other shots. As in Figure 2(1)–(8), for each of the eight shots, there always exited other shots that have different 240 Pu/ 239 Pu data distributions apart from the eight shots. Especially in Figure 2(4), most of the other 26 shots were significantly different from the corresponding target shots.
Therefore, both the MED and the data statistical distribution of the 240 Pu/ 239 Pu in the eight shots in Figure 2(1)–(8) were distinct in comparison with the other 26 shots, indicating that in the eight shot represented areas there might be different sources of Pu compared with other regions that had relatively low 240 Pu/ 239 Pu atom ratios. Geographically, these eight shots represented the 80° E–105° E, 35° N–50° N area which is located in the northwest of China. As mentioned above, the source term analysis suggested that the contributions of STS and the LNTS were the mostly likely reasons for the anomalous low 240 Pu/ 239 Pu atom ratios in this region besides the global fallout. Therefore, we supposed the 35° N–50° N, 80° E–105° E region in China has received multiple contributions of Pu from the STS, LNTS and the global fallout, and we characterized this area as the “Ternary area” to represent the three mixing sources of Pu.
Few works have systematically investigated the impact area of STS and LNTS in a Chinese environment as individual studies only provided scattered data. Only Huang et al. [16,17] reviewed the literature reports of 240 Pu/ 239 Pu and 239 + 240 Pu in the Chinese environment. However, they conducted geographical partitioning basically in accordance with traditional administrative division, which was rather empirical and might be redundant. In total, seven partitions (regions) were set and within each region the weighted averaged Pu datasets were calculated as clues to discriminate different sources of Pu among different regions. Besides, they further partitioned the Northwest China region into two parts, i.e., the East Xi’ning part and the West Xi’ning part due to the 240 Pu/ 239 Pu in these two parts were distinct. As illustrated in Figure 2, our results showed that the (35° N, 105° E) might be the watershed of the 240 Pu/ 239 Pu atom ratios in Chinese surface soils since the lower ratio data mainly occurred northwest of this location. Interestingly, this conclusion is similar to that of Huang et al. [16] as they consider the Xińing as a cut-off, which had a coordinate of (36.6° N, 101.8° E), while our partitioning was much more concise.

3.2.2. Distribution of Pu in the Ternary Area

Lower 240 Pu/ 239 Pu Atom Ratios

The Ternary area which covered the 80° E–105° E, 35° N–50°N of China was characterized with generally lower 240 Pu/ 239 Pu atom ratios as depicted by Figure 2 and the frequency distribution of the 240 Pu/ 239 Pu in Figure 3. Furthermore, the 240 Pu/ 239 Pu atom ratios in surface soils (n = 107) in this area varied across a large range from 0.048 to 0.216 with an AM ± SD of 0.172 ± 0.030, which was apparently lower than the typical global fallout value. Besides, the other statistics including the MED (0.174), the LP (0.166) and UP (0.186) were all lower than those in other two areas (Table 1). Furthermore, as in Table A3, both the results of the rank sum test and the students’ t test have proved that the 240 Pu/ 239 Pu data in the Ternary area and the Unitary area was significantly different (p < 0.05),which further confirmed the regional influences of STS and LNTS in the Ternary area besides the typical global fallout.

Raise of 239 + 240 Pu Concentrations

In the Ternary area, the 239 + 240 Pu concentrations in surface soils were in the scale of 0.005–1.99 mBq/g, being comparable with the other parts (Table 2). However, all the statistics including the AM ± SD (0.53 ± 0.48 mBq/g), MED (0.416 mBq/g) together with the LP (0.125 mBq/g) and UP (0.833 mBq/g) were all distinctively higher than those in other parts of area in China. The 239 + 240 Pu concentration data in the Ternary area and the Unitary area were significantly different (p < 0.05) as shown in Table A3. It undoubtedly denoted that a rase of 239 + 240 Pu concentrations waws experienced over the Ternary area, which was further illustrated by the right-shift of the frequency distribution of ln( 239 + 240 Pu) in Figure 4.
To further verify the regional contributions of STS and/or LNTS, we further examined the rank correlation of 240 Pu/ 239 Pu with the ln( 239 + 240 Pu), the 240 Pu/ 239 Pu atom ratio in the Ternary area presented a negative correlation with the corresponding ln( 239 + 240 Pu) as in Figure A1 and the correlation was significant (Kendall’s τ = −0.188, p < 0.05). This interesting observation suggested that the regional influences of STS and/or LNTS in the Ternary area had influenced both the 240 Pu/ 239 Pu atom ratio and the 239 + 240 Pu concentration in soil samples, while the contributions was too difficult to be distinguished by separate studies. This is because the 240 Pu/ 239 Pu data in the Ternary area presented noticeable high frequencies (0.317) of between 0.16 and 0.18 (Figure 3), i.e., close to or slightly lower than that of the typical value (0.18) of the global fallout. And the large variation of 239 + 240 Pu activity concentration of the global fallout background (Table 2) also made it difficult to distinguish extra Pu according to 239 + 240 Pu concentration data. To further prove that, we collected the data in the Ternary area with 240 Pu/ 239 Pu between 0.166 and 0.194, which was within the 2SD of the typical global fallout (0.180 ± 0.014). In separate studies, the Pu in those samples were generally supposed to be derived from the global fallout. Nevertheless, the selected 240 Pu/ 239 Pu even showed slightly better correlation (Kendall’s τ = −0.257, p < 0.05) with the corresponding ln( 239 + 240 Pu). These indicated that in the separate studies which generally determined small number of samples, it is usually unrealizable to identify the contribution of extra Pu without remarkably low 240 Pu/ 239 Pu atom ratios. Consequently, in the separate studies, the contribution of STS and/or LNTS might be ignored or underestimated.

3.3. The Binary Area

3.3.1. Mutual Influences of the LNTS and the Global Fallout

According to spatial variability of 240 Pu/ 239 Pu in the soils in Figure 2, a usual area is the target shots in Figure 2(9),(10), which had a higher MED( 240 Pu/ 239 Pu) than the other 32 regions. Beside, we found that the shot in Figure 2(10) was significantly different from all the eight shots of the Ternary area.
Geographically, the two shots together stand for the 35° N–45° N, 100° E–115° E area. The high MED( 240 Pu/ 239 Pu) and the statistical divergences compared to other shots indicated that this area should have received additional contribution of Pu that has higher 240 Pu/ 239 Pu atom ratio compared with that of the global fallout.
The elevation of 240 Pu/ 239 Pu in this area was most likely due to the influence of the high-yield nuclear tests in the LNTS. The 240 Pu/ 239 Pu atom ratio of a nuclear test is in relation to the explosion yield and design of the weapon [1]. For instance, high 240 Pu/ 239 Pu atom ratios up to 0.3 have been observed after high-yield thermonuclear tests carried out by the US in the 1950s [36]. At the STS, the highest yield was 1.6 Mt conducted in 1955, while most of others were less than 0.1 Mt [2]. Meanwhile, the resulting 240 Pu/ 239 Pu atom ratios in the close-in fallout at the STS were reported to be 0.025–0.072, which was significantly lower than the global fallout value [34]. However, at LNTS, atmospheric tests are known to have varied fission yields from 0.02 Mt to 4 Mt [2]; and after the detonation of the largest-yield of 4 Mt at 1976, a high 240 Pu/ 239 Pu atom ratio of 0.224 was detected in the debris collected at a 10 km height in the atmosphere [37]. A larger yield of tests might deduce elevated 240 Pu/ 239 Pu atom ratios due to the higher neutron flux, and meanwhile a longer dispersion distance of the generated debris could be expected. As illustrated by Figure 2 and Table A1, following the downwind direction from the LNTS, the MED( 240 Pu/ 239 Pu) presented a transitional trend. It firstly decreased with the increasing of distance from LNTS (Figure 2(5)–(7)), and then increased to a maximum (Figure 2(10)), followed by a rather stable status at a slightly lower value (Figure 2(14)–(16), around 0.18). This trend might reveal the regional and distant influence of the LNTS. Specifically, the debris from the low-yield tests tended to deposit regionally in the intermediate downwind, while debris from the higher yield tests could be transported over a longer distance before deposition. There were typically three pathways of the radioactive clouds followed by the tests in the LNTS [8,9]. It deserved to be mentioned that the unique shot in Figure 2(10) that had the highest MED( 240 Pu/ 239 Pu) across China covered part of the north and central pathways of the radioactive plume from LNTS [8]; besides, the city Baotou and Taiyuan within that shot were exactly the landmarks of the north and central pathway, respectively. Therefore, it could be inferred that this Binary area that located at the far end of the radioactive plume pathways might have been influenced by the high-yield tests from the LNTS besides the global fallout background.
Huang et al. [16] has evaluated the impact area of the high-yield tests from the LNTS and they proposed that the central China region was under the influence of LNTS. Nevertheless, in the shots including (25° N, 105° E), (25° N, 110° E), (30° N, 105° E), and (30° N, 115° E) in Figure 2 which were covered by the partitioned central China of Huang et al. [16], both the MED( 240 Pu/ 239 Pu) and the statistical distribution of the 240 Pu/ 239 Pu dataset were not significantly different from the other regions in the Unitary area (target shots in Figure 2(11)–(34)). Besides, the corresponding region of the most unusually shot (35° N, 105° E) in our study was part of the north China region of Huang et al. [16] according to their partitioning, while in their study the general elevation of 240 Pu/ 239 Pu in that region was not identified because the weighted average 240 Pu/ 239 Pu was calculated to be 0.185 ± 0.006. These comparisons demonstrated that the geographical partitioning method of Huang et al. [16] was coarse since their partitioning of regions was empirical and basically followed administrative divisions. Besides, the use of only weighted average might be not decisive since slight deviations from the global fallout background (0.18) would be masked. In contrast, in virtue of the moving average combined with the use of MED, finer spatial resolution as well as more representative data were obtained in our study.

3.3.2. Distribution of Pu in the Binary Area

The scale of the Binary area covered the 35° N–45° N, 100° E–115° E area as depicted in Figure 2. This area represented the mutual contributions of Pu from the global fallout and the high-yield tests at the LNTS. The statistics of the Pu data in this area were listed in Table 1 and Table 2. Regarding the 240 Pu/ 239 Pu atom ratio, although it varied in a similar range (0.147–0.221) compared with other areas, the AM ± SD (0.194 ± 0.018), MED (0.200), LP (0.182) and UP (0.203) for the 240 Pu/ 239 Pu data in this area were all higher than in other partitioned areas. In contrast, the statistics of the 239 + 240 Pu activity concentration in the Binary area were not significantly different from those in other areas. Since the data size of Pu in this area was smaller than others, further studies in this area would be valuable for clarifying the influence of LNTS in this area.

3.4. The Unitary Area

3.4.1. Exclusive Influence of the Global Fallout

According to the variability of the 240 Pu/ 239 Pu in Figure 2, the divergences of the MED( 240 Pu/ 239 Pu) in different shots (Figure 2(11)–(34)) in the Unitary area were rather small as visually indicated by the thickness of colors. In detail, the specific values of the MED( 240 Pu/ 239 Pu) and the AM( 240 Pu/ 239 Pu) in this area ranged in 0.182–0.189 and 0.182–0.194 for the 24 shots, respectively (Table A1 and Table A2); In addition, the rank sum tests showed that any of the target shots in the Unitary area was not significantly different from others in that area. These results suggested the small variation and similarity of the 240 Pu/ 239 Pu atom ratio in the Unitary area, and thus indicated the Pu in these shots might be same, i.e., from the global fallout.

3.4.2. Representative of the Global Fallout in Chinese Soils

As mentioned above, we considered the Unitary area as the “background area”, which only received exclusive influence of the global fallout. Hence, the level and distribution of Pu within this area was carefully assessed for a better understanding of the merely global fallout in the Chinese environment and meanwhile providing a more representative or realistic 240 Pu/ 239 Pu baseline in the Chinese soils.
Considering that the Unitary area geographically referred to a large scale and the reported sampling sites for Pu in different studies scattered over 20° N–50° N (Figure 1), data in different latitudinal bands, i.e., 20° N–30° N, 30° N–40° N, and 40° N–50° N were also discussed.

240 Pu/ 239 Pu Atom Ratios

The statistics of the 240 Pu/ 239 Pu in the three latitude bands are listed in Table 1. All the statistics including AM (0.185–0.188) and SD (0.020–0.023), the MED (0.184–0.187) and the UP (0.194–0.1965) as well as the LP (0.173–0.176) were very close for the 240 Pu/ 239 Pu datasets among three latitude bands, suggesting that the 240 Pu/ 239 Pu in these bands were similar. This viewpoint was further supported by the statistical tests in Table A3, which proved that there was no significant difference among the 240 Pu/ 239 Pu datasets in the three latitude bands. Therefore, the three latitude bands were combined together to calculate the representative and area-specific baseline of 240 Pu/ 239 Pu for the whole Unitary area.
The overall frequency distribution of the 240 Pu/ 239 Pu atom ratios over the Unitary area is illustrated in Figure 3. The distribution presented as approximately normal, and the representative AS ± SD of the 240 Pu/ 239 Pu atom ratio in the Unitary area was 0.186 ± 0.021. Similar distribution patterns of 240 Pu/ 239 Pu in surface soils have also been observed in studies of soils from the European Union and Japan [38,39]. In particular, in the study of Yang et al. [39], they proposed that the representative AM ± SD of the 240 Pu/ 239 Pu atom ratio in Japan was 0.186 ± 0.015 based on the normal distribution of the results for 80 surface soils. Our calculated AM( 240 Pu/ 239 Pu) (0.186 ± 0.021, n = 264) in the Unitary area was almost identical to that of Yang et al. [39].
In 1999, Kelley et al. [15] calculated the averaged values of 240 Pu/ 239 Pu atom ratios in different latitude bands by analyzing soil samples collected worldwide. Their reported 240 Pu/ 239 Pu atom ratios were 0.178 ± 0.019 (2 σ ) for 0° N–30° N and 0.180 ± 0.014 (2 σ ) for 30° N–71° N, respectively. Hereafter, these characteristic values have been historically regarded as referential for the global fallout. However, in the study of Kelley et al. [15], the number of soil samples was rather small (n = 7 for 0° N–30° N and n = 24 for 30° N–71° N) regardless of the large scale of the investigated latitude bands. Especially for China where the spatial variability of 240 Pu/ 239 Pu had not been well reported, only one soil sample was compiled in their study [16]. Besides, they recommended the arithmetic mean of the 240 Pu/ 239 Pu values while the robustness of the arithmetic mean had not been checked statistically (probably due to the small sample size). Moreover, all the soil samples analyzed in their study were collected in 1970–1971, before the easing of the Chinese nuclear tests (1964–1980). Thus, the contribution of the Chinese nuclear tests—especially high-yield tests that might have had a higher 240 Pu/ 239 Pu—was discounted by Kelley et al. [15], which probably led to somewhat of an underestimation of the overall global fallout 240 Pu/ 239 Pu atom ratio.
For the above-mentioned reasons, based on the statistical analysis of the 240 Pu/ 239 Pu dataset in the Unitary area and the similarity of 240 Pu/ 239 Pu atom ratio in neighboring Japan, we recommend a slightly higher value of 0.186 ± 0.021 as a representative baseline to characterize the global-fallout derived Pu in Chinese soils as a substitute of the previously used 0.180 ± 0.014 proposed by Kelley et al. [15].

Surface 239 + 240 Pu Concentrations

As in Table 2, the 239 + 240 Pu activity concentration for each of the 20° N–30° N, 30° N–40° N, and 40° N–50° N latitude band varied a lot. For the entire Unitary area, the 239 + 240 Pu concentration in the surface soils ranged from 0.003 mBq/g to 4.783 mBq/g with a median of 0.129 mBq/g; similar ranges of 0.078–1.43 mBq/g and 0.18–4.79 mBq/g have also been reported in the neighboring countries including Japan [39,40] and Korea [41,42,43], respectively.
Meanwhile, we noted that the 239 + 240 Pu concentrations in the Unitary area were not evenly distributed. The UP (0.242 mBq/g) is an order of magnitude lower than the upper range (4.783 mBq/g) as in Table 2. It is the same situation for every latitudinal band (Table 1). Similarly, in the study of Yang et al. [39], which investigated Pu in Japanese soils, the reported maximum 239 + 240 Pu concentrations were as high as 1.46 mBq/g while 77.5% of the soils had a 239 + 240 Pu concentration of less than 0.15 mBq/g. All the divergences in statistics indicated that the 239 + 240 Pu concentrations data in surface soils were in general highly skewed to their lower ranges (Figure 4). However, this tendency was usually ignored in separate studies where the arithmetic mean (AM) was frequently used to describe the level of 239 + 240 Pu in surface soils. While most of the 239 + 240 Pu concentration was in the lower percentile, the sporadic occurrence of high values in individual samples might cause obvious fluctuations of the AM, especially when the data size was small. Accordingly, we recommended employing the range together with MED to characterize the level of 239 + 240 Pu concentration in soils in future studies.

4. Conclusions

In this study we investigated the sources and the impact areas of Pu in Chinese soils to illustrate the state-of-the-art of the levels and distributions of 240 Pu/ 239 Pu atom ratios and 239 + 240 Pu concentrations. The moving average in combination with statistical analysis was firstly employed to partition different geographical areas with the 240 Pu/ 239 Pu dataset from the public literature, resulting in three areas based on the sources’ terms of Pu. The Ternary area, which represented the 80° E–105° E, 35° N–50° N of China, was supposed to have multiple sources of Pu including the STS, LNTS and the global fallout. This area was characterized with slightly lower 240 Pu/ 239 Pu atom ratios (0.048–0.216 with a median of 0.174) as well as elevated 239 + 240 Pu concentrations (0.005–1.99 mBq/g with a median of 0.416 mBq/g). Meanwhile, the Binary area, covering the 35° N–45° N, 100° E–115° E, was considered to have received an extra contribution of Pu from the high-yield nuclear tests at the LNTS besides the global fallout. The 240 Pu/ 239 Pu atom ratio (0.147–0.221 with a median of 0.200) in this area was the highest across China. The implication of the high-yield nuclear tests over the Binary area has not been seen before, which is worth more focus in the future. The remainder was partitioned as the Unitary area, which was supposed to have only received the exclusive influence of global fallout. Further statistical analysis of the data in the Unitary area suggested that a 240 Pu/ 239 Pu ratio of 0.186 ± 0.021 (AM ± SD) was more representative or area-specific for characterizing the global fallout in Chinese soils. Besides, we have found the skew of the frequency distribution of 239 + 240 Pu concentration data towards the lower range, which indicated that the commonly used arithmetic mean of 239 + 240 Pu might be easily affected by sporadic high values, while the range together with the median of 239 + 240 Pu concentration should be more representative in order to characterize the level of 239 + 240 Pu concentration in the soils.

Supplementary Materials

The following supporting information can be downloaded at: https://www.mdpi.com/article/10.3390/atmos13050769/s1, Table S1. Detailed information of compiled surface soils.

Author Contributions

Conceptualization, S.L. and Y.N.; validation, Y.N. and Q.G.; investigation, S.L.; writing—original draft preparation, S.L.; writing—review and editing, Y.N.; visualization, S.L.; supervision, Q.G.; funding acquisition, Q.G. All authors have read and agreed to the published version of the manuscript.

Funding

This work was supported by the National Science Foundation of China (Grant Number 12075009).

Institutional Review Board Statement

Not applicable.

Informed Consent Statement

Not applicable.

Data Availability Statement

The data presented in this study are available on request from the corresponding author.

Acknowledgments

Sixuan Li thanked Luan Hengwei from Tsinghua University and Liying from Peking University for discussion on the statistics. Youyi Ni would like to thank Qimin Deng from the China University of Geosciences, Wuhan for valuable comments on the visualization.

Conflicts of Interest

The authors declare no conflict of interest.

Appendix A

Table A1. Summary of the MED( 240 Pu/ 239 Pu) in different shots.
80–90 E85–95 E90–100 E95–105 E100–110 E105–115 E115–125 E120–130 E
40–50 N0.17450.1690.1680.1665 0.1890.186
35–45 N0.17650.1760.1720.17750.18750.2000.1850.184
30–40 N 0.1860.1860.1860.1870.18250.183
25–35 N 0.1850.1850.1830.1830.182
20–30 N 0.1820.1860.1820.1840.188
Table A2. Summary of the AM ± SD ( 240 Pu/ 239 Pu) in different shots.
80–90 E85–95 E90–100 E95–105 E100–110 E105–115 E115–125 E120–130 E
40–50 N0.171 ± 0.0240.172 ± 0.0310.162 ± 0.0400.147 ± 0.043 0.194 ± 0.0220.188 ± 0.023
35–45 N0.181 ± 0.0140.181 ± 0.0280.170 ± 0.0370.170 ± 0.0340.186 ± 0.0170.194 ± 0.0180.191 ± 0.0190.186 ± 0.023
30–40 N 0.188 ± 0.0160.184 ± 0.0140.186 ± 0.0180.188 ± 0.0210.186 ± 0.0170.186 ± 0.021
25–35 N 0.186 ± 0.0120.186 ± 0.0150.184 ± 0.0170.186 ± 0.0180.187 ± 0.021
20–30 N 0.182 ± 0.0170.189 ± 0.0190.186 ± 0.0200.184 ± 0.0200.189 ± 0.020

Appendix B

Table A3. Statistical test results (p values) of the 240 Pu/ 239 Pu and the 239 + 240 Pu dataset among different areas .
Statistical Test 240 Pu/ 239 Pu Atom Ratio 239 + 240 Pu Concentration
(a) Among 20–30 N, 30–40 N, 40–50 N (of the Unitary area)
Brown Forsythe0.490.007
Kruskal-Wallis0.920.14
One-way ANOVA0.71(0.009) *
(b) Between the Unitary area and the Ternary area
Brown Forsythe0.10<1 × 4−10
Rank sum test<1 × 5−10<1 ×6−10
Students’ t<1 × 6−10(<1 × 5−10) *
† Values marked as bold indicated the results were significant at 0.01 confidence level. * Invalid results due to the heteroscedasticity.

Appendix C

Figure A1. The rank correlation of 240 Pu/ 239 Pu with ln( 239 + 240 Pu) in the Ternary (orange) and Unitary (blue) areas. The data of the Ternary area was selected with the 240 Pu/ 239 Pu ranged between 0.166–0.194.
Atmosphere 13 00769 g0a1

References

  1. Thakur, P.; Khaing, H.; Salminen-Paatero, S. Plutonium in the atmosphere: A global perspective. J. Environ. Radioact. 2017, 175, 39–51. [Google Scholar] [CrossRef] [PubMed]
  2. UNSCEAR (Ed.) Sources and Effects of Ionizing Radiation: United Nations Scientific Committee on the Effects of Atomic Radiation: UNSCEAR 2000 Report to the General Assembly, with Scientific Annexes; United Nations: New York, NY, USA, 2000; OCLC: ocm45228885. [Google Scholar]
  3. Ni, Y.; Wang, Z.; Zheng, J.; Tagami, K.; Guo, Q.; Uchida, S.; Tsukada, H. The transfer of fallout plutonium from paddy soil to rice: A field study in Japan. J. Environ. Radioact. 2019, 196, 22–28. [Google Scholar] [CrossRef] [PubMed]
  4. Ni, Y.; Zheng, J.; Guo, Q.; Huang, Z.; Tagami, K.; Uchida, S. Extractability of global fallout Pu from agricultural soils and its potential indication of bioavailability. CATENA 2022, 210, 105884. [Google Scholar] [CrossRef]
  5. Sakaguchi, A.; Steier, P.; Takahashi, Y.; Yamamoto, M. Isotopic compositions of 236U and Pu isotopes in “black substances” collected from roadsides in Fukushima Prefecture: Fallout from the Fukushima Dai-ichi Nuclear Power Plant accident. Environ. Sci. Technol. 2014, 48, 3691–3697. [Google Scholar] [CrossRef]
  6. Yamamoto, M.; Sakaguchi, A.; Ochiai, S.; Takada, T.; Hamataka, K.; Murakami, T.; Nagao, S. Isotopic Pu, Am and Cm signatures in environmental samples contaminated by the Fukushima Dai-ichi Nuclear Power Plant accident. J. Environ. Radioact. 2014, 132, 31–46. [Google Scholar] [CrossRef]
  7. Zheng, J.; Tagami, K.; Watanabe, Y.; Uchida, S.; Aono, T.; Ishii, N.; Yoshida, S.; Kubota, Y.; Fuma, S.; Ihara, S. Isotopic evidence of plutonium release into the environment from the Fukushima DNPP accident. Sci. Rep. 2012, 2, 1–8. [Google Scholar] [CrossRef] [Green Version]
  8. Bu, W.; Ni, Y.; Guo, Q.; Zheng, J.; Uchida, S. Pu isotopes in soils collected downwind from Lop Nor: Regional fallout vs. global fallout. Sci. Rep. 2015, 5, 1–10. [Google Scholar] [CrossRef]
  9. Bu, W.; Guo, Q.; Zheng, J.; Uchida, S. Plutonium concentration and 240Pu/239Pu isotopic ratio in the surface soils from the Jiuquan region in northwestern China. J. Radioanal. Nucl. Chem. 2017, 311, 999–1005. [Google Scholar] [CrossRef]
  10. Zhao, X.; Qiao, J.; Hou, X. Plutonium isotopes in Northern Xinjiang, China: Level, distribution, sources and their contributions. Environ. Pollut. 2020, 265, 114929. [Google Scholar] [CrossRef]
  11. Dong, W. Plutonium Isotopes in the Environment: Distributions and Behaviors. Ph.D. Thesis, Peking University, Beijing, China, 2021. [Google Scholar]
  12. Zhang, W.; Hou, X. Level, distribution and sources of plutonium in the coastal areas of China. Chemosphere 2019, 230, 587–595. [Google Scholar] [CrossRef]
  13. Zhang, W.; Hou, X.; Zhang, H.; Wang, Y.; Dang, H.; Xing, S.; Chen, N. Level, distribution and sources of plutonium in the northeast and north China. Environ. Pollut. 2021, 289, 117967. [Google Scholar] [CrossRef]
  14. Krey, P.; Hardy, E.; Pachucki, C.; Rourke, F.; Coluzza, J.; Benson, W. Mass isotopic composition of global fall-out plutonium in soil. In Transuranium Nuclides in the Environment; International Atomic Energy Agency (IAEA): Vienna, Austria, 1976. [Google Scholar]
  15. Kelley, J.; Bond, L.; Beasley, T. Global distribution of Pu isotopes and 237Np. Sci. Total Environ. 1999, 237, 483–500. [Google Scholar] [CrossRef]
  16. Huang, Y.; Tims, S.G.; Froehlich, M.B.; Pan, S.; Fifield, L.K.; Pavetich, S.; Koll, D. The 240Pu/239Pu atom ratio in Chinese soils. Sci. Total Environ. 2019, 678, 603–610. [Google Scholar] [CrossRef]
  17. Huang, Y.; Sun, X.; Zhang, W.; Xiao, Z. Spatial distribution and migration of 239+240Pu in Chinese soils. Sci. Total Environ. 2022, 824, 153724. [Google Scholar] [CrossRef]
  18. Bu, W.; Zheng, J.; Guo, Q.; Uchida, S. Vertical distribution and migration of global fallout Pu in forest soils in southwestern China. J. Environ. Radioact. 2014, 136, 174–180. [Google Scholar] [CrossRef]
  19. Dong, W.; Zheng, J.; Guo, Q. Particle-size speciation of Pu isotopes in surface soils from Inner Mongolia (China) and its implications for Asian Dust monitoring. Appl. Radiat. Isot. 2017, 120, 133–136. [Google Scholar] [CrossRef]
  20. Guan, Y.; Sun, S.; Sun, S.; Wang, H.; Ruan, X.; Liu, Z.; Terrasi, F.; Gialanella, L.; Shen, H. Distribution and sources of plutonium along the coast of Guangxi, China. In Nuclear Instruments and Methods in Physics Research Section B: Beam Interactions with Materials and Atoms; Elsevier: Amsterdam, The Netherlands, 2018; Volume 437, pp. 61–65. [Google Scholar]
  21. Guan, Y.; Zhang, P.; Huang, C.; Wang, D.; Wang, X.; Li, L.; Han, X.; Liu, Z. Vertical distribution of Pu in forest soil in Qinghai-Tibet Plateau. J. Environ. Radioact. 2021, 229, 106548. [Google Scholar] [CrossRef]
  22. Xing, S. Trace Application of Long-Lived Radionuclides 239+240Pu and 129I in the Environment. Ph.D. Thesis, The University of Chinese Academy of Sciences, Beijing, China, 2015. [Google Scholar]
  23. Xing, S.; Zhang, W.; Qiao, J.; Hou, X. Determination of ultra-low level plutonium isotopes (239Pu, 240Pu) in environmental samples with high uranium. Talanta 2018, 187, 357–364. [Google Scholar] [CrossRef]
  24. Xu, Y.; Qiao, J.; Hou, X.; Pan, S. Plutonium in soils from northeast China and its potential application for evaluation of soil erosion. Sci. Rep. 2013, 3, 1–8. [Google Scholar] [CrossRef] [Green Version]
  25. Xu, Y.; Pan, S.; Wu, M.; Zhang, K.; Hao, Y. Association of Plutonium isotopes with natural soil particles of different size and comparison with 137Cs. Sci. Total Environ. 2017, 581, 541–549. [Google Scholar] [CrossRef]
  26. Ni, Y.; Wang, Z.; Guo, Q.; Zheng, J.; Li, S.; Lin, J.; Tan, Z.; Huang, W. Distinctive distributions and migrations of 239+240Pu and 241Am in Chinese forest, grassland and desert soils. Chemosphere 2018, 212, 1002–1009. [Google Scholar] [CrossRef] [PubMed]
  27. Ni, Y.; Guo, Q.; Huang, Z.; Zheng, J.; Li, S.; Huang, W.; Bu, W. First study of 237Np in Chinese soils: Source, distribution and mobility in comparison with plutonium isotopes. Chemosphere 2020, 253, 126683. [Google Scholar] [CrossRef] [PubMed]
  28. Sha, L.; Yamamoto, M.; Komura, K.; Ueno, K. 239,240Pu, 241Am and 137Cs in soils from several areas in China. J. Radioanal. Nucl. Chem. 1991, 155, 45–53. [Google Scholar] [CrossRef]
  29. Wang, Y.; Wang, W.; Shen, M.; Tian, M.; Zhou, X.; Wu, W.; Jin, Y. 239+240Pu and 137Cs in soils of three sites from Shanxi and Henan. Radiat. Prot. 2013, 33, 124–128. [Google Scholar]
  30. Wang, R.; Mai, J.; Guan, Y.; Liu, Z. Radionuclides in the environment around the uranium mines in Guangxi, China. Appl. Radiat. Isot. 2020, 159, 109098. [Google Scholar] [CrossRef]
  31. Wu, J. Isotopic composition and source of plutonium in the Qinghai-Tibet Plateau frozen soils. Sci. Rep. 2019, 9, 1–10. [Google Scholar] [CrossRef]
  32. Zheng, J.; Yamada, M.; Wu, F.; Liao, H. Characterization of Pu concentration and its isotopic composition in soils of Gansu in northwestern China. J. Environ. Radioact. 2009, 100, 71–75. [Google Scholar] [CrossRef]
  33. Wu, F.; Zheng, J.; Liao, H.; Yamada, M. Vertical distributions of plutonium and 137Cs in lacustrine sediments in northwestern China: Quantifying sediment accumulation rates and source identifications. Environ. Sci. Technol. 2010, 44, 2911–2917. [Google Scholar] [CrossRef]
  34. Yamamoto, M.; Hoshi, M.; Takada, J.; Oikawa, S.; Yoshikawa, I.; Takatsuji, T.; Sekerbaev, A.K.; Gusev, B. Some aspects of environmental radioactivity around the former Soviet Union""" s Semipalatinsk nuclear test site: Local fallout Pu in Ust"""-Kamenogorsk district. J. Radioanal. Nucl. Chem. 2002, 252, 373–394. [Google Scholar] [CrossRef]
  35. Liao, H.; Bu, W.; Zheng, J.; Wu, F.; Yamada, M. Vertical Distributions of Radionuclides (239+240Pu, 240Pu/239Pu, and 137Cs) in Sediment Cores of Lake Bosten in Northwestern China. Environ. Sci. Technol. 2014, 48, 3840–3846. [Google Scholar] [CrossRef]
  36. Hirose, K.; Povinec, P.P. Sources of plutonium in the atmosphere and stratosphere-troposphere mixing. Sci. Rep. 2015, 5, 1–9. [Google Scholar] [CrossRef] [Green Version]
  37. Leifer, R.; Toonkel, L. Plutonium isotopic analysis of stratospheric samples from April 1977. In Report EML-390; Environmental Measurements Laboratory (EML): Manhattan, NY, USA, 1981; pp. 1–407. [Google Scholar]
  38. Meusburger, K.; Evrard, O.; Alewell, C.; Borrelli, P.; Cinelli, G.; Ketterer, M.; Mabit, L.; Panagos, P.; Van Oost, K.; Ballabio, C. Plutonium aided reconstruction of caesium atmospheric fallout in European topsoils. Sci. Rep. 2020, 10, 1–16. [Google Scholar] [CrossRef]
  39. Yang, G.; Zheng, J.; Tagami, K.; Uchida, S. Plutonium concentration and isotopic ratio in soil samples from central-eastern Japan collected around the 1970s. Sci. Rep. 2015, 5, 1–8. [Google Scholar] [CrossRef]
  40. Yamamoto, M.; Komura, K.; Sakanoue, M. 241Am and plutonium in Japanese rice-field surface soils. J. Radiat. Res. 1983, 24, 237–249. [Google Scholar] [CrossRef] [Green Version]
  41. Kim, C.; Lee, M.; Kim, C.; Kim, K. 90Sr, 137Cs, 239+240Pu and 238Pu concentrations in surface soils of Korea. J. Environ. Radioact. 1998, 40, 75–88. [Google Scholar] [CrossRef]
  42. Lee, M.; Lee, C.; Boo, B. Distribution and characteristics of 239,240Pu and 137Cs in the soil of Korea. J. Environ. Radioact. 1997, 37, 1–16. [Google Scholar] [CrossRef]
  43. Lee, S.; Oh, J.; Lee, J.; Lee, K.; Park, T.; Lujaniene, G.; Valiulis, D.; Šakalys, J. Distribution characteristics of 137Cs, Pu isotopes and 241Am in soil in Korea. Appl. Radiat. Isot. 2013, 81, 315–320. [Google Scholar] [CrossRef]
Figure 1. Sampling sites of the surface soils complied in this study.
Atmosphere 13 00769 g001
Figure 2. Spatial variability of 240 Pu/ 239 Pu atom ratio in Chinese surface soils.
Atmosphere 13 00769 g002
Figure 3. Frequency distribution of 240 Pu/ 239 Pu atom ratio in Chinese surface soils. The dashed line denotes the AM( 240 Pu/ 239 Pu) for each area, and the corresponding shadow area denotes the range of ± SD( 240 Pu/ 239 Pu).
Atmosphere 13 00769 g003
Figure 4. Frequency distribution of 239 + 240 Pu activity concentration in Chinese surface soils. The dashed line denotes the MED( 239 + 240 Pu) for each area.
Atmosphere 13 00769 g004
Table 1. Statistics of 240 Pu/ 239 Pu atom ratios in surface soils .
AreasLatitude BandNRangeAM ± SDMEDLPUP
Unitary area20° N–30° N1080.136–0.2310.186 ± 0.0200.1850.1730.196
30° N–40° N1010.103–0.2720.185 ± 0.0210.1840.1760.194
40° N–50° N550.144–0.2450.188 ± 0.0230.1870.1730.197
Total2640.103–0.2720.186 ± 0.0210.1840.1740.195
Binary area-170.147–0.2210.194 ± 0.0180.2000.1820.203
Ternary area-1070.048–0.2160.172 ± 0.0300.1740.1660.186
† AM: Arithmetic mean; SD: Standard deviation; MED: Median; LP/UP: Lower/Upper percentile.
Table 2. Statistics of 239 + 240 Pu activity concentrations (mBq/g) in surface soils (<10 cm) .
AreasLatitude BandNRangeAM ± SDMEDLPUP
Unitary area20° N–30° N770.003–1.30.16 ± 0.170.1220.07650.194
30° N–40° N650.009–4.7830.36 ± 0.650.1490.0790.466
40° N–50° N360.023–0.670.16 ± 0.150.0980.06450.2045
Total1780.003–4.7830.23 ± 0.410.12850.0760.242
Binary area-70.040–0.2310.11 ± 0.060.0980.07650.1325
Ternary area-770.005–1.990.53 ± 0.480.4160.1250.833
† AM: Arithmetic mean; SD: Standard deviation; MED: Median; LP/UP: Lower/Upper percentile.
Publisher’s Note: MDPI stays neutral with regard to jurisdictional claims in published maps and institutional affiliations.

