Article

Use of Low-Cost Sensors to Characterize Occupational Exposure to PM2.5 Concentrations Inside an Industrial Facility in Santa Ana, CA: Results from a Worker- and Community-Led Pilot Study

1
Department of Environmental and Occupational Health, Program in Public Health, University of California, Irvine, CA 92697, USA
2
Masri Research & Consulting, Orange, CA 92866, USA
3
Madison Park Neighborhood Association, GREEN-MPNA Programs, Santa Ana, CA 92707, USA
*
Authors to whom correspondence should be addressed.
Atmosphere 2022, 13(5), 722; https://doi.org/10.3390/atmos13050722
Submission received: 22 March 2022 / Revised: 26 April 2022 / Accepted: 29 April 2022 / Published: 1 May 2022

Abstract

:
PM2.5 is an air contaminant that has been widely associated with adverse respiratory and cardiovascular health, leading to increased hospital admissions and mortality. Following concerns reported by workers at an industrial facility located in Santa Ana, California, workers and community leaders collaborated with experts in the development of an air monitoring pilot study to measure PM2.5 concentrations to which employees and local residents are exposed during factory operating hours. To detect PM2.5, participants wore government-validated AtmoTube Pro personal air monitoring devices during three separate workdays (5 AM–1:30 PM) in August 2021. Results demonstrated a mean PM2.5 level inside the facility of 112.3 µg/m3, nearly seven-times greater than outdoors (17.3 µg/m3). Of the eight workers who wore personal indoor sampling devices, five showed measurements over 100 μg/m3. Welding-related activity inside the facility resulted in the greatest PM2.5 concentrations. This study demonstrates the utility of using low-cost air quality sensors combined with employee knowledge and participation for the investigation of workplace air pollution exposure as well as facilitation of greater health-related awareness, education, and empowerment among workers and community members. Results also underscore the need for basic measures of indoor air pollution control paired with ongoing air monitoring within the Santa Ana facility, and the importance of future air monitoring studies aimed at industrial facilities.

1. Introduction

Extensive epidemiological literature has documented exposure to airborne particulate matter (PM) to be associated with all-cause mortality and increased hospital admissions [1,2,3] as well as a variety of adverse cardiovascular, respiratory, and neurological ailments [4,5,6]. In such studies, exposure to particles less than 2.5 micrometers (μm) in aerodynamic diameter (PM2.5) is of particular importance to health, and in 2017 such particles were estimated to contribute to 4.6 million deaths worldwide [7]. In a recent study investigating “urban-associated diseases” such as allergies, asthma, and cancer, air pollution was shown to be the characteristic of cities that was most frequently associated with adverse health effects [8]. In order to protect residents against the health effects associated with long- and short-term exposure to PM2.5, the U.S. Environmental Protection Agency (USEPA) in 2012 strengthened its annual PM2.5 standard from 15 μg/m3 to 12 μg/m3. Similarly, the World Health Organization (WHO) recently (in 2021) lowered its PM2.5 Air Quality Guideline level from 10 µg/m3 to 5 μg/m3, reflecting new evidence relating to effects on mortality occurring at concentrations under 10 μg/m3 [9].
Worldwide, the fastest increase in cases and age-standardized mortality rates for COPD and disability-adjusted life years attributable to PM2.5 has taken place in low sociodemographic index areas [10]. Similar patterns have been observed on a county-by-county basis as well [11,12]. Similarly, in the U.S., numerous studies have documented disproportionate exposure to air pollution and other environmental hazards among low-income communities and communities of color [13,14,15,16,17,18,19,20,21]. Tessum et al. (2021) documented a disproportionate burden of exposure among minority communities that was systemically evident across almost all major emission categories and that was consistent between states, income levels, urban and rural places, and exposure levels [22]. While air pollution concentrations have generally declined nationally, the disparities in PM2.5 have actually increased in some areas, underscoring gaps that still remain in relation to equitably improving air quality [23].
Importantly, since communities of color are more likely to be subjected to higher ambient PM2.5 levels, they are also at an increased vulnerability to health ailments such as asthma and COVID-19 [24,25,26]. Throughout the coronavirus pandemic, various studies documented positive associations between ambient air pollution and the prevalence and spread of COVID-19 along with increased COVID-19 case fatality rates [27,28,29,30,31,32]. Importantly, socioeconomics can play a role in determining ones COVID-19 risk through the occupational environment since air pollution exposure and one’s ability to socially distance both vary from occupation to occupation (e.g., essential factory workers being more likely to sustain higher risk compared to work-from-home employees).
In order to better characterize air pollution where government agency data are lacking, scientists and community leaders are increasingly collaborating to develop community-engaged research methods that involve community volunteers (including minority groups) in every step of the research process, from designing research aims and data collection to the dissemination of findings [33,34]. Key goals of community-engaged research include making science more inclusive, accessible, and democratic, and sharing knowledge between scientists and impacted communities, as well as better positioning communities to apply science toward effective advocacy and policy change. At present, community-engaged research has incorporated a diverse range of underserved populations such as African American, indigenous, and Latina/o/x communities and has focused on soil contamination, waste disposal issues, and air quality, among other hazards [34,35,36,37].
In considering community-engaged science and air pollution, data collection methods have varied widely, ranging from the involvement of participants from primary schools to measure NO2 [38,39] to the engagement of tribal communities to detect PM2.5 and radon in their homes [40]. In a recent study, Johnston et al. (2019) collaborated with environmental justice organizations in Los Angles, California, by outfitting 18 youth volunteers with personal PM2.5 sampling devices so as to characterize a typical “day in the life” as it relates to air pollution across four neighborhoods [41]. While such studies incorporated community forums and educational workshops, and were shown to be effective in teaching children and youth about their personal air pollution exposures and health impacts, very fewer studies involve worker populations and the formulation of health protective recommendations in the workplace.
In measuring air quality, technological innovation has recently led to the development of low-cost air pollution monitors that now enable residential communities, worker groups, and other populations to measure and better understand their personal exposures [42,43,44,45]. When applied to local ambient air quality, such measurements can improve upon traditional government-operated monitoring stations, which are sparsely distributed and cannot readily detect air pollution at a local scale outdoors as well as in the indoor environments [46,47]. Furthermore, given that they can more readily identify hotspots of air pollution, such sensors enable improved Air Quality Index (AQI) reporting throughout wildfire and other major air pollution events, such as those related to industrial emissions [45,48]. Given their mobility, affordability, and ease of maintenance, low-cost sampling devices can be owned and operated by organizations, governments, and individuals alike, which has enabled the technology to expand regionally in areas where government sensors have not, as well as enabled everyday volunteers to actively engage in air pollution data collection and awareness.
In this study, we partnered with workers and community organizers in order to measure PM2.5 concentrations in and around an industrial facility located in Santa Ana, California, using the AtmoTube Pro, which is a government-validated low-cost air monitoring device. Our specific aims included (1) characterizing indoor PM2.5 and heat exposure over an 8-h workday, (2) characterizing outdoor air pollution immediately adjacent to the industrial facility and neighboring community area during the facility’s hours of operation, and (3) determining the existence of potential community exposure due to downwind emissions based on wind trajectory data. We hypothesized that worker and community concerns were based on observable spikes in air pollution concentrations and that prevailing wind patterns would allow for the potential of downwind exposure to neighboring residents.
The novelty of this study was the innovative approach to community-based participatory data collection, which drew upon both worker and community populations using low-cost air pollution sensors to understand both indoor employee exposure and potential downwind neighborhood impacts, along with the demonstration of this approach to be an effective tool for fostering air pollution awareness among workers and management, and ultimately bringing about increased protection for employees. What is more, the focus on and engagement of the worker population is particularly noteworthy given the tendency for community-based studies to overlook the occupational setting (where air pollution is often the highest).

2. Materials and Methods

In the winter of 2021, workers at an industrial facility that manufactures ventilation, lighting, roofing, and other equipment in Santa Ana, California raised concerns about poor indoor air quality related to their work activities that included welding, metal grinding, sanding, and painting. As a result, they partnered with local community organizers and university experts including the Madison Park Neighborhood Association (MPNA), University of California Irvine (UC Irvine, Irvine, CA, USA), and International Association of Sheet Metal, Air, Rail and Transportation Workers (SMART). A consistent concern that employees raised was about poor air quality and odors inside the facility. This concern was shared by local residents, many of whom recently participated in a community-led pilot study that found higher PM2.5 levels in the general area that houses the industrial facility [49].
As an extension of this previous work, which focused exclusively on measuring outdoor ambient air pollution throughout Santa Ana and neighboring areas, the current study focuses on measuring outdoor air pollution within a specific region where PM2.5 concentrations were found to be highest, as well as within (indoors) the specific facility where worker complaints have arisen. Through participatory processes that included virtual Zoom and in-person meetings, factory workers and community organizers involved in the current project identified a list of priorities as it relates to the air pollution issue, which included the need to measure air quality within and around the facility as well as understand the potential health risks posed by exposure. These specific research questions led to the current community-academic partnership that gave rise to this pilot study.
As with our prior community–academic air monitoring work, in which trained “citizen scientists” utilized hand-held instruments to carry out their own air monitoring and data collection [49]; the current study similarly engaged community volunteers (both factory workers and local residents) in order to construct an air monitoring campaign that would enable the collection and analysis of personal air pollution exposure data. Serving as a key community partner in both the prior work and current work was MPNA’s local non-profit called GREEN-MPNA, which focuses on examining environmental justice and the health risks associated with local air pollution.
In the present study, MPNA helped to engage local community participants while also providing the air monitoring devices that were used for the collection of PM2.5 measurements. Importantly, all air measurements in this study were collected by factory employees (indoor samples) and community volunteers (outdoor samples), while the processing of data and statistical analysis was carried out by experts from UC Irvine.

2.1. Indoor Monitoring

Between 5 AM and 1:30 PM (factory hours of operation) on three separate workdays in August 2021, employees working in either of two adjacent Santa Ana-based manufacturing facilities (operated by the same company [50]) were outfitted with personal air pollution monitors called AtmoTube Pros (AtmoTech, Inc., San Francisco, CA, USA) as well as Global Positioning System (GPS) devices called Qstarz Travel Recorders (QStar Technologies, Inc., Denver, CO, USA) in order to measure indoor PM2.5 pollution to which employees were exposed during the work shift, and to identify the areas where the greatest exposures took place.
While able to measure volatile organic compounds (VOCs) and several size fractions of PM, the AtmoTube Pro (henceforth, “AtmoTube”) is most robust in measuring concentrations of PM1 and PM2.5 as well as temperature and humidity [51,52]. Using an optical PM sensor, the AtmoTube detects PM through a measurement principal based on laser light scattering [53]. Measurements are obtained after first actively drawing air into the instrument using an internal fan [53]. The AtmoTube was recently field tested by the South Coast Air Quality Management District (SCAQMD) and showed a high measurement accuracy for the measurement of ambient PM2.5 concentrations when comparing it to Federal Equivalent Method (FEM) monitors (R2 = 0.79–94) [51]. The device also demonstrated a high accuracy for the measurement of temperature and relative humidity when compared to the SCAQMD meteorological station (R2 = 0.95–97) [51]. For these reasons, and because PM2.5 is a regulatory air pollutant that has been linked with numerous adverse health outcomes, measurements of PM2.5 and temperature are the focus of the present analysis. Figures S1 and S2 in the Supplemental Materials Section depict the manufacturing facility in relation to the neighboring residential community and to the city of Santa Ana (and state).
Workers who participated in the three-day air monitoring study (N = 8) consisted predominantly of Latinos who live in Santa Ana, some of whom reside within only a few blocks of the manufacturing facility. Participants reported working at the manufacturing facility for between three to ten years. Those who engaged in personal air monitoring included male workers from a diverse range of work specialties, thus enabling a comprehensive understanding of work-related air pollution exposure within the facility.
Based on descriptions by those who work within the two manufacturing buildings, air pollution inside the buildings (and therefore potentially outside) was expected to include a mixture of both PM2.5 and PM10 as well as VOCs. Over a dozen unique air pollution sources within each building were described by employees, such as oven-related heating of plastics, welding, grinding/cutting of metals and plastics, and chemical spraying/mixing (including painting). Besides the many sources likely contributing to indoor air pollution, this analysis (as noted before) focused exclusively on PM2.5 levels.
To understand PM2.5 variability on the inside of the manufacturing facilities, and to help characterize potential hotspots of air contamination between work areas, both mobile and stationary air monitoring within each building was conducted. Stationary devices consisted of devices that remained in fixed locations throughout the duration of the workday. Sites where stationary monitors were located included those which, based on worker testimony, were regarded to be potential hotspots of air pollution (e.g., multiple emission-activities occurring adjacent to one other).
In Figure 1, the approximate sites of stationary monitors and their corresponding Site ID designations are indicated using colors and numbers. As shown, six sites were selected for stationary air sampling in Building 1 and three sites in Building 2. Workers reported no operating and/or visible general ventilation systems exhausting air from the facility, but rather only small fans blowing air from one area to another. In one case, a welding hood was present, but positioned inappropriately in a way that was incapable of exhausting fumes before reaching the worker’s breathing zone.
Personal (or mobile) air samplers were those that were worn by workers during the workday (e.g., slung around the neck), therefore allowing a characterization of personal workplace exposure. Workers who engaged in personal air sampling also wore GPS devices, which allowed the pinpointing of specific locations in and around the two buildings where air contamination was greatest.
To prevent the attribution of air contamination to activities unrelated to work, employees who engaged in field monitoring were instructed to avoid smoking (e.g., cigarettes) when collecting data and to record such activities if/when they took place. However, no employees reported such activity during air monitoring.

2.2. Outdoor Monitoring

To confirm that indoor air pollution was not due to outdoor pollution penetrating the buildings, and to understand the extent to which neighboring residential communities may be exposed to harmful air contaminants drifting over from nearby sources, we collected simultaneous PM2.5 measurements in the adjacent outdoor environment and neighboring residential area. Outdoor air monitoring data collection was conducted by community participants throughout both morning (~10 AM–12 PM) and afternoon (1–3 PM) periods on the same three days during which employees inside the buildings measured indoor air. Specifically, outdoor air monitoring occurred along five prescribed walking routes (Figure 2) that encircled the two industrial buildings, including routes A, B, C, D, and E. Routes A and B most closely encircled the two industrial buildings while routes C and E encircled larger areas around the industrial area. Route D encircled the neighboring residential community.
To aid in the identification of potential downwind community exposures, we also employed three portable 5-in-1 Wireless Weather Stations (Logia Weather Stations, Inc., Edison, NJ, USA) in order to evaluate wind speed and trajectory during the three workdays of the monitoring campaign. This entailed the placement of two weather stations (Stations 2 and 3) in the adjacent Delhi Park region (placed ~4.5 feet above ground in a clearing surrounded only by lawn), which was relatively clear of trees and buildings so as to avoid possible windshear and/or obstruction and to improve the estimation of the regional wind pattern. These stations collected wind data from approximately 10:30 AM to 1:30 PM on all three sampling days. A third weather station (Station 1) was placed in the neighboring residential community (backyard of a community volunteer) approximately 7 feet above the ground surface and collected data throughout the entire work shift (5 AM–1:30 PM) during all three workdays. Upon field deployment, each weather station was placed in the direction of north using two compasses (second compass used as additional quality control).
As with indoor personal air sampling, those collecting outdoor measurements were outfitted with personal GPS devices to enable the identification of locations where outdoor air pollution hotspots and/or episodic spikes might exist. Outdoor walking routes were designed to encircle both industrial buildings of interest as well as neighboring residential areas so as to not only track air pollution near the expected source, but also to confirm whether high concentrations (if present) extended into neighboring communities.

3. Results

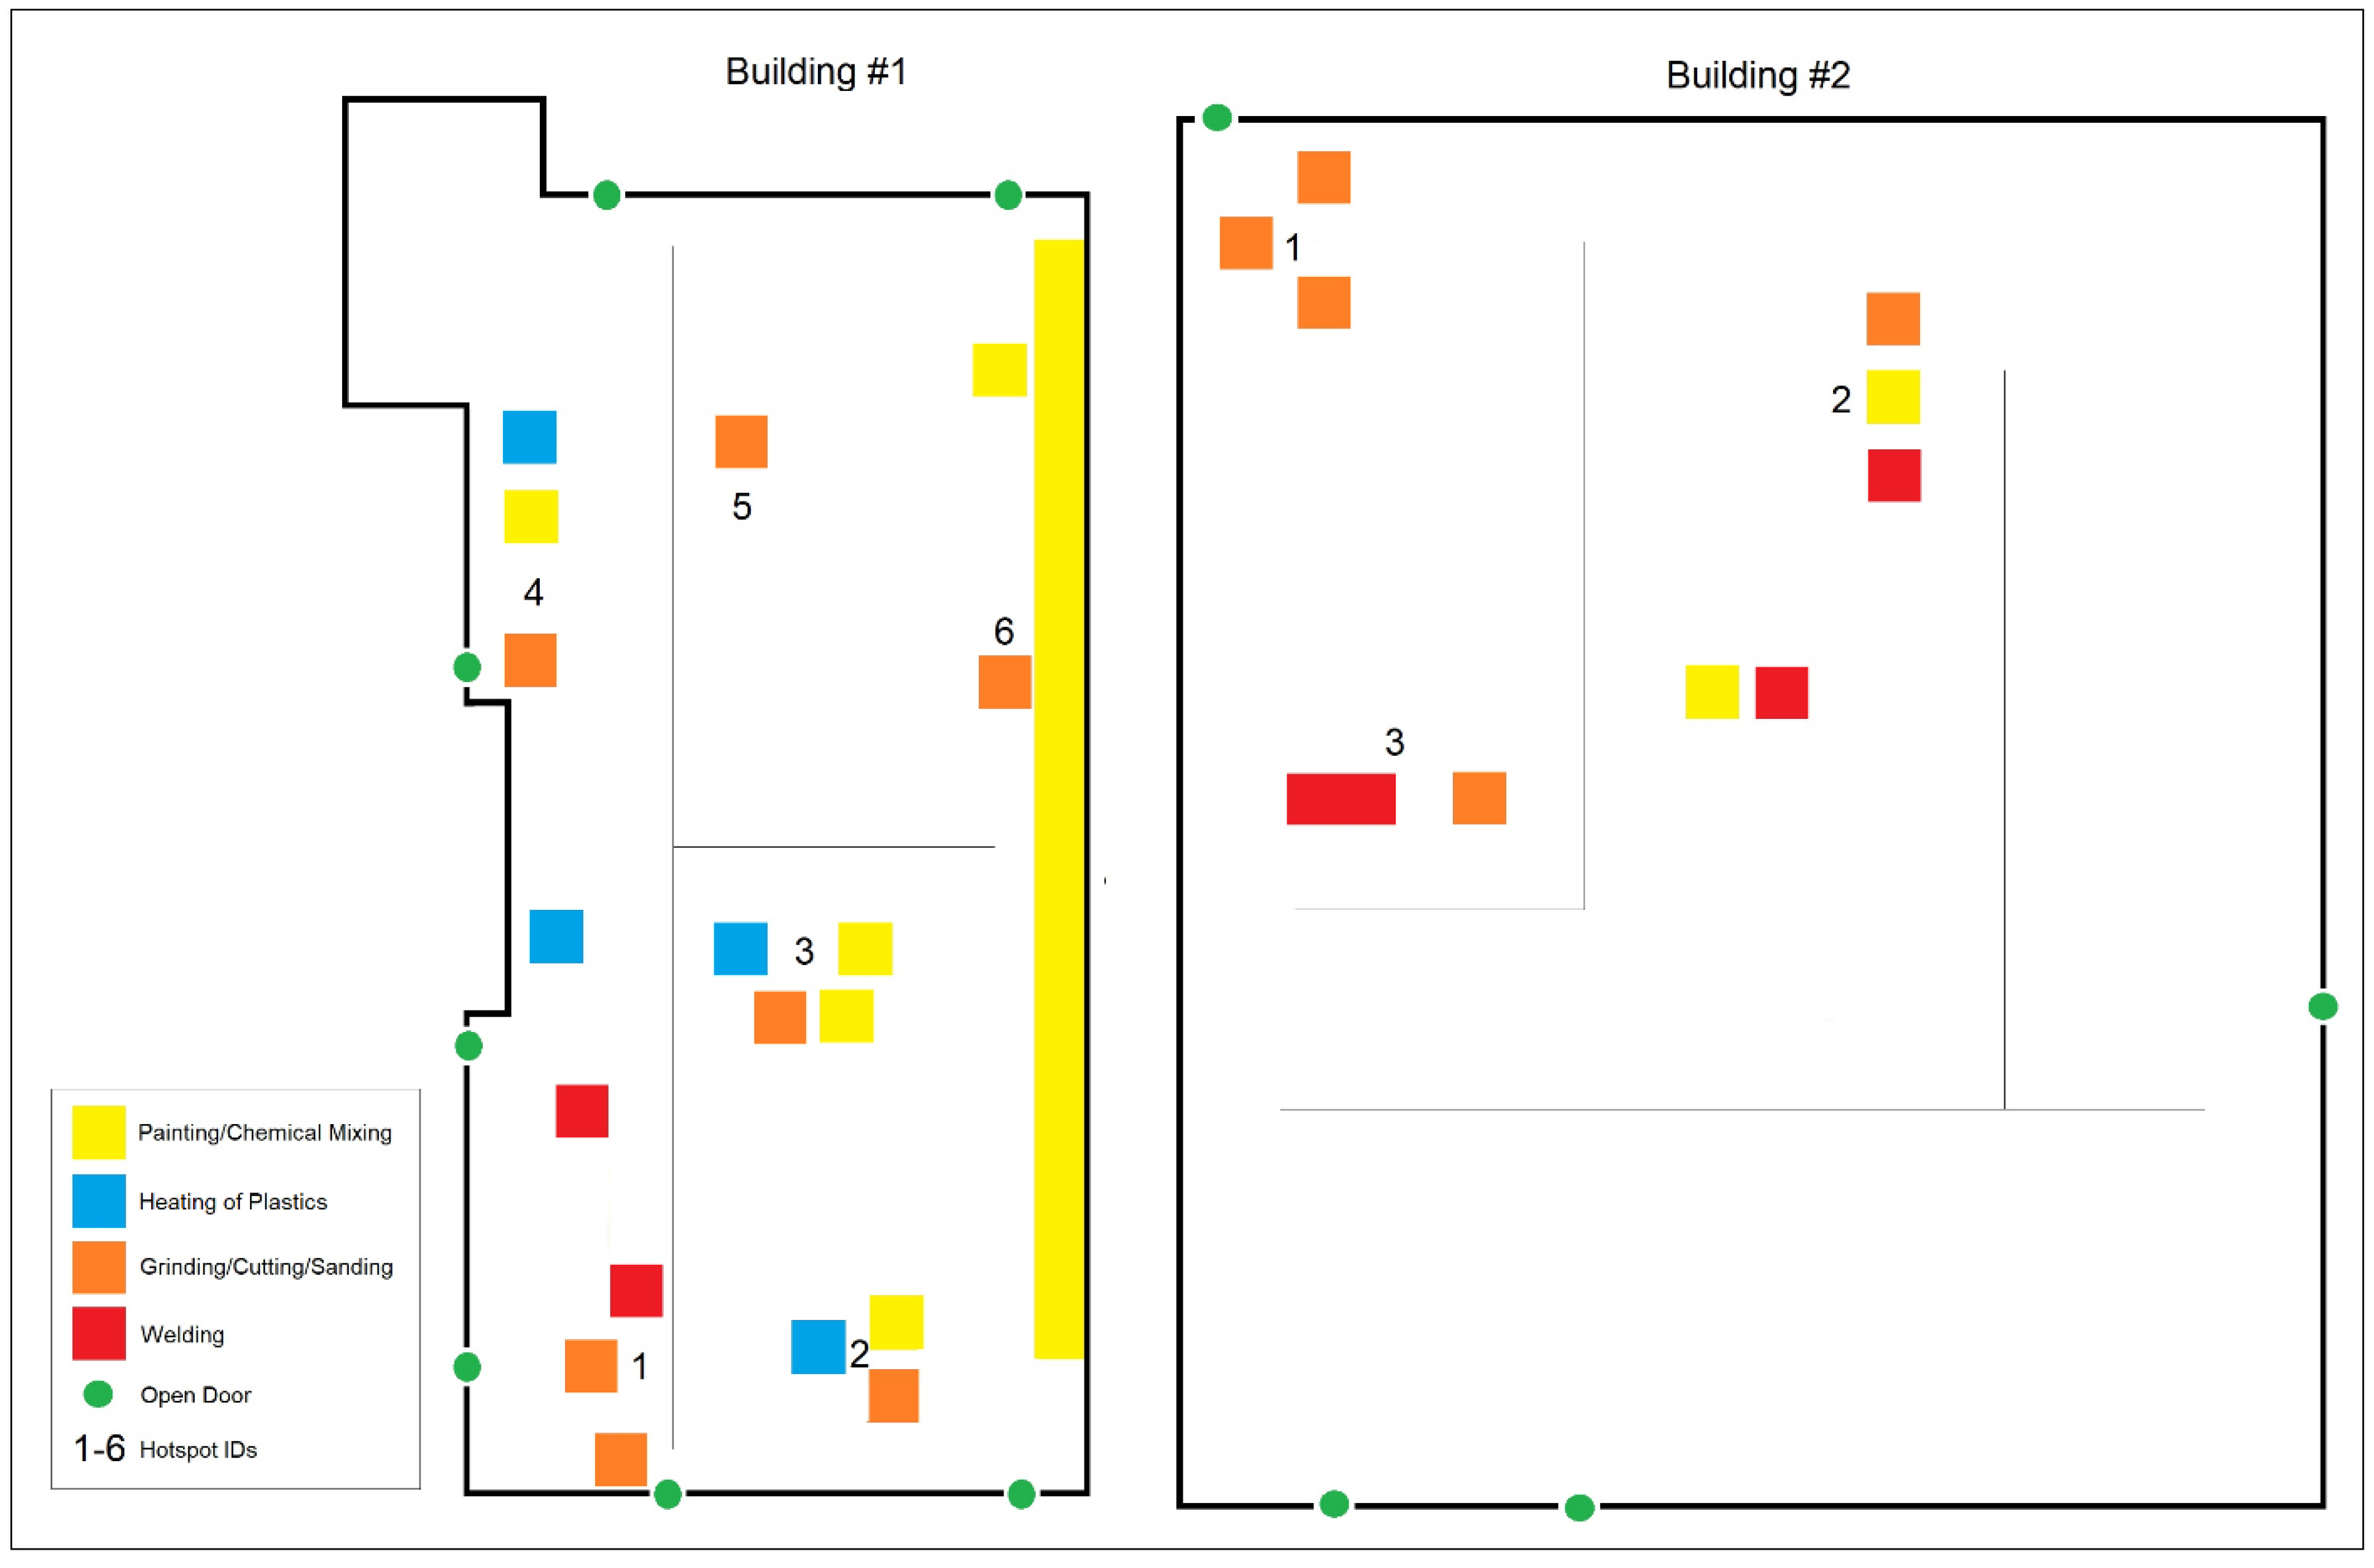
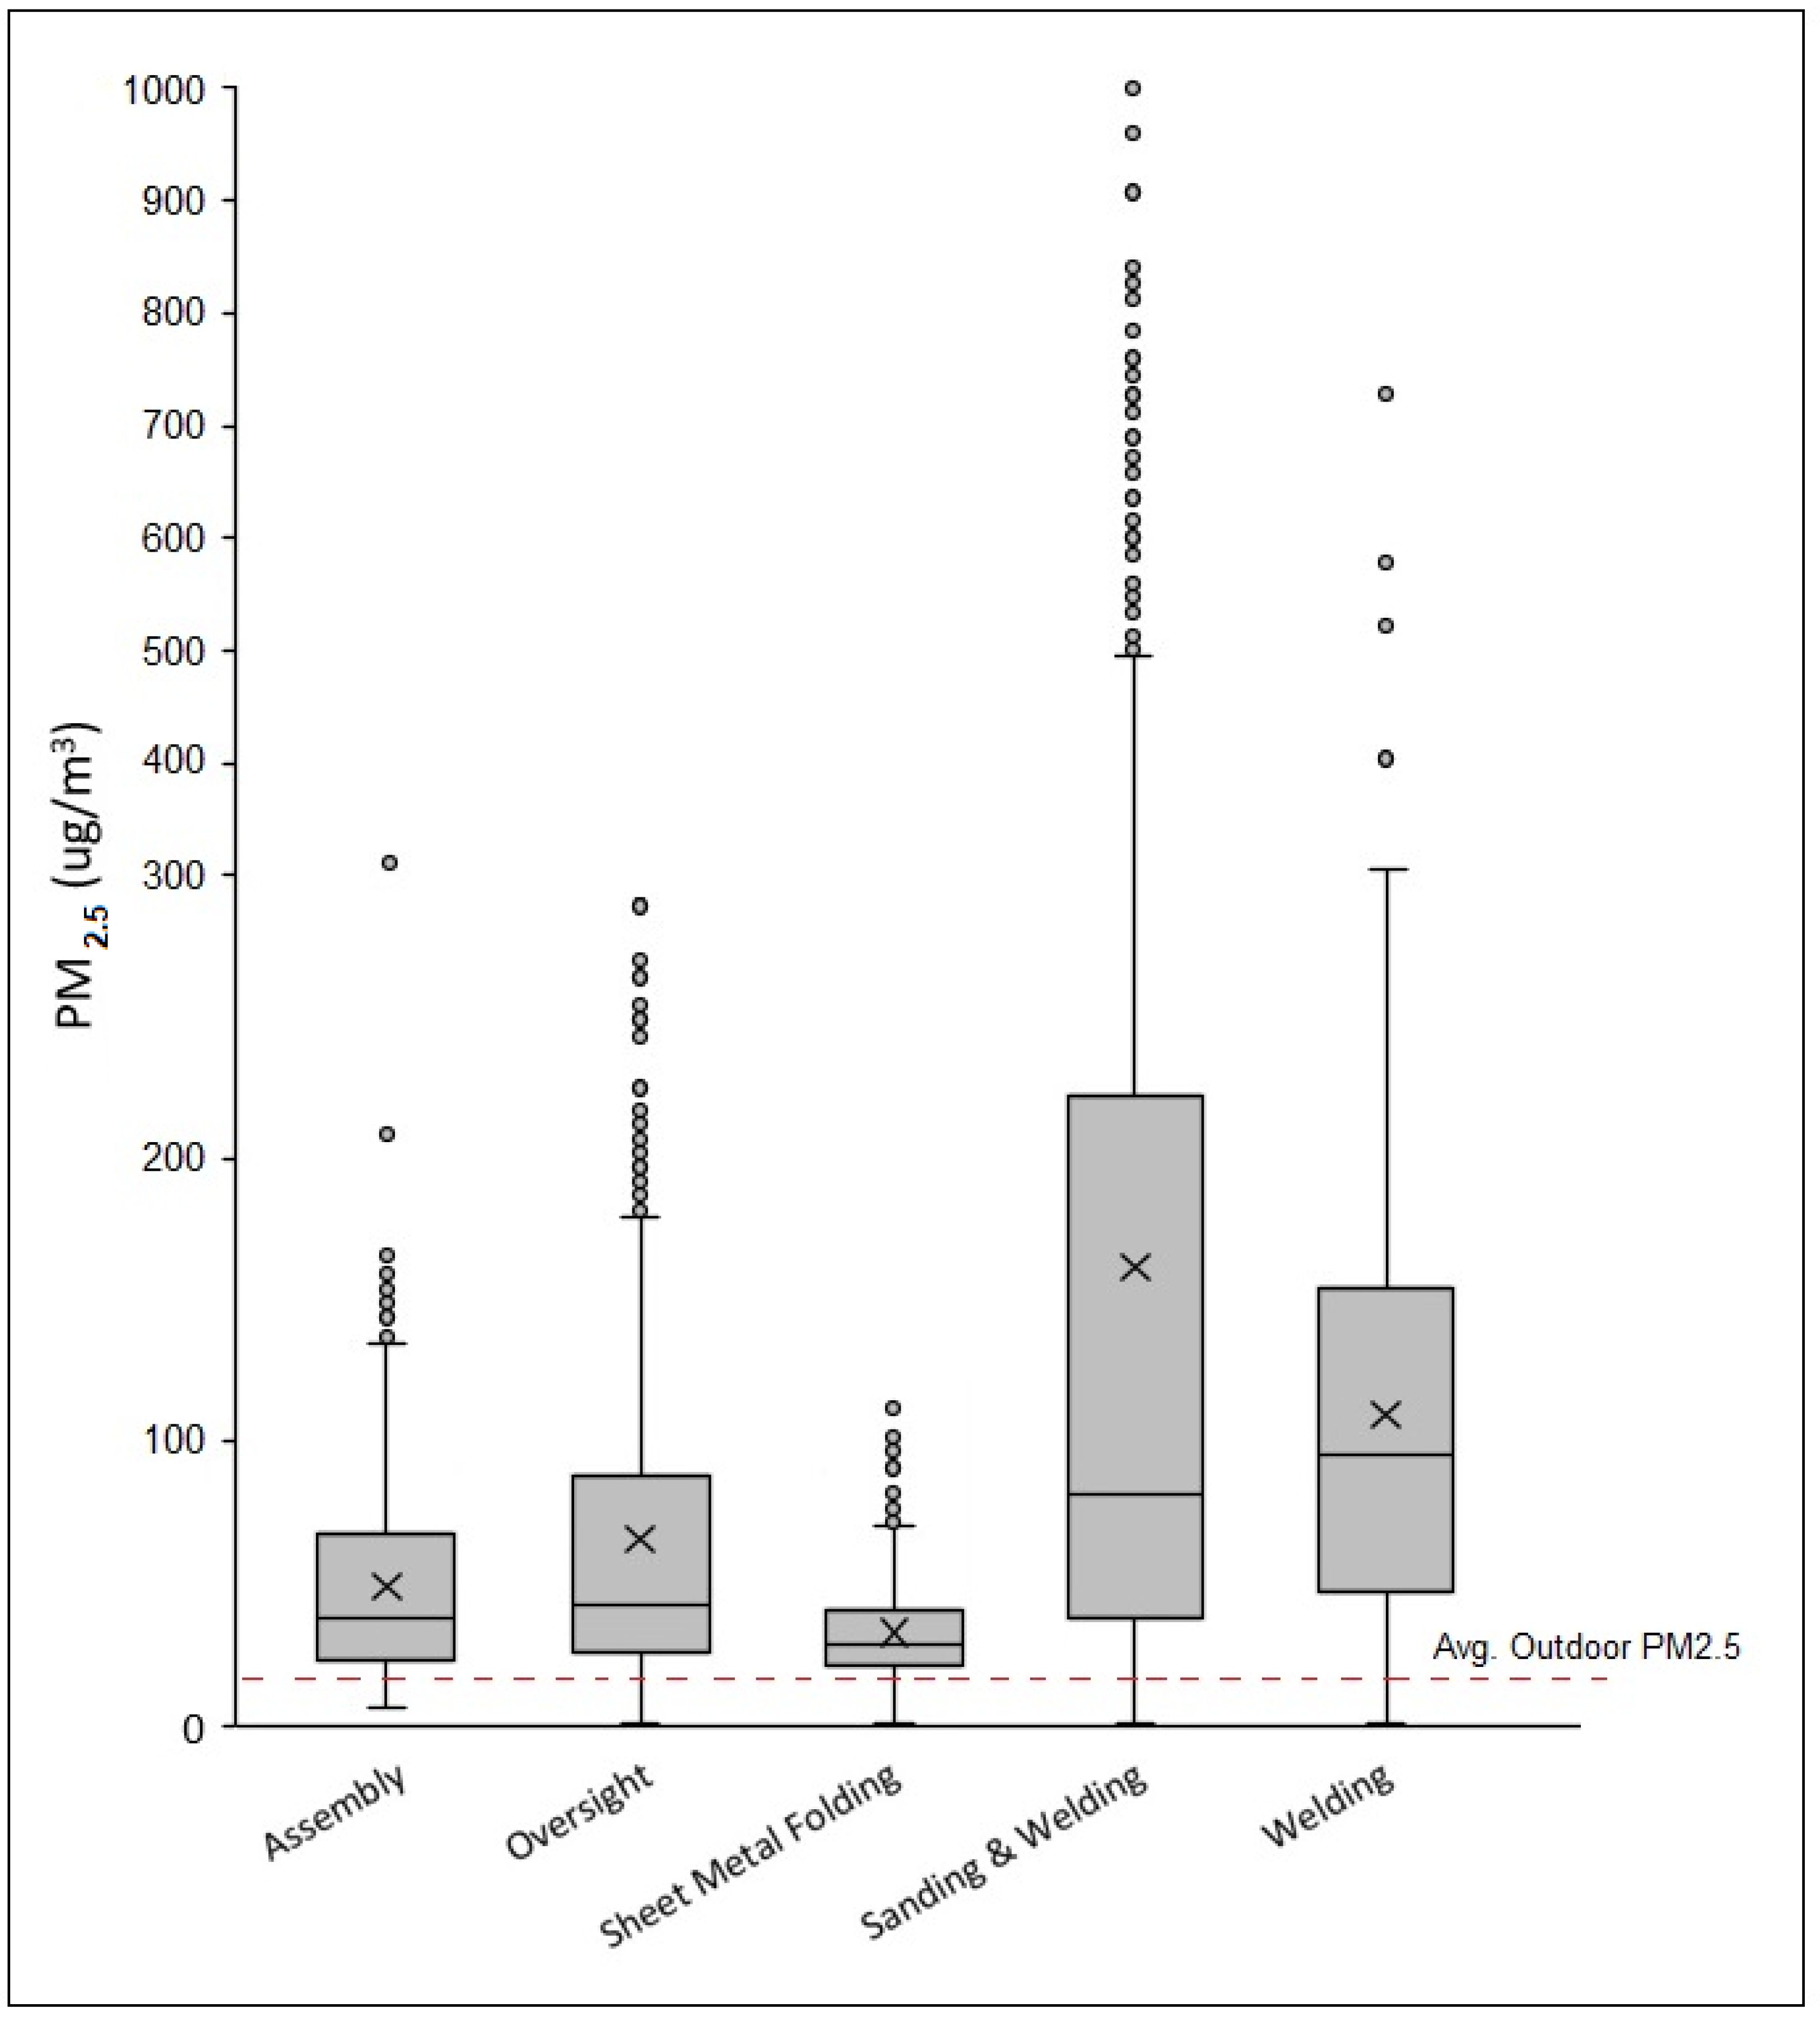
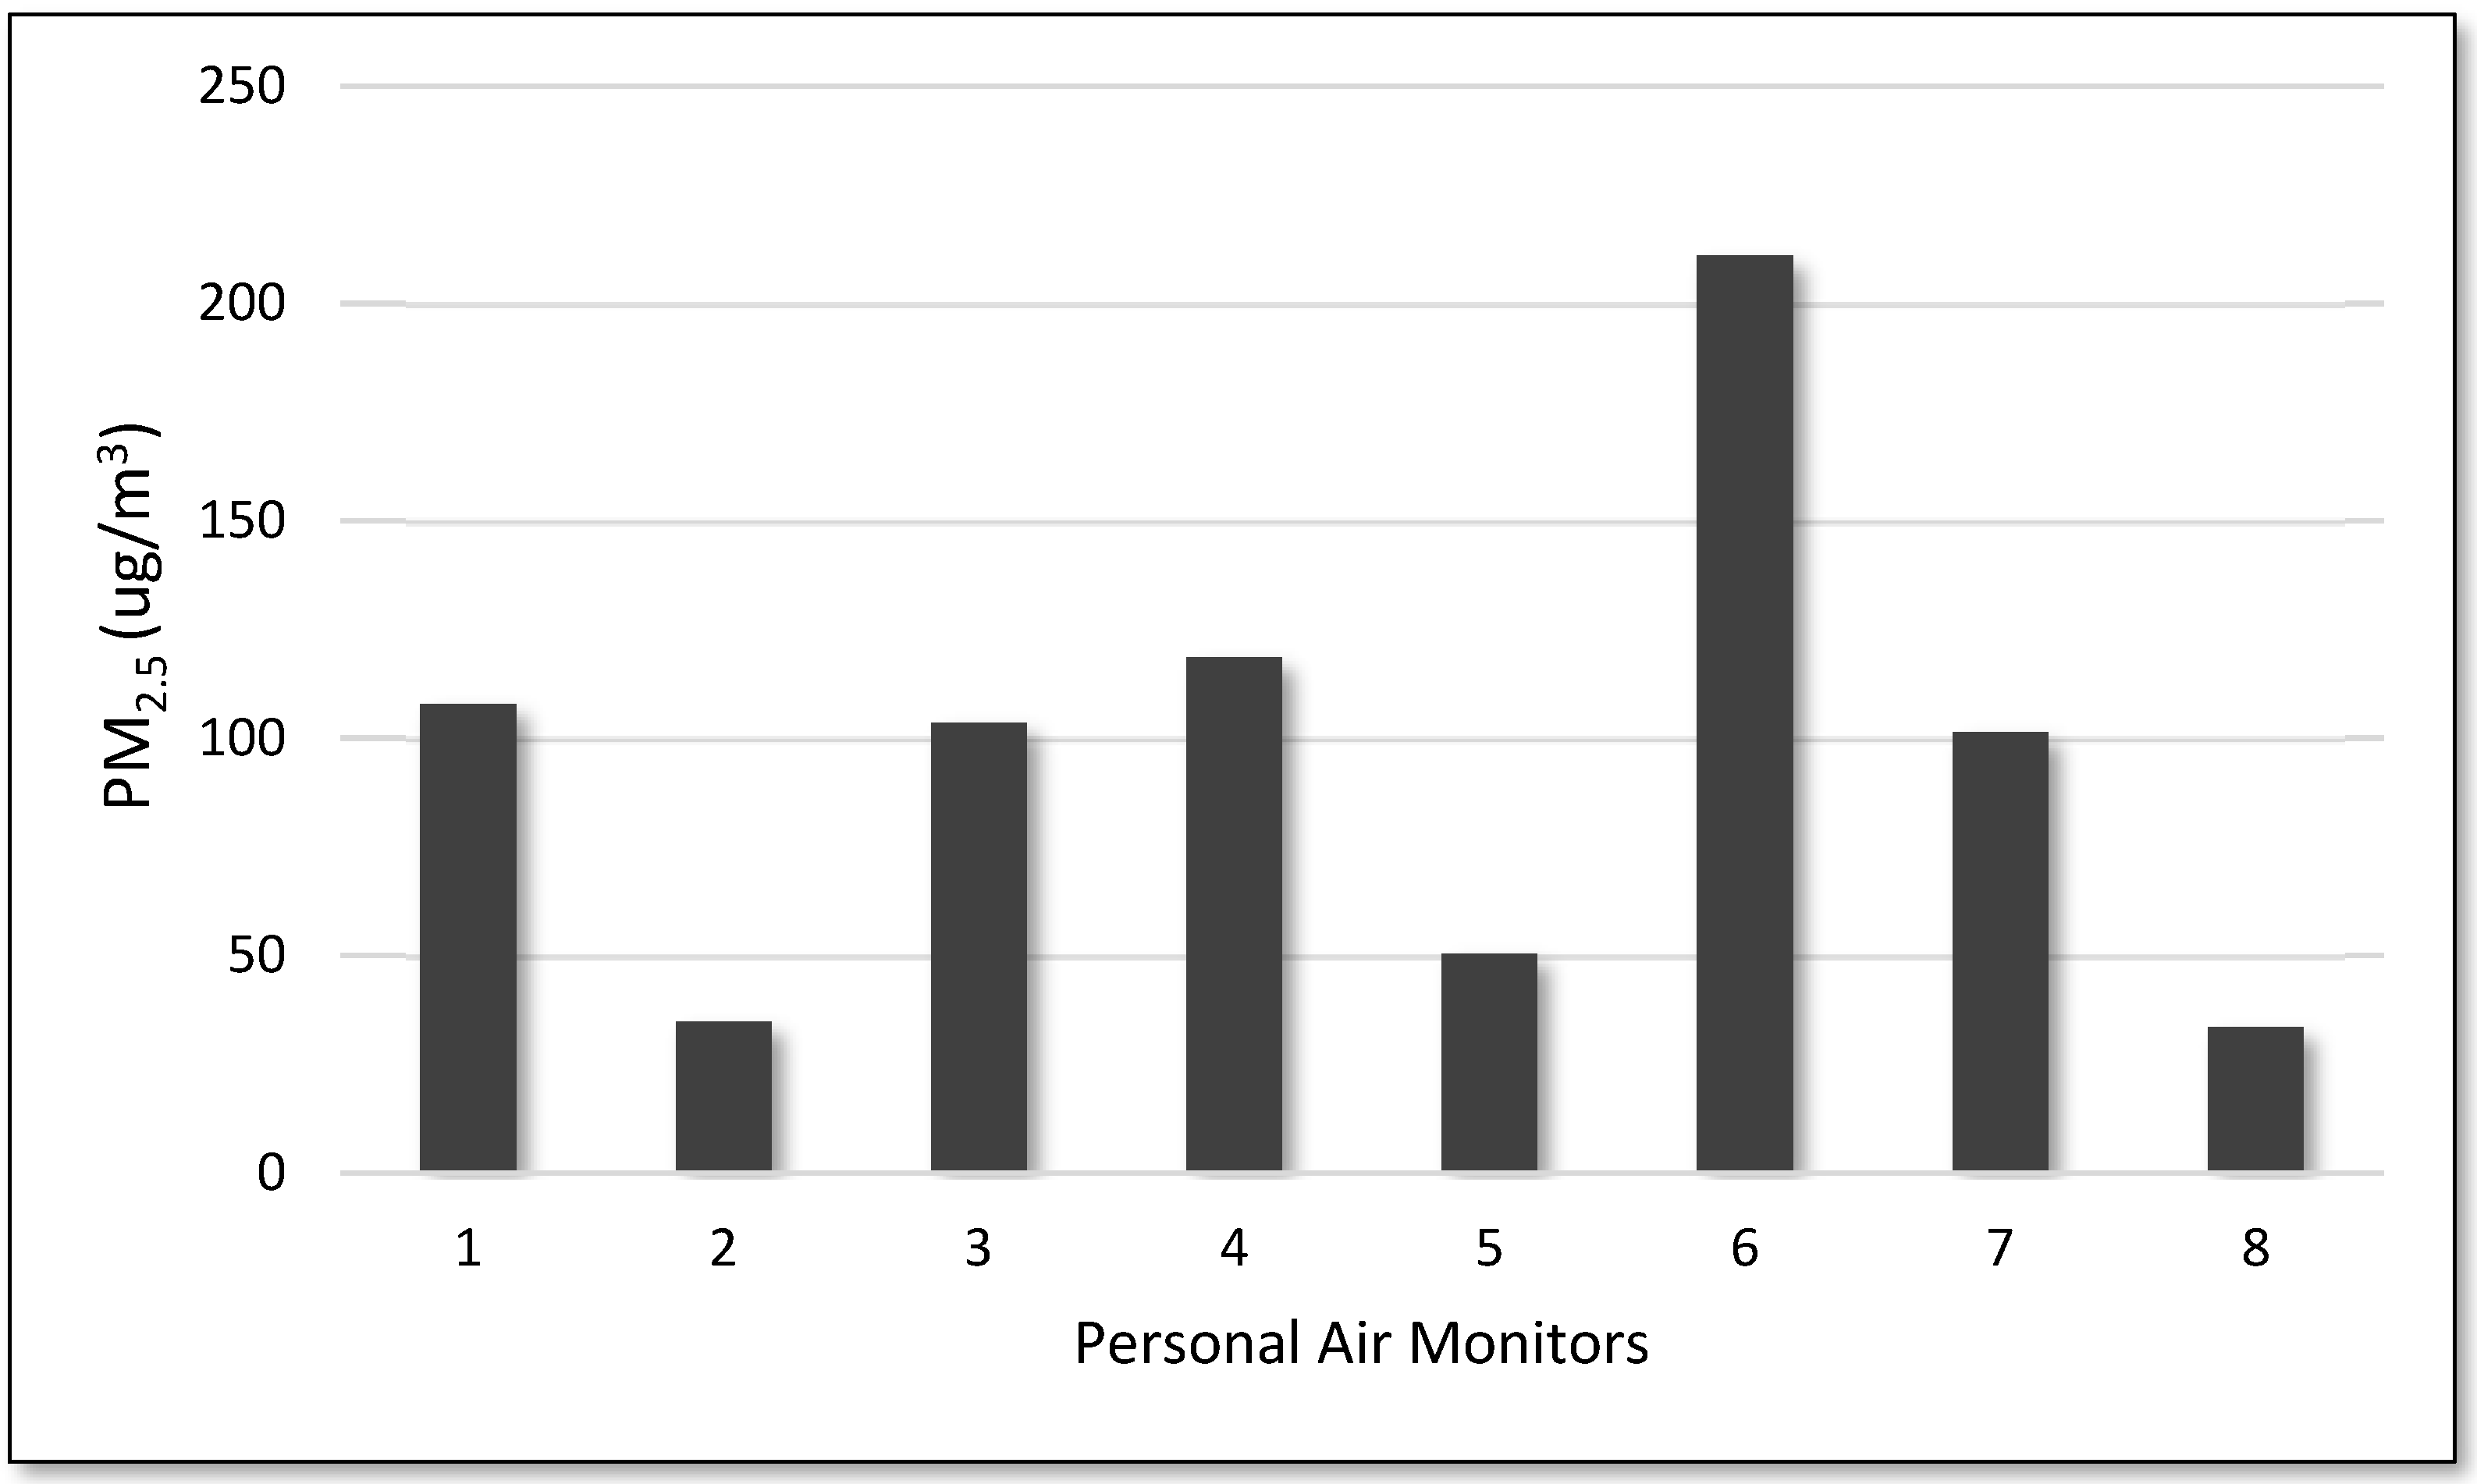
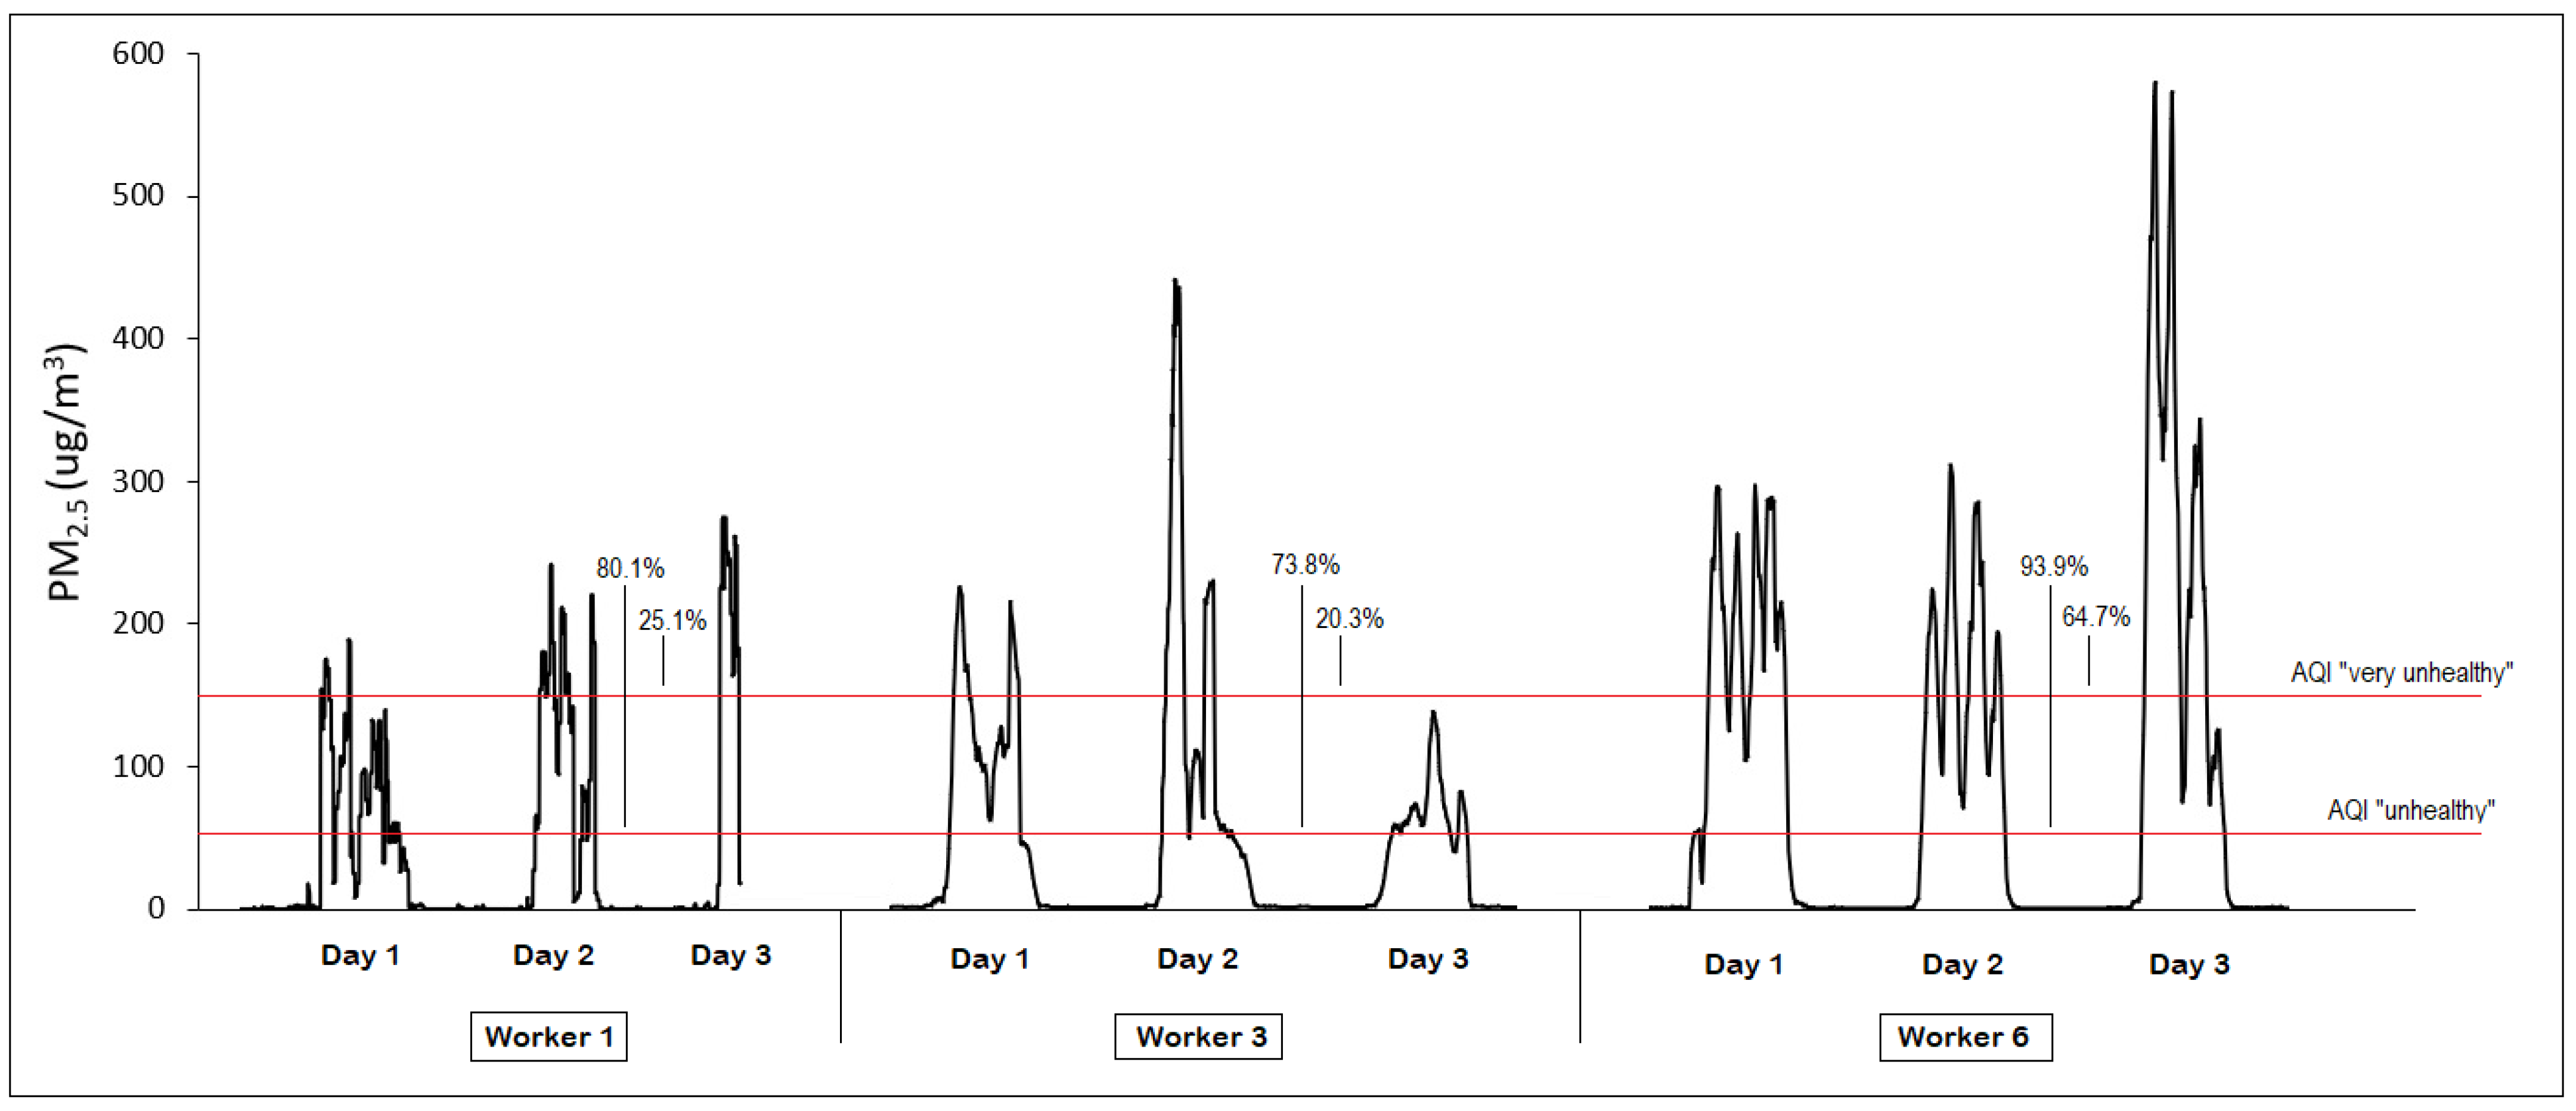
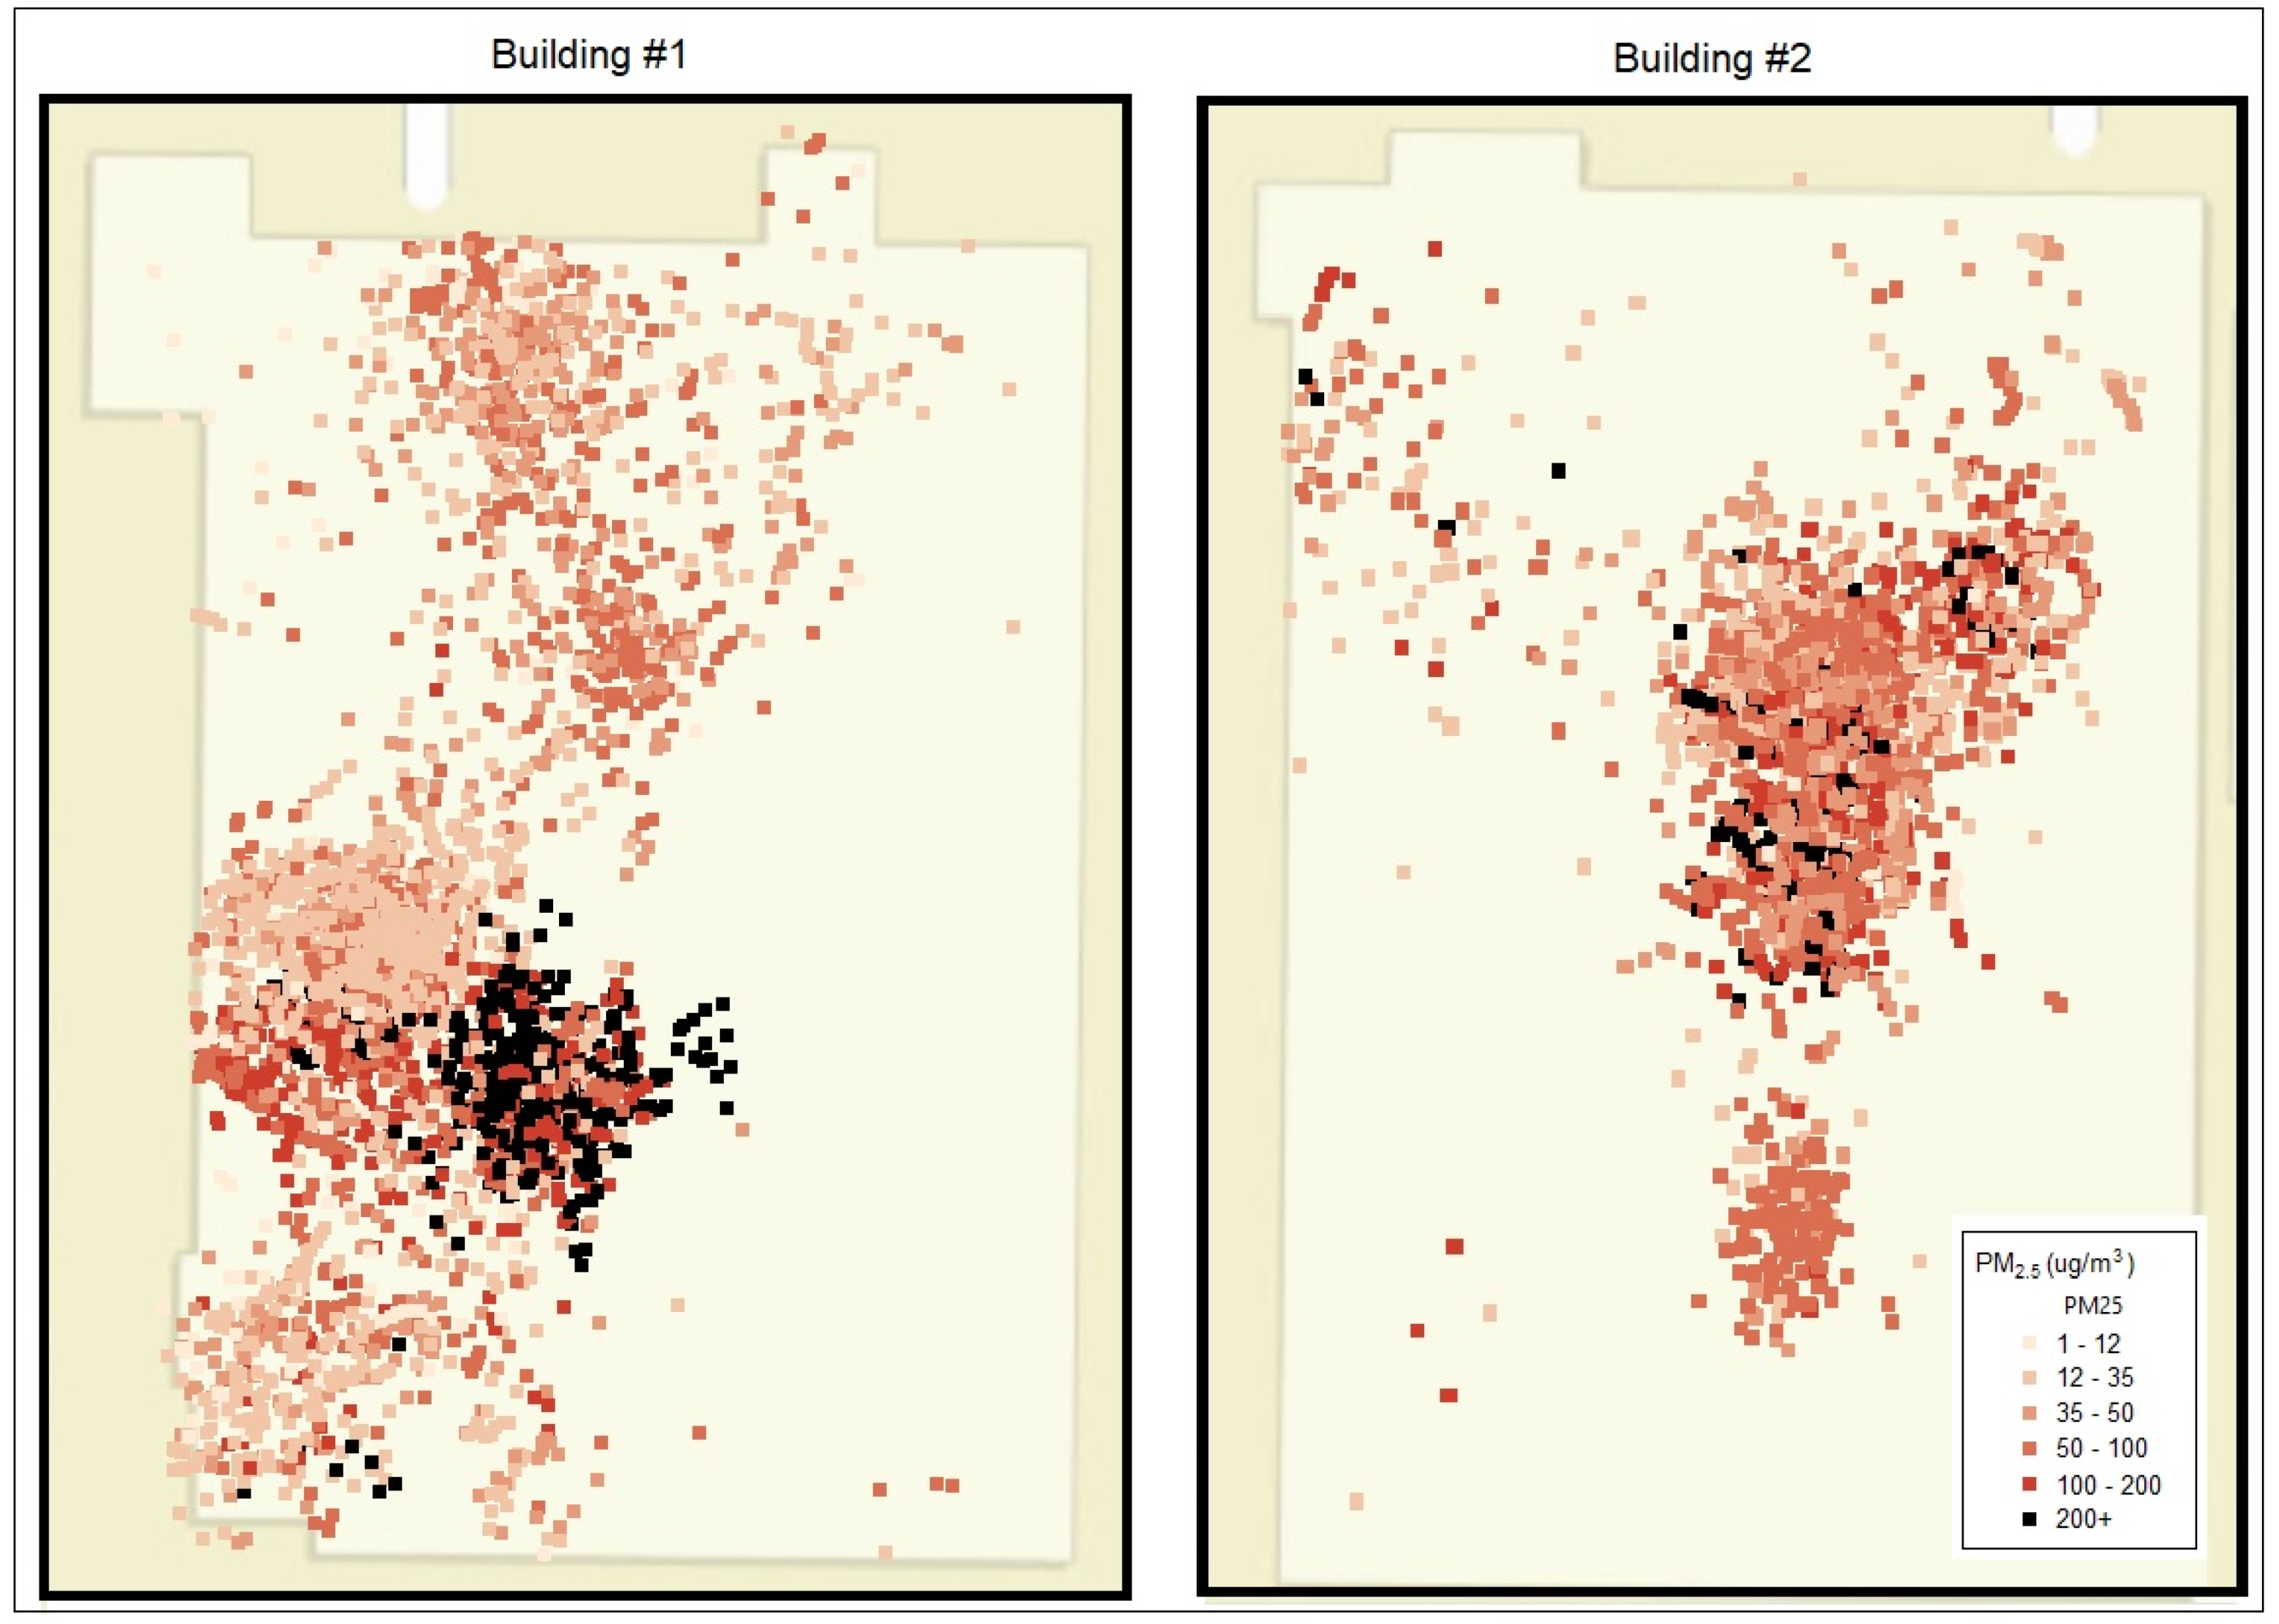
3.1. Indoor Monitoring

In total, there were 20,794 min (~347 h) of indoor air monitoring data collected across eight mobile and eight stationary air monitors during the three separate workdays and inside the two industrial buildings (Building 1 and Building 2). On average, the PM2.5 measured inside Building 1 and Building 2 was 120.3 µg/m3 and 102.2 µg/m3, respectively (combined average = 112.3 µg/m3), corresponding to levels approximately 6- to 7-times that of the outdoor environment. Maximum PM2.5 concentrations detected inside of both buildings reached 1000 µg/m3, which is the maximum value that the AtmoTube monitoring instrument is capable of reporting. This upper limit was reached 212 times (on a one-minute basis) during the three measurement days, which represents approximately 1% of the total indoor sampling measurements. Summary statistics for indoor and outdoor PM2.5 measurements categorized by monitoring type and building can be found in Table 1. Summary statistics did not change markedly when we restricted the analysis to only examine the minutes where both indoor and outdoor measurements were collected simultaneously, except that the increase in indoor PM2.5 concentrations became even more dramatic relative to the outdoors (Table S1).
When analyzing indoor personal PM2.5 across five general occupational groups, the greatest mean PM2.5 concentration (167.6 μg/m3) was detected by those working in “sanding and welding,” followed closely by those working strictly as welders (111.7 μg/m3). These averages were roughly 2- to 5-times greater than the other three occupational categories analyzed (33.5–68.1 μg/m3), which included sheet metal folding and assembly working. Mean PM2.5 concentrations calculated for each occupational category were based on a minimum of 1400 min of data collection per person. PM2.5 levels measured over these five occupational groups were 2- to 10-times higher than the mean PM2.5 concentration detected outside of the facility. Boxplots depicting the indoor PM2.5 concentrations across each occupational category relative to the average outdoor concentration are presented in Figure 3.
Figure 4 depicts between-person variation in average indoor PM2.5 among the eight employees who engaged in personal air monitoring during the three workdays inside the facility. The highest three-day average PM2.5 level was 210.9 μg/m3. Five out of eight employees showed average PM2.5 concentrations above 100 μg/m3 and three showed maximum 1-min concentrations above 500 μg/m3. Although not depicted in the figure, a mean PM2.5 concentration above 400 μg/m3 was reported for one stationary monitoring device. These data are presented in tabulated form in the Supplemental Materials (Table S2).
Figure 5 presents hourly average PM2.5 concentrations as measured by personal air monitors carried by three welding workers inside the industrial buildings and the percent of the workday during which AQI thresholds were exceeded. The graph clearly depicts the sharp air pollution spikes which occurred throughout each workday, which were sustained for hours at a time. Although AQI values are intended for outdoor assessments, the comparison is nonetheless illustrative. As shown, each of the three welders was exposed to AQI-defined “unhealthy” air for between 73.8% and 93.9% of their 8-h work shifts and were exposed to “very unhealthy” air for between 20.3% and 64.7% of their shifts. An example of the 1-min measurements (with no post-processing averaging) throughout a worker’s shift (Worker 6) is presented in Figure S3 of the Supplemental Materials Section.
Indoor air temperature data were also analyzed during the three-day measurement period. The average air temperature measured inside the two buildings was approximately equal between stationary and mobile monitoring devices and between the two buildings (80 ± 1 °F, ~27 °C). The maximum air temperature measured inside the buildings was 104 °F (40 °C), as detected by one of the stationary sampling devices, while the highest temperature recorded by a personal monitoring device was 95 °F (35 °C). Seven of the eight personal air sampling devices recorded maximum temperatures above 90 °F (~32 °C) during the work shift, while three measured maximum temperatures of 95 °F or higher.
As with outdoor personal air sampling, those collecting indoor measurements were outfitted with personal GPS devices to enable the identification of locations where outdoor air pollution hotspots and/or episodic spikes might exist, the results of which are presented in Figure 6 below. As shown, PM2.5 concentrations exhibited variability within each building, with the highest concentrations in Building 1 appearing in the lower left quadrant of the building and the highest concentrations in Building 2 appearing near the center. A juxtaposition of Figure 6 with Figure 1 shows welding activities to coincide with the highest PM2.5 levels in Building 1, likely explaining the drastically elevated PM2.5 in this area. A similar pattern is evident in Building 2, albeit without measurements collected as close to the welding stations.

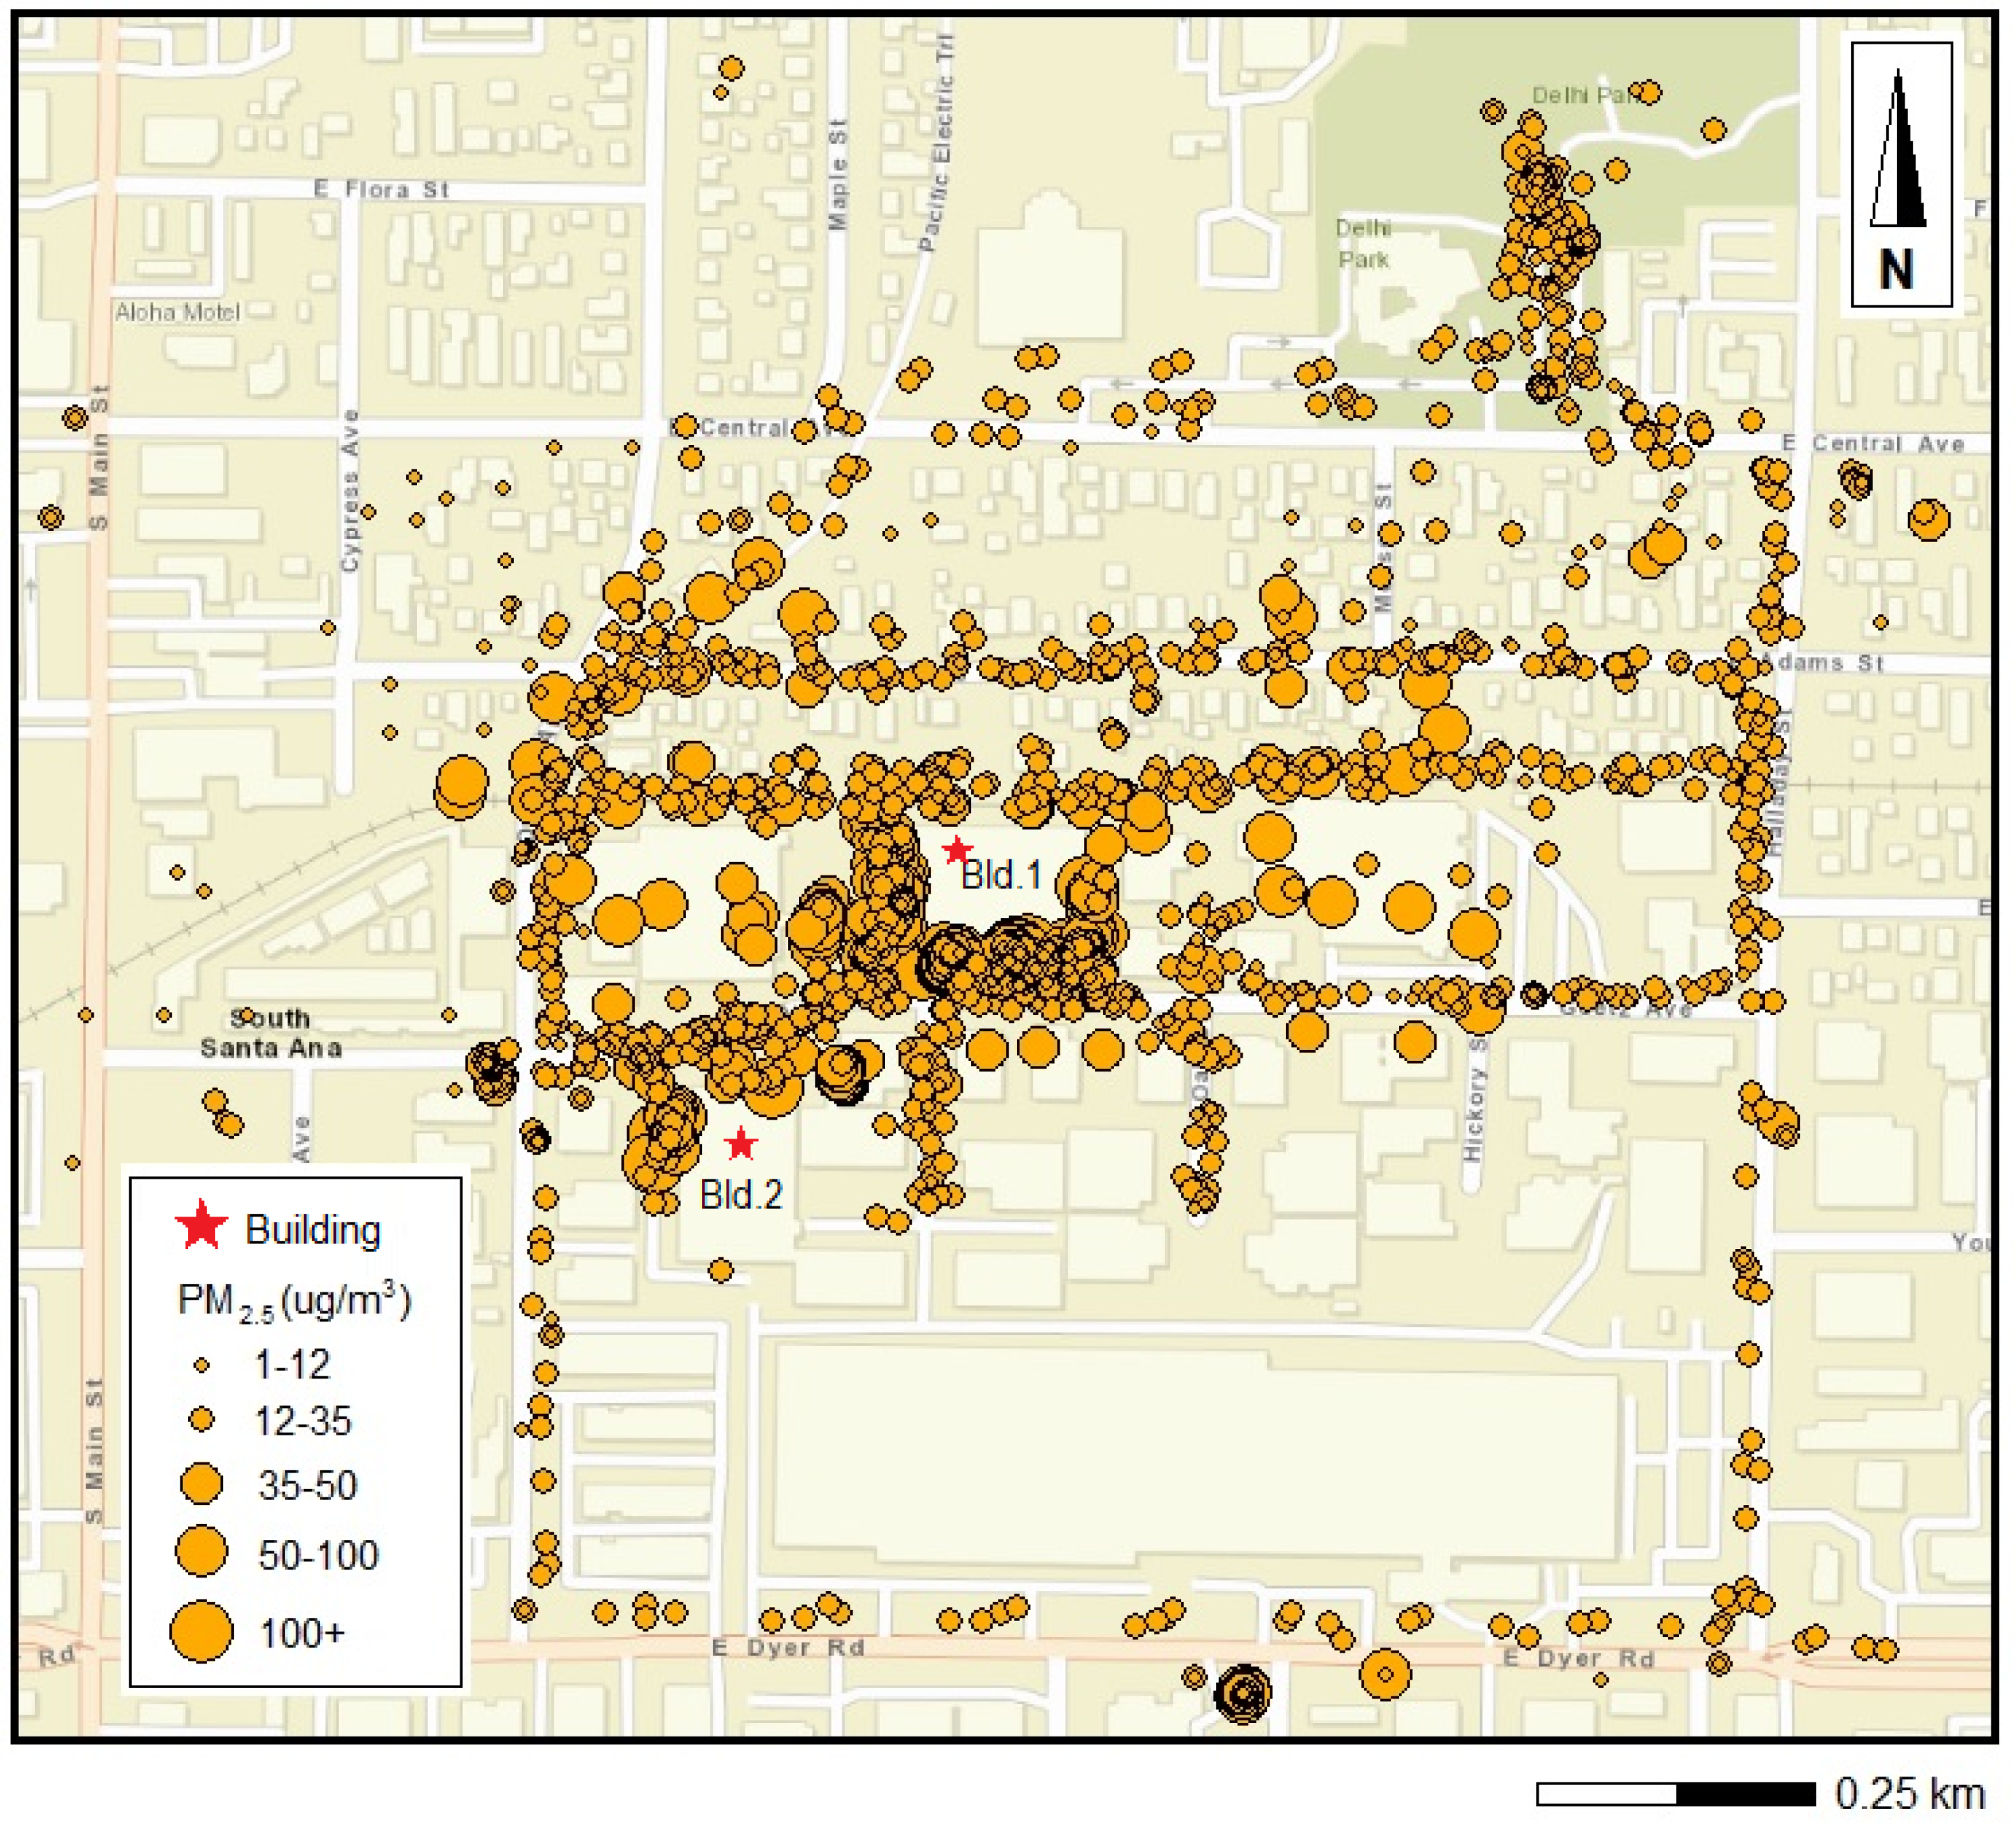
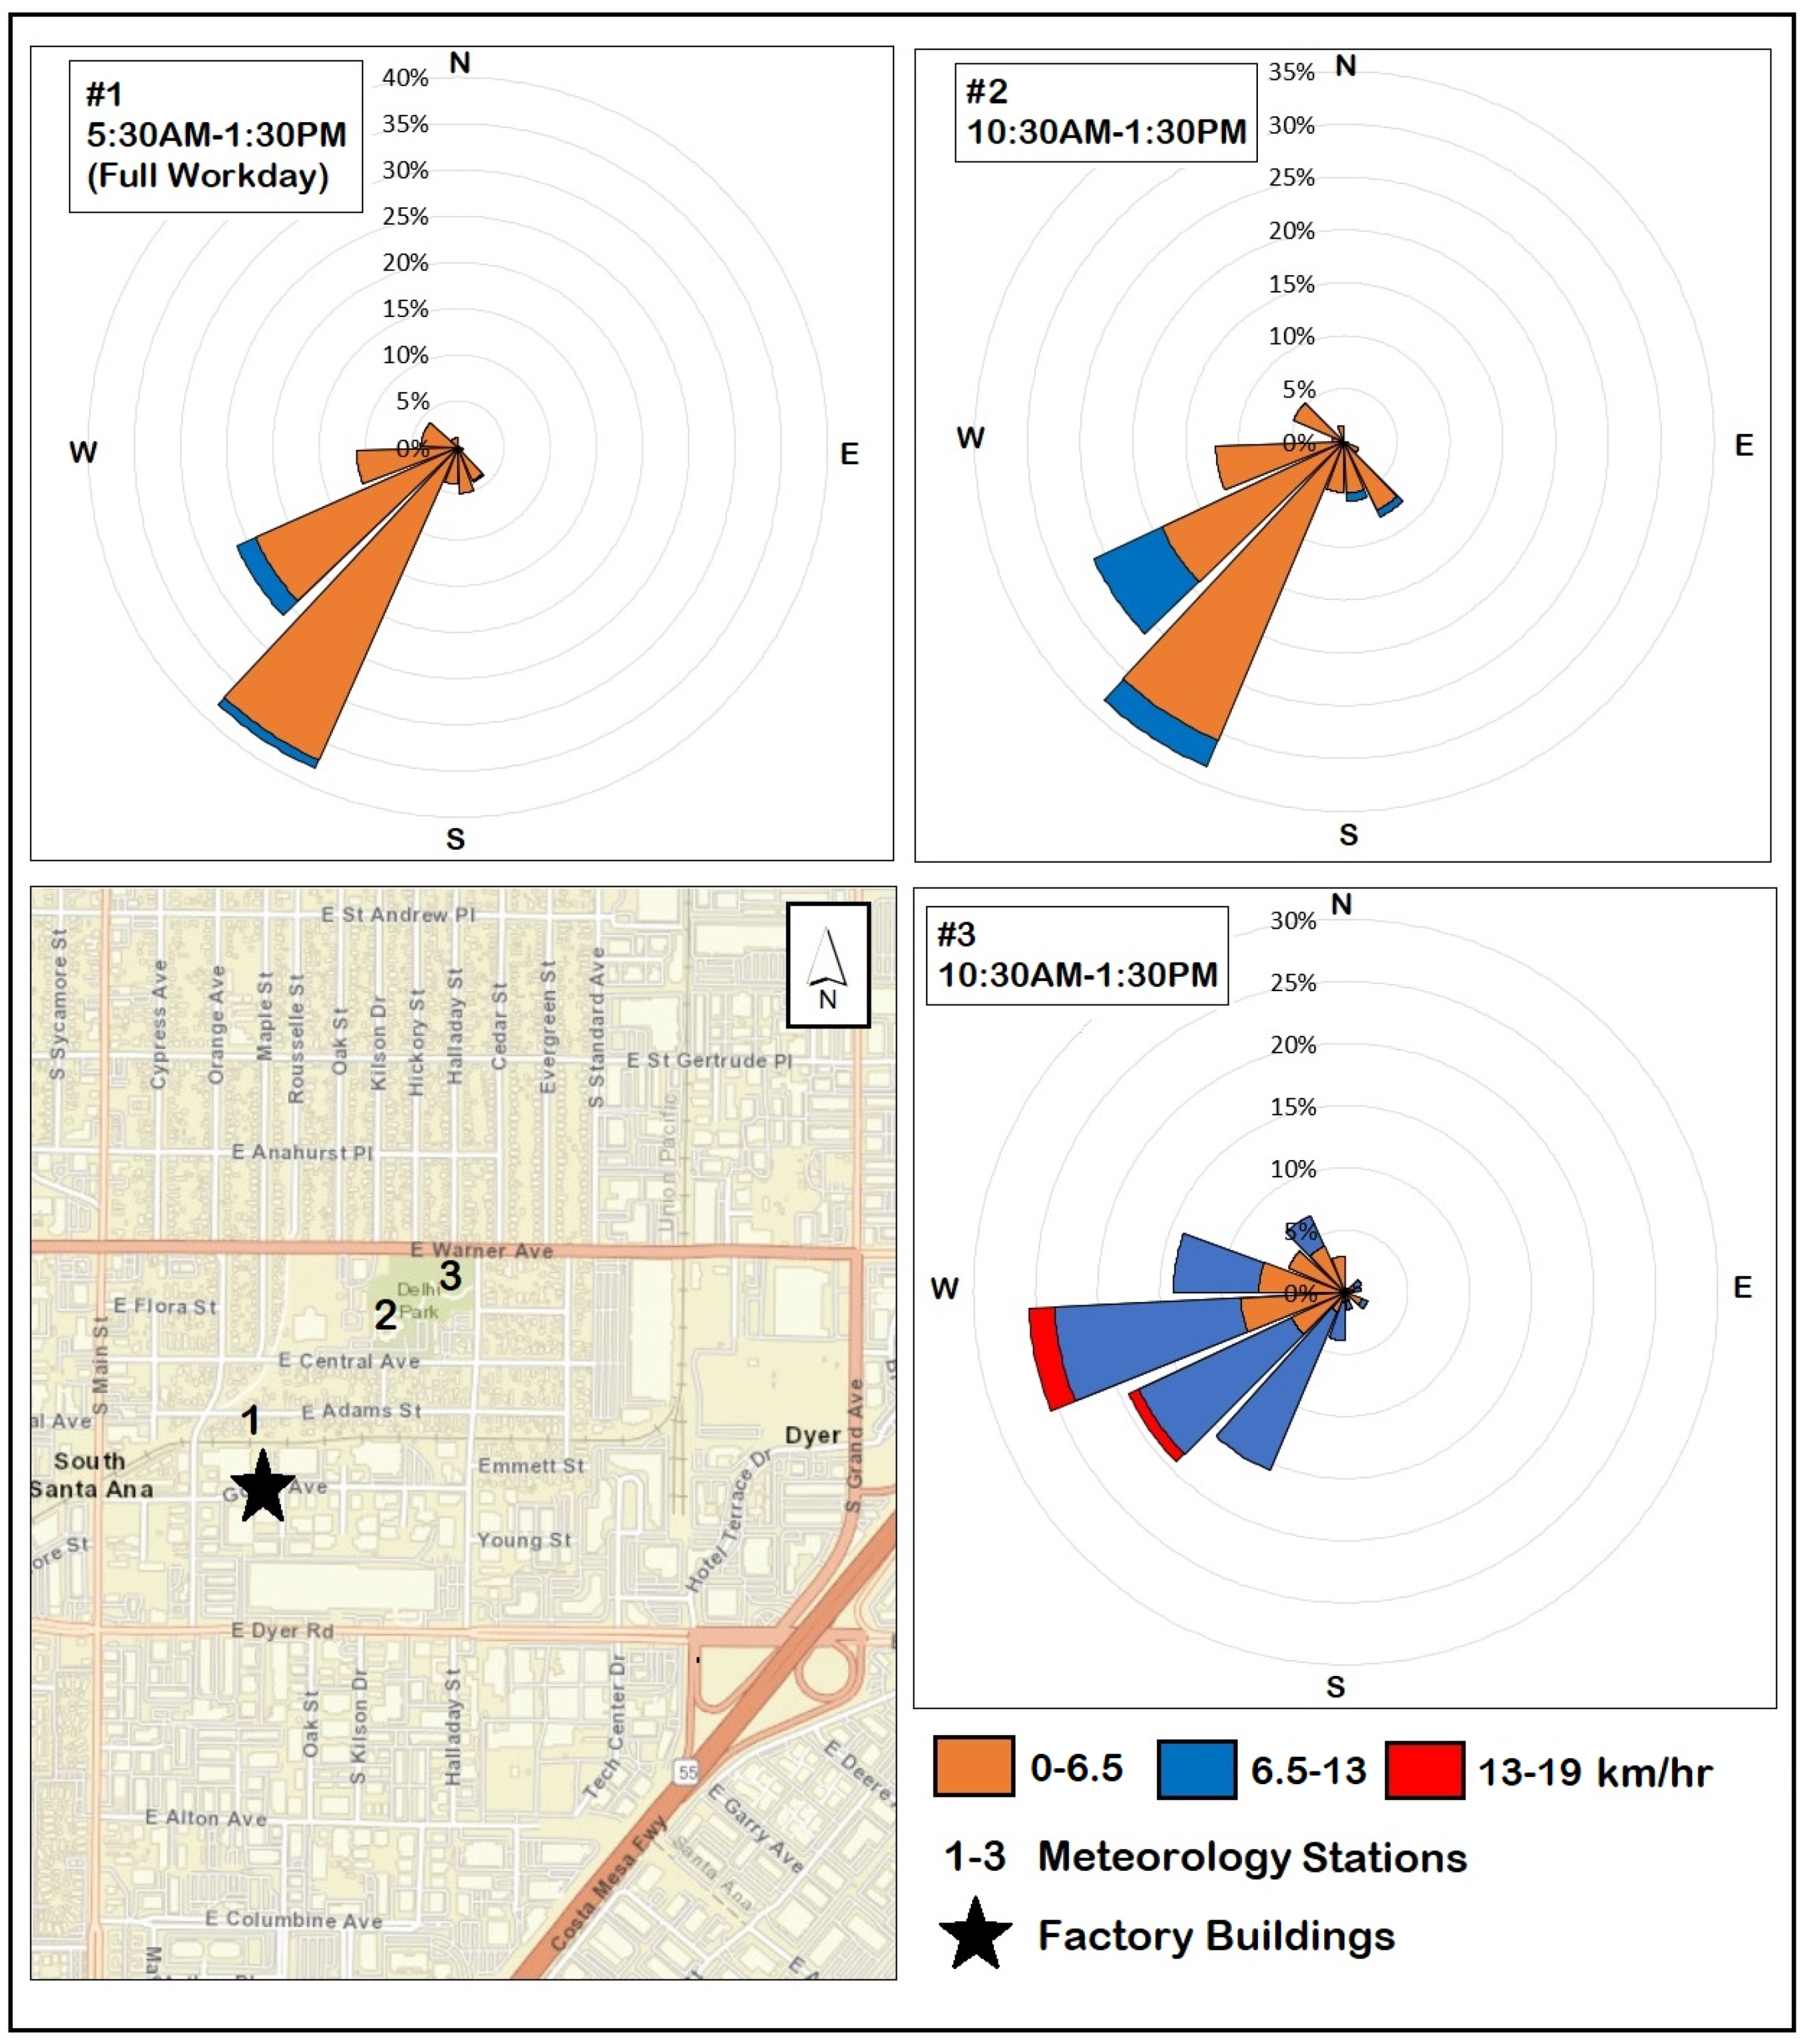
3.2. Outdoor Monitoring

There were 867 min (~14 h) of outdoor air monitoring data collected within a radius of about one block from the facility, a zone that encompassed both buildings along with other industrial facilities and a residential neighborhood. On average, PM2.5 measured outside of the buildings (which occurred on the same days as indoor measurements) was 17.3 µg/m3, with a maximum level of 39.0 µg/m3 (see Table 1).
Figure 7 depicts one-minute average PM2.5 measurements projected across the outdoor environment encompassing the two industrial buildings and adjacent residential areas using high-resolution GPS tracking devices. As shown, PM2.5 concentrations tended to be substantially higher in the industrial area relative to the neighboring residential community, albeit elevated levels were still apparent in some residential locations. Additional sampling sites located at the northern end of the map were collected as participants departed from and returned to the check-in station at Delhi Park. Such measurements were retained in Figure 7 as they provided additional air monitoring data and insights. What is more, outdoor measurements collected by workers (rather than outdoor-designated volunteers) immediately adjacent to the industrial buildings and elsewhere were retained for added insights since they were located outdoors. For these reasons, the sample size in Figure 7 (N = 2849) exceeds that of Table 1 for outdoor samples, with a maximum PM2.5 concentration that is similarly higher.
Figure 8 presents wind speed and direction from all three mobile weather stations as measured across the three-day sampling period. As shown, wind monitoring results agreed well with one another, each showing a general prevailing wind pattern originating from the west/southwest and moving toward the east/northeast, with the majority of wind data showing a velocity ranging from 0–19 km/h. In the context of the surrounding geography, this general wind pattern is moving in the direction of the industrial facility towards the adjacent community.

4. Discussion

In this study, indoor and outdoor PM2.5 was analyzed over three workdays inside and outside of an industrial facility in Santa Ana, CA, in order to characterize the air contamination to which workers are exposed while on the job, the extent to which the surrounding community may be exposed, and to ascertain whether the facility’s activities represent an important upwind source of PM2.5 to the surrounding community. This study engaged “citizen scientists” from both the industrial facility and surrounding community in order to collect air monitoring measurements using low-cost air sampling devices, along with temperature, wind, and GPS measurements.

4.1. Indoor Monitoring

Relative to the outdoor environment, indoor PM2.5 was 6- to 7-times greater on average. This demonstrates not only exceptionally high indoor air pollution concentrations, but also enables the ruling out of outdoor air pollution sources as the factor explaining the elevated PM2.5 measured indoors. Of the eight workers who measured the indoor air, five showed average PM2.5 greater than 100 μg/m3, with three reporting maximum levels above 500 μg/m3. For one worker, PM2.5 exceeded 200 μg/m3 when averaged over 26 h (approximately three work shifts). Welding was associated with the highest average PM2.5, compared to other activities (e.g., sheet metal folding), which is consistent with the expectation since welding is an activity known to emit heavy amounts of aerosols. This was affirmed by GPS-tracking data, which showed the highest levels of PM2.5 within the industrial facility to correspond spatially with the locations of welding activities. Such data also demonstrated the highest PM2.5 to be localized within the facility. Whether such variability was due to space (proximity to welding sites) or time (minutes elapsed since welding activity) could not be discerned given the current data.
Converting average PM2.5 measured inside the industrial buildings into the EPA’s air quality index, although intended to rank outdoor as opposed to indoor air quality, results in a ranking ranging from “unhealthy” to “very unhealthy” [54]. In comparing AtmoTube data to AQI benchmarks, it is worth noting that field evaluation of the AtmoTube did not demonstrate the AtmoTube devices to be systematically biased in the direction of higher PM2.5 concentrations, but rather in the direction of lower PM2.5 levels. Thus, AtmoTube measurements in this study may represent an underestimate of true PM2.5 levels [51].
For context, the average PM2.5 detected inside the two buildings was 25% higher than the maximum outdoor PM2.5 measured by the current author using the same devices (unpublished work) near Santa Ana roughly one year earlier when major wildfires in northern California resulted in visible smoke in southern California for several days. This comparison is all the more noteworthy when considering that this wildfire statistic relates to maximum levels, whereas the indoor measurements collected in this study consist of multi-hour averages. In general, smoke from wildfire events causes nearby PM2.5 concentrations to increase 2- to 4-fold. During such events, residents are often cautioned by public health officials to stay indoors, avoid exercise, and take other health-protective measures to minimize smoke exposure.
Studies on wildfires in southern California have demonstrated PM2.5 concentrations that were 10-times (>230 μg/m3) above baseline [55,56]. This is just barely greater than the level measured by one of the personal air monitors measured by a welder inside the industrial facility, and is roughly half the concentration measured by one of the stationary monitors placed in the building. Were the PM2.5 levels measured in this pilot study attributable to outdoor wildfires instead of welding and other industrial activities, recent California OSHA regulations stipulate that hazard communication to employees would be required, along with the implementation of engineering controls (where feasible) to minimize exposure, changes to work procedures and/or schedules to minimize exposure, and that employees make sufficient respirator masks available for employees [57]. For added reference, the annual outdoor PM2.5 concentration for the county (Orange Country, CA) as reported by SCAQMD ranged from 7.11 to 9.32 µg/m3 in 2019 [58], approximately 10% the level of the average indoor PM2.5 measured in this study.
A comparison of wildfire episodes and related public health guidance has traditionally not made for a common comparison when considering the occupational context since, in occupational settings, individuals are often considered less vulnerable (e.g., relatively healthy, not children nor elderly) to harmful exposures and therefore are protected by less stringent health standards. An example is the U.S. Occupational Health and Safety Administration (OSHA) 8-h time-weighted average Permissible Exposure Limit for occupational PM2.5 exposure which is set at 5000 µg/m3, a level that is 10-times higher than the maximum value recorded in this study and approximately 20- to 50-times higher than the levels often recorded by communities during wildfire events [59].
Findings from this study are similar to other studies that have documented welding activities to produce high levels of PM2.5. In numerous studies, PM2.5 concentrations of 1000 μg/m3 (as detected in this analysis) and even greater have been documented [60,61,62]. Welding usually releases PM2.5 as hot vaporized metal from the welding activity cools and condenses, producing small solid metal particles [63]. These vaporized particles oxidize upon contact with oxygen in the air, rendering metal oxides as the main constituents of welding fumes [63].
Although welding is known to expose workers to high PM2.5, evidence suggests that such exposure leads to adverse health effects. For example, Wong et al. (2014) studied a cohort of boilermaker workers for eight years and reported evidence of genetic trauma, as indicated by leukocyte telomere length, among workers who had been exposed to heavy welding fumes [64]. Similarly, a nine-year study of welders by Haluza et al. (2014) demonstrated a statistically significant association between the duration of occupational exposure to welding fumes and decreased pulmonary function [65]. In general, a wide amount of epidemiology research has shown welders to experience at least some form of respiratory illness, such as airway irritation, bronchitis, lung function alteration, and possibly lung cancer [63].
While worker populations are often considered relatively healthy, and therefore less vulnerable to adverse exposures, the studies demonstrating fume-related health effects among welders are important evidence of the harmful impacts that such individuals may nonetheless incur, in turn underscoring the importance of minimizing welding fumes in occupational settings. Importantly, while such welding-related health effects are known to depend, in part, on the chemical composition of PM2.5, a speciation analysis characterizing the metal PM constituents in the facility was beyond the scope of this study.
This study also reported average indoor temperatures in excess of 80 °F (~27 °C), with maximum levels exceeding 100 °F (~38 °C). In California, a recent outdoor heat illness prevention regulation now requires employers to provide shade, fresh drinking water, regular cooldown periods, and other health-protective measures for employees when workplace temperatures exceed 80 °F [66]. Federally, OSHA also recognizes the importance of avoiding excessive heat, particularly during heatwaves, noting that 50–70% of heat-related outdoor fatalities occur in the first few days of working in warm or hot settings due to the body’s lack of tolerance prior to acclimatization [67].

4.2. Outdoor Monitoring

Although the mean outdoor PM2.5 reported in this study was substantially lower than the average concentrations measured inside the industrial buildings, the outdoor average (17.3 μg/m3) was nonetheless over ~50% higher than the annual mean reported for Orange Country by SCAQMD in 2019, thus underscoring reason for continued monitoring [58]. An analysis of outdoor average PM2.5 concentrations paired with GPS devices showed the highest levels measured immediately adjacent to the two industrial facilities. That elevated PM2.5 was reported across the entire industrial area as a whole, relative to the neighboring residential community, however, suggests that multiple industrial facilities may be contributing to ambient PM2.5 concentrations. Importantly, the current study cannot decipher as to whether the two industrial buildings examined in this study are the primary contributors to ambient outdoor air pollution, although the highest outdoor PM2.5 concentrations being collected immediately adjacent to the two buildings is supportive evidence of this. Irrespective of which industrial emitter is of greatest importance to local air pollution, results from three mobile weather stations suggests a prevailing wind pattern capable of transporting such emissions directly to the adjacent residential neighborhood to the north.

4.3. Improving Workplace Health

Findings from this study suggest that ongoing air pollution monitoring both inside and outside of the industrial facilities is needed. A convenient and effective way to accomplish this is to install low-cost PM2.5 measurement monitors (e.g., PurpleAir sensors [68]) inside the industrial buildings, along with separate devices installed across the homes and/or backyards of local residents. This will allow for a better characterization of long-term air pollution to which workers and community members are exposed and will assist in determining whether outdoor air pollution exceeds national standards.
Additionally, this study underscores the need to implement basic measures of air quality control inside the industrial facilities, including the installation of adequate ventilation systems to direct air contaminants away from the breathing zones of workers. Such ventilation systems should contain high-efficiency particulate air (HEPA) filters to remove fine particles from the indoor environment and to prevent them from being exhausted outdoors to the local community. What is more, welders should be outfitted with personal protective equipment, including face masks equipped with supplied-air respirators.
Upon completion of this field study, summary statistics demonstrating the elevated PM2.5 concentrations measured by workers were made available to management, as well as to fellow company workers and the public. Workers and organizers subsequently requested that health-protective measures be taken to reduce workplace exposures. Within approximately three weeks, management provided respirators to all welders in the facility. Although this was initially seen as a positive step toward improved working conditions, it was later seen as a vanity measure given outstanding complaints by workers that included the fact that workers were not properly trained on use of the respirators, respirators were not fitted and were not of the “supplied air” variety, and many non-welders did not receive respirators despite sharing closely located workstations. What is more, in learning of the air pollution problem, management conducted its own privately contracted air sampling, the results of which have not been disclosed to the workers despite numerous requests. It is also noteworthy that following the notification of the problem were multiple pay raises awarded to all employees, but disproportionately to welders, which have been welcomed by some workers while interpreted by others as a managerial attempt to quell complaints without addressing the underlying air quality issue. Worker communications with management to resolve the problem are therefore ongoing.
Results from this study and the response from management underscore the complexities of worker–management dynamics and the challenges workers often face in seeking a healthier work environment. What is more, it suggests a need for increased site visits to industrial facilities by OSHA, and more stringent air pollution standards as it relates to the indoor occupational environment, a need which may depend on increased state and federal funding to carry out such tasks and policy measures. In the absence of regulatory oversight, industry actors may otherwise circumvent key health protective measures in the interest of short-term cost savings. Importantly, this investigation demonstrates the progress that workers and community members, when acting collectively, can make as it relates to improving their understanding of personal exposures and improving the health of the workplace and community. Of note, given the limited number of days during which air pollution concentrations were measured, this investigation can only be considered a pilot study that demonstrates the existence of elevated indoor PM2.5 concentrations, and cannot be said to reflect chronic exposures that workers experience over the course of an entire month or year.

5. Conclusions

In this pilot study, we engaged “citizen scientists” for the collection of PM2.5 measurements over three workdays inside and outside an industrial facility located in Santa Ana, CA, in order to characterize the PM2.5 exposure to which workers are exposed and to assess the potential for downwind community exposures. Results demonstrated extremely high PM2.5 concentrations inside the facility that were nearly seven-times higher than that measured outdoors. Welding-related activities within the buildings tended to result in the highest PM2.5 concentrations. A comparison of hourly averaged PM2.5 measurements with AQI benchmarks demonstrated the indoor air to be “unhealthy” for welding workers for over three-fourths of their work shifts. While outdoor average PM2.5 levels were not exceptionally high, maximum levels underscored the need for continued monitoring. What is more, wind trajectory data confirmed the potential for industrial emissions to impact the neighboring community to the north. This study demonstrates the utility of using low-cost air quality sensors combined with employee knowledge and participation for the investigation of workplace air pollution exposure as well as the facilitation of greater health-related awareness, education, and empowerment among workers and community members. Results also illustrate the need for basic measures of indoor air pollution control and more stringent regulation to reduce indoor PM2.5 levels, along with ongoing air monitoring within the Santa Ana facility and the need for continued air monitoring across both this study region and other industrial facilities.

Supplementary Materials

The following supporting information can be downloaded at: https://www.mdpi.com/article/10.3390/atmos13050722/s1, Table S1. Summary statistics for PM2.5 concentrations restricted to minutes when outdoor and indoor samples were collected simultaneously; Table S2. Summary statistics for PM2.5 (μg/m3) concentrations across all sampling devices averaged over three workdays; Figure S1. Aerial image depicting industrial facility (entire lower half of image) in relation to neighboring homes (upper half); Figure S2. Map depicting industrial facility and city of Santa Ana within California; Figure S3. Example of the three-day sampling period as measured by a personal air monitor carried by one of the welders (Worker 6) inside of the industrial facility.

Author Contributions

Conceptualization, S.M.; methodology, S.M.; software, S.M.; validation, S.M.; formal analysis, S.M.; investigation, S.M. and J.R.; resources, J.R. and J.W.; data curation, S.M.; writing—original draft preparation, S.M.; writing—review and editing, S.M., J.R. and J.W.; visualization, S.M.; supervision, S.M. and J.W.; project administration, S.M. and J.W.; funding acquisition, S.M. All authors have read and agreed to the published version of the manuscript.

Funding

This research was funded in part by the International Association of Sheet Metal, Air, Rail and Transportation Workers. However, this organization played no role in the scientific analysis or determination of key findings.

Institutional Review Board Statement

Not applicable.

Informed Consent Statement

Informed consent was obtained from all participants who helped collect field data.

Data Availability Statement

The data presented in this study are available upon request from the corresponding author.

Acknowledgments

We would like to thank all of the committed workers, community leaders, and other local volunteers who helped to envision this project and collect field data, as well as the Madison Park Neighborhood Association.

Conflicts of Interest

The authors declare no conflict of interest.

References

  1. Reid, C.E.; Brauer, M.; Johnston, F.H.; Jerrett, M.; Balmes, J.R.; Elliott, C.T. Critical review of health impacts of wildfire smoke exposure. Environ. Health Perspect. 2016, 124, 1334–1343. [Google Scholar] [CrossRef] [PubMed] [Green Version]
  2. Wu, J.; Winer, A.; Delfino, R. Exposure assessment of particulate matter air pollution before, during, and after the 2003 Southern California wildfires. Atmos. Environ. 2006, 40, 3333–3348. [Google Scholar] [CrossRef] [Green Version]
  3. Vedal, S.; Dutton, S.J. Wildfire air pollution and daily mortality in a large urban area. Environ. Res. 2006, 102, 29–35. [Google Scholar] [CrossRef]
  4. Dockery, D.W.; Pope, C.A., III; Xu, X.; Spengler, J.D.; Ware, J.H.; Fay, M.E.; Ferris, B.G., Jr.; Speizer, F.E. An association between air pollution and mortality in six U.S. cities. N. Engl. J. Med. 1993, 329, 1753–1759. [Google Scholar] [CrossRef] [PubMed] [Green Version]
  5. Chow, J.C.; Watson, J.G.; Mauderly, J.L.; Costa, D.L.; Wyzga, R.E.; Vedal, S.; Hidy, G.M.; Altshuler, S.L.; Marrack, D.; Heuss, J.M.; et al. Health effects of fine particulate air pollution: Lines that connect. J. Air Waste Manag. Assoc. 2006, 56, 1368–1380. [Google Scholar] [CrossRef] [PubMed]
  6. Kloog, I.; Coull, B.A.; Zanobetti, A.; Koutrakis, P.; Schwartz, J.D. Acute and chronic effects of particles on hospital admissions in New-England. PLoS ONE 2012, 7, e34664. [Google Scholar] [CrossRef] [PubMed] [Green Version]
  7. Bu, X.; Xie, Z.; Liu, J.; Wei, L.; Wang, X.; Chen, M.; Ren, H. Global PM2.5-attributable health burden from 1990 to 2017: Estimates from the Global Burden of disease study 2017. Environ. Res. 2021, 197, 111123. [Google Scholar] [CrossRef] [PubMed]
  8. Flies, E.J.; Mavoa, S.; Zosky, G.R.; Mantzioris, E.; Williams, C.; Eri, R.; Brook, B.W.; Buettel, J.C. Urban-associated diseases: Candidate diseases, environmental risk factors, and a path forward. Environ. Int. 2019, 133, 105187. [Google Scholar] [CrossRef]
  9. WHO Air Quality Gudelines. In WHO Global Air Quality Guidelines: Particulate Matter (PM2.5 and PM10), Ozone, Nitrogen Dioxide, Sulfur Dioxide and Carbon Monoxide; World Health Organization: Geneva, Switzerland, 2021.
  10. Yang, X.; Zhang, T.; Zhang, Y.; Chen, H.; Sang, S. Global burden of COPD attributable to ambient PM2.5 in 204 countries and territories, 1990 to 2019: A systematic analysis for the Global Burden of Disease Study 2019. Sci. Total Environ. 2021, 796, 148819. [Google Scholar] [CrossRef]
  11. Verbeek, T. Unequal residential exposure to air pollution and noise: A geospatial environmental justice analysis for Ghent, Belgium. SSM Popul. Health 2019, 7, 100340. [Google Scholar] [CrossRef]
  12. Li, V.O.; Han, Y.; Lam, J.C.; Zhu, Y.; Bacon-Shone, J. Air pollution and environmental injustice: Are the socially deprived exposed to more PM2.5 pollution in Hong Kong? Environ. Sci. Policy 2018, 80, 53–61. [Google Scholar] [CrossRef]
  13. Mikati, I.; Benson, A.F.; Luben, T.J.; Sacks, J.D.; Richmond-Bryant, J. Disparities in distribution of particulate matter emission sources by race and poverty status. Am. J. Public Health 2018, 108, 480–485. [Google Scholar] [CrossRef] [PubMed]
  14. Morello-Frosch, R.; Pastor, M.; Porras, C.; Sadd, J. Environmental justice and regional inequality in Southern California: Implications for furture research. Environ. Health Perspect. 2002, 110, 149–154. [Google Scholar] [CrossRef] [PubMed] [Green Version]
  15. Chakraborty, J.; Zandbergen, P.A. Children at risk: Measuring racial/ethnic disparities in potential exposure to air pollution at school and home. J. Epidemiol. Community Health 2007, 61, 1074–1079. [Google Scholar] [CrossRef] [PubMed] [Green Version]
  16. Gaffron, P.; Niemeier, D. School locations and traffic Emissions—Environmental (In)justice findings using a new screening method. Int. J. Environ. Res. Public Health 2015, 12, 2009–2025. [Google Scholar] [CrossRef] [Green Version]
  17. Mirabelli, M.C.; Wing, S.; Marshall, S.W.; Wilcosky, T.C. Race, poverty, and potential exposure of middle-school students to air emissions from confined swine feeding operations. Environ. Health Perspect. 2006, 114, 591–596. [Google Scholar] [CrossRef] [Green Version]
  18. Pastor, M.; Sadd, J.L.; Morello-Frosch, R. Who’s minding the kids? Pollution, public schools, and environmental justice in Los Angeles. Soc. Sci. Q. 2002, 83, 263–280. [Google Scholar] [CrossRef]
  19. United Church of Christ Commission for Racial Justice. Toxic Waste and Race in he United States: A National Report on the Racial and Socio-Economic Characteristics of Communities with Hazardous Waste Sites; Commission for Racial Justice: New York, NY, USA, 1987.
  20. Collins, T.W.; Grineski, S.E.; Nadybal, S.M. A Comparative Approach for Environmental Justice Analysis: Explaining Divergent Societal Distributions of Particulate Matter and Ozone Pollution across U.S. Neighborhoods. Ann. Am. Assoc. Geogr. 2022, 112, 522–541. [Google Scholar] [CrossRef]
  21. Woo, B.; Kravitz-Wirtz, N.; Sass, V.; Crowder, K.; Teixeira, S.; Takeuchi, D.T. Residential Segregation and Racial/Ethnic Disparities in Ambient Air Pollution. Race Soc. Probl. 2019, 11, 60–67. [Google Scholar] [CrossRef]
  22. Tessum, C.W.; Paolella, D.A.; Chambliss, S.E.; Apte, J.S.; Hill, J.D.; Marshall, J.D. PM2.5 polluters disproportionately and systemically affect people of color in the United States. Sci. Adv. 2021, 7, 1–7. [Google Scholar] [CrossRef]
  23. Rosofsky, A.; Levy, J.I.; Zanobetti, A.; Janulewicz, P.; Fabian, M.P. Temporal trends in air pollution exposure inequality in Massachusetts. Environ. Res. 2018, 161, 76–86. [Google Scholar] [CrossRef] [PubMed]
  24. Khajeamiri, Y.; Sharifi, S.; Moradpour, N.; Khajeamiri, A. A review on the effect of air pollution and exposure to PM, NO2, O3, SO2, CO and heavy metals on viral respiratory infections. J. Air Pollut. Health 2021, 5, 243–258. [Google Scholar] [CrossRef]
  25. Blumberg, A.H.; Ebelt, S.T.; Liang, D.; Morris, C.R.; Sarnat, J.A. Ambient air pollution and sickle cell disease-related emergency department visits in Atlanta, GA. Environ. Res. 2020, 184, 109292. [Google Scholar] [CrossRef] [PubMed]
  26. Zu, D.; Zhai, K.; Qiu, Y.; Pei, P.; Zhu, X.; Han, D. The impacts of air pollution on mental health: Evidence from the chinese university students. Int. J. Environ. Res. Public Health 2020, 17, 6734. [Google Scholar] [CrossRef] [PubMed]
  27. Zhu, Y.; Xie, J.; Huang, F.; Cao, L. Association between short-term exposure to air pollution and COVID-19 infection: Evidence from China. Sci. Total Environ. 2020, 727, 138704. [Google Scholar] [CrossRef] [PubMed]
  28. Milicevic, O.; Salom, I.; Rodic, A.; Markovic, S.; Tumbas, M.; Zigic, D.; Djordjevic, M.; Djordjevic, M. PM2.5 as a major predictor of COVID-19 basic reproduction number in the USA. Environ. Res. 2021, 201, 111526. [Google Scholar] [CrossRef]
  29. Liang, D.; Shi, L.; Zhao, J.; Liu, P.; Sarnat, J.A.; Gao, S.; Schwartz, J.; Liu, Y.; Ebelt, S.T.; Scovronick, N.; et al. Urban Air Pollution May Enhance COVID-19 Case-Fatality and Mortality Rates in the United States. Innovation 2020, 1, 100047. [Google Scholar] [CrossRef]
  30. Hendryx, M.; Luo, J. COVID-19 prevalence and fatality rates in association with air pollution emission concentrations and emission sources. Environ. Pollut. 2020, 265, 115126. [Google Scholar] [CrossRef]
  31. Páez-Osuna, F.; Valencia-Castañeda, G.; Rebolledo, U.A. The link between COVID-19 mortality and PM2.5 emissions in rural and medium-size municipalities considering population density, dust events, and wind speed. Chemosphere 2022, 286, 131634. [Google Scholar] [CrossRef]
  32. Copat, C.; Cristaldi, A.; Fiore, M.; Grasso, A.; Zuccarello, P.; Signorelli, S.S.; Conti, G.O.; Ferrante, M. The role of air pollution (PM and NO2) in COVID-19 spread and lethality: A systematic review. Environ. Res. 2020, 191, 110129. [Google Scholar] [CrossRef]
  33. English, P.B.; Richardson, M.J.; Garzón-Galvis, C. From Crowdsourcing to Extreme Citizen Science: Participatory Research for Environmental Health. Annu. Rev. Public Health 2018, 39, 335–350. [Google Scholar] [CrossRef] [PubMed] [Green Version]
  34. Zagozewski, R.; Judd-Henrey, I.; Nilson, S.; Bharadwaj, L. Perspectives on past and Present Waste Disposal Practices: A community-Based Participatory Research Project in Three Saskatchewan First Nations Communities. Environ. Health Insights 2011, 5, 9–20. [Google Scholar] [CrossRef] [PubMed] [Green Version]
  35. Gonzalez, P.A.; Minkler, M.; Garcia, A.P.; Gordon, M.; Garzón, C.; Palaniappan, M.; Prakash, S.; Beveridge, B. Community-based participatory research and policy advocacy to reduce diesel exposure in West Oakland, California. Am. J. Public Health 2011, 101, 166–175. [Google Scholar] [CrossRef] [PubMed]
  36. Garcia, A.P.; Minkler, M.; Cardenas, Z.; Grills, C.; Porter, C. Engaging Homeless Youth in Community-Based Participatory Research: A Case Study From Skid Row, Los Angeles. Health Promot. Pract. 2014, 15, 18–27. [Google Scholar] [CrossRef]
  37. Masri, S.; LeBrón, A.; Logue, M.; Valencia, E.; Ruiz, A.; Reyes, A.; Lawrence, J.M.; Wu, J. Social and spatial distribution of soil lead concentrations in the City of Santa Ana, California: Implications for health inequities. Sci. Total Environ. 2020, 743, 1–11. [Google Scholar] [CrossRef]
  38. Perelló, J.; Cigarini, A.; Vicens, J.; Bonhoure, I.; Rojas-Rueda, D.; Nieuwenhuijsen, M.J.; Cirach, M.; Daher, C.; Targa, J.; Ripoll, A. Large-scale citizen science provides high-resolution nitrogen dioxide values and health impact while enhancing community knowledge and collective action. Sci. Total Environ. 2021, 789, 147750. [Google Scholar] [CrossRef]
  39. Varaden, D.; Leidland, E.; Lim, S.; Barratt, B. “I am an air quality scientist”—Using citizen science to characterise school children’s exposure to air pollution. Environ. Res. 2021, 201, 111536. [Google Scholar] [CrossRef]
  40. Webb, L.; Sleeth, D.K.; Handy, R.; Stenberg, J.; Schaefer, C.; Collingwood, S.C. Indoor Air Quality Issues for Rocky Mountain West Tribes. Front. Public Health 2021, 9, 1–7. [Google Scholar] [CrossRef]
  41. Johnston, J.E.; Juarez, Z.; Navarro, S.; Hernandez, A.; Gutschow, W. Youth engaged participatory air monitoring: A ‘day in the life’ in urban environmental justice communities. Int. J. Environ. Res. Public Health 2020, 17, 93. [Google Scholar] [CrossRef] [Green Version]
  42. Bi, J.; Stowell, J.; Seto, E.Y.W.; English, P.B.; Al-Hamdan, M.Z.; Kinney, P.L.; Freedman, F.R.; Liu, Y. Contribution of low-cost sensor measurements to the prediction of PM2.5levels, A case study in Imperial County, California, USA. Environ. Res. 2020, 180, 108810. [Google Scholar] [CrossRef]
  43. Morawska, L.; Thai, P.K.; Liu, X.; Asumadu-Sakyi, A.; Ayoko, G.; Bartonova, A.; Bedini, A.; Chai, F.; Christensen, B.; Dunbabin, M.; et al. Applications of low-cost sensing technologies for air quality monitoring and exposure assessment: How far have they gone? Environ. Int. 2018, 116, 286–299. [Google Scholar] [CrossRef] [PubMed]
  44. Pope, F.D.; Gatari, M.; Ng’ang’a, D.; Poynter, A.; Blake, R. Airborne particulate matter monitoring in Kenya using calibrated low-cost sensors. Atmos. Chem. Phys. 2018, 18, 15403–15418. [Google Scholar] [CrossRef] [Green Version]
  45. Larkin, A.; Hystad, P. Towards Personal Exposures: How Technology Is Changing Air Pollution and Health Research. Curr. Environ. Health Rep. 2017, 4, 463–471. [Google Scholar] [CrossRef] [PubMed]
  46. Holm, S.M.; Miller, M.D.; Balmes, J.R. Health effects of wildfire smoke in children and public health tools: A narrative review. J. Expo. Sci. Environ. Epidemiol. 2021, 31, 1–20. [Google Scholar] [CrossRef]
  47. Bi, J.; Wildani, A.; Chang, H.H.; Liu, Y. Incorporating Low-Cost Sensor Measurements into High-Resolution PM2.5 Modeling at a Large Spatial Scale. Environ. Sci. Technol. 2020, 54, 2152–2162. [Google Scholar] [CrossRef]
  48. Delp, W.W.; Singer, B.C. Wildfire Smoke Adjustment Factors for Low-Cost and Professional PM2.5 Monitors with Optical Sensors. Sensors 2020, 20, 3683. [Google Scholar] [CrossRef]
  49. Masri, S.; Cox, K.; Flores, L.; Rea, J.; Wu, J. Community-Engaged Use of Low-Cost Sensors to Assess the Spatial Distribution of PM2.5 Concentrations across Disadvantaged Communities: Results from a Pilot Study in Santa Ana, CA. Atmosphere 2022, 13, 304. [Google Scholar] [CrossRef]
  50. Kingspan Kingspan Group, PLC. Available online: https://www.kingspan.com/group/ (accessed on 15 March 2022).
  51. South Coast Air Quailty Management District (SCAQMD): Air Quality Sensor Performance Evaluation Center. Field Evaluation Atmotube Pro; SCAQMD: Diamond Bar, CA, USA, 2020.
  52. South Coast Air Quailty Management District (SCAQMD). Field Evaluation of AtmoTube Pro VOC Sensor; SCAQMD: Diamond Bar, CA, USA, 2021.
  53. AtmoTube How does Atmotube PM Sensor Work? Available online: https://help.atmotube.com/technical/3-atmotube-pm/ (accessed on 15 March 2022).
  54. Cornell Law School Legal Information Institute. Available online: https://www.law.cornell.edu/cfr/text/40/appendix-G_to_part_58#fn4_tbl3 (accessed on 10 December 2021).
  55. Aguilera, R.; Gershunov, A.; Ilango, S.D.; Morales, J.G. Santa Ana Winds of Southern California Impact PM2.5 with and Without Smoke from Wildfires. GeoHealth 2019, 4, 1–9. [Google Scholar] [CrossRef] [Green Version]
  56. Cleland, S.E.; West, J.J.; Jia, Y.; Reid, S.; Raffuse, S.; O Neill, S.; Serre, M.L. Estimating Wildfire Smoke Concentrations during the October 2017 California Fires through BME Space/Time Data Fusion of Observed, Modeled, and Satellite-Derived PM2.5. Environ. Sci. Technol. 2020, 54, 13439–13447. [Google Scholar] [CrossRef]
  57. Cal/OSHA. §5141.1 Protection from Wildfire Smoke; Cal/OSHA: Oakland, CA, USA, 2021.
  58. South Coast Air Quailty Management District (SCAQMD). 2019 Air Quality; SCAQMD: Diamond Bar, CA, USA, 2019.
  59. U.S. Occupational Safety and Health Administration Particulates Not Otherwise Regulated, Total and Respirable Dust. Available online: https://www.osha.gov/chemicaldata/801 (accessed on 15 March 2022).
  60. Kim, J.Y.; Chen, J.-C.; Boyce, P.D.; Christiani, D.C. Exposure to welding fumes is associated with acute systemicinflammatory responses. Occup. Environ. Med. 2005, 62, 157–163. [Google Scholar] [CrossRef]
  61. Hartmann, L.; Bauer, M.; Bertram, J.; Gube, M.; Lenz, K.; Reisgen, U.; Schettgen, T.; Kraus, T.; Brand, P. Assessment of the biological effects of welding fumes emitted from inert gas welding processes of aluminium and zinc-plated materials in humans. Int. J. Hyg. Environ. Health 2014, 217, 160–168. [Google Scholar] [CrossRef] [PubMed]
  62. Antonini, J.M.; Stone, S.; Roberts, J.R.; Chen, B.; Schwegler-Berry, D.; Afshari, A.A.; Frazer, D.G. Effect of short-term stainless steel welding fume inhalation exposure onlung inflammation, injury, and defense responses in rats. Toxicol. Appl. Pharmacol. 2007, 223, 234–245. [Google Scholar] [CrossRef] [PubMed]
  63. Antonini, J.M. Health effects of welding. Crit. Rev. Toxicol. 2003, 33, 61–103. [Google Scholar] [CrossRef] [PubMed]
  64. Wong, J.Y.Y.; De Vivo, I.; Lin, X.; Christiani, D.C. Cumulative PM2.5 exposure and telomere length in workers exposed to welding fumes. J. Toxicol. Environ. Heal. Part A Curr. Issues 2014, 77, 441–455. [Google Scholar] [CrossRef] [Green Version]
  65. Haluza, D.; Moshammer, H.; Hochgatterer, K. Dust is in the air. Part II: Effects of occupational exposure to welding fumes on lung function in a 9-year study. Lung 2014, 192, 111–117. [Google Scholar] [CrossRef]
  66. Cal/OSHA. §3395. Heat Illness Prevention in Outdoor Places of Employment; Cal/OSHA: Oakland, CA, USA, 2005.
  67. U.S. Occupational Safety and Health Administration Heat. Available online: https://www.osha.gov/heat-exposure (accessed on 15 March 2022).
  68. PurpleAir Inc. PurpleAir. Available online: https://www2.purpleair.com/ (accessed on 10 December 2021).
Figure 1. Locations of air pollution-generating work activities inside both industrial buildings as reported by employees, along with the locations identified for stationary air monitoring based on the identification of visual emissions “hotspots”.
Atmosphere 13 00722 g001
Figure 2. Walking routes (black lines) of outdoor air monitoring. Each color signifies the general area that each route encompassed.
Atmosphere 13 00722 g002
Figure 3. Indoor PM2.5 concentrations averaged by occupational category relative to outdoor average concentrations. The centerline and “X” symbols indicate the median and mean, respectively, while the lower and upper boundaries of each box indicate the interquartile ranges (IQRs) and the lower and upper whiskers indicate the minimum and maximum data points (not counting outliers).
Atmosphere 13 00722 g003
Figure 4. Indoor PM2.5 concentrations averaged across each employee who participated in personal air monitoring (Workers 1–8).
Atmosphere 13 00722 g004
Figure 5. Hourly average PM2.5 concentrations as measured by personal air monitors carried by three welding workers inside the industrial facility and the percent of the workday (5 AM–1:30 PM) during which AQI thresholds were exceeded.
Atmosphere 13 00722 g005
Figure 6. One-minute average PM2.5 measurements projected within Building 1 and Building 2 using high-resolution GPS tracking devices.
Atmosphere 13 00722 g006
Figure 7. One-minute average PM2.5 measurements projected across the outdoor environment encompassing the two industrial buildings in Santa Ana using high-resolution GPS tracking devices.
Atmosphere 13 00722 g007
Figure 8. Wind speed and direction as measured across 3-day sampling period.
Atmosphere 13 00722 g008
Table 1. Summary statistics for PM2.5.
N aMeanSt. Dev.MedanMin.Max.
Indoors by Type
Mobile (Personal)10,15491.4118.251.31.01000.0
Stationary 10,595132.3188.467.21.01000.0
Indoors by Building
Building 111,562120.3187.9105.21.01000.0
Building 29187102.2112.873.41.01000.0
Outdoors86717.35.317.41.039.0
a The number of one-minute average measurements recorded by AtmoTube device.
Publisher’s Note: MDPI stays neutral with regard to jurisdictional claims in published maps and institutional affiliations.

