Article

Predicting Atlantic Hurricanes Using Machine Learning

by
Victor Manuel Velasco Herrera
1,*,
Raúl Martell-Dubois
2,
Willie Soon
3,4,
Graciela Velasco Herrera
5,
Sergio Cerdeira-Estrada
2,
Emmanuel Zúñiga
6 and
Laura Rosique-de la Cruz
2
1
Instituto de Geofísica, Universidad Nacional Autónoma de México, Circuito Exterior, C.U., Coyoacán, CDMX, Mexico City 04510, Mexico
2
Comisión Nacional para el Conocimiento y Uso de la Biodiversidad (CONABIO), Liga Periférico–Insurgentes 4903, Parques del Pedregal, Tlalpan, Mexico City 14010, Mexico
3
Center for Environmental Research and Earth Sciences (CERES), Salem, MA 01970, USA
4
Institute of Earth Physics and Space Science (ELKH EPSS), H-9400 Sopron, Hungary
5
Instituto de Ciencias Aplicadas y Tecnología, Universidad Nacional Autónoma de México, Circuito Exterior, C.U., Coyoacán, CDMX, Mexico City 04510, Mexico
6
CONACYT—Instituto de Geografía, Universidad Nacional Autónoma de México, Circuito Exterior, C.U., Coyoacán, CDMX, Mexico City 04510, Mexico
*
Author to whom correspondence should be addressed.
Atmosphere 2022, 13(5), 707; https://doi.org/10.3390/atmos13050707
Submission received: 28 March 2022 / Revised: 25 April 2022 / Accepted: 26 April 2022 / Published: 29 April 2022
(This article belongs to the Special Issue Advances in Hydrometeorological Ensemble Prediction)

Abstract

:
Every year, tropical hurricanes affect North and Central American wildlife and people. The ability to forecast hurricanes is essential in order to minimize the risks and vulnerabilities in North and Central America. Machine learning is a newly tool that has been applied to make predictions about different phenomena. We present an original framework utilizing Machine Learning with the purpose of developing models that give insights into the complex relationship between the land–atmosphere–ocean system and tropical hurricanes. We study the activity variations in each Atlantic hurricane category as tabulated and classified by NOAA from 1950 to 2021. By applying wavelet analysis, we find that category 2–4 hurricanes formed during the positive phase of the quasi-quinquennial oscillation. In addition, our wavelet analyses show that super Atlantic hurricanes of category 5 strength were formed only during the positive phase of the decadal oscillation. The patterns obtained for each Atlantic hurricane category, clustered historical hurricane records in high and null tropical hurricane activity seasons. Using the observational patterns obtained by wavelet analysis, we created a long-term probabilistic Bayesian Machine Learning forecast for each of the Atlantic hurricane categories. Our results imply that if all such natural activity patterns and the tendencies for Atlantic hurricanes continue and persist, the next groups of hurricanes over the Atlantic basin will begin between 2023 ± 1 and 2025 ± 1, 2023 ± 1 and 2025 ± 1, 2025 ± 1 and 2028 ± 1, 2026 ± 2 and 2031 ± 3, for hurricane strength categories 2 to 5, respectively. Our results further point out that in the case of the super hurricanes of the Atlantic of category 5, they develop in five geographic areas with hot deep waters that are rather very well defined: (I) the east coast of the United States, (II) the Northeast of Mexico, (III) the Caribbean Sea, (IV) the Central American coast, and (V) the north of the Greater Antilles.

1. Introduction

The word hurricane is of Mayan origin and it describes “one-legged” god that represents the god of lightning, wind, storm and fire. In Pre-Hispanic America, hurricanes were considered both necessary and important because they were one of the largest water suppliers. Water is indeed essential for life on our planet Earth. In contrast, nowadays hurricanes are associated with danger, death, and economic losses in modern society. Currently, both the United States and Mexico are registering significant droughts, and hurricanes are possibly one of the solutions to this major societal problem. This is why understanding the evolution of hurricanes is so important to minimize economic losses and plan the development of modern American-Mexican life.
The variability of tropical cyclonic activity has been ascribed to different factors, both natural and anthropogenic in origin [1,2]. Hurricanes, as they are known in USA, Mexico and the Caribbean areas, are events in which the presence of strong winds, rain, storm surge and intense waves are combined. Indeed, the tropical and subtropical zones are affected by severe storms of diverse magnitude and origin every year. These events generate significant damage to society and coastal communities, particularly, so the study of their generation and growth mechanisms is relevant for prevention and early warning of their occurrence.
Understanding how hurricanes are formed and vary over time and space has been a long-running quest in meteorological and climatological sciences. For the Atlantic hurricanes, the early pioneering focus on seasonal forecasting was started by the late William Gray and colleagues [3,4,5,6,7,8] and the works have been evolving since to cover decadal and multidecadal variability [1,7].
According to their intensity, hurricanes are divided into different categories, and the most generalized classification is the one proposed by Saffir-Simpson, [9]. On the Saffir-Simpson scale, hurricanes are divided into five categories: wind speed, central pressure, and potential damage. Ref. [10], calibrated and validated using a database of 23 years of hurricanes with satellite altimetry measurements and oceanographic buoys, investigated the impact of global climate variability relative to wind speed and wave height in oceanic conditions. These authors affirm that there is a generalized global tendency to increase the wind speed values and, to a lesser extent, also to the increase in the height of the waves. As an element to highlight, these authors state that the estimated rate of increase is higher for severe storms, such as hurricanes, concerning the most frequent conditions. However, a 23-year database seems too short a time to make such claims. Recently, Refs. [11,12,13] have presented an interesting hypothesis about the role of the sun’s internal cycles and the variability of its radiation, in terms of the projected latitudinal insolation gradients, in the planet’s climate during the late Holocene. This could partially justify the increase in storm intensity as reported by [10].
Ref. [14], unlike or even contradicted what was stated by [10], found, analyzing a database of the 20th and 21st centuries in the United States, that the changes in the frequency with which favourable environments for severe storms occur are not statistically significant. Nor did they find a robust trend for the occurrence and intensity of hurricanes and typhoons, due to the heterogeneity of the data and poor quantification of the internal variability of the phenomena. However, the occurrence of highly intense category hurricanes (4 and 5) is closely linked to the presence of particular atmospheric and oceanic conditions. Sea surface temperature and ocean heat content are some [15]. The ocean’s heat content is the integration of all the thermal energy stored in the water column. A high heat content could be favoring the occurrence of severe storms [16]. This parameter has been frequently used successfully for forecasting the occurrence of severe hurricanes [17] and particularly those of category 5 [18].
The data record of the heat content of the world ocean presented by [19] for the NOAA in depth ranges of 0–700 m and 0–2000 m, indicates a clear trend of increase in recent decades. Therefore, this could be favoring the occurrence of severe storms.
In Boyer’s measurements, there are differences between the amounts of heat in the ocean for the depths of 0–700 m and 0–2000 m. The latter suggests the hypothesis that in places with greater depth there would be favorable conditions to store a greater amount of heat, which would allow the formation of hurricanes of greater intensity. Another relevant element in Boyer’s results is the existence of a cyclical component in the ocean’s heat content. This could indicate hurricane seasons where more extreme events occur than others. Global climate patterns, especially El Niño-Southern Oscillation (ENSO) could be some of the main modulating agents of the occurrence and intensity of hurricanes [20]. However, the scarcity of historical records of both hurricanes and the ENSO phenomenon has generated uncertainty about this approach. This is due to the variability of these records in different geographical locations. Recently, Ref. [21] found that understanding future changes in the location and the intensity and frequency of El Niño are relevant to forecasting and projecting Atlantic hurricane activity. Ref. [22], based on the interrelation between the Atlantic and Pacific basins that occur during the ENSO phenomenon and using a statistical model, finds sound forecasts of above-average storm activity throughout the hurricane season. It is model obtains the best certainty at the end of the season.
The influence of African dust on Atlantic hurricanes has long been proposed in [23]. The dust from North Africa, which is transported over the Atlantic Ocean by easterly winds [15,24,25], contains high concentrations of small particles of the order of 10–100 g cm−3, which, in their way, change the properties of clouds and the evolution and development of precipitation [26,27]. It also modulates Caribbean storms [2] and modifies the climate by absorbing and dispersing solar radiation. Together with other internal and external factors of the ocean-atmosphere system, such as winds and clouds [28], African dust provokes a decrease in the ocean surface temperature, affecting the genesis of Atlantic tropical hurricanes [29] by inhibiting their formation [23]. Tons of dust from the desert is transported by the winds over thousands of kilometers of the atmosphere. This dust interacts chemically with the clouds and radiation to modify the climate, while acting against global warming. The amount of dust increased considerably by the end of the 1960s and beginning of the 1970s, when there was a severe drought in North Africa. Present climatic models that include African dust have shown that the variability of African dust is an important factor in predicting climatic change.
One of the most important factors associated with changes in the frequency of seasonal hurricanes is the variability of the local vertical tropospheric wind shear [30]. In addition, a relation has been found between Atlantic hurricane activity and West African precipitation [4,31] and with the SST anomalies associated with El Niño [3].
The frequency and intensity of hurricanes have also been associated with other global weather patterns, such as the Atlantic Multidecadal Oscillation (AMO) as described by [1]. In the studies by [8], it has been shown that the AMO has a significant impact on hurricane activity in the Atlantic basin, essentially the product of changes in sea surface temperature. A positive phase of the AMO can be associated with more active hurricane seasons.
There is no doubt that any improvements in our knowledge and ability to forecast Atlantic hurricane activity will be of hugely significance for societal benefits see for example, for a full review [32]. Machine Learning (ML) has recently been used as a tool to forecast tropical cyclones and hurricanes see [33,34,35] and other natural phenomena, e.g., [36,37,38,39]. This is why we seek to explore this important question by adopting our methodology that combined wavelet analysis and Bayesian Machine Learning algorithms for the problem of predicting Atlantic hurricane activity from multi-annual to multidecadal timescales. Other works like [34,35] have explored the strength in the Machine Learning method for short-term pre-season ensemble forecasting of Atlantic hurricane and tropical cyclone intensity and tracking, respectively.
In the present work, the information about the occurrence of hurricanes for the Atlantic basin of the last 70 years has been analyzed and revealed. Applying spectral analysis tools in combination with the creation of a Bayesian prediction model implemented based on machine learning techniques, the cyclical behaviour of this process has been identified, and a future forecast of its evolution is made here as testable consequences for the near-term horizon.

2. Data and Methods

We use the NOAA (https://coast.noaa.gov/hurricanes/, accessed on 12 January 2022) database to analyze any coherent underlying patterns of cyclone activity in the Atlantic Ocean. To analyze the cyclonic activity in the Atlantic Ocean, it is necessary to have the time series of the hurricanes for each category. In addition, classical spectral analyzes require that the spacing between the data be equal. Because hurricanes do not form homogeneously, a model is needed that meets these needs and spectral requirements. The temporary resolution can be daily, monthly or annual. We have selected that the historical data of the hurricanes be transformed into a unitary annual digital signal through the following function (G):
G ( t ) = 1 if the hurricane is registered 0 no hurricane reported
The digital model of hurricanes (Equation (1)) can be modified by using the actual count of total number of hurricanes per year. This modification, however, does not change the periodicities of the spectral analysis but only changes the spectral power a little. The user is free to select the type of digital model to analyze Atlantic hurricanes. With the digital signal obtained, the data requirements for any spectral analysis are guaranteed.

2.1. Wavelet Spectral Analysis

We applied the classical wavelet transform WT, see [40] for more details about the method, that is appropriate for studying non-stationary times series, as the hurricane records because the wavelet spectra allows identification of intrinsic patterns of the phenomenon and facilitates the discovery of the source characteristics of the phenomenon see, e.g., [41]; for example, the cyclonic activity in Atlantic Ocean.
We use the Morlet wavelet mother in the WT because of its high precision in resolving the patterns (periodicities) contained in the hurricane records and because it is a complex function that allows us to deduce the information on phase of the dominant timescale of the cyclonic patterns.
The wavelet transform of a discrete time series (e.g., the annual digital signal of hurricanes for each category G) is defined by [42,43] as:
W n ( s ) = n = o N 1 G n ψ o * ( n n ) s δ t
where variable s is the scale, n is the translation parameter (sliding in time) and the (*) denotes complex conjugation.

2.2. Inverse Wavelet Spectral Analysis

The decomposition of G in any oscillation channels of the tropical cyclone activity patterns ( y n ) can be obtained from the inverse wavelet [42] as:
y n = δ j δ t 1 / 2 C δ ψ o ( 0 ) j = j 1 j 2 R e ( W n ( s j ) ) s j 1 / 2
where j 1 and j 2 define the scale range of the specified spectral bands, ψ o ( 0 ) is an energy normalization factor, C δ is a reconstruction factor, and δ j is a factor for scale averaging. For the Morlet wavelet, δ j = 0.6 , C δ = 0.776 , and ψ o ( 0 ) = π 1 / 4 .
The input data in the W n are the annual digital signal of hurricanes for each category between 1950 and 2021. The W n has two main outputs; the global spectrum, which shows the periodicities existing in the seismic record with the 95% confidence level above the red noise spectrum drawn as red dashed line (left panel) and the wavelet power spectral density (PSD) that shows the evolution over time of these periodicities (central panel).

2.3. Machine Learning Algorithms for Forecasting Hurricane Activity

2.3.1. Non-Linear Autoregressive eXogenous (NARX) Model

The cyclonic state of the system in the Atlantic Ocean can describe the dynamics of hurricane activity from its input (V)-output (Y) behavior, which describes its evolution over time. Different models can approximate the cyclonic state of the system. We use the Non-linear Autoregressive eXogenous (NARX) [44] model in order to create forecasting models of the Atlantic hurricane activity variation ( Y ^ ) that is defined as:
Y ^ [ τ + 1 ] = Θ Y [ τ , P ] V [ τ , Q ] = Θ [ Y ( τ 1 ) , , Y ( τ P ) , V ( τ 1 ) , , V ( τ Q ) ]
where Θ is a transfer function of the cyclonic state of the system at the moment τ to the moment τ + 1 , that depends intrinsically on the exogenous input (V) and output (Y) data. Q and P are the delay times in the exogenous input and output data, respectively and Y ^ is the estimated hurricane activity at a time τ + 1 .
We used the Least-Squares Support-Vector Machines (LS-SVM) algorithms to estimate the transfer function ( Θ ), a non-linear function [44] as:
Θ = τ = 1 n ω τ D τ + B
where D is training data, in our case the hurricane records. Furthermore, D τ denotes the input data, i.e., the hurricane records at time τ (discrete time index from τ = 1 , , n ), ω τ is the weighting factor which in turn has functional dependence on V τ and B is the bias term.
We use the Bayesian inference ML model [44] obtained from the hurricane records to provide a probabilistic hurricane prediction of the variation in the hurricane activity. Bayes’s theorem [45] is the basis of our ML model and can be expressed as follows:
p ( Θ | D ) = p ( D | Θ ) p ( D ) p ( Θ )
where Θ is the Least-Squares Support-Vector Machines (Equation (5)) regression model.
Furthermore, Bayes’s theorem is used to deduce the optimal parameters in the LS-SVM model (Equation (5)). In addition, we use the radial basis function (RBF) kernel in this LS-SVM method. In this work, we have applied and modified the LS-SVM algorithms and toolbox by [44].

2.3.2. Algorithms for the Estimation of the Following High or Active Phase of Hurricane Activity

We apply the following iterative steps to forecast the next high Atlantic hurricane activity episode:
I.
Use wavelet transform (Equation (2)) to find the periodicities (hurricane activity patterns) for each of the Atlantic hurricane categories analyzed.
II.
The decomposition of the hurricane records in time series called “channels” with the periodicities obtained in step (I) can next be obtained using the inverse wavelet (Equation (3)).
III.
Selection of lags Q and P in the exogenous input and output data, respectively.
IV.
Use a Radial Basis Function (RBF) kernel. The RBF has various forms: (a) Gaussian function, (b) logistic function (or reflected sigmoid function), and (c) inverse quadratic function. We have selected the Gaussian function as RBF. The user may select any of the radial functions and similar results will be obtained.
V.
For training, validation, testing and deduction of the hyper-parameters of the model. Use the K-fold cross-validation. Set aside 1 / K of data. Train the model with the remaining ( K 1 ) / K data. Measure the accuracy obtained on the 1 / K data that we had set aside. K independent training is therefore acquired. The final accuracy will be the average of the previous K accuracies. Note that we are hiding a 1 / K part of the training set during each iteration. This is applied at the time of training. After these K iterations, we obtain K accuracies that should be similar to each other; this would be an indicator whether the model is working well or not. In this work, we used K = 10 , but it is possible to vary K between 5 and 10.
VI.
Determination of the weight and bias.
VII.
Estimation of next high cycle of hurricane activity using Equation (5).
VIII.
Computation of a cost function.
IX.
Test of the accuracy of the estimate next high cycle of hurricane activity.
X.
Test of the cost function. We have used the mean squared error (MSE). If this function was small enough, stop and go to the next step. Otherwise, we change one of the parameters P and/or Q and repeat from step (III) onwards.
XI.
Use the wavelet transform to help determine if the periodicities of the estimated high hurricane activity have the same periodicities obtained in step (I). If yes, then with these new data (i.e., with the input data and these new hurricane cycles), go to step (VII) to calculate the next hurricane cycles. Otherwise, repeat step (VI).
We have used and modified the LS-SVM algorithms and toolbox by [44] to forecasting the next high or active period of hurricane activity

2.4. Geospatial Information Mapping

We used a geographic information system (GIS) to generate a spatial identifier in historical records of hurricanes in the Atlantic basin, acquired from the National Hurricane Center and Central Pacific Hurricane Center-National Oceanic and Atmospheric Administration (NOAA) [46] for viewing https://www.ncei.noaa.gov/access/metadata/landing-page/bin/iso?id=gov.noaa.ncdc:C01552, accessed on 12 January 2022. We apply geo-processing techniques and spatial filters to select and map hurricane information by category (2 to 5) and wind speed. We aggregate data from the General Bathymetric Chart of the Oceans (GEBCO, https://www.gebco.net/data_and_products/gridded_bathymetry_data/, accessed on 12 January 2022) model in a grid format with 15 arc-second intervals to represent bathymetric information from the Atlantic Ocean. The integration of historical records of hurricanes and oceanic relief in a GIS allows the identification of marine regions with different depths and concentrations of hurricanes.

3. Results

Broadly speaking, Atlantic hurricanes result from dynamic interactions involving various non-linear processes between the ocean-atmosphere system where factors internal and external to this system intervene, such as El Niño, AMO, NAO, TSI, among other factors e.g., [1,47,48]. We study and report the hurricane patterns for each category of Atlantic hurricanes from 1950 to 2021, using time-frequency wavelet spectral analysis. After finding the patterns in each hurricane category, the oscillation that groups the historical data of each hurricane category into high and low cyclonic activity is obtained using the inverse wavelet transform. Understanding and knowledge from each of these oscillations analyzed is then applied to create a probabilistic long-term hurricane prediction model for each hurricane category using the Bayesian machine learning method.

3.1. Category 5 Atlantic Hurricanes

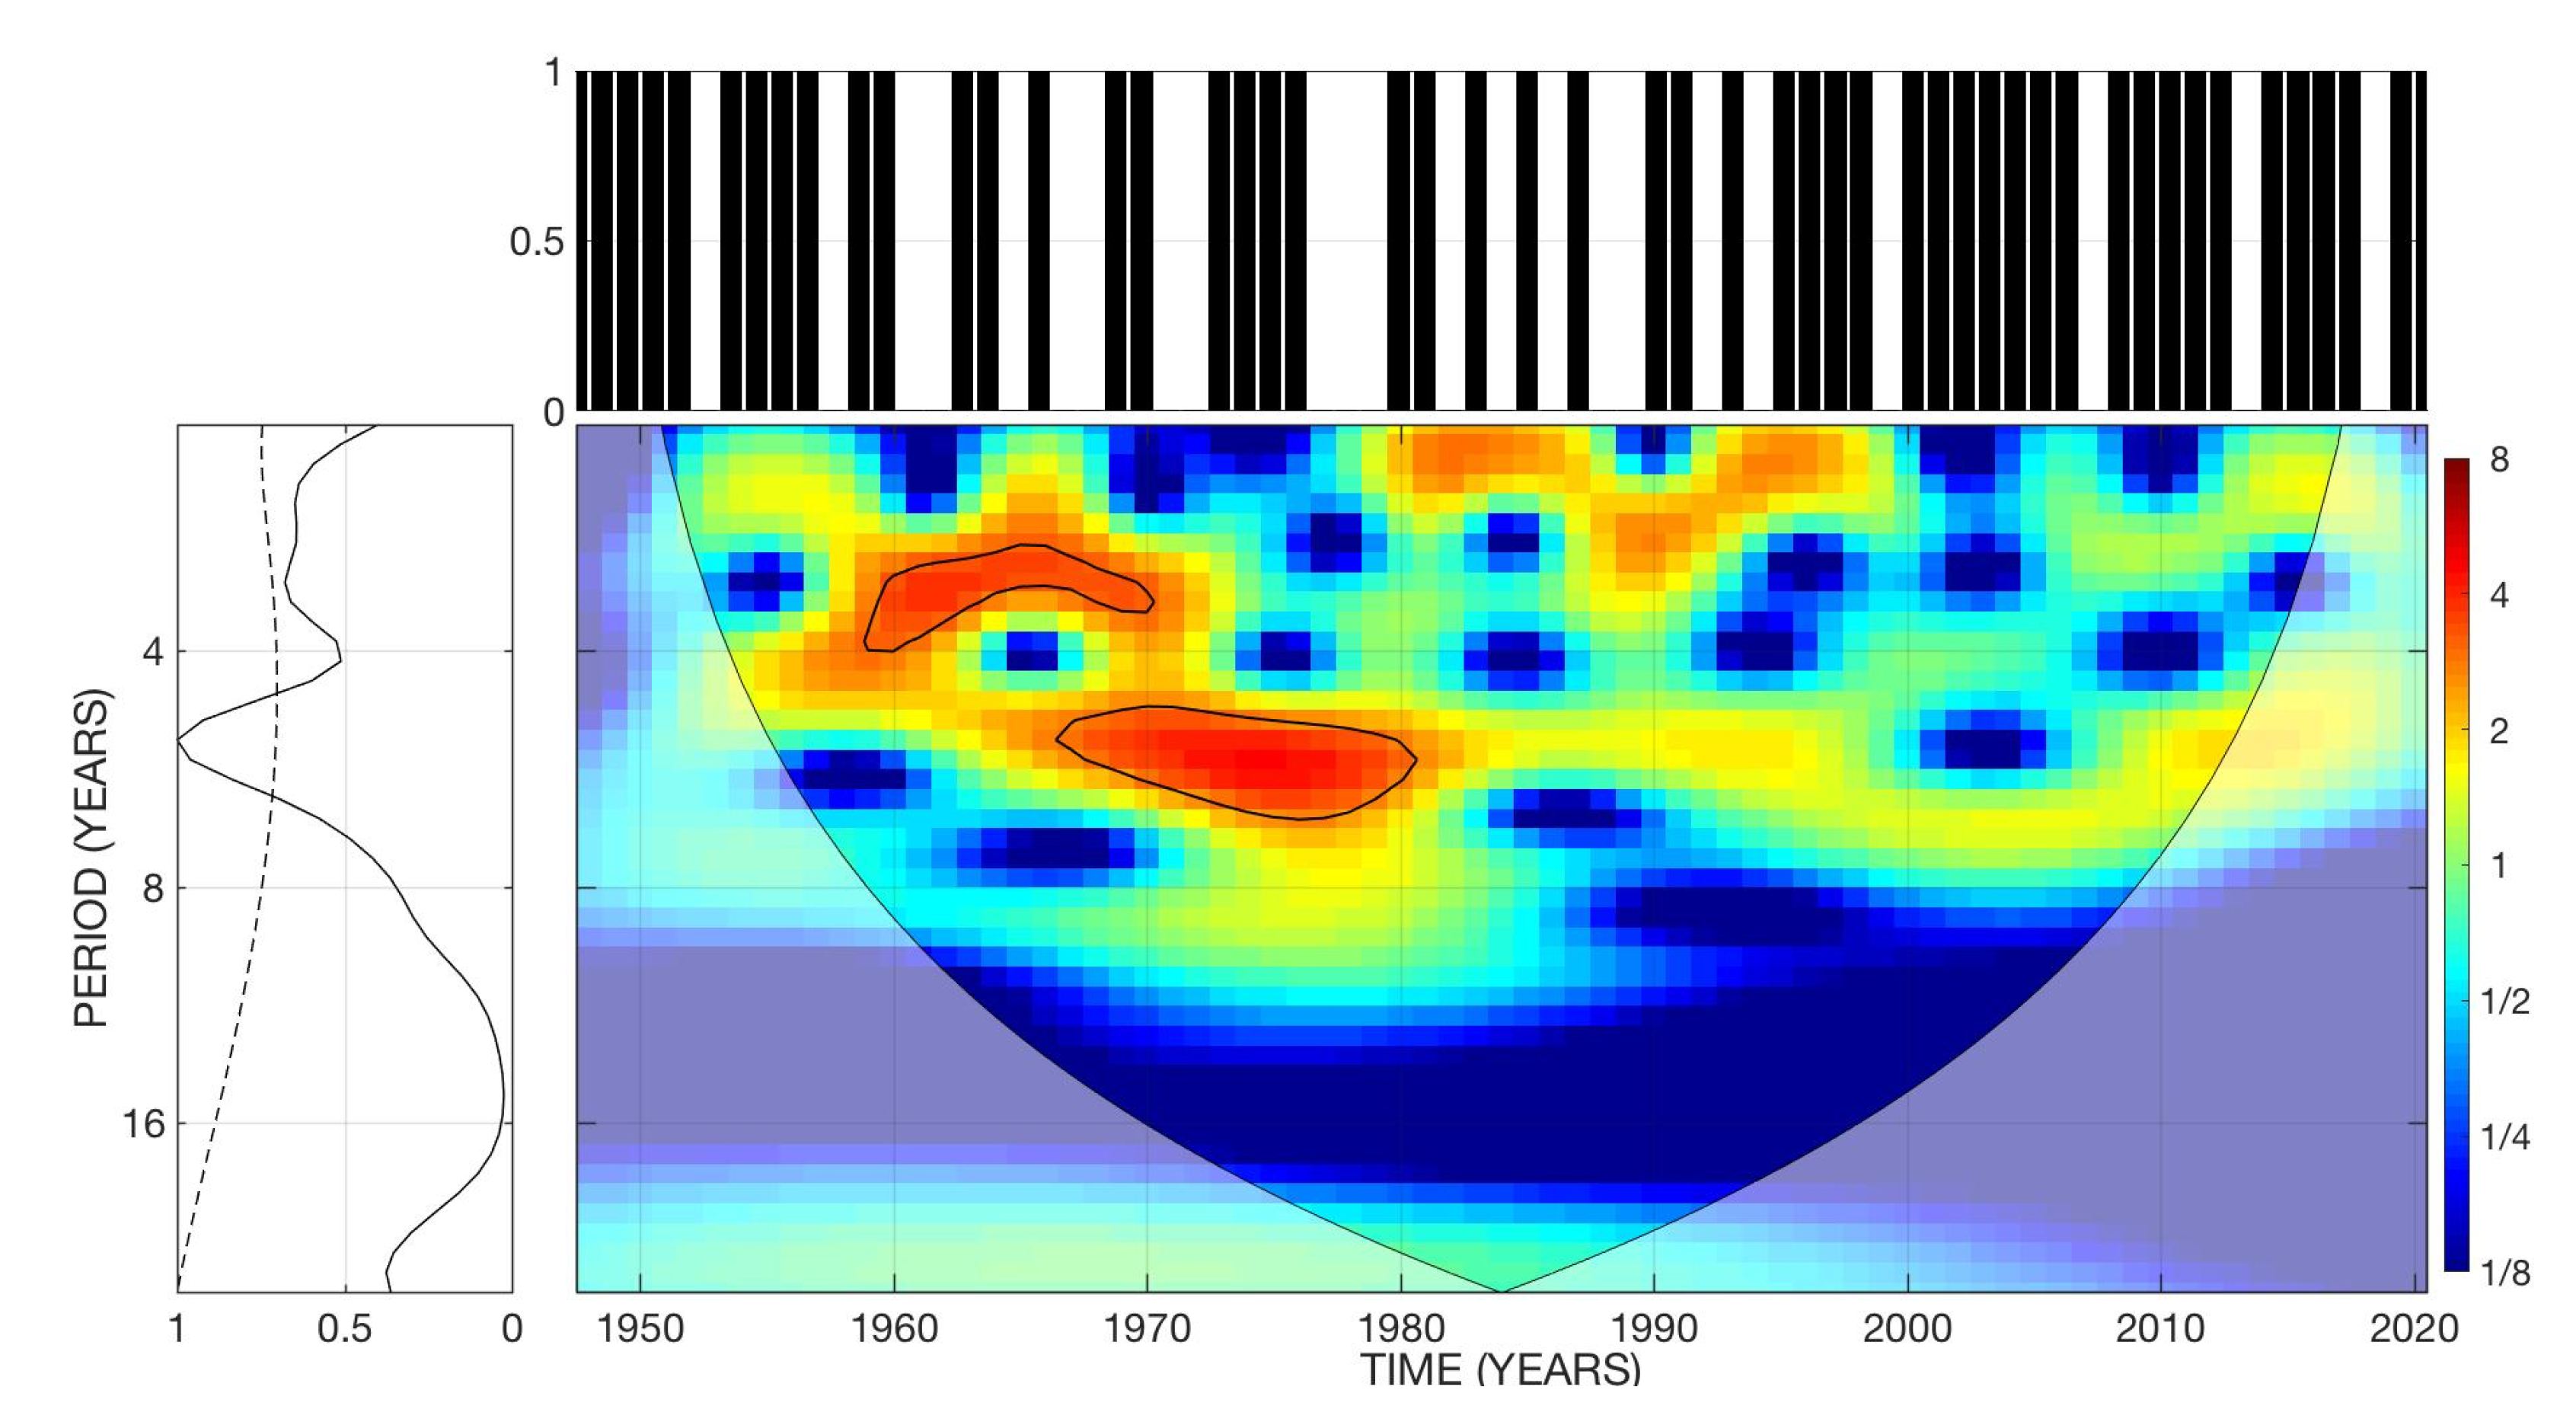
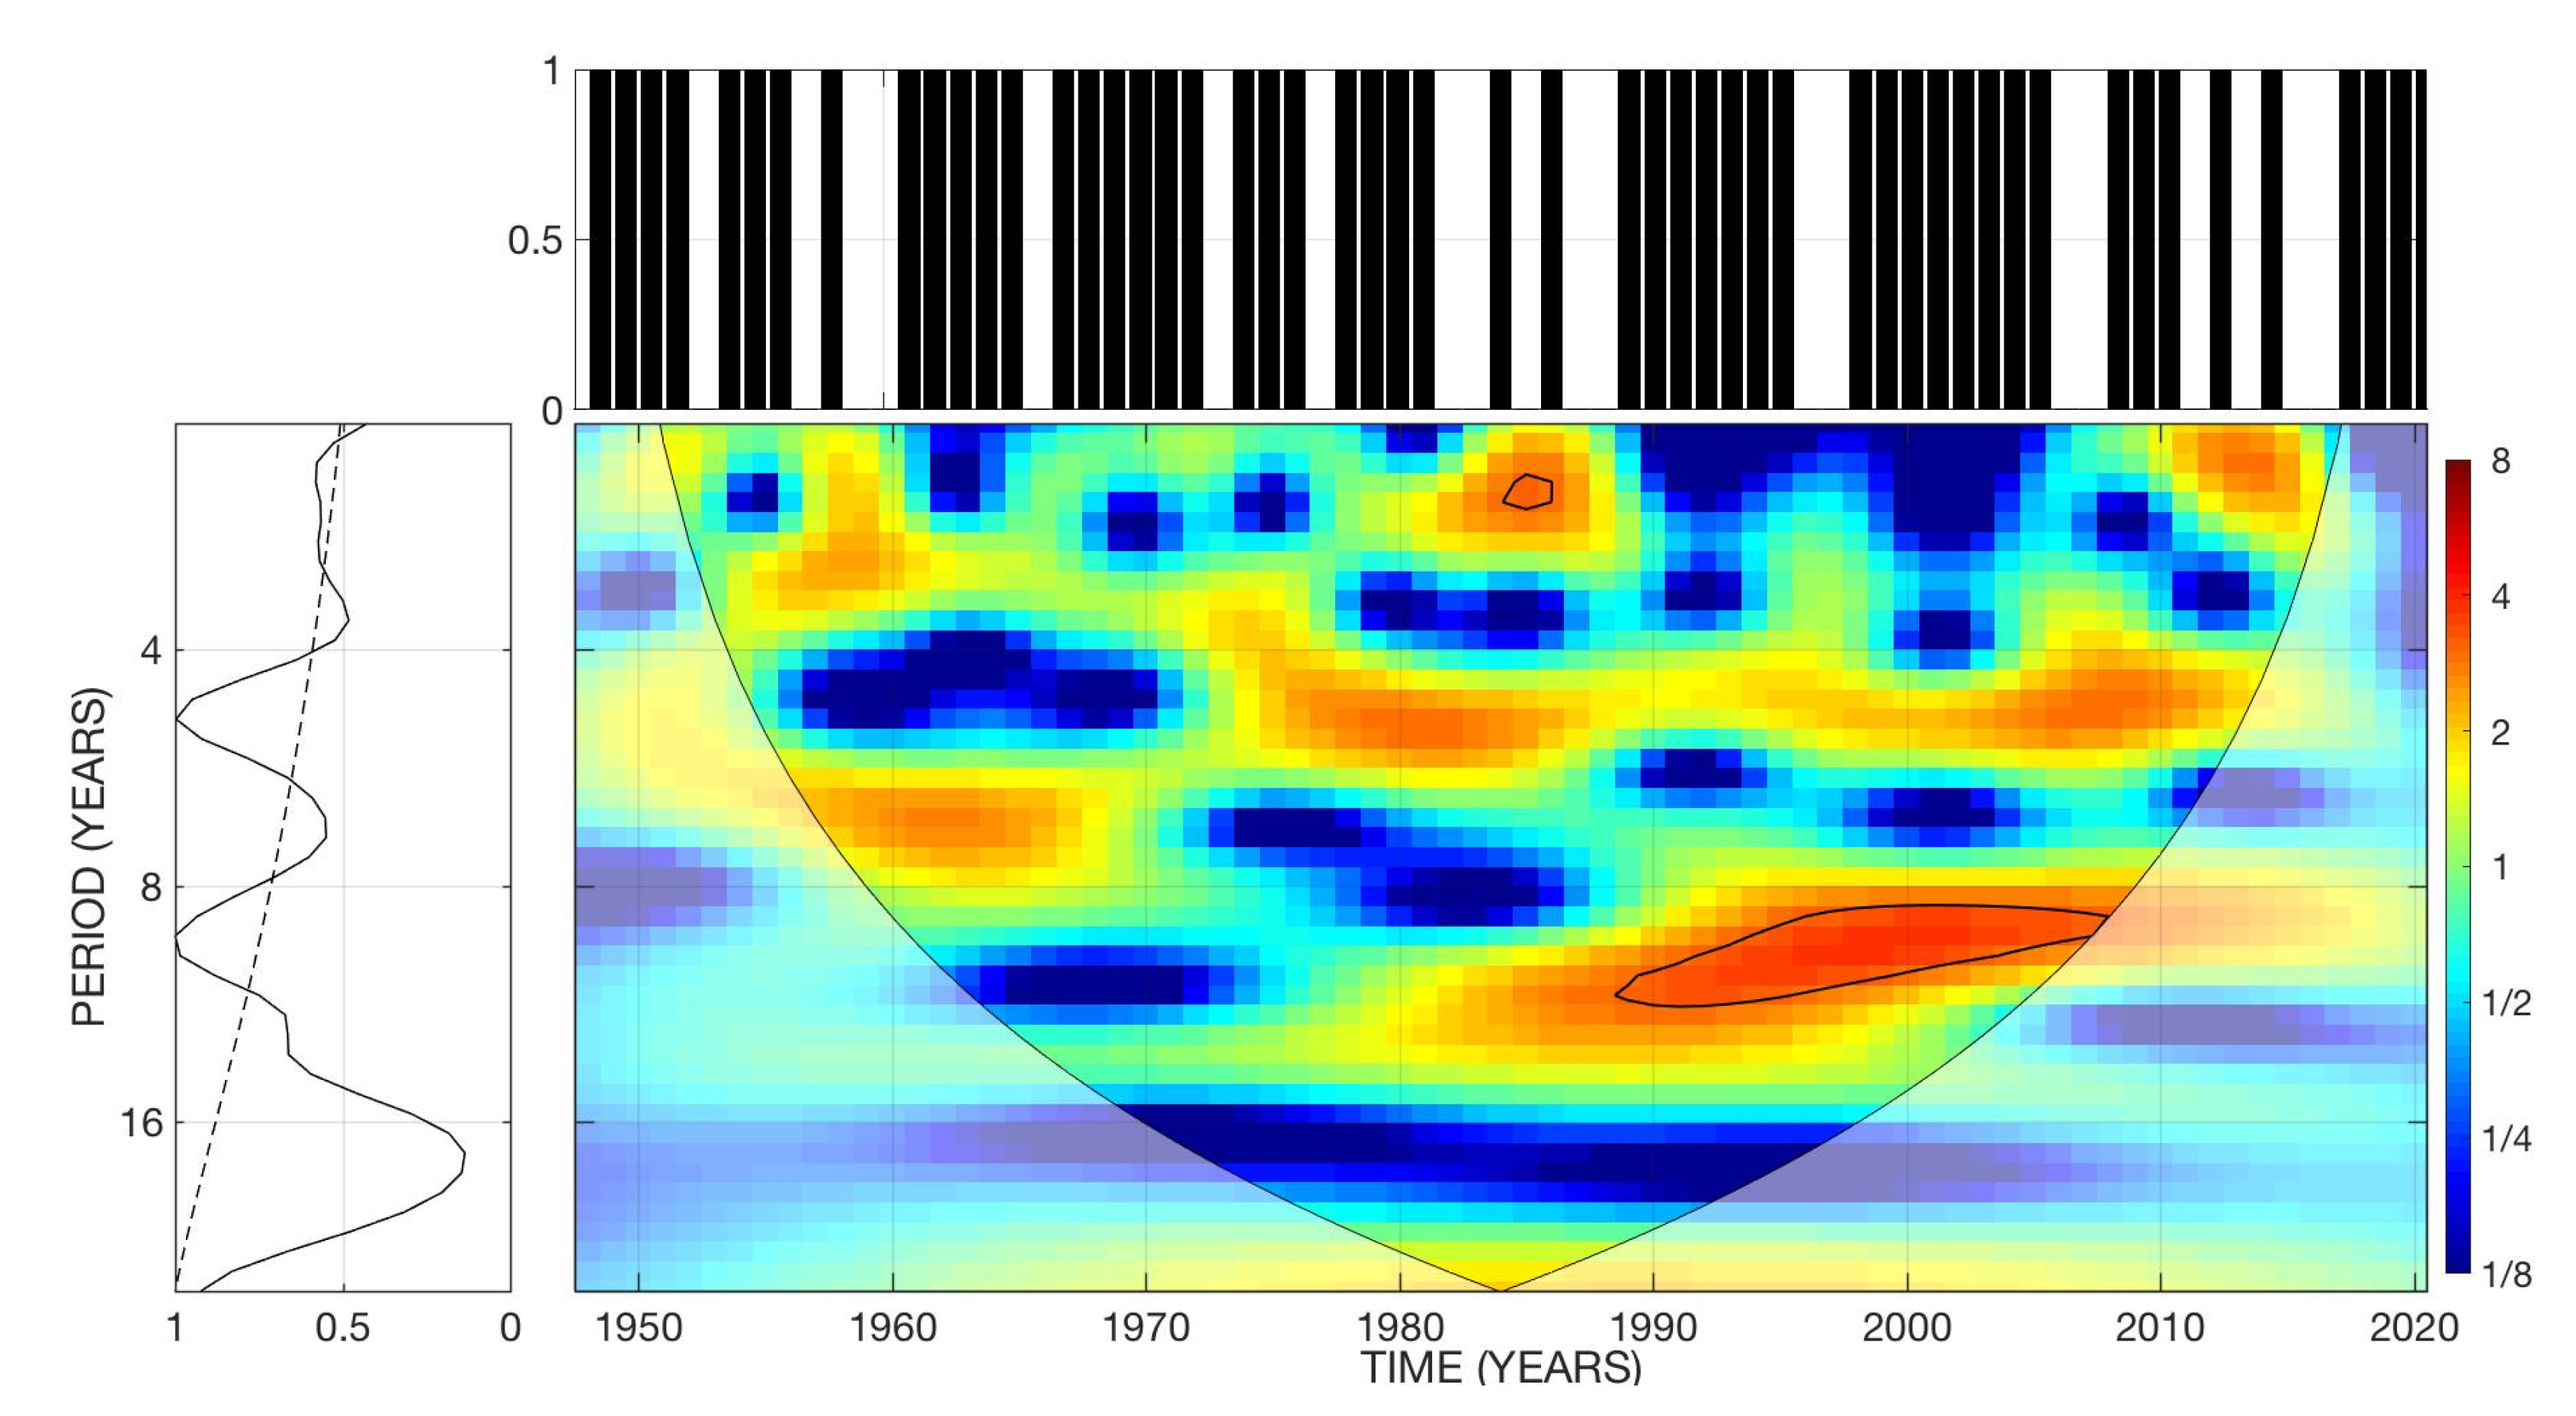
3.1.1. Spectral Analysis

One of the difficulties in finding hurricane patterns is having a model of the historical data for each hurricanes category. Classical spectral analyses require that the temporal spacing be the same for each of the analyzed time-series data (for example, a day, a month, a year). This requirement is clearly not met for the hurricane database (and many hydrometeorological phenomena). In these cases, the interpolation of the data cannot be applied. A possible solution to this problem is to use the gapped wavelet see, e.g., [41] that allows analysis of time series with data gaps. This innovative type of wavelets allows us to analyze and find patterns in records of Atlantic hurricane activity.
In order to have a homogenized model and in order to create a probabilistic model, we have used a unitary annual digital signal of the hurricanes; that is, if in a year there are hurricanes for each one of the categories, then the model is equal to one and in otherwise it is zero (see Methodology section). This classification is adopted regardless of how many hurricanes there were in a specific year for a category. It is possible to use a digital model whose amplitude is equal to the number of hurricanes that occurred in a specific year. However, we do not select this model in this first exploratory study.
Figure 1 shows the results of the wavelet time-frequency analysis for the annual digital model of category 5 Atlantic hurricanes as black bars in the upper panel. The global wavelet spectrum (left panel) shows periodicities (patterns) of 2.8, 4.9, 6.6, and 12.4 years. The Power Spectral Density (PSD) wavelet displayed in the central panel shows that the 12.4-year periodicity is present throughout the whole time interval (1950–2021). The annual digital model of category 5 hurricanes shows several years of no such hurricanes in the Atlantic Ocean. In addition, the model shows that the groupings of category 5 hurricanes are heterogeneous. Using the inverse wavelet transform for the chosen pattern of 12.4 years, we have obtained an oscillation that will be used to group the cyclone activity of category 5 Atlantic hurricanes and then offers forecast of these hurricanes.
The multi-year periodicities shown by the global wavelet spectrum will be analyzed in other future works because the main objective of this work is to forecast the next high season/episode of category 5 hurricanes.

3.1.2. Machine Learning Model of Category 5 Atlantic Hurricanes

Figure 2 shows the grouping in VIII clusters of historical category 5 hurricanes with the Bayesian Machine Learning model of 12.4 years. It can be seen that these groupings show both the high seasons (that is, when this category 5 hurricanes occur) and null seasons of these hurricanes. Furthermore, it can be observed that category 5 hurricanes occur only during the positive phase of the Bayesian model of 12.4 years. This important result allows us to suggest that it is possible to make a forecast of the upcoming category 5 Atlantic hurricane period.
We want to note that clustering of historical hurricanes using the 12.4-year Bayesian model shows that the category 5 hurricanes are heterogeneously distributed in each cluster. This is most likely due to the complex relationship between the atmosphere-ocean system and that under certain climatic, oceanographic, and atmospheric circumstances, category 5 hurricanes formed or did not manifested in the Atlantic Ocean.
The last group of category 5 hurricanes (cluster VIII), ended in 2021 ± 1, so it is possible that in 2022 at least one new category 5 hurricane may occur in the Atlantic Ocean. According to the 12.4-year cyclonic pattern of category 5 hurricanes, the Bayesian Machine Learning model shows that the next period (cluster IX) will start in 2026 ± 2 and end in 2031 ± 3 and between one and four category 5 Atlantic hurricanes are possible. Here we further suggest that one promising progress to hurricane forecasting may consist of changing the prediction paradigms from an exact approach to probabilistic forecasting of future hurricane activity cycles.

3.2. Category 4 Atlantic Hurricanes

3.2.1. Spectral Analysis

Figure 3 shows the results of the wavelet analysis for the annual digital model of category 4 hurricanes as black bars in the upper panel. The global wavelet spectrum (left panel) shows periodicities (cyclonic patterns) of 3.3, 5.2 6.9, 13.1 and 20.8 years. The PSD shows the evolution of each of the periodicities of the variation of the category 4 hurricanes. One can observe the difference in the distribution over time of these hurricanes compared to the category 5 hurricanes. In addition, we want to highlight the total absence of records of category 4 Atlantic hurricanes around the 1970s.
Using the inverse wavelet transform for the pattern of 5.2 years, we have obtained an oscillation that will be used to group the past activity of category 4 hurricanes and then forecast these hurricanes. The result obtained is shown in Figure 4.

3.2.2. Machine Learning Model of Category 4 Atlantic Hurricanes

The 5.2-year Bayesian model shows in Figure 4 that historical magnitude 4 hurricanes can be grouped into fifteen groups (clusters 1–XV). All these hurricanes occur in the positive phase of the 5.2-year oscillation, except for cluster V, where category 4 Atlantic hurricanes were not reported. Cluster XV ends in 2022 ± 1, so it is possible that between 2022 and 2023 there could be at least one category 4 hurricane. The next category 4 hurricane season (cluster XVI) will begin in 2025 ± 1 and end in 2028 ± 1. In addition, between one and at least four category 4 hurricanes would be expected to occur in cluster XVI.

3.3. Category 3 Atlantic Hurricanes

3.3.1. Spectral Analysis

Figure 5 shows the result of the wavelet analysis for category 3 Atlantic hurricanes. It can be seen in the upper panel that there is a higher number of category 3 hurricanes as well as a different and heterogeneous distribution between 1950 and 2021, compared to category 4 hurricanes. The global wavelet spectrum shows the following patterns (periodicities), which are 2.4, 3.2 and 5.2 years. Being this last periodicity is shown throughout the entire time interval, 1950–2021. By applying the inverse transform to the periodicity of 5.2 years, the oscillation will be used to create the Bayesian model of 5.2 years to group the historical category 3 hurricanes. Later, this Bayesian model of 5.2 years will be used to make the forecast, and the result is shown in Figure 6.

3.3.2. Machine Learning Model of Category 3 Atlantic Hurricanes

Figure 6 shows the sixteen groups (clusters I–XVI) that the 5.2-year Bayesian model selected and fitted the historical data of category 3 Atlantic hurricanes quite well. This result shows and confirms the capacity of the Bayesian model in grouping all the historical data of these hurricanes. It can be seen that all category 3 hurricanes form in the positive phase of the pattern of 5.2 years. We want to highlight clusters XII and XIII, where there is no spacing between these two clusters and ending cluster XII immediately begins cluster XIII.
The XVI cluster ended in 2021 ± 1, so it is possible that during 2022 a category 3 hurricane could at least form in the Atlantic Ocean. According to the 5.2-year Bayesian model, the next XVII cluster will start in 2023 ± 1 and end in 2025 ± 1, with a probability that between one and four category 3 hurricanes could form in the Atlantic Ocean.

3.4. Category 2 Atlantic Hurricanes

3.4.1. Spectral Analysis

Figure 7 shows the dynamics of category 2 hurricanes in the Atlantic Ocean. The digital time series (black bars) for these hurricanes is shown in the upper panel. The global wavelet spectrum (left panel) shows that the periodicities are 2.4, 2.9, 4.9, 9.3, and 13.1 years. The spectral evolution of the PSD is shown in the central panel, where it can be seen that the 4.9-year periodicity is practically present from 1950 to 2021. This periodicity will be studied with the inverse wavelet transform to obtain the 4.9-year Bayesian model that groups all the historical data of category 2 Atlantic hurricanes, and the result is shown in Figure 8.

3.4.2. Machine Learning Model of Category 2 Atlantic Hurricanes

The historical data of category 2 hurricanes can be grouped into 19 clusters (I–XIX) according to the Bayesian model of 4.9 years (Figure 8). It can be seen once again that all these hurricanes formed during the positive phase of the 4.9-year oscillation. It is worth highlighting that the highly active tropical cyclone period in the 1990s and early 21st century (clusters X–XIII). Where a group ended, and a new group began the following year.
The XVIII cluster ended in 2021 ± 1, so it is possible that during the year 2022, a category 2 hurricane could form in the Atlantic Ocean. According to the 4.9-year Bayesian model of category 2 hurricanes, the next cluster (XIX) will start in 2023 ± 1 and end in 2025 ± 1.
We want to note that the data on category 1 hurricanes from 1950 to 2021 show that practically every year there is this type of hurricane, so probabilistically, each year category 1 hurricanes will be formed in the Atlantic Ocean basin, so we have not carried out the analysis for these lowest intensity hurricanes.

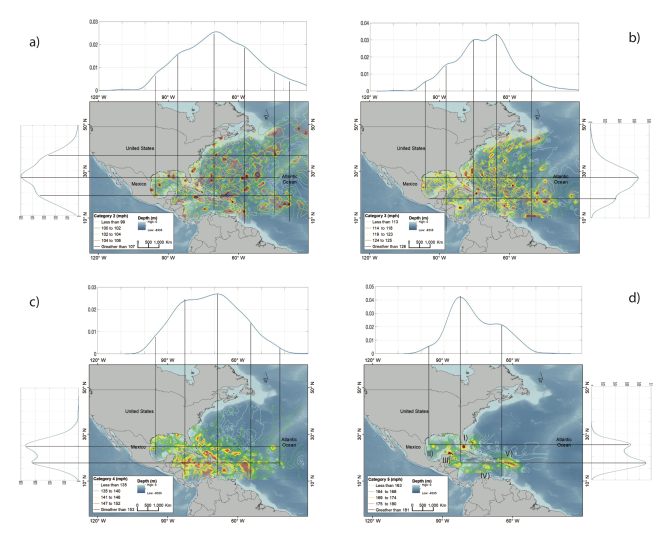
3.5. Spatial Distribution of Atlantic Hurricanes

We use the NOAA database to further study the spatial patterns and origins of all the Atlantic hurricanes (see Data and Methods). Figure 9 shows a map of the wind speed distribution for each category of Atlantic hurricanes. In each of the panels of Figure 9, only the speeds greater than or equal to which hurricanes obtain their classification in one of the categories from 2 to 5 are shown.
It can be seen that the speeds of category 2 and 3 hurricanes are rather uniformly distributed or evenly populated throughout the Gulf of Mexico and the Atlantic Ocean. In comparison, the speeds of category 4 hurricanes are preferably reached outside the Gulf of Mexico (this area is shown inside a rectangle in Figure 9c) except for the southeastern United States.
The speeds achieved for category 5 hurricanes (classified as super hurricanes) are shown in Figure 9d. According to this speed distribution, the maximum speeds of category 5 hurricanes are found concentrated in five zones: (I) the east coast of the United States, (II) the Northeast of Mexico, (III) the Caribbean Sea, (IV) the Central American coast, and (V) the north of the Greater Antilles.
In the areas around the tropics, the highest heat contents are recorded in the ocean, which is a favourable condition for tropical cyclogenesis in these geographical areas, hurricanes can reach the highest intensity and speed as high as categories 4 and 5.
In contrast, at higher latitudes, the ocean heat content is lower and more probably below the thresholds needed for hurricanes to reach and support categories 4 and 5 wind speed and intensity. These approximate criteria can be seen to roughly guide the spatial distribution of these Atlantic hurricanes shown in Figure 9. We wish to further point out, however obvious it may seems, that in the case of the super hurricanes of the Atlantic, they mainly develop in hot deepwater areas rather than shallow ones.
Figure 10 shows the spatial clustering of the wind speed for each of the hurricane categories. The probability distribution function (PDF) of the hurricane track coordinates, i.e., latitude and longitude, are shown in the left (right) and top panels, respectively. It can be seen that most of the PDFs are multimodal. The horizontal and vertical black lines indicate the local maxima in the PDFs. It can be seen that the highest speed of each of the hurricane categories are located around the intersection of the maximum PDFs. This empirical result could indicate that in addition to the appropriate climatic conditions, the development of the maximum speed of the hurricanes requires certain geographical locations to fit as well. In particular, we want to highlight that for super hurricanes of category 5 to develop, they historically developed in the following five geographical zones: (I) the east coast of the United States, (II) the Northeast of Mexico, (III) the Caribbean Sea, (IV) the Central American coast, and (V) the north of the Greater Antilles.
The spatial distribution of the super hurricanes of category 5 in the Atlantic shows that their formation indeed does not simply occur in just any area of the Atlantic Ocean, but rather that they are very well defined geographically. We want to highlight that these zones have 2 very peculiar characteristics: (1) they are within the warm currents of the Gulf of Mexico and the Atlantic Ocean, and (2) they are deep water zones. These two characteristics are essential for the genesis of the Atlantic super hurricanes because to reach these high speeds; much thermal energy is needed since the shallow waters do not have enough thermal energy to initiate and support/maintain the formation of these hurricanes. An example of such a realistic scenario is Hurricane Wilma, the most powerful hurricane recorded in the Caribbean Sea, with several records in terms of waves generated by its winds [49], which occurred in October 2005 during a neutral ENSO period.
Figure 11 shows the evolution of the velocities (atmospheric pressure) reached by Hurricane Wilma and the ocean’s depth in which the eye of Hurricane Wilma was located. It can be seen that the maximum speed in Figure 11a (minimum atmospheric pressure in Figure 11b) of Hurricane Wilma was obtained in the warm Caribbean current and that, in addition, the eye of the hurricane was in one of the most profound areas of the Caribbean Sea with water depth as deep as −4500 m. This result means that for the formation of super hurricanes, the specific climatic conditions of the complex relationship of the ocean-atmosphere system and geographical areas of the Atlantic with a warm current in deep waters are two key necessary ingredients. We speculate that perhaps all Atlantic super-hurricanes comply with this example sets out and shown in details by the 2006 Hurricane Wilma in Figure 11.

4. Discussion and Conclusions

This study has revealed the most important underlying patterns of Atlantic hurricane activities covering intensity scales from category 2 to 5. We have carefully transformed the available Atlantic hurricane events for all categories compiled by NOAA into unitary digital signal annually. This important first step avoid the difficulties related to the quantification of the intensity scale in hurricanes. Instead the digital signal allows the focus on the question of the frequency of each event and recurrence of the events.
We have tested the practical utility of such in-depth wavelet analyses by applying the key identified oscillations for both the problems of explaining past data and forecasting. We found that the most important identified timescale for the Atlantic hurricanes of categories 2, 3 and 4 is the 5-year or quasi-quinquennial oscillation. For the strongest hurricane of category 5, the deciding timescale is the decadal-scale oscillation that proves most useful in grouping the category 5 events as well as offer a hint for the future active phases.
Our Bayesian Machine Learning models group the historical hurricanes in each one of the category hurricanes. If hurricanes’ formation were truly random, it would not be possible to group them. Therefore, the grouping of hurricane records would mean that the hurricane variability from the point of view of Machine Learning is of natural origin since there are no conceivable manner for human control in the exact manner of the grouping. Furthermore, no cluster in all categories of hurricanes shows any unusual or persistent increase in tropical cyclone activity in the Atlantic Ocean.
We speculate that the physical explanation for the quasi-quinquennial oscillation for the categories 2, 3 and 4 hurricanes could be related to the well-known role of ENSO oscillation that has the 2–7 year recurrence period that in turns has powerful control on the vertical wind shear over the main development region in the tropical Atlantic between 9° and 21.5° N. The importance of the decadal oscillation for the category 5 Atlantic hurricane may be related the external forcing factors like the Total Solar Irradiance (TSI) or even the modulation of the Latitudinal Insolation Gradients as discussed in [11,12,13]. The increasing recurrent time from about 5-year to about 12-year for the occurrence of the strong and intense category 5 hurricanes relative to the lower category events may be simply related to the relatively rarer opportunity for the right conditions to form the strongest super hurricanes in the Atlantic basin.
The accuracy of any forecast with Machine Learning is limited by an uncertainty principle (see [36]; this uncertainty principle could be generalized to a certain quantum Machine Learning principle). Greater precision in the temporal forecast implies a significant uncertainty in the forecast on spatial location (i.e., the hurricane tracks). We suggest that one promising progress in tropical hurricanes forecasting may consist in changing the prediction paradigms from an “exact or precise” approach to probabilistic forecasting of future hurricane activity cycles. This is the reason why we focus on the problem of temporal forecasting using the Bayesian Machine Learning in this work. Our forecast is based on the natural patterns of multi-annual and decadal variations for each of the hurricane categories analyzed rather than analyzing any pre-season weather and climatic conditions and variables.
In our forecasting model, there is the clear absence of any a priori knowledge on pre-season activity. From the point of view of signal theory, this means that such pre-season information can be viewed as weather and climatic noise. Therefore, in order to predict hurricanes in the long-term sense, we are not focusing on forecasting these pre-season weather and climatic conditions. Because those weather and climatic noises are highly variable and could be accordingly assumed as a stochastic process. Therefore, without additional fine-grain information on pre-season activity, it is impossible to say exactly the weather and climatic conditions will be for the following year. We note however that for the study of hurricane trajectories that are preconditioned on the early season large-scale climate state, the model, Cluster-Based Climate-Conditioned Hurricane Intensity and Track Simulator (C3-HITS), can be used see [50,51]. Ultimately, our work highlights that the multiannual and decadal variations (trends) of Atlantic hurricanes from categories 2 to 5 are stable and consistent from 1950 to 2021 which can be assumed to be the result of the more persistent and coherent interactions of the coupled atmosphere-ocean-geographical system in affecting and modulating the tropical hurricanes. This notable property is indeed a useful signal from the point of view of signal theory and proffers a probabilistic forecast as we have performed in this study.
Our forecast is that no category 5 hurricanes will be formed in the Atlantic until the next active decadal oscillation phase around 2026 ± 2 to 2031 ± 3. For category 4 hurricanes, there could still be at least one event between 2022 and 2023. The next active category 4 hurricanes will begin in 2025 ± 1 and end 2028 ± 1. For category 3, it is expected that there could still be on event in 2022 while the next activity phase will be around 2023 ± 1 and 2025 ± 1 where one can expect 1 to 4 category 3 Atlantic hurricanes. Finally, for category 2 hurricanes, our Bayesian Machine Learnind model hindcasted correctly the highly active episodes around the 1990s and early 21st century (clusters X-XIII shown in Figure 8). The next active phase of category 2 hurricanes will be around 2023 ± 1 and 2025 ± 1. All these forecasts are within the testable realm in the very near future and they will be actively pursue and follow by our continuing study of the subject.
Finally, we like to point out that in the case of the category 5 super hurricanes of the Atlantic, they mainly develop in five hot deep water geographic areas that are very well defined: (I) the east coast of the United States, (II) the Northeast of Mexico, (III) the Caribbean Sea, (IV) the Central American coast, and (V) the north of the Greater Antilles. The identification of such specific spatial distribution for the potentially most intense and damaging super hurricanes, if proven correct, would certainly add to the practical toolbox for real-time monitoring and hurricane preparedness.

Author Contributions

Conceptualization, V.M.V.H. and G.V.H.; Methodology, V.M.V.H., L.R.-d.l.C. and E.Z.; Software, L.R.-d.l.C. and E.Z.; Validation, V.M.V.H., S.C.-E. and R.M.-D.; Formal Analysis, V.M.V.H., W.S. and G.V.H.; Investigation, V.M.V.H., W.S., S.C.-E. and R.M.-D.; Resources, G.V.H.; Data Curation, L.R.-d.l.C. and E.Z.; Writing—original draft preparation, V.M.V.H. and W.S.; Writing—review and editing, V.M.V.H. and W.S.; Visualization, G.V.H., S.C.-E. and R.M.-D.; Supervision, G.V.H.; Project Administration, V.M.V.H. and G.V.H.; Funding Acquisition, G.V.H. All authors have read and agreed to the published version of the manuscript.

Funding

V.M. Velasco Herrera acknowledges the support from PAPIIT-IT102420 grant. W.S.’s effort is partially supported by CERES G. Velasco Herrera acknowledges the support from “Marcos Mazari Menzer”-grant. Raúl Martell-Dubois, Sergio Cerdeira-Estrada and Laura Rosique-de la Cruz acknowledge the economical support provided by the Trust Fund for Biodiversity of CONABIO.

Institutional Review Board Statement

Not applicable.

Informed Consent Statement

Not applicable.

Data Availability Statement

Not applicable.

Acknowledgments

The authors are grateful for all supports from: Instituto de Geofísica, Universidad Nacional Autónoma de México, Center for Environmental Research and Earth Sciences (CERES), Institute of Earth Physics and Space Science (ELKH EPSS), Instituto de Ciencias Aplicadas y Tecnología, Universidad Nacional Autónoma de México, Comisión Nacional para el Conocimiento y uso de la Biodiversidad, CONACYT–LANOT–2022, Instituto de Geografía, Universidad Nacional Autónoma de México.

Conflicts of Interest

The authors declare no conflict of interest.

Abbreviations

The following abbreviations are used in this manuscript:
NOAANational Oceanic and Atmospheric Administration
ENSOEl Nino-Southern Oscillation
AMOAtlantic Multidecadal Oscillation
WTwavelet transform
NARXNon-linear Autoregressive eXogenous
LS-SVMLeast-Squares Support-Vector Machines
MLMachine Learning
RBFradial basis function
GISgeographic information system
GEBCOGeneral Bathymetric Chart of the Oceans
NAONorth Atlantic Oscillation
TSItotal solar irradiance

References

  1. Goldenberg, S.B.; Landsea, C.W.; Mestas-Nuez, A.M.; Gray, W.M. The Recent Increase in Atlantic Hurricane Activity: Causes and Implications. Science 2001, 293, 474–479. [Google Scholar] [CrossRef] [PubMed] [Green Version]
  2. Mann, M.E.; Emanuel, K.A. Atlantic hurricane trends linked to climate change. Eos 2006, 87, 233–241. [Google Scholar] [CrossRef] [Green Version]
  3. Gray, W.M. Atlantic Seasonal Hurricane Frequency. Part II: Forecasting its Variability. Mon. Weather Rev. 1984, 112, 1669–1683. [Google Scholar] [CrossRef]
  4. Gray, W.M. Strong Association Between West African Rainfall and U.S. Landfall of Intense Hurricanes. Science 1990, 249, 1251–1256. [Google Scholar] [CrossRef]
  5. Gray, W.M.; Landsea, C.W.; Mielke, P.W., Jr.; Berry, K.J. Predicting Atlantic Basin Seasonal Tropical Cyclone Activity by 1 August. Weather Forecast. 1993, 8, 73–86. [Google Scholar] [CrossRef]
  6. Gray, W.M.; Landsea, C.W.; Mielke, P.W., Jr.; Berry, K.J. Predicting Atlantic Basin Seasonal Tropical Cyclone Activity by 1 June. Weather Forecast. 1994, 9, 103–115. [Google Scholar] [CrossRef] [Green Version]
  7. van den Dool, H.M.; Peng, P.; Johansson, Å.; Chelliah, M.; Shabbar, A.; Saha, S. Seasonal-to-Decadal Predictability and Prediction of North American Climate—The Atlantic Influence. J. Clim. 2006, 19, 6005–6024. [Google Scholar] [CrossRef] [Green Version]
  8. Klotzbach, P.J.; Gray, W.M. Twenty-five years of Atlantic basin seasonal hurricane forecasts (1984–2008). Geophys. Res. Lett. 2009, 36, L09711. [Google Scholar] [CrossRef] [Green Version]
  9. Dolan, R.; Davis, R.E. An Intensity Scale for Atlantic Coast Northeast Storms. J. Coast. Res. 1992, 8, 840–853. [Google Scholar]
  10. Young, I.R.; Zieguer, S.; Babanin, V. Global Trends in Wind Speed and Wave Height. Science 2011, 332, 451–455. [Google Scholar] [CrossRef]
  11. Cionco, R.G.; Valentin, J.E.; Quaranta, N.E.; Soon, W. Lunar fingerprints in the modulated incoming solar radiation: In situ insolation and latitudinal insolation gradients as two important interpretative metrics for paleoclimatic data records and theoretical climate modeling. New Astron. 2018, 58, 96–106. [Google Scholar] [CrossRef]
  12. Cionco, R.G.; Soon, W.; Quaranta, N.E. On the calculation of latitudinal insolation gradients throughout the Holocene. Adv. Space Res. 2020, 66, 720–742. [Google Scholar] [CrossRef]
  13. Fedorov, V.; Frolov, D.; Velasco Herrera, V.M.; Soon, W.; Cionco, R. Role of the Radiation Factor in Global Climatic Events of the Late Holocene. Izv. Atmos. Ocean. Phys. 2021, 57, 1239–1253. [Google Scholar] [CrossRef]
  14. Kunkel, K.E.; Karl, T.R.; Brooks, H.; Kossin, J.; Lawrimore, J.H.; Arndt, D.; Bosart, L.; Changnon, D.; Cutter, S.L.; Doesken, N.; et al. Monitoring and Understanding Trends in Extreme Storms: State of Knowledge. Bull. Am. Meteorol. Soc. 2012, 94, 499–519. [Google Scholar] [CrossRef]
  15. Sharma, N.; Ali, M.M. Importance of Ocean Heat Content for Cyclone Studies. Oceanography 2014, 2, 124. [Google Scholar]
  16. Lin, I.I.; Goni, G.J.; Knaff, J.A.; Forbes, C.; Ali, M.M. Ocean heat content for tropical cyclone intensity forecasting and its impact on storm surge. Nat. Hazards 2013, 66, 1481–1500. [Google Scholar] [CrossRef]
  17. Shay, L.K.; Brewster, J.K. Oceanic heat content variability in the eastern Pacific Ocean for hurricane intensity forecasting. Mon. Weather Rev. 2010, 138, 2110–2131. [Google Scholar] [CrossRef]
  18. Mainelli, M.; DeMaria, M.; Shay, L.K.; Goni, G. Application of oceanic heat content estimation to operational forecasting of recent Atlantic category 5 hurricanes. Weather Forecast. 2008, 23, 3–16. [Google Scholar] [CrossRef]
  19. Levitus, S.; Antonov, J.I.; Boyer, T.P.; Baranova, O.K.; García, H.E.; Locarnini, R.A.; Mishonov, A.V.; Reagan, J.R.; Seidov, D.; Yarosh, E.; et al. NCEI Ocean Heat Content, Temperature Anomalies, Salinity Anomalies, Thermosteric Sea Level Anomalies, Halosteric Sea Level Anomalies, and Total Steric Sea Level Anomalies from 1955 to Present Calculated from In Situ Oceanographic Subsurface Profile Data (NCEI Accession 0164586). 2017. Available online: https://www.ncei.noaa.gov/access/metadata/landing-page/bin/iso?id=gov.noaa.nodc:0164586 (accessed on 12 January 2022). [CrossRef]
  20. Larson, S.; Lee, S.K.; Wang, C.; Chung, E.S.; Enfield, D. Impacts of non-canonical El Niño patterns on Atlantic hurricane activity. Geophys. Res. Lett. 2012, 39, 1481–1500. [Google Scholar] [CrossRef]
  21. Patricola, C.M.; Chang, P.; Saravanan, R. Degree of simulated suppression of Atlantic tropical cyclones modulated by flavour of El Niño. Nat. Geosci. 2016, 9, 155–160. [Google Scholar] [CrossRef]
  22. West, R.; Lopez, H.; Lee, S.K.; Mercer, A.E.; Kim, D.; Foltz, G.R.; Balaguru, K. Seasonality of interbasin SST contributions to Atlantic tropical cyclone activity. Geophys. Res. Lett. 2022, 49, e2021GL096712. [Google Scholar] [CrossRef]
  23. Dunion, J.P.; Velden, C.S. The Impact of the Saharan Air Layer on Atlantic Tropical Cyclone Activity. Bull. Am. Meteorol. Soc. 2004, 84, 353–365. [Google Scholar] [CrossRef] [Green Version]
  24. Prospero, J.M.; Nees, R.T. Impact of the North African drought and El Niño on mineral dust in the Barbados trade winds. Nature 1986, 320, 735–738. [Google Scholar] [CrossRef]
  25. Maring, X.; Li, H.; Savoie, D.; Voss, K.; Prospero, J.M. Dominance of mineral dust in aerosol light-scattering in the North Atlantic trade winds. Nature 1996, 380, 416–419. [Google Scholar]
  26. Kaufman, Y.J.; Koren, I.; Remer, L.A.; Rosenfeld, D.; Rudich, Y. The Effect of Smoke, Dust, and Pollution Aerosol on Shallow Cloud Development over the Atlantic Ocean. Proc. Natl. Acad. Sci. USA 2005, 2, 124. [Google Scholar] [CrossRef] [Green Version]
  27. Sassen, K.; DeMott, P.J.; Prospero, J.M.; Poellot, M.R. Saharan dust storms and indirect aerosol effects on clouds: CRYSTAL-FACE results. Geophys. Res. Lett. 2003, 30, L017371. [Google Scholar] [CrossRef] [Green Version]
  28. Sun, D.; Lau, K.M.; Kafatos, M. Contrasting the 2007 and 2005 hurricane seasons: Evidence of possible impacts of Saharan dry air and dust on tropical cyclone activity in the Atlantic basin. Geophys. Res. Lett. 2008, 35, L15405. [Google Scholar] [CrossRef] [Green Version]
  29. Michaels, P.J.; Knappenberger, P.C.; Davis, R.E. Sea-surface temperatures and tropical cyclones in the Atlantic basin. Geophys. Res. Lett. 2006, 33, L09708. [Google Scholar] [CrossRef] [Green Version]
  30. Shapiro, L.J.; Goldenberg, S.B. Atlantic Sea Surface Temperatures and Tropical Cyclone Formation. J. Clim. 1998, 33, 578–590. [Google Scholar] [CrossRef] [Green Version]
  31. Landsea, C.W.; Gray, W.M. The Strong Association between Western Sahelian Monsoon Rainfall and Intense Atlantic Hurricanes. J. Clim. 1992, 5, 1528–1534. [Google Scholar] [CrossRef] [Green Version]
  32. Chen, R.; Zhang, W.; Wang, X. Machine Learning in Tropical Cyclone Forecast Modeling: A Review. Atmosphere 2020, 11, 676. [Google Scholar] [CrossRef]
  33. Asthana, T.; Krim, H.; Sun, X.; Roheda, S.; Xie, L. Atlantic Hurricane Activity Prediction: A Machine Learning Approach. Atmosphere 2021, 12, 455. [Google Scholar] [CrossRef]
  34. Sun, X.; Xie, L.; Shah, S.U.; Shen, X. A Machine Learning Based Ensemble Forecasting Optimization Algorithm for Preseason Prediction of Atlantic Hurricane Activity. Atmosphere 2021, 12, 522. [Google Scholar] [CrossRef]
  35. Boussioux, L.; Zeng, C.; Guenais, T.; Bertsimas, D. Hurricane Forecasting: A Novel Multimodal Machine Learning Framework. Weather Forecast. 2022; in press. [Google Scholar] [CrossRef]
  36. Velasco Herrera, V.M.; Mendoza, B.; Velasco Herrera, G. Reconstruction and prediction of the total solar irradiance: From the Medieval Warm Period to the 21st century. New Astron. 2015, 34, 221–233. [Google Scholar] [CrossRef]
  37. Velasco Herrera, V.M.; Soon, W.; Legates, D.R. Does Machine Learning reconstruct missing sunspots and forecast a new solar minimum? Adv. Space Res. 2021, 68, 1485–1501. [Google Scholar] [CrossRef]
  38. Velasco Herrera, V.M.; Soon, W.; Hoyt, D.V.; Muraközy, J. Group Sunspot Numbers: A New Reconstruction of Sunspot Activity Variations from Historical Sunspot Records Using Algorithms from Machine Learning. Sol. Phys. 2022, 297, 1485–1501. [Google Scholar] [CrossRef]
  39. Velasco Herrera, V.M.; Soon, W.; Pérez-Moreno, C.; Velasco Herrera, G.; Martell-Dubois, R.; Rosique-de la Cruz, L.; Fedorov, V.M.; Cerdeira-Estrada, S.; Bongelli, E.; Zúñiga, E. Past and future of wildfires in Northern Hemisphere is boreal forests. For. Ecol. Manag. 2022, 504, 119859. [Google Scholar] [CrossRef]
  40. Grossmann, A.; Morlet, J. Decomposition of Hardy functions into square integrable wavelets of constant shape. SIAM J. Math. Anal. 1984, 15, 723–736. [Google Scholar] [CrossRef]
  41. Soon, W.; Velasco Herrera, V.M.; Cionco, R.G.; Qiu, S.; Baliunas, S.; Egeland, R. Covariations of chromospheric and photometric variability of the young Sun analogue HD 30495: Evidence for and interpretation of mid-term periodicities. Mon. Not. R. Astron. Soc. 2019, 483, 2748–2757. [Google Scholar] [CrossRef]
  42. Torrence, C.; Compo, G. A practical guide to wavelet analysis. Bull. Am. Meteorol. Soc. 1998, 79, 61–78. [Google Scholar] [CrossRef] [Green Version]
  43. Torrence, C.; Webster, P.J. Interdecadal Changes in the ENSO-Monsoon System. J. Clim. 1999, 12, 2679–2690. [Google Scholar] [CrossRef] [Green Version]
  44. Suykens, J.; Gestel, T.; De Brabanter, J.; De Moor, B.; Vandewalle, J. Least Squares Support Vector Machines; World Scientific Publishing Company: Singapore, 2005; 308p. [Google Scholar]
  45. Bayes, T. An essay towards solving a problem in the doctrine of chances. Philos. Trans. R. Soc. Lond. 1763, 53, 370–418. [Google Scholar] [CrossRef]
  46. Knapp, K.R.; Kruk, M.C.; Levinson, D.H.; Diamond, H.J.; Neumann, C.J. The International Best Track Archive for Climate Stewardship (IBTrACS): Unifying tropical cyclone best track data. Bull. Am. Meteorol. Soc. 2010, 91, 363–376. [Google Scholar] [CrossRef]
  47. Velasco Herrera, V.M.; Mendoza, B. Assessing the relationship between solar activity and some large scale climatic phenomena. Adv. Space Res. 2008, 42, 866–878. [Google Scholar] [CrossRef]
  48. Soon, W. Solar Arctic-Mediated Climate Variation on Multidecadal to Centennial Timescales: Empirical Evidence, Mechanistic Explanation, and Testable Consequences. Phys. Geogr. 2009, 30, 144–184. [Google Scholar] [CrossRef]
  49. Mendoza, E.; Velasco Herrera, V.M.; Velasco-Herrera, G.; Martell, R.; Silva, R.; Escudero, M.; Ocampo-Torres, F.J.; Mariño-Tapia, I. Spectral analysis of sea surface elevations produced by big storms: The case of hurricane Wilma. Reg. Stud. Mar. Sci. 2020, 39, 101390. [Google Scholar] [CrossRef]
  50. Nakamura, J.; Lall, U.; Kushnir, Y.; Rajagopalan, B. HITS: Hurricane intensity and track simulator with North Atlantic Ocean applications for risk assessment. J. Appl. Meteorol. Climatol. 2015, 54, 1620–1636. [Google Scholar] [CrossRef]
  51. Nakamura, J.; Lall, U.; Kushnir, Y.; Harr, P.A.; McCreery, K. Early Season Hurricane Risk Assessment: Climate-Conditioned HITS Simulation of North Atlantic Tropical Storm Tracks. J. Appl. Meteorol. Climatol. 2021, 60, 559–575. [Google Scholar] [CrossRef]
Figure 1. Time-frequency wavelet results of category 5 Atlantic hurricanes between 1950 and 2021. The digital time series for category 5 Atlantic hurricanes is shown in the upper panel. The global wavelet spectrum is shown in the left panel. The central panel shows the calculated wavelet Power Spectral Density (PSD) in normalized units adopting the red-green-blue color scales. The Cone Of Influence (COI, “U”-shaped curve with shaded outer zones) shows the possible edge effects in the PSD. The time-frequency regions with wavelet spectral power detection above 95% confidence level are marked with thin black contours.
Atmosphere 13 00707 g001
Figure 2. Probabilistic hindcasts and forecasts for the category 5 Atlantic hurricanes. Bayesian inference of the LS-SVM model (blue line and shade) compared with the historical category 5 Atlantic hurricanes (purple vertical bars) clustered in 8 groups (I–VIII). In addition, the probabilistic prediction of category 5 Atlantic hurricane is shown for the following period (cluster IX). The blue shaded area represents the 95% confidence intervals of the Bayesian model.
Atmosphere 13 00707 g002
Figure 3. Time-frequency wavelet results of category 4 Atlantic hurricanes between 1950 and 2021. The digital time series for category 4 Atlantic hurricanes is shown in the upper panel. The global wavelet spectrum is shown in the left panel. The central panel shows the calculated wavelet Power Spectral Density (PSD) in normalized units adopting the red-green-blue color scales. The Cone Of Influence (COI, “U”-shaped curve with shaded outer zones) shows the possible edge effects in the PSD. The time-frequency regions with wavelet spectral power detection above 95% confidence level are marked with thin black contours.
Atmosphere 13 00707 g003
Figure 4. Probabilistic hindcasts and forecasts for the category 4 Atlantic hurricanes. Bayesian inference of the LS-SVM model (blue line and shade) compared with the historical category 4 Atlantic hurricanes (purple vertical bars) clustered in 15 groups (I–XV). In addition, the probabilistic prediction for category 4 Atlantic hurricane is shown for the following period (cluster XVI). The blue shaded area represents the 95% confidence intervals of the Bayesian model.
Atmosphere 13 00707 g004
Figure 5. Time-frequency wavelet results of category 3 Atlantic hurricanes between 1950 and 2021. The digital time series for category 3 Atlantic hurricanes is shown in the upper panel. The global wavelet spectrum is shown in the left panel. The central panel shows the calculated wavelet Power Spectral Density (PSD) in normalized units adopting the red-green-blue color scales. The Cone Of Influence (COI, “U”-shaped curve with shaded outer zones) shows the possible edge effects in the PSD. The time-frequency regions with wavelet spectral power detection above 95% confidence level are marked with thin black contours.
Atmosphere 13 00707 g005
Figure 6. Probabilistic hindcasts and forecasts for the category 3 Atlantic hurricanes. Bayesian inference of the LS-SVM model (blue line and shade) compared with the historical category 3 Atlantic hurricanes (purple vertical bars) clustered in 16 groups (I–XVI). In addition, the probabilistic earthquake prediction is shown for the following period (cluster XVII). The blue shaded area represents the 95% confidence intervals of the Bayesian model.
Atmosphere 13 00707 g006
Figure 7. Time-frequency wavelet results of category 2 Atlantic hurricanes between 1950 and 2021. The digital time series for category 2 Atlantic hurricanes is shown in the upper panel. The global wavelet spectrum is shown in the left panel. The central panel shows the calculated wavelet Power Spectral Density (PSD) in normalized units adopting the red-green-blue color scales. The Cone Of Influence (COI, “U”-shaped curve with shaded outer zones) shows the possible edge effects in the PSD. The time-frequency regions with wavelet spectral power detection above 95% confidence level are marked with thin black contours.
Atmosphere 13 00707 g007
Figure 8. Probabilistic hindcasts and forecasts for the category 2 Atlantic hurricane. Bayesian inference of the LS-SVM model (blue line and shade) compared with the historical category 2 Atlantic hurricanes (purple vertical bars) clustered in 18 groups (I–XVIII). In addition, the probabilistic earthquake prediction is shown for the following period (cluster XIX). The blue shaded area represents the 95% confidence intervals of the Bayesian model.
Atmosphere 13 00707 g008
Figure 9. Speed distribution map of Atlantic hurricanes for each of the categories: (a) Category 2; (b) Category 3; (c) Category 4 where the main zone (marked by the rectangular box) of cyclogenesis seems to fall outside the Gulf of Mexico. In addition, in panel (d) we show the region of cyclogenesis for Category 5 Atlantic hurricanes that highlights five areas of concentration around (I) the east coast of the United States, (II) the Northeast of Mexico, (III) the Caribbean Sea, (IV) the Central American coast, and (V) the north of the Greater Antilles.
Atmosphere 13 00707 g009
Figure 10. Probability distribution maps for the Atlantic hurricane wind speed for: (a) Category 2; (b) Category 3; (c) Category 4; (d) Category 5. The vertical and horizontal lines indicate the local maxima for the longitudinal and latitudinal distributions, respectively. The main point of this spatial clustering map is to indicate the possible connection between the climatic and geographical conditions for the development of maximum speed of Atlantic hurricanes.
Atmosphere 13 00707 g010
Figure 11. Category-5 Hurricane Wilma (2006). (a) This is an example of the analysis of the category-5 hurricane Wilma wind speed and bathymetry. It reaches its maximum speed (black line) around the greatest depth (−4500 m; dotted blue line). (b) It is also possible to analyze the atmospheric pressure data for the same example of Wilma. It reaches its minimum pressure (black line) around the greatest depth (−4500 m; dotted blue line).
Atmosphere 13 00707 g011
Publisher’s Note: MDPI stays neutral with regard to jurisdictional claims in published maps and institutional affiliations.

