Article

Deterministic and Probabilistic Evaluation of Sub-Seasonal Precipitation Forecasts at Various Spatiotemporal Scales over China during the Boreal Summer Monsoon

College of Hydrology and Water Resources, Hohai University, Nanjing 210098, China
*
Author to whom correspondence should be addressed.
Atmosphere 2021, 12(8), 1049; https://doi.org/10.3390/atmos12081049
Submission received: 13 July 2021 / Revised: 10 August 2021 / Accepted: 11 August 2021 / Published: 15 August 2021
(This article belongs to the Special Issue Advances in Hydrometeorological Ensemble Prediction)

Abstract

:
Skillful sub-seasonal precipitation forecasts can provide valuable information for both flood and drought disaster mitigations. This study evaluates both deterministic and probabilistic sub-seasonal precipitation forecasts of ECMWF, ECCC, and UKMO models derived from the Sub-seasonal to Seasonal (S2S) Database at various spatiotemporal scales over China during the boreal summer monsoon. The Multi-Source Weighted-Ensemble Precipitation, version 2 (MSWEP V2), is used as the reference dataset to evaluate the forecast skills of the models. The results suggest that skillful deterministic sub-seasonal precipitation forecasts are found when the lead time is within 2 weeks. The deterministic forecast skills reduce quickly when the lead time is beyond 2 weeks. Positive ranked probability skill scores (RPSS) are only found when the lead time is within 2 weeks for probabilistic forecasts as well. Multimodel ensembling helps to improve forecast skills by removing large negative skill scores in northwestern China. The forecast skills are also improved at larger spatial scales or longer temporal scales. However, the improvement is only observed for certain regions where the predictable low frequency signals remain at longer lead times. The composite analysis suggests that both the El Niño–Southern Oscillation (ENSO) and Madden–Julian Oscillation (MJO) have an impact on weekly precipitation variability over China. The forecast skills are found to be enhanced during active ENSO and MJO phases. In particular, the forecast skills are found to be enhanced during active MJO phases.

1. Introduction

Skillful sub-seasonal precipitation forecasts (between 2 weeks and 3 months) can provide valuable information for applications such as flood and drought mitigations [1,2,3]. However, precipitation forecasts at such a time scale remain challenging. Compared to short to medium range forecasts, the memory of atmospheric initial conditions is lost for sub-seasonal forecasts. On the other hand, the slowly varying boundary conditions do not have a substantial impact on sub-seasonal forecasts, as the time scale is too short [4,5].
A growing number of studies have investigated the role played by possible sources of sub-seasonal predictability. The Madden–Julian Oscillation (MJO) is one of the leading potential sources of sub-seasonal predictability [6,7]. Other processes in the climate system, such as stratosphere–troposphere interactions [8,9], soil moisture conditions [10,11], snow cover conditions [12,13], and ocean conditions [14,15], are also investigated.
With a better understanding of sub-seasonal predictability and the improvement of Global Climate Models (GCMs), the sub-seasonal forecast skills have been improved in recent years [5]. Vitart, Ardilouze, Bonet, Brookshaw, Chen, Codorean, Déqué, Ferranti, Fucile and Fuentes [1] found that the GCMs were able to predict the occurrence of a strong MJO event in March 2015 more than 2 weeks in advance. Vitart and Robertson [2] found that the ECMWF model was able to provide useful guidance for a 2010 Russian heat wave event 3 weeks in advance, and Tian, et al. [16] found that the Climate Forecast System, version 2 (CFSv2), model was able to make skilful sub-seasonal forecasts for 7- and 14-day temperature indices over the United States.
Compared to MJO and temperature forecasts, sub-seasonal precipitation forecasts are of lower predictive skills, owing to the known ‘noisy’ and small scale characteristics [17,18]. Li and Robertson [19] and de Andrade, Coelho and Cavalcanti [4] assessed the performance of GCMs for weekly accumulated precipitation forecasts across the globe, and their results suggested that the forecast skills were low when the lead time was beyond 2 weeks on extratropical continental areas. Pan, et al. [20] found that the correlation coefficients between daily precipitation forecasts and the observations fall below 0.2 within 8 to 15 days over the West Coast United States. In addition, the quality of the observations used to initialize the GCMs is also crucial for the success of forecasts. Although in situ instruments, remote sensing platforms, and aircraft have become more common in recent years, the precipitation measurement is still of high uncertainty in many regions [21,22,23]. For example, snowfall constitutes a significant part of total precipitation in cold climate regions. However, the traditional gauge measurement of snowfall is always biased, as the number of snowflakes able to enter the orifice is reduced by the wind flow. Rain gauge is considered to be the most accurate method for measuring rainfall, whereas the number of rain gauges are always sparse in mountainous regions. Although the satellite based precipitation products can cover the whole globe, the inadequate number of rain gauges makes it difficult to correct the bias in satellite products in these regions [24].
Spatial or temporal aggregation helps to remove high frequency signals and can further improve forecast skills for certain areas [25]. There have been several works on scale-dependent verification of both deterministic and ensemble forecasts. Vigaud, et al. [26] found that the week 3–4 forecasts have higher skills compared to week 3 or week 4 forecasts when the forecasts are initialized in February–April, while the skill gain is less pronounced for other seasons. van Straaten, et al. [27] suggested that the forecast skills of 2 m temperature were improved with larger spatial scales in winter.
In addition, multimodel ensembling (MME) can also improve both weather and seasonal predictions over different regimes [28,29,30]. However, much fewer studies used the MME approach to improve sub-seasonal precipitation forecasts, as the GCM models from different agencies are always initialized on different days and issued at a different frequency. Vigaud, et al. [31] verified the multimodel ensemble mean prediction of sub-seasonal precipitation over North America, and their results suggested that the MME forecasts were of higher accuracy compared to each single model. Wang, et al. [32] suggested that multimodel ensembling can significantly improve the prediction skill of sub-seasonal precipitation on the Maritime Continent (MC).
Although the MME approach is able to address uncertainties from initial conditions and models, the ensemble spread is still too narrow to fully quantify the uncertainty of sub-seasonal precipitation forecasts. Recently, several probabilistic models have been built to predict sub-seasonal precipitation by post-processing GCM outputs. Schepen, et al. [33] used the Bayesian Joint Probability method to post-process sub-seasonal precipitation forecasts for 12 catchments across Australia and found that the probabilistic precipitation forecasts are of high accuracy and reliability, especially when the lead time is within 2 weeks. Vigaud, Tippett and Robertson [26] constructed tercile category probability forecasts of sub-seasonal precipitation using extended logical regression (ELR) over the East Africa–West Asia sector, and their results suggested that the probabilistic forecasts are of high reliability for weekly forecasts. On the other hand, the sub-seasonal probabilistic forecasts were of low sharpness when the lead time is beyond 1 week.
China is located in East Asia and is highly affected by the East Asian Summer Monsoon (EASM). The earliest onset of the EASM is usually observed in the central Indochina Peninsula in late April or early May. The summer monsoon then advances northward to northern China until August, undergoing three standing stages and two abrupt northward shifts. The EASM then moves back to South China again in September and makes way for the winter monsoon in October [34,35]. Extreme flood and drought disasters are always caused by heavy or limited rainfalls during the boreal summer monsoon from May to October. Accurate sub-seasonal precipitation forecasts during the boreal summer monsoon over China can provide valuable information for flood and drought disaster prevention. In our previous study, we only used the Bayesian Joint Probability (BJP) approach to calibrate the ECMWF forecasts derived from the S2S Database [36]. However, we should note that the model systems are of great diversity in the S2S Database. It is of great importance to make intercomparisons between different GCMs. Meanwhile, it is also important to assess the benefits of the MME approach on sub-seasonal precipitation forecasts over China, which has not been studied yet. In addition, we assessed the performance of the BJP-calibrated forecasts using the CRPS skill score, which provided an overall evaluation of ensemble forecasts, whereas the probability forecasts of multi category events had not been studied yet. In this study, we first evaluate deterministic sub-seasonal precipitation forecast skills from both single GCM model outputs and a multimodel ensemble mean of GCMs from May to October over China. An extended logical regression model is then built to evaluate the probabilistic forecast skills of multiple category events at various spatiotemporal scales. The remainder of the paper is structured as follows. The GCM models, the observed data, the evaluation metrics, and the sources of sub-seasonal predictability are introduced in Section 2. Section 3 presents the results of both deterministic and probabilistic sub-seasonal precipitation forecasts at various spatiotemporal scales. The impact of El Niño–Southern Oscillation (ENSO) and MJO on sub-seasonal predictability is also shown in Section 3. We discuss the results in Section 4, and the conclusions are drawn in Section 5.

2. Data and Methodology

2.1. GCM Models and Reference Dataset

The World Weather Research Program (WWRP) and the World Climate Research Program (WCRP) launched the Sub-seasonal to Seasonal (S2S) Prediction Project [3,37]. An extensive S2S database of up-to-60-day forecasts produced by Global Climate Models (GCMs) has been developed for both near real-time predictions and hindcasts (reforecasts) provided by 11 operation or research centers [1]. The dataset is now archived in data servers at the European Centre for Medium-Range Weather Forecasts (ECMWF; http://apps.ecmwf.int/datasets/data/s2s/, last accessed on 30 January 2021) and the China Meteorological Administration (CMA; http://s2s.cma.cn/, last accessed on 30 January 2021). In this study, we evaluate sub-seasonal precipitation forecasts for the ECMWF model, the Environment and Climate Change Canada (ECCC) model, and the United Kingdom’s Met Office (UKMO) model retrieved from the S2S Database (Table 1). As all the three models have an on-the-fly production cycle, we use hindcasts corresponding to model versions in the year 2020.
An accurate and reliable precipitation dataset is also crucial for the assessment of precipitation forecasts. Many datasets are developed by merging precipitation estimates from gauges, satellites, and numerical models [38,39]. In this study, the Multi-Source Weighted-Ensemble Precipitation, version 2 (MSWEP V2), dataset is used to evaluate the forecast skill of the models. The MSWEP V2 dataset spans from 1979 to 2017 with high spatial (0.1°) and temporal (3-h) resolution. Compared to other gridded datasets, the MSWEP V2 exhibits more realistic spatial patterns and higher accuracy over land [40,41,42].

2.2. Evaluation Strategy and Skill Metrics

The common evaluation period for the three selected models is 2000–2017, constrained by both the hindcasts and observation availability. We should also note that the three selected models do not have same hindcast frequency and start dates (Table 1). To have a fair comparison, we select hindcasts from ECMWF model that have the same start dates as the ECCC and the UKMO model. A multi-model ensembling (MME) evaluation is also performed by averaging the ECMWF model, ECCC model, and the UKMO model forecasts with the same start dates. The ECMWF, ECCC, UKMO, and MME daily forecasts are then aggregated to weekly and fortnight temporal scales by rolling 7-day and 14-day window averages to all lead times. The week 1, week 2, week 3, and week 4 precipitation forecasts are derived from 7-day rolling window averages with a lead time of 0 days, 7 days, 14 days, and 21 days, respectively, while the week 1–2 and week 3–4 precipitation forecasts are derived from 14-day rolling window averages with a lead time of 0 days and 14 days. Regional precipitation forecasts are calculated by averaging forecasts within each hydroclimatic region shown in Figure 1. Figure 2 presents the mean and the coefficient of variation of daily precipitation over China during the boreal summer monsoon. The precipitation amount is higher in southeastern China due to the impact of the East Asia Summer Monsoon (EASM). In comparison, limited precipitation is observed in northwestern China. However, variability of daily precipitation in these dry regions is highest compared to other regions.

2.2.1. Deterministic Metrics

The deterministic forecast skills are then evaluated using a leave-one-year-out approach, in which the reference climatology is calculated over the period excluding the target year to be verified. Consider, for example, evaluating daily precipitation forecasts initialized on 4 May 2000. The climatology is determined using all forecasts initialized on 4 May 2001–2017. To take the ensemble size into consideration, we analyze the same verification metrices using only one control and three perturbed ensemble members for all three models. The three perturbed ensemble members are selected from the combinations from the remaining ensemble numbers for each GCM model. Thus, there is a total number of C 10 3 = 120 combinations for the ECMWF model and C 6 3 = 20 combinations for the UKMO model. The deterministic and probabilistic forecast skills are then calculated by averaging the skill scores for all combinations. The forecast anomaly for this case is then derived by subtracting the cross-validated climatological mean. The observed anomalies are calculated in the same way.
After that, the mean squared skill score (MSSS) is given by
M S E H = 1 T t = 1 T ( H t O t ) 2
M S E O = 1 T t = 1 T ( O ¯ O t ) 2
M S S S ( H , O ¯ , O ) = 1 M S E H M S E O
where H t is the ensemble mean of anomaly of sub-seasonal precipitation forecasts for case t , t = 1 , 2 , , T ; O t is the corresponding observed anomaly; and O ¯ is the average of observed anomalies for all cases. The MSSS compares the mean square error of the GCM forecasts to the climatology forecasts and can be expanded as
M S S S ( H , O ¯ , O ) = r H O 2 ( r H O s H s O ) 2 ( H ¯ O ¯ s O ) 2
where r H O is the correlation coefficient between forecast anomalies and observed anomalies; s H and s O are the standard deviation of forecast anomalies and observed anomalies, respectively; and H ¯ is the mean value of forecast anomalies for all cases [43].

2.2.2. Probabilistic Metrics

It is difficult to evaluate probabilistic forecasts of the selected models directly, as the ensemble sizes are too small to generate probability accurately [44]. In this study, the extended logistic regression (ELR) is used to calculate the probabilities for tercile-based events:
ln ( p 1 p ) = θ 0 + θ 1 H + θ 2 q
where p is the probability not exceeding the quantile q ; H is the ensemble mean of sub-seasonal precipitation forecasts; and θ = { θ 0 ,   θ 1 , θ 2 } are parameters to be estimated. It has been proved that the extended logistic regression can yield logically constant sets of forecasts [26,31]. In this study, the ELR model is built for daily, weekly, and fortnight forecasts at both grid scales and regional scales following a leave-one-year-out approach as well. In the case of deterministic evaluation, the 33rd and 67rd percentiles of the observations are defined as the quantiles over the period of 2001–2017. Forecasts and observations, which are initialized on 4 May during the period of 2001 to 2017, are pooled together to make a parameter reference for the ELR model.
The ranked probability skill score (RPSS) is used to evaluate the forecast skills. The RPSS is defined as
R P S = 1 T t = 1 T k = 1 K [ ( m = 1 k p m , t ) ( m = 1 k o m , t ) ] 2
R P S C = 1 T t = 1 T k = 1 K [ ( m = 1 k c m , t ) ( m = 1 k o m , t ) ] 2
R P S S = ( 1   R P S R P S C ) × 100 %
where p m , t is the forecast probability assigned to the kth category,   c m , t is the climatological probability assigned to the kth category, and o m , t is one when the observation falls into the kth category and zero otherwise. The RPSS ranges from to 100%. A higher RPSS value indicates higher accuracy. When the CRPSS is 0%, the probabilistic forecasts show no improvement over the cross-validated climatological forecasts.
The attribute diagram is used to evaluate the reliability, resolution, and sharpness of the ELR-based tercile category probabilistic forecasts. The attribute diagram shows the observed frequencies against its forecast probabilities [45]. In this study, the three class events of below-, near-, and above normal are first defined by equally dividing the cross-validated climatology into terciles. The forecast probability is divided into 5 equal-width groups, which are [0, 0.2), [0.2, 0.4), [0.4, 0.6), [0.6, 0.8), [0.8, 1.0]. The corresponding observed relative frequency is plotted against the mean forecast probability for each group. The forecasts are reliable if the scatters are along the 45-degree diagonal. The sharpness is also shown on the attribute diagram. The size of dot indicates the fraction of forecasts in each group. The forecasts are sharp if the fraction of forecasts tends to be either very high (e.g., >90%) or very low (e.g., <10%) [46].

2.3. Sources of Sub-Seasonal Predictability

To diagnose the impact of ENSO and MJO on weekly precipitation variability over China, composite analysis of precipitation anomalies at different ENSO and MJO phases is conducted in this study.
The phase of ENSO event is measured by the weekly Ni n ˜ o-3.4 index defined as the SST anomalies averaged across a given region (5 ° N–5 ° S, 170 ° W–120 ° W). The Optimum Interpolation SST, version 2.1 (OISST.v2.1), is used here to derive the weekly Ni n ˜ o-3.4 index for the period of 2000–2017. The weekly anomalies are calculated and standardized using a leave-one-year-out cross-validation approach. An El Niño (La Niña) event is defined if a five consecutive 3-month running mean of SST anomalies is above (below) the threshold of +0.5 °C (−0.5 °C).
The phase of MJO event is measured by the Real-time Multivariate MJO (RMM) index components (RMM1 and RMM2). In this study, the zonal wind (850 hPa and 200 hPa) is obtained from the ERA5 reanalysis, and the outgoing longwave radiation (OLR) is derived from Climate Data Record Program of NOAA (http://doi.org/10.7289/V5SJ1HH2, accessed on 30 January 2021) for the same period of 2000–2017. The weekly anomalies of zonal wind and OLR are computed using a leave-one-year-out cross-validation approach, and the MJO cycles with R M M 1 2 + R M M 2 2 > 1 are denoted as strong MJO events.
Weekly precipitation anomalies are calculated by subtracting weekly cross-validated climatology as well. Composites are made according to the weekly Ni n ˜ o-3.4 index and RMM index during the boreal summer monsoon for the period of 2000–2017. Statistical significance for the composites is assessed through Monte Carlo simulations considering a p value of 0.05 (5% level).
The forecast metrics are then compared at different ENSO and MJO phases to investigate the influence of large scale circulations on sub-seasonal precipitation forecasts over China.

3. Results

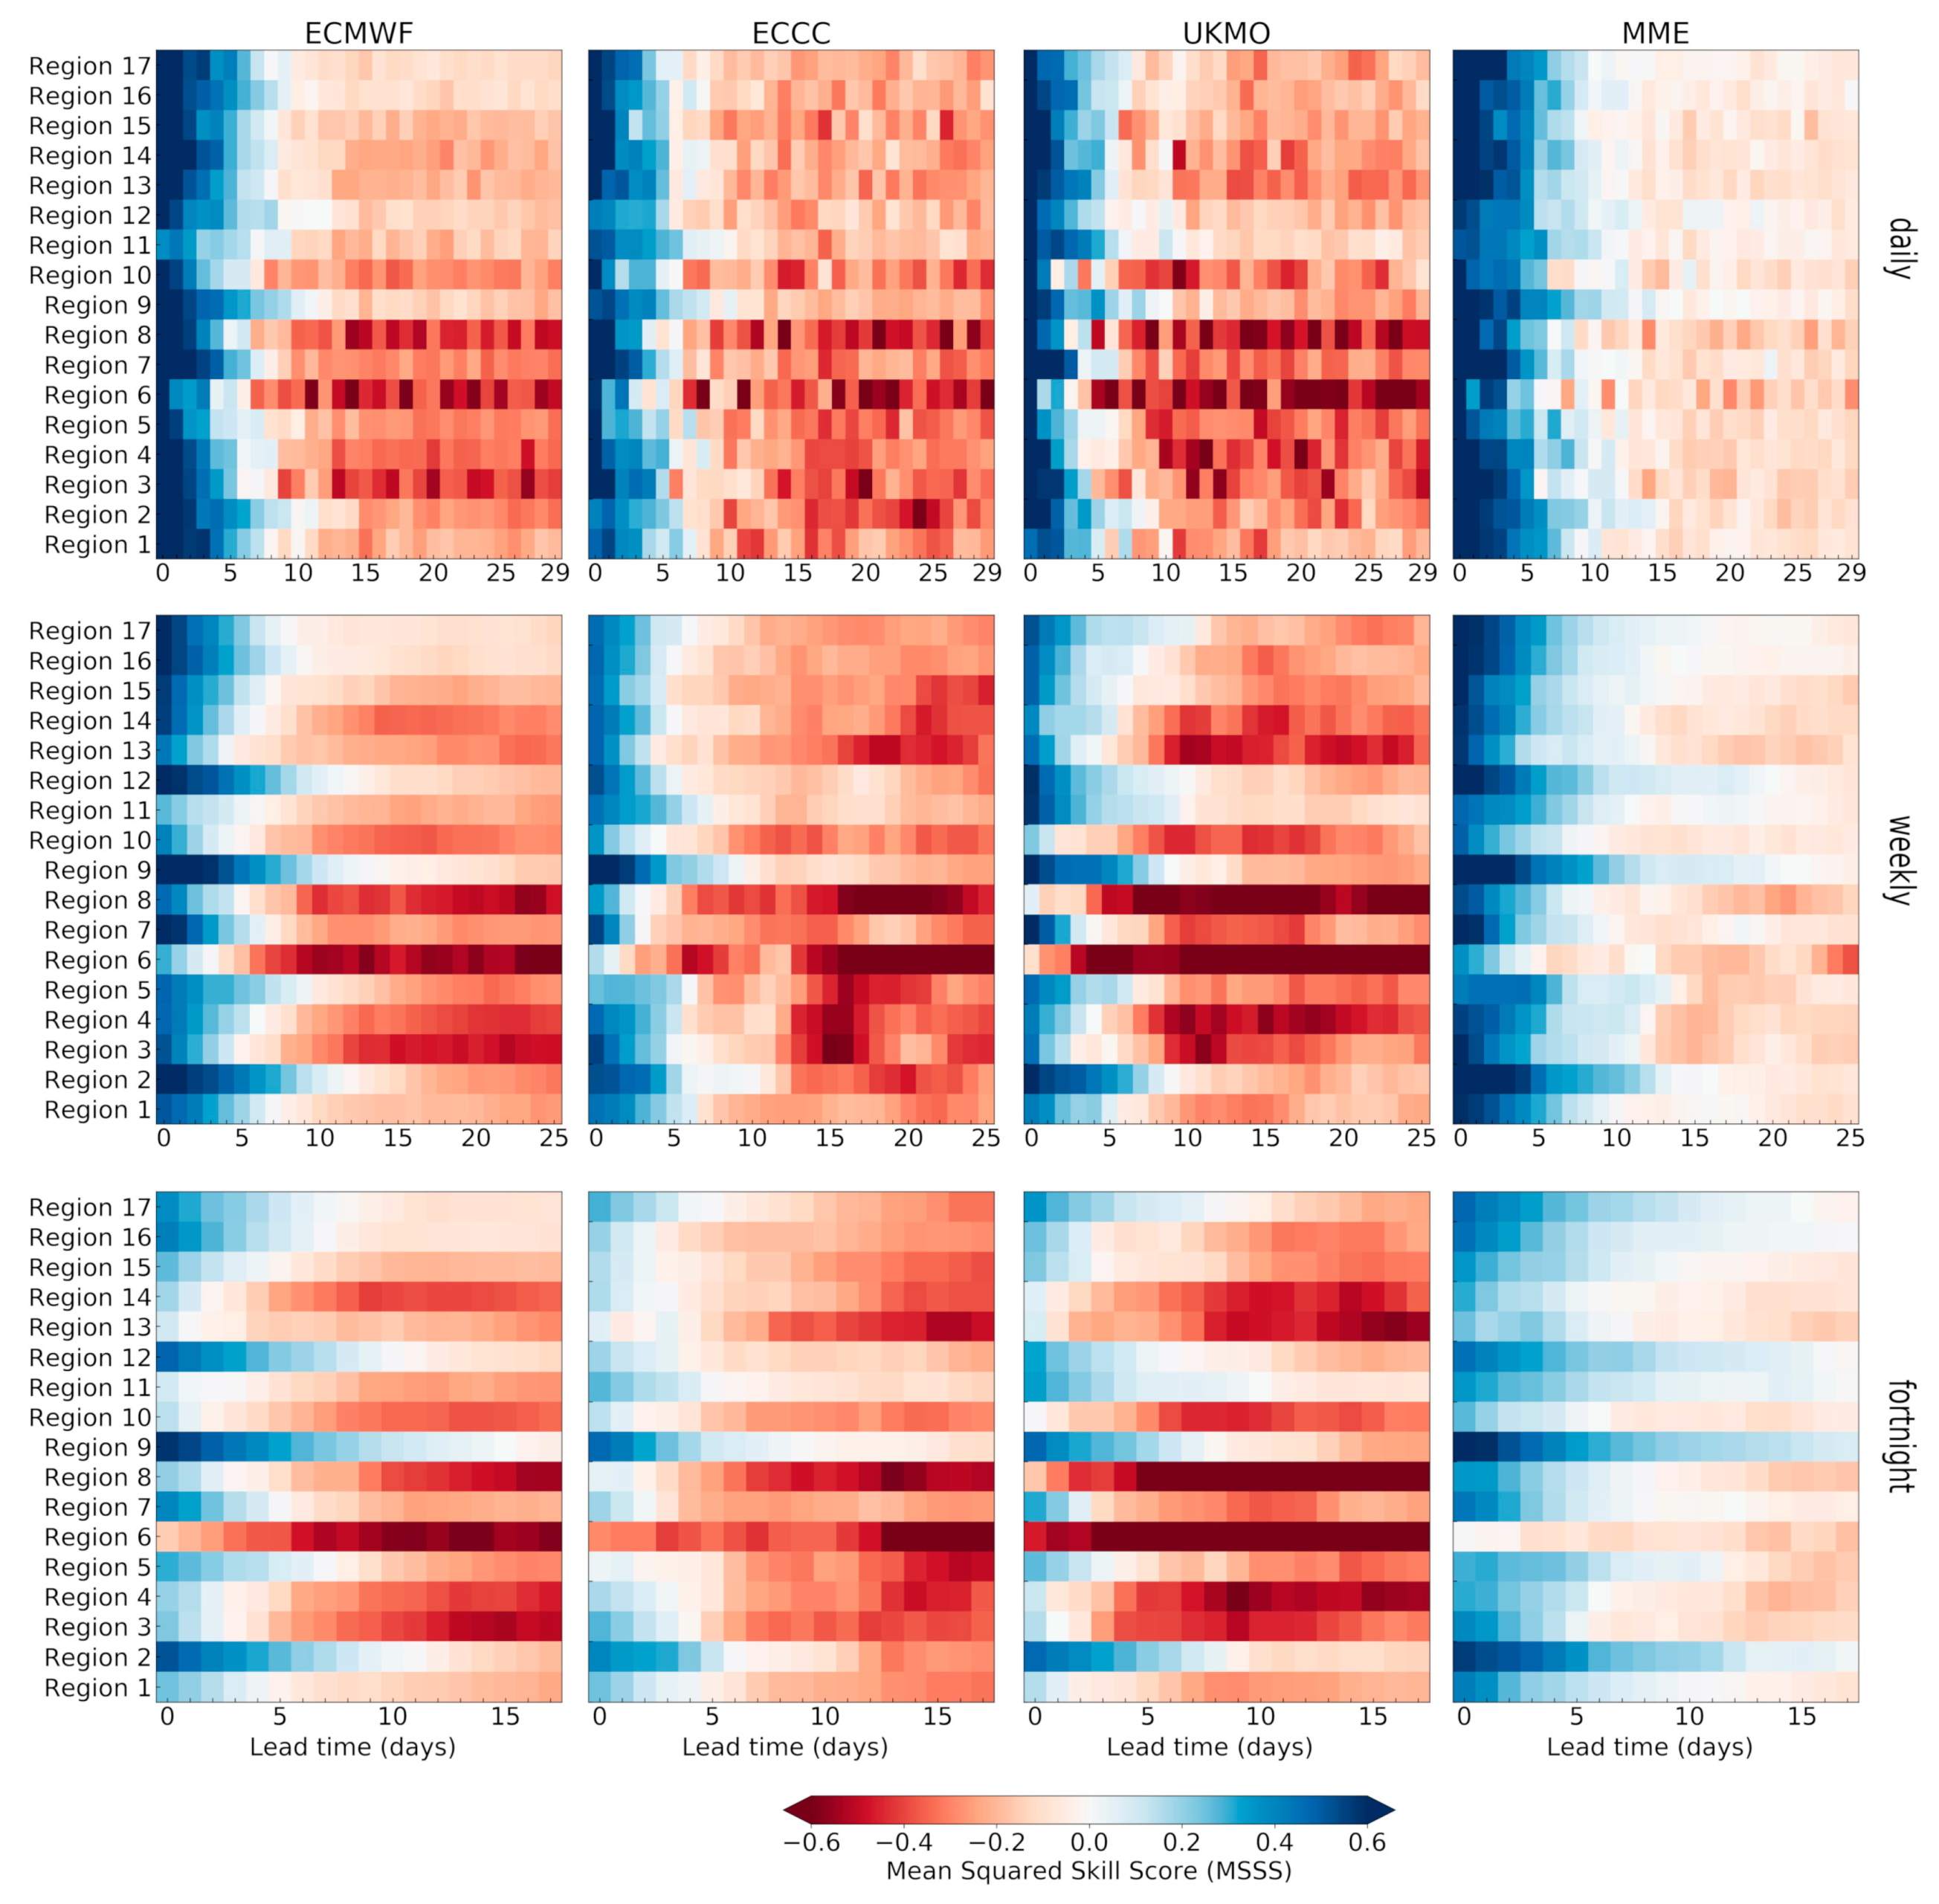
3.1. Deterministic Evaluation

Figure 3 presents the MSSS of daily precipitation forecasts at different lead times (Day 1, Day 4, Day 7, Day 10, Day 14, Day 21, and Day 28) during the boreal summer monsoon. The MSSS values are generally high when the lead time is within 1 week. Meanwhile, the spatial distribution of the MSSS shows similarity among the ECMWF model, the ECCC model, and the UKMO model. The highest forecast skills reside in southeastern and northern China, while large negative skill scores are found in western China. The forecast skills decrease rapidly as lead time increases, as the MSSS of most grid cells falls below zero when the lead time is beyond 1 week. Nevertheless, the ECMWF model and the UKMO model show relatively higher skills in northern, southeastern, and southwestern China. Multimodel ensembling helps to improve daily precipitation forecast skills at all lead times. Large negative skill scores are removed compared to the ECMWF model and the ECCC model, especially over Inner Mongolia (Region 3).
Figure 4 displays the MSSS of week 1, week 2, week 3, week 4, week 1–2, and week 3–4 precipitation forecasts during the boreal summer monsoon. Highest forecast skills are found in week 1, where most MSSS values are greater than 0.4 over southeastern, northern, and southwestern China. During week 2, negative MSSS values are found over most parts of China except southwestern China for the ECMWF model, the ECCC model, and the UKMO model. The multimodel ensembling shows higher forecast skills compared to the ECMWF model and the ECCC model as well. Positive MSSS values are found in southeastern, northern, and southwestern China for the MME week 2 forecasts, but with a much lower magnitude compared to week 1. The week 1–2 forecasts are also found to be skillful over these regions, and the MSSS values are higher than week 2 forecasts alone. Little skill can be found when the lead time is beyond 2 weeks. Negative MSSS values are found almost everywhere for week 3, week 4, and week 3–4 precipitation forecasts.
The MSSS values of daily, weekly, and fortnight precipitation forecasts at the grid scale are compared in Figure 5 (outliers are not shown for clarity). Nearly 90% of grid cells have negative MSSS values when the lead time is beyond 10 days for daily precipitation forecasts, and the multimodel ensembling has the highest forecast skills compared to the ECMWF, ECCC, and UKMO. The forecast skills are improved after temporal aggregation. For example, the MSSS values of weekly precipitation forecasts range from nearly −0.4 to 0.25 when the lead time is 10 days for multimodel ensembling forecasts, while that of the daily forecasts range from nearly −0.4 to 0.1. However, we should also note that the effect of temporal aggregation is limited at longer lead times. The MSSS values of most grid cells fall below zero when the lead time is beyond 14 days for both weekly and fortnight forecasts.
In Figure 6, the MSSS of precipitation forecasts at the regional scale is presented. The results suggest that the forecast skills of precipitation forecasts at the regional scale are higher than that of the grid scale, especially at higher temporal aggregation levels. The MSSS values of multimodel ensembling fortnight precipitation forecasts show promising skills over Region 2 (Inland River in northern Tibet), Region 9 (Upper Yangtze River), and Region 12 (Southwest rivers in Yunnan) at longer lead times. This suggests that the spatiotemporal aggregation can help to extract a predictable sub-seasonal signal over China for certain regions.

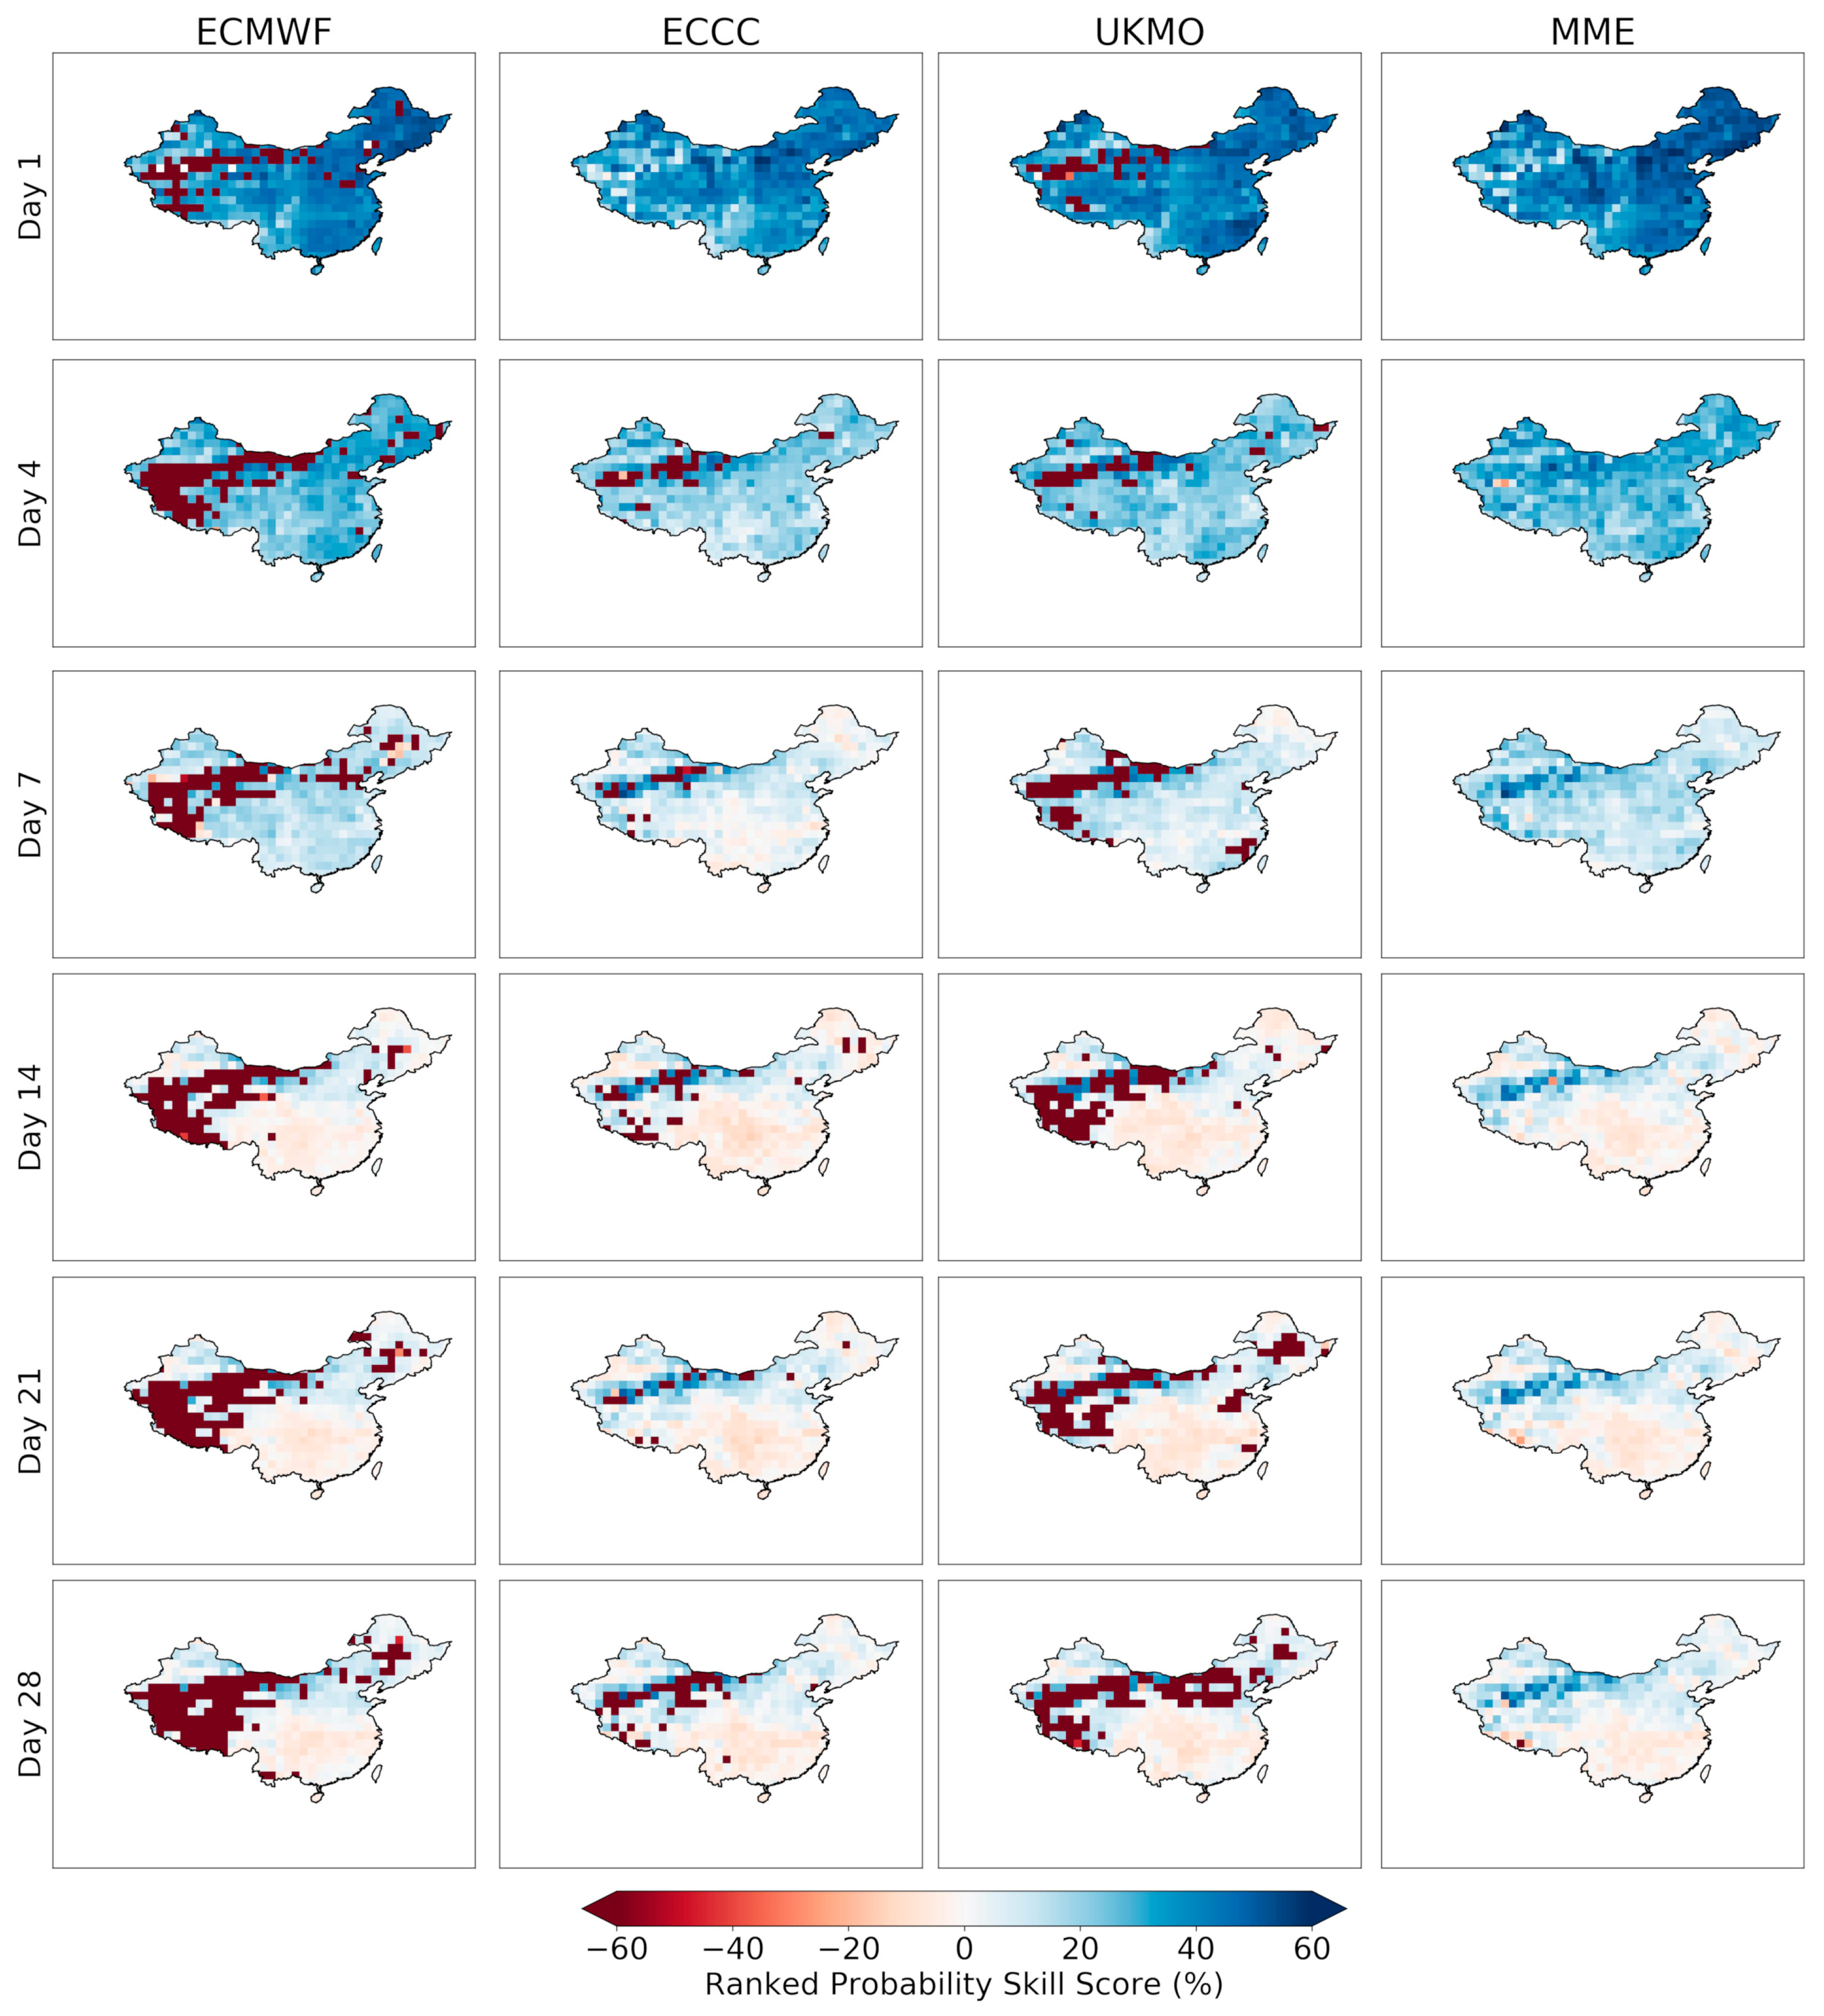
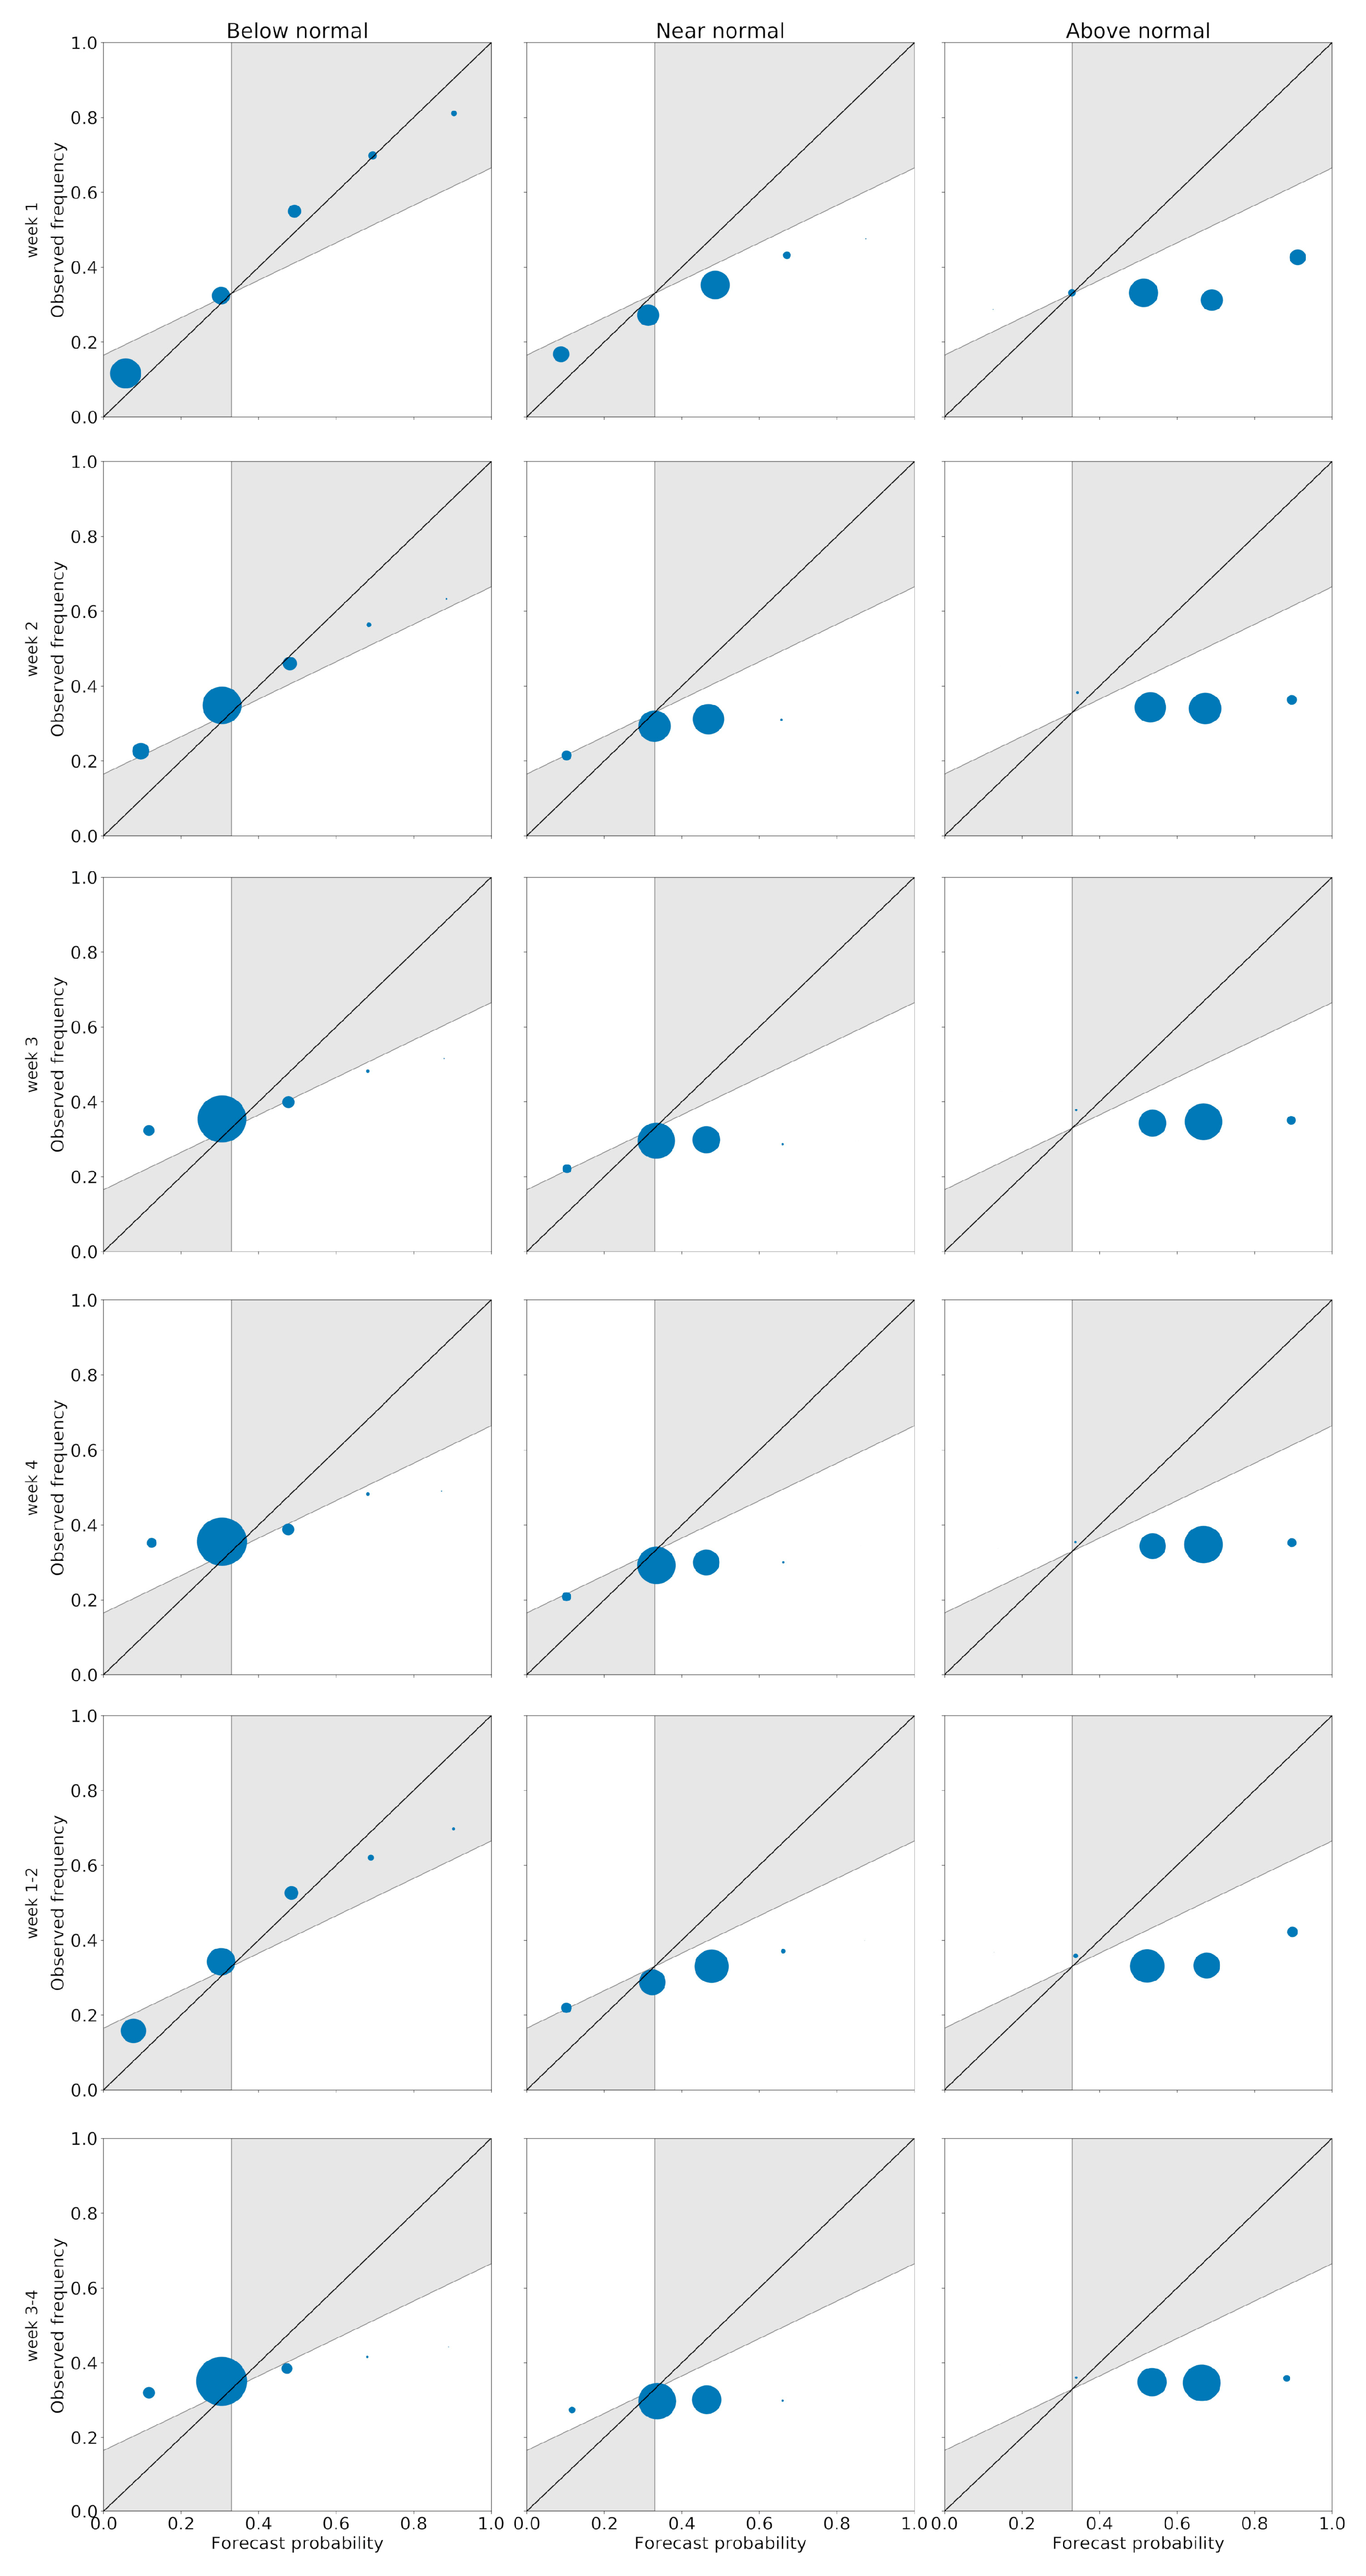
3.2. Probabilistic Evaluation

The ranked probability skill scores (RPSS) of daily precipitation forecasts are given in Figure 7. The ECMWF, ECCC, and UKMO models show high forecast skills over most regions of China when the lead time is within 4 days, except in some extremely dry areas. Multimodel ensembling has greatly reduced large negative RPSS values over these dry regions. The probabilistic forecast skills decrease fast at longer lead times as well. Positive RPSS values are only found over the Hai River (Region 6), the Liao River (Region 8), the Songhua River (Region 7), Inner Mongolia (Region 3), and the Inland rivers in Xinjiang (Region 1) when the lead time is beyond 7 days.
The RPSS values of week 1, week 2, week 3, week 4, week 1–2, and week 3–4 precipitation forecasts are presented in Figure 8. The ECMWF, ECCC, UKMO, and MME forecasts show high skills during week 1. During week 2, the ECMWF and UKMO model outperforms the ECCC model, and positive RPSS values are found over southeastern and western China. The RPSS values of week 1–2 forecasts are similar to those of week 1 forecasts, where positive RPSS values are found almost everywhere over China. When the lead time is beyond 2 weeks, low skills can be found over almost all regions in China during the boreal summer monsoon.
Figure 9 compares the RPSS of probabilistic precipitation forecasts at different temporal scales over China. Similar to the results of MSSS, the probabilistic forecasts are found to be skilful when the lead time is within 10 days. The multimodel ensembling also helps to improve probabilistic forecast skills. However, we should note that the temporal aggregation may have a limited effect on probabilistic forecast skills. The RPSS of daily precipitation forecasts mostly ranges from −15% to 15% when the lead time is beyond 10 days. However, the RPSS values of weekly and fortnight forecasts are always below zero at the same lead time.
The RPSS values of probabilistic precipitation forecasts at the regional scale are shown in Figure 10. Skilful daily probabilistic precipitation forecasts are found over Region 2 (Inland rivers in Xinjiang), Region 5 (Upper Yellow River), Region 7 (Songhua River), Region 9 (Upper Yangtze River), Region 12 (Southwest rivers in Yunnan), and Region 13 (Yangtze River) when the lead time is shorter than 10 days. The RPSS values of weekly precipitation forecasts are higher than those of the daily forecasts over Region 2 (Inland rivers in Xinjiang) and Region 9 (Upper Yangtze River) at the same lead time. However, the RPSS values of weekly forecasts are lower than those of the daily forecasts in other regions. In addition, the RPSS values of fortnight forecasts are lower than both the daily forecasts and weekly forecasts. This suggests that the spatiotemporal aggregation can work both as a benefit and as a disadvantage for probabilistic forecasts.
The reliability of probabilistic forecasts at the grid scale is presented in Figure 11 and Figure 12 by pooling all grid points together. The multimodel ensembling shows high reliability and sharpness for below-normal category forecasts, especially when the lead time is within 2 weeks. The probabilistic forecasts show lower reliability for near-normal and above-normal categories. Similar results are also found for the ECMWF, ECCC, and UKMO forecasts at regional scale (not shown).

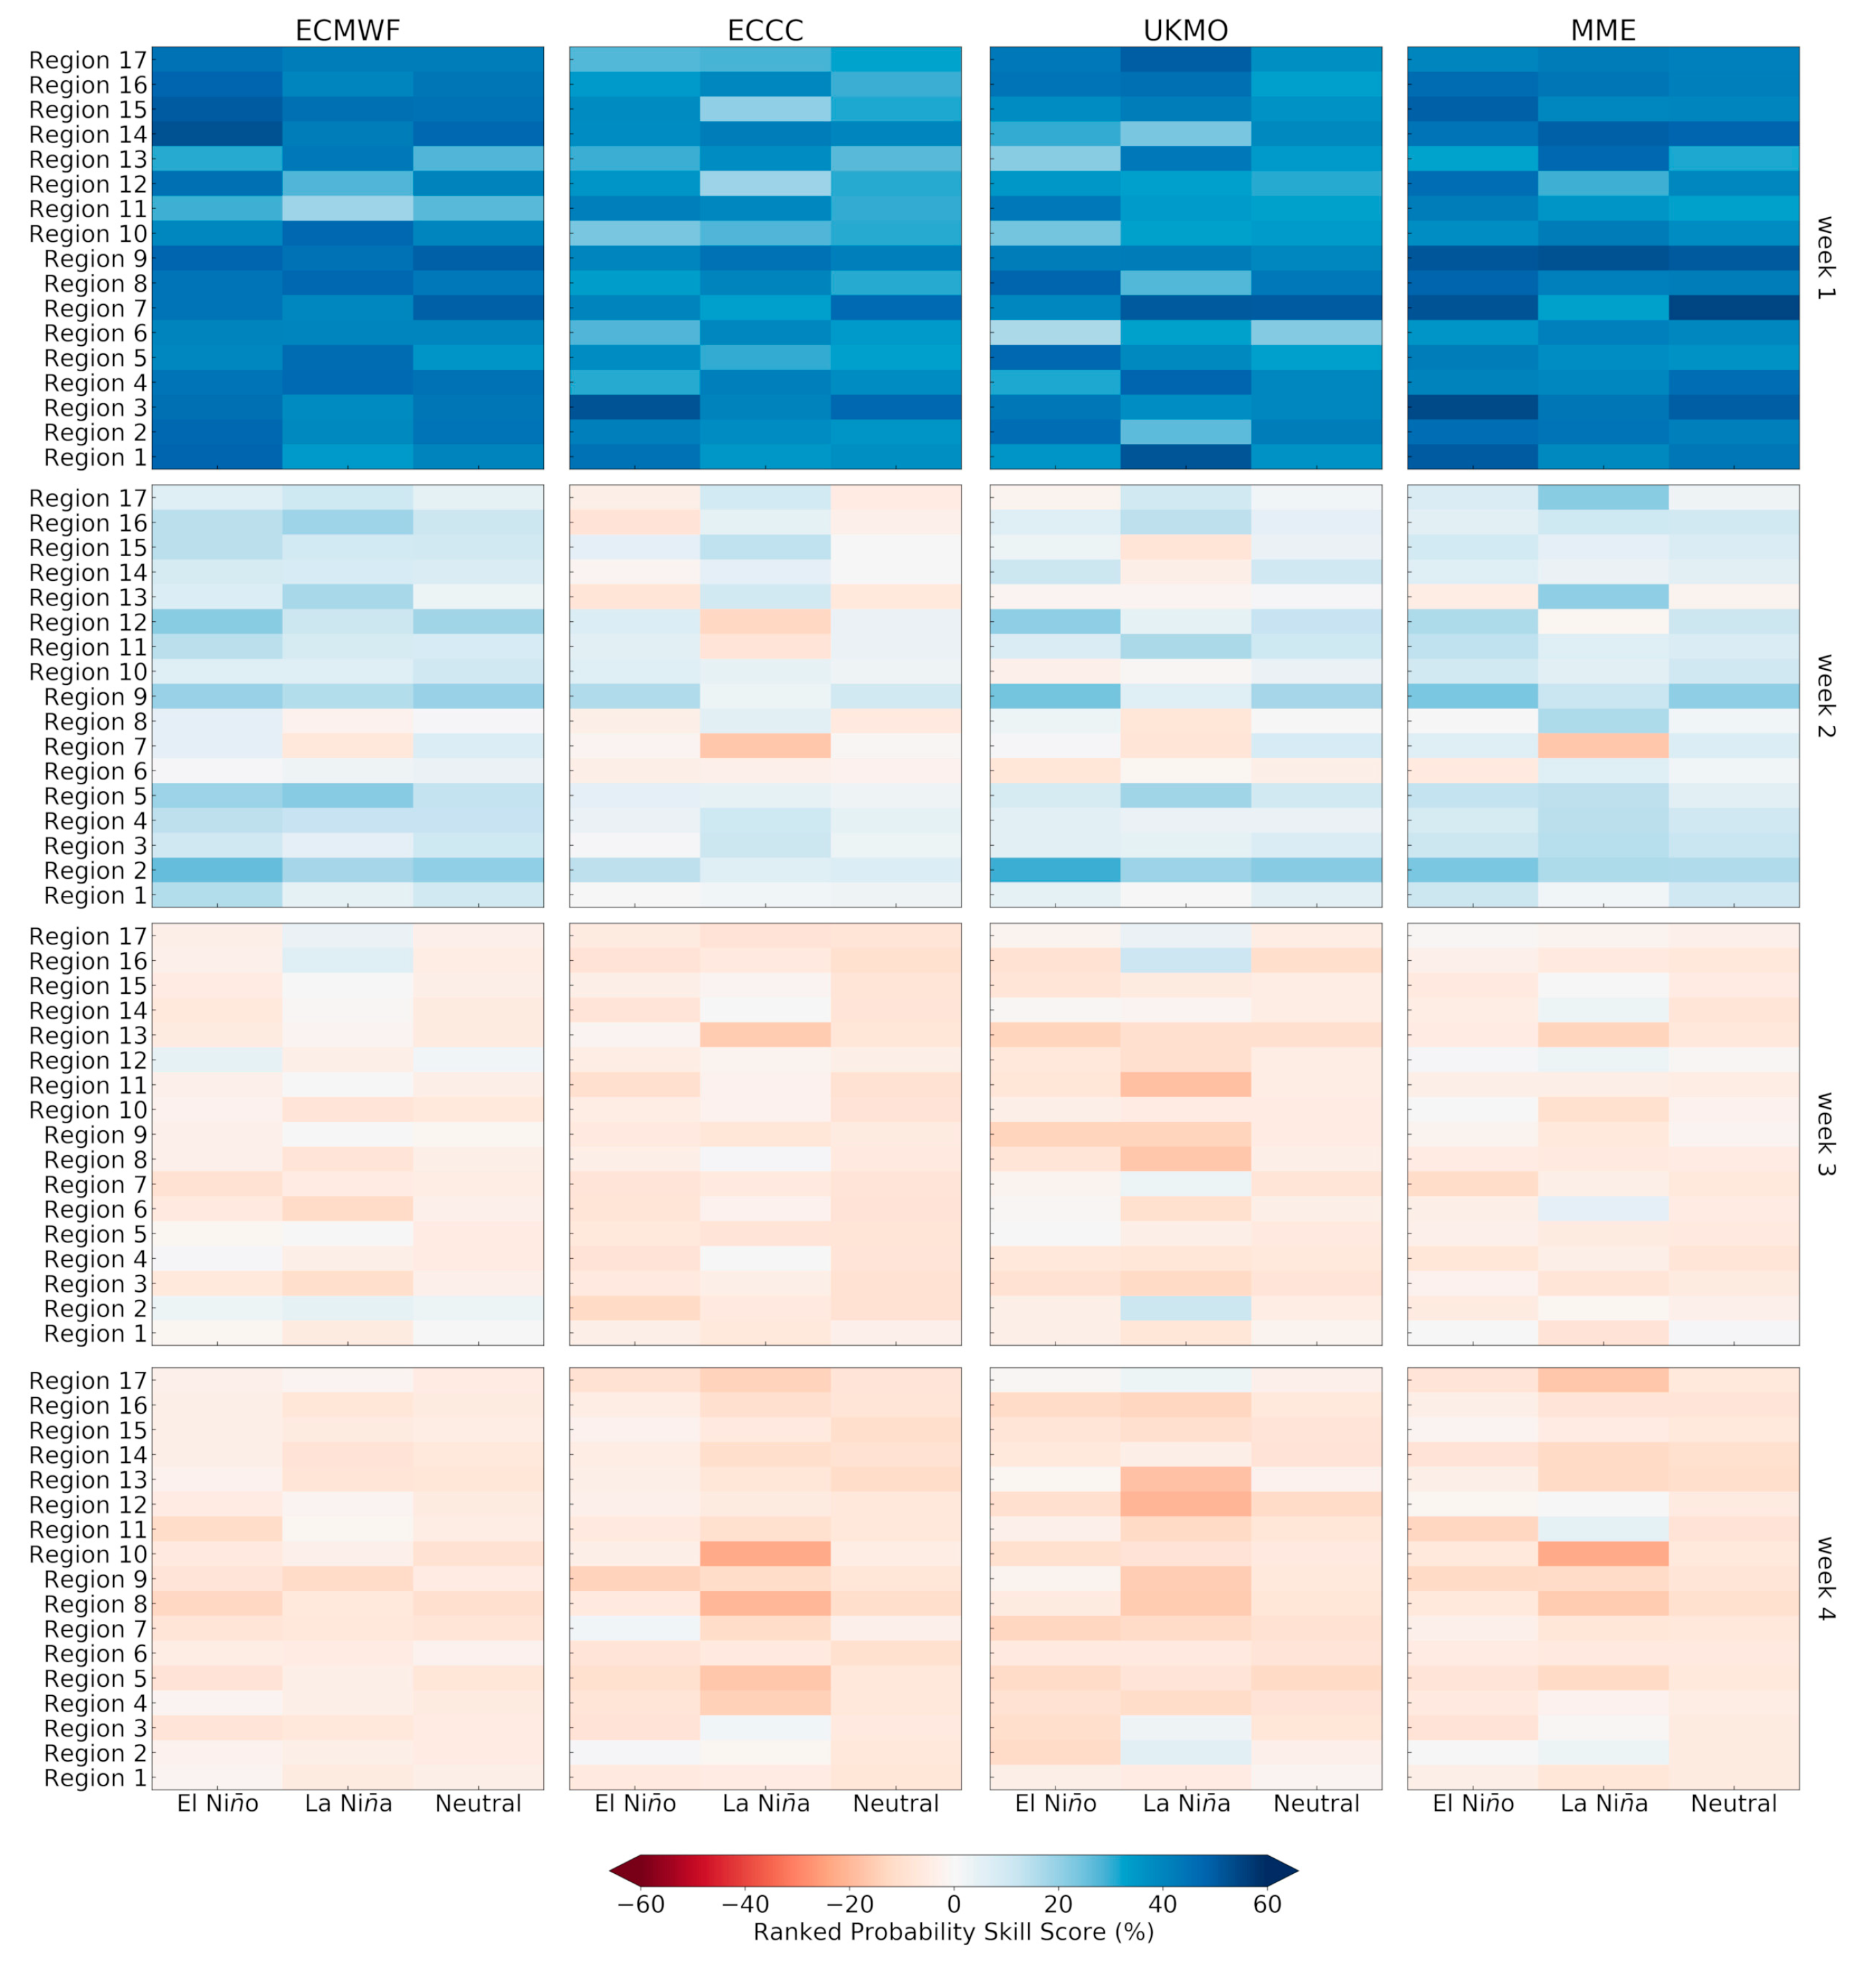
3.3. The Impact of ENSO and MJO on Sub-Seasonal Predictability

The above results suggest that the sub-seasonal precipitation forecast skills are mostly found in the first week. The forecast skills decrease quickly when the lead time is beyond 1 week. In this section, we explore the impact of ENSO and MJO on sub-seasonal precipitation variability and the forecast skills over China.
Figure 13 presents the composites of weekly precipitation anomalies (mm) in each of the ENSO and MJO phases during the boreal summer monsoon. It is clear that the precipitation anomalies change under different ENSO conditions. Compared to ENSO, the MJO has a greater impact on sub-seasonal precipitation variability, especially in southern China. However, the weekly precipitation anomalies experience different precipitation variations over different regions in certain MJO phases. The weekly precipitation is significantly enhanced over Region 9 (Upper Yangtze River), Region 13 (Yangtze River), and Region 16 (Pearl River) during phase 3, and significantly suppressed over Region 11 (Southwest rivers in southern Tibet), Region 15 (Lower Yangtze River), and Region 16 (Pearl River) during phase 5. The weekly precipitation anomalies of Region 12 (Southwest Rivers in Yunnan) and Region 13 (Yangtze River) are significantly suppressed during phase 8. These results show consistent characteristics with Xavier, et al. [47], in which phases 2~4 produced significantly increased precipitation and phases 6~8 produced significantly decreased precipitation over southeast Asia.
Figure 14 and Figure 15 compare the RPSS values of week 1, week 2, week 3, and week 4 precipitation forecasts in each of the ENSO and MJO phases during the boreal summer monsoon. The forecast skills are enhanced over Region 2 (Inland rivers in northern Tibet), Region 9 (Upper Yangtze River), and Region 12 (Southeast rivers in Yunnan) during the El Niño or La Niña phase compared to the neutral phase, especially at longer lead times. The RPSS values of week 4 forecasts are below 0% over most regions during the neutral phase for the ECMWF, ECCC, UKMO, and MME forecasts. In contrast, positive RPSS scores are observed over Region 2 (Inland Rivers in northern Tibet) and Region 3 (Inland Rivers in Inner Mongolia) for the ECCC, UKMO, and MME forecasts and Region 11 (Southwest Rivers in southern Tibet) and Region 12 (Southeast rivers in Yunnan) for the MME forecasts. The enhancement is more pronounced during active MJO phases. The RPSS of week 2 forecasts is lower than 10% over most regions during the weak MJO phase for the ECMWF, ECCC, UKMO, and MME forecasts. In contrast, the RPSS has been greatly improved during active MJO phases, especially in phases 7~8 for the ECCC, UKMO, and MME forecasts. The RPSS values of week 3 and week 4 forecasts are negative over all regions and all models during the weak MJO phase. On the contrary, positive RPSS values are also found over Region 2 (Inland rivers in northern Tibet), Region 9 (Upper Yangtze River), Region 14 (Middle Yangtze River), and Region 15 (Lower Yangtze River) for week 3 and week 4 MME forecasts.

4. Discussion

In this study, we evaluate the sub-seasonal precipitation forecast skills at various spatiotemporal scales over China during the boreal summer monsoon. The results suggest that skilful sub-seasonal precipitation forecasts are only found when the lead time is within 1 week. The forecast skills decrease rapidly when the lead time is beyond 1 week for both deterministic and probabilistic forecasts. Positive skill scores are only found over southeastern and southwestern China. These results show similar characteristics as de Andrade, Coelho and Cavalcanti [4], where the week 3 and week 4 deterministic forecast skills are low in extratropical regions. This is probably due to both large climatic noises and the limited intraseasonal oscillation (ISO) signal of precipitation during the summer monsoon [48,49]. The precipitation amount is higher in southeastern China owing to the impact of the East Asia Summer Monsoon (EASM). The relatively higher forecast skills in these regions may be due to the reasonable prediction of the intraseasonal oscillation of the EASM despite some systematic errors [14]. The relatively lower coefficient of variation of daily precipitation in southwestern China shown in Figure 2 suggests that the predictability of precipitation is higher compared to other regions. Although limited precipitation is observed in northwestern China, the high coefficient of variation suggests that the precipitation is highly non-uniformly distributed during the boreal summer monsoon. Although the GCMs are able to simulate the amount of precipitation in these arid regions, the variability is always highly underestimated in the GCMs. This may partly explain the relatively lower forecast skills in these regions. In comparison, the amount of precipitation over Regions 6, 7, and 8 is higher than northwestern China. Meanwhile, the coefficient of variation is lower in comparison. However, the interactions between tropical monsoon variability and high latitude circulation systems are more difficult to simulate in the GCMs. This is probably the main reason for the lower predictive skills in northeastern China.
We should also note that the ECMWF and UKMO models outperform the ECCC model for sub-seasonal precipitation forecasts. This result indicates that the ECMWF and UKMO models may benefit from being coupled with ocean models [50]. Compared to the ECMWF and ECCC models, the multimodel ensembling helps to greatly reduce the large negative skill scores over Inner Mongolia. Similar results were also found by Vigaud, Robertson and Tippett [31]. However, the number of GCM models used for multimodel ensembling in this study is limited as different GCMs always have different start dates and forecast frequency. When the GCMs are produced in a more harmonized way, the sub-seasonal precipitation forecast skills may be further improved with a larger number of GCMs.
The extended logistic regression (ELR) model is used in this study to generate tercile-based probabilistic forecasts. The results suggest that the ELR model can produce skillful probabilistic forecasts when the lead time is within 1 week. Meanwhile, the ELR-based probabilistic forecasts show high reliability for below-normal category forecasts. However, the parametric uncertainty of the ELR model is not considered in this study. In the future, several Bayes’ theorem-based post-processing methods could be applied to take this into consideration. For example, the Bayesian Joint Probability (BJP) method has been used to generate skilful and reliable precipitation forecasts from GCMs [33,51]. Meanwhile, the prediction of extreme weather or climate events at sub-seasonal time scales should also be considered. Compared to tercile-based categorical events, extreme weather or climate events are rarer and usually have significant socioeconomic impacts [52,53]. Lavaysse, et al. [54] suggested that 40% of the meteorological droughts could be detected 1 month ahead by using GCM sub-seasonal precipitation forecasts. However, more work is needed to estimate the sub-seasonal predictability of other types of extreme events, such as tropical cyclones, flooding, and tornadoes [55].
The sub-seasonal precipitation forecast skills are improved at larger spatial scales or longer temporal scales when the lead time is within 1 week. However, spatiotemporal aggregation has a limited effect on forecast skills at longer lead times. The forecast skills increase only in regions where the predictable low frequency signals remain. This is consistent with the findings of van Straaten, Whan, Coumou, van den Hurk and Schmeits [27], which suggests that the spatiotemporal aggregation should be limited in certain cases.
We also analyze the impact of ENSO and MJO on weekly precipitation variability and forecast skills over China. The results suggest that the sub-seasonal precipitation forecast skills are improved during active ENSO or MJO phases. However, the improvement varies at different ENSO and MJO phases. Although the MJO significantly reduced the weekly precipitation over Region 15 (Lower Yangtze River) and Region 16 (Pearl River) during phase 5, the forecast skills of weekly precipitation were not improved significantly. This suggests that the tropical–extratropical interactions are not well simulated under such conditions. Meanwhile, the impact of other large-scale circulations, such as Arctic Oscillation, North Atlantic Oscillation (NAO), and Pacific-North American (PNA), should also be considered. Wang and Robertson [56] suggested that the seasonal variability of the Arctic Oscillation (AO) contributes to higher skills in week 3–4 precipitation forecasts.

5. Conclusions

Sub-seasonal precipitation forecasts during the boreal summer monsoon season are valuable for both flood and drought disaster mitigations over China. In this study, we evaluate both deterministic and probabilistic sub-seasonal precipitation forecast skills at various spatiotemporal scales over China. Possible sources of predictability are also investigated by analyzing the impact of ENSO and MJO on sub-seasonal precipitation variability and forecast skills.
The sub-seasonal daily precipitation forecasts are skillful and reliable when the lead time is within 1 week for both deterministic and probabilistic forecasts. The forecast skills decrease rapidly when the lead time is beyond 1 week. Positive skill scores are only found over southeastern and southwestern China. The multimodel ensembling helps to improve deterministic forecast skills. Large negative skill scores are removed when the multimodel ensembling strategy is used, especially over northwestern China. The forecast skills are also improved at larger spatial scales or longer temporal scales. However, the improvement is only observed for certain regions when the lead time is within 10–14 days. When the lead time is beyond 2 weeks, the spatiotemporal aggregation has a limited effect on forecast skills.
The composite analysis of weekly precipitation anomalies suggests that both the ENSO and MJO have an impact on precipitation variability over China. However, the influence of ENSO and MJO varies at different phases. The weekly precipitation is significantly enhanced over southeastern China during MJO phases 1~3, while the precipitation is suppressed during MJO phases 4~5. The forecast skills are found to be enhanced during active ENSO and MJO phases, and the enhancement is more pronounced during active MJO phases. However, the enhancement is not always consistent with the above composite analysis. This suggests that the tropical–extratropical interactions are not well simulated under such conditions.
Although a clear benefit of multimodel ensembling is observed for sub-seasonal precipitation forecasts, the number of GCMs used in this study is limited as these models have different start dates and forecast frequency. The sub-seasonal precipitation forecast skills could be further improved with a larger number of GCMs when the models are produced in a more harmonized way in the future. In addition, the combined effect of ENSO and MJO on sub-seasonal precipitation forecasts has not been considered yet. A more detailed assessment should be conducted to improve the understandings of sub-seasonal predictability in the future.

Author Contributions

Conceptualization, Y.L.; methodology, Y.L.; validation, Y.L., Z.W. and H.H.; formal analysis, Y.L.; writing—original draft preparation, Y.L.; writing—review and editing, Z.W.; supervision, G.L.; project administration, G.L.; funding acquisition, G.L. All authors have read and agreed to the published version of the manuscript.

Funding

This work was funded by the National Natural Science Foundation of China (Grant number 52009027, 51779071), the National Key R&D Program of China (Grants 2018YFC0407701, 2017YFC1502403), the China Postdoctoral Science Foundation (Grant 2020M671321), and the Postdoctoral Science Foundation of Jiangsu Province (Grant 2020Z286).

Data Availability Statement

The S2S Database used in this study can be derived from the European Centre for Medium-Range Weather Forecasts (ECMWF; http://apps.ecmwf.int/datasets/data/s2s/, last accessed on 30 January 2021) and the China Meteorological Administration (CMA; http://s2s.cma.cn/, last accessed on 30 January 2021). The MSWEP V2 dataset can be derived from http://gloh2o.org/, last accessed on 8 March 2019. The ERA5 reanalysis dataset can be derived from https://climate.copernicus.eu/, last accessed on 14 April 2021, the OISST.v2.1 dataset can be derived from https://www.ncei.noaa.gov/data/sea-surface-temperature-optimum-interpolation/v2.1/access/avhrr/, last accessed on 14 April 2021, and the daily outgoing longwave radiation (OLR) dataset can be derived from https://www.ncei.noaa.gov/data/outgoing-longwave-radiation-daily/access/, last accessed on 14 April 2021.

Conflicts of Interest

The authors declare no conflict of interest.

References

  1. Vitart, F.; Ardilouze, C.; Bonet, A.; Brookshaw, A.; Chen, M.; Codorean, C.; Déqué, M.; Ferranti, L.; Fucile, E.; Fuentes, M. The subseasonal to seasonal (S2S) prediction project database. Bull. Am. Meteorol. Soc. 2017, 98, 163–173. [Google Scholar] [CrossRef]
  2. Vitart, F.; Robertson, A.W. The sub-seasonal to seasonal prediction project (S2S) and the prediction of extreme events. Npj Clim. Atmos. Sci. 2018, 1, 3. [Google Scholar] [CrossRef] [Green Version]
  3. Vitart, F.; Robertson, A.W.; Anderson, D.L. Subseasonal to Seasonal Prediction Project: Bridging the gap between weather and climate. Bull. World Meteorol. Organ. 2012, 61, 23. [Google Scholar]
  4. de Andrade, F.M.; Coelho, C.A.; Cavalcanti, I.F. Global precipitation hindcast quality assessment of the Subseasonal to Seasonal (S2S) prediction project models. Clim. Dyn. 2018, 1–25. [Google Scholar] [CrossRef]
  5. Vitart, F. Evolution of ECMWF sub-seasonal forecast skill scores. Q. J. R. Meteorol. Soc. 2014, 140, 1889–1899. [Google Scholar] [CrossRef]
  6. Miura, H.; Satoh, M.; Nasuno, T.; Noda, A.T.; Oouchi, K. A Madden-Julian oscillation event realistically simulated by a global cloud-resolving model. Science 2007, 318, 1763–1765. [Google Scholar] [CrossRef] [Green Version]
  7. Vitart, F. Madden—Julian oscillation prediction and teleconnections in the S2S database. Q. J. R. Meteorol. Soc. 2017, 143, 2210–2220. [Google Scholar] [CrossRef]
  8. Baldwin, M.P.; Stephenson, D.B.; Thompson, D.W.J.; Dunkerton, T.J.; Charlton, A.J.; O’Neill, A. Stratospheric Memory and Skill of Extended-Range Weather Forecasts. Science 2003, 301, 636–640. [Google Scholar] [CrossRef]
  9. Domeisen, D.I.; Butler, A.H.; Charlton-Perez, A.J.; Ayarzagüena, B.; Baldwin, M.P.; Dunn-Sigouin, E.; Furtado, J.C.; Garfinkel, C.I.; Hitchcock, P.; Karpechko, A.Y. The role of the stratosphere in subseasonal to seasonal prediction: 2. Predictability arising from stratosphere-troposphere coupling. J. Geophys. Res. Atmos. 2020, 125, e2019JD030923. [Google Scholar] [CrossRef]
  10. Prodhomme, C.; Doblas-Reyes, F.; Bellprat, O.; Dutra, E. Impact of land-surface initialization on sub-seasonal to seasonal forecasts over Europe. Clim. Dyn. 2016, 47, 919–935. [Google Scholar] [CrossRef]
  11. Zhao, M.; Zhang, H.; Dharssi, I. On the soil moisture memory and influence on coupled seasonal forecasts over Australia. Clim. Dyn. 2019, 52, 7085–7109. [Google Scholar] [CrossRef]
  12. Thomas, J.A.; Berg, A.A.; Merryfield, W. Influence of snow and soil moisture initialization on sub-seasonal predictability and forecast skill in boreal spring. Clim. Dyn. 2016, 47, 49–65. [Google Scholar] [CrossRef]
  13. Orsolini, Y.; Senan, R.; Balsamo, G.; Doblas-Reyes, F.; Vitart, F.; Weisheimer, A.; Carrasco, A.; Benestad, R. Impact of snow initialization on sub-seasonal forecasts. Clim. Dyn. 2013, 41, 1969–1982. [Google Scholar] [CrossRef]
  14. Liang, P.; Lin, H. Sub-seasonal prediction over East Asia during boreal summer using the ECCC monthly forecasting system. Clim. Dyn. 2018, 50, 1007–1022. [Google Scholar] [CrossRef]
  15. Saravanan, R.; Chang, P. Midlatitude mesoscale ocean-atmosphere interaction and its relevance to S2S prediction. In Sub-Seasonal to Seasonal Prediction; Elsevier: Amsterdam, The Netherlands, 2019; pp. 183–200. [Google Scholar]
  16. Tian, D.; Wood, E.F.; Yuan, X. CFSv2-based sub-seasonal precipitation and temperature forecast skill over the contiguous United States. Hydrol. Earth Syst. Sci. 2017, 21, 1477–1490. [Google Scholar] [CrossRef] [Green Version]
  17. Gong, X.; Barnston, A.G.; Ward, M.N. The effect of spatial aggregation on the skill of seasonal precipitation forecasts. J. Clim. 2003, 16, 3059–3071. [Google Scholar] [CrossRef]
  18. Lau, K.M.; Wu, H.T. Detecting trends in tropical rainfall characteristics, 1979–2003. Int. J. Climatol. 2007, 27, 979–988. [Google Scholar] [CrossRef] [Green Version]
  19. Li, S.; Robertson, A.W. Evaluation of submonthly precipitation forecast skill from global ensemble prediction systems. Mon. Weather Rev. 2015, 143, 2871–2889. [Google Scholar] [CrossRef]
  20. Pan, B.; Hsu, K.; AghaKouchak, A.; Sorooshian, S.; Higgins, W. Precipitation Prediction Skill for the West Coast United States: From Short to Extended Range. J. Clim. 2019, 32, 161–182. [Google Scholar] [CrossRef]
  21. Gultepe, I.; Agelin-Chaab, M.; Komar, J.; Elfstrom, G.; Boudala, F.; Zhou, B. A Meteorological Supersite for Aviation and Cold Weather Applications. Pure Appl. Geophys. 2019, 176, 1977–2015. [Google Scholar] [CrossRef]
  22. Gultepe, I.; Sharman, R.; Williams, P.D.; Zhou, B.; Ellrod, G.; Minnis, P.; Trier, S.; Griffin, S.; Yum, S.S.; Gharabaghi, B.; et al. A Review of High Impact Weather for Aviation Meteorology. Pure Appl. Geophys. 2019, 176, 1869–1921. [Google Scholar] [CrossRef]
  23. Kuhn, T.; Gultepe, I. Ice Fog and Light Snow Measurements Using a High-Resolution Camera System. Pure Appl. Geophys. 2016, 173, 3049–3064. [Google Scholar] [CrossRef] [Green Version]
  24. Murali Krishna, U.V.; Das, S.K.; Deshpande, S.M.; Doiphode, S.L.; Pandithurai, G. The assessment of Global Precipitation Measurement estimates over the Indian subcontinent. Earth Space Sci. 2017, 4, 540–553. [Google Scholar] [CrossRef]
  25. Buizza, R.; Leutbecher, M. The forecast skill horizon. Q. J. R. Meteorol. Soc. 2015, 141, 3366–3382. [Google Scholar] [CrossRef]
  26. Vigaud, N.; Tippett, M.K.; Robertson, A.W. Probabilistic Skill of Subseasonal Precipitation Forecasts for the East Africa–West Asia Sector during September–May. Weather Forecast. 2018, 33, 1513–1532. [Google Scholar] [CrossRef]
  27. van Straaten, C.; Whan, K.; Coumou, D.; van den Hurk, B.; Schmeits, M. The influence of aggregation and statistical post-processing on the subseasonal predictability of European temperatures. Q. J. R. Meteorol. Soc. 2020, 146, 2654–2670. [Google Scholar] [CrossRef]
  28. Krishnamurti, T.N.; Kishtawal, C.M.; LaRow, T.E.; Bachiochi, D.R.; Zhang, Z.; Williford, C.E.; Gadgil, S.; Surendran, S. Improved Weather and Seasonal Climate Forecasts from Multimodel Superensemble. Science 1999, 285, 1548. [Google Scholar] [CrossRef] [Green Version]
  29. Krishnamurti, T.N.; Kishtawal, C.M.; Zhang, Z.; LaRow, T.; Bachiochi, D.; Williford, E.; Gadgil, S.; Surendran, S. Multimodel Ensemble Forecasts for Weather and Seasonal Climate. J. Clim. 2000, 13, 4196–4216. [Google Scholar] [CrossRef]
  30. Krishnamurti, T.N.; Kumar, V.; Simon, A.; Bhardwaj, A.; Ghosh, T.; Ross, R. A review of multimodel superensemble forecasting for weather, seasonal climate, and hurricanes. Rev. Geophys. 2016, 54, 336–377. [Google Scholar] [CrossRef]
  31. Vigaud, N.; Robertson, A.; Tippett, M. Multimodel Ensembling of Subseasonal Precipitation Forecasts over North America. Mon. Weather Rev. 2017, 145, 3913–3928. [Google Scholar] [CrossRef]
  32. Wang, Y.; Ren, H.-L.; Zhou, F.; Fu, J.-X.; Chen, Q.-L.; Wu, J.; Jie, W.-H.; Zhang, P.-Q. Multi-Model Ensemble Sub-Seasonal Forecasting of Precipitation over the Maritime Continent in Boreal Summer. Atmosphere 2020, 11, 515. [Google Scholar] [CrossRef]
  33. Schepen, A.; Zhao, T.; Wang, Q.J.; Robertson, D.E. A Bayesian modelling method for post-processing daily sub-seasonal to seasonal rainfall forecasts from global climate models and evaluation for 12 Australian catchments. Hydrol. Earth Syst. Sci. 2018, 22, 1615–1628. [Google Scholar] [CrossRef] [Green Version]
  34. Ding, Y. Summer Monsoon Rainfalls in China. J. Meteorol. Soc. Japan. Ser. II 1992, 70, 373–396. [Google Scholar] [CrossRef] [Green Version]
  35. Yihui, D.; Chan, J.C.L. The East Asian summer monsoon: An overview. Meteorol. Atmos. Phys. 2005, 89, 117–142. [Google Scholar] [CrossRef]
  36. Li, Y.; Wu, Z.; He, H.; Wang, Q.J.; Xu, H.; Lu, G. Post-processing sub-seasonal precipitation forecasts at various spatiotemporal scales across China during boreal summer monsoon. J. Hydrol. 2021, 598, 125742. [Google Scholar] [CrossRef]
  37. Robertson, A.W.; Kumar, A.; Peña, M.; Vitart, F. Improving and promoting subseasonal to seasonal prediction. Bull. Am. Meteorol. Soc. 2015, 96, ES49–ES53. [Google Scholar] [CrossRef]
  38. Sun, Q.; Miao, C.; Duan, Q.; Ashouri, H.; Sorooshian, S.; Hsu, K.L. A review of global precipitation data sets: Data sources, estimation, and intercomparisons. Rev. Geophys. 2018, 56, 79–107. [Google Scholar] [CrossRef] [Green Version]
  39. Xie, P.; Arkin, P.A. Global precipitation: A 17-year monthly analysis based on gauge observations, satellite estimates, and numerical model outputs. Bull. Am. Meteorol. Soc. 1997, 78, 2539–2558. [Google Scholar] [CrossRef]
  40. Beck, H.E.; Wood, E.F.; Pan, M.; Fisher, C.K.; Miralles, D.G.; van Dijk, A.I.; McVicar, T.R.; Adler, R.F. MSWEP V2 global 3-hourly 0.1 precipitation: Methodology and quantitative assessment. Bull. Am. Meteorol. Soc. 2019, 100, 473–500. [Google Scholar] [CrossRef] [Green Version]
  41. Wu, Z.; Xu, Z.; Fang, W.; Hai, H.; Zhou, J.; Wu, X.; Liu, Z. Hydrologic Evaluation of Multi-Source Satellite Precipitation Products for the Upper Huaihe River Basin, China. Remote. Sens. 2018, 10, 840. [Google Scholar] [CrossRef] [Green Version]
  42. Xu, Z.; Wu, Z.; He, H.; Wu, X.; Guo, X. Evaluating the accuracy of MSWEP V2.1 and its performance for drought monitoring over mainland China. Atmos. Res. 2019, 226. [Google Scholar] [CrossRef]
  43. Murphy, A.H. Skill Scores Based on the Mean Square Error and Their Relationships to the Correlation Coefficient. Mon. Weather Rev. 1988, 116, 2417–2424. [Google Scholar] [CrossRef]
  44. Tippett, M.; Barnston, A.; Robertson, A. Estimation of Seasonal Precipitation Tercile-Based Categorical Probabilities from Ensembles. J. Clim. 2007, 20, 2210–2228. [Google Scholar] [CrossRef] [Green Version]
  45. Hsu, W.-R.; Murphy, A.H. The attributes diagram A geometrical framework for assessing the quality of probability forecasts. Int. J. Forecast. 1986, 2, 285–293. [Google Scholar] [CrossRef]
  46. Peng, Z.; Wang, Q.; Bennett, J.C.; Pokhrel, P.; Wang, Z. Seasonal precipitation forecasts over China using monthly large-scale oceanic-atmospheric indices. J. Hydrol. 2014, 519, 792–802. [Google Scholar] [CrossRef]
  47. Xavier, P.; Rahmat, R.; Cheong, W.K.; Wallace, E. Influence of Madden-Julian Oscillation on Southeast Asia rainfall extremes: Observations and predictability. Geophys. Res. Lett. 2014, 41, 4406–4412. [Google Scholar] [CrossRef]
  48. Ouyang, R.; Liu, W.; Fu, G.; Liu, C.; Hu, L.; Wang, H. Linkages between ENSO/PDO signals and precipitation, streamflow in China during the last 100 years. Hydrol. Earth Syst. Sci. 2014, 18, 3651–3661. [Google Scholar] [CrossRef] [Green Version]
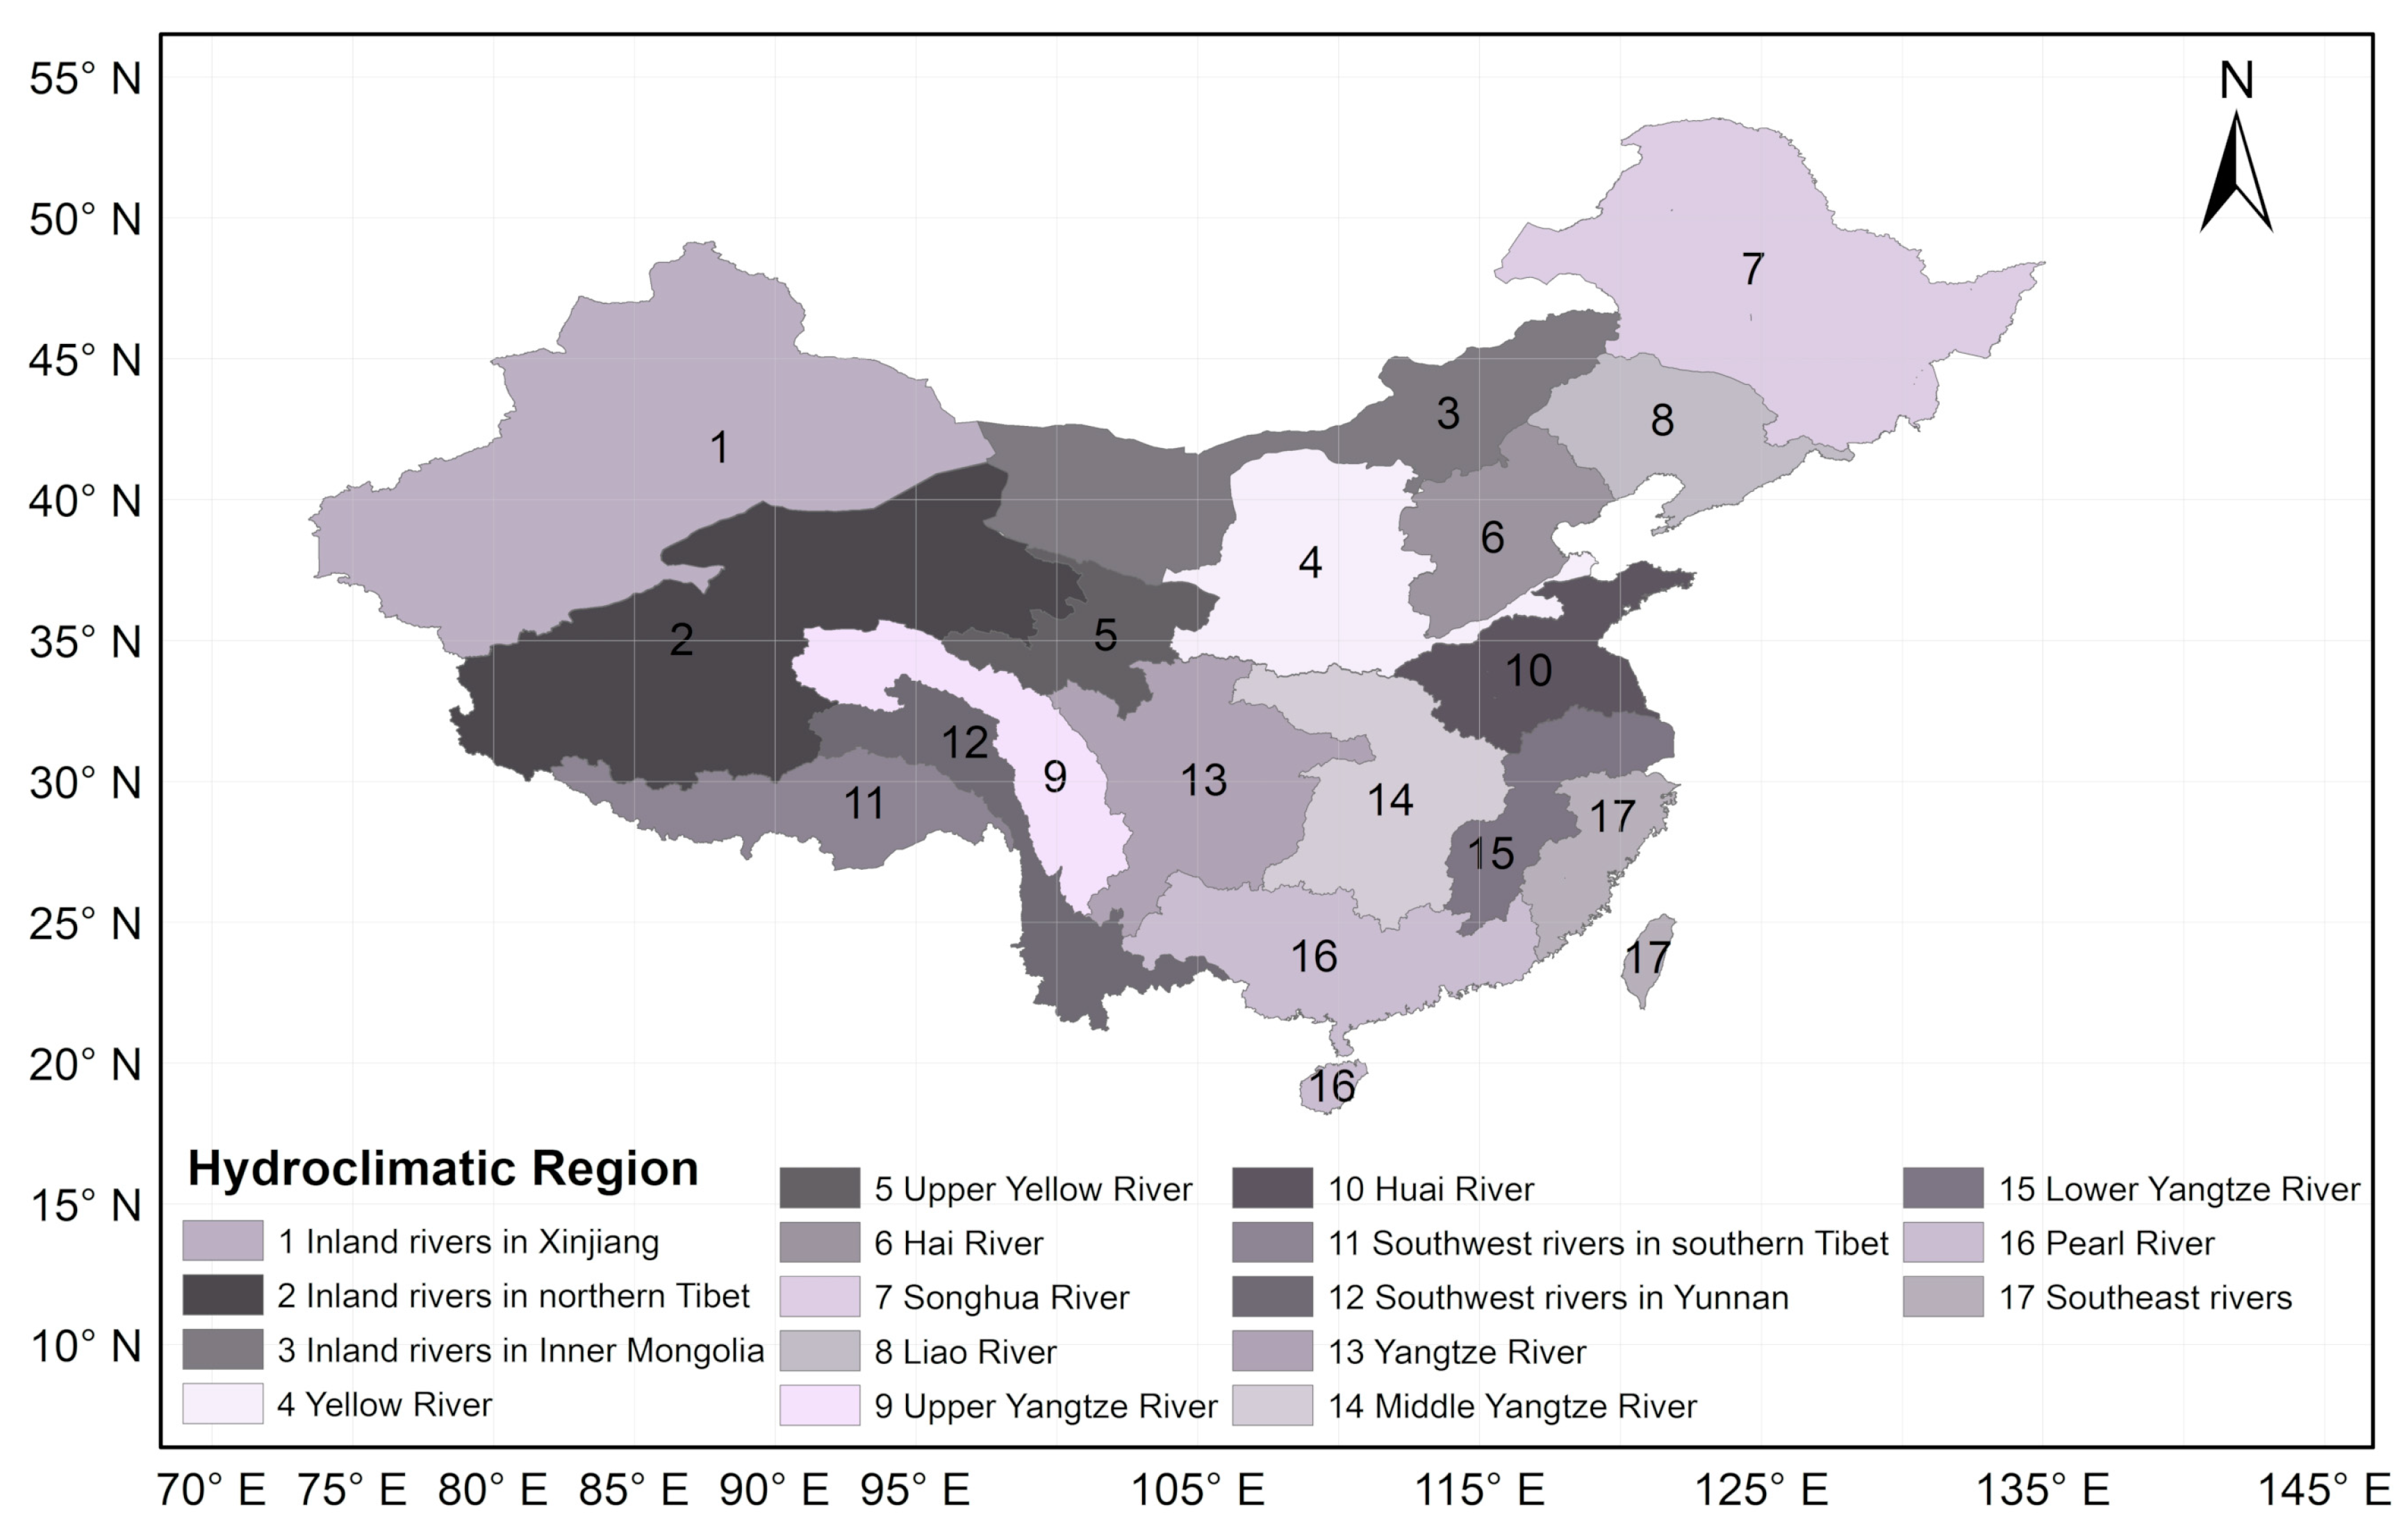
  49. Lang, Y.; Ye, A.; Gong, W.; Miao, C.; Di, Z.; Xu, J.; Liu, Y.; Luo, L.; Duan, Q. Evaluating skill of seasonal precipitation and temperature predictions of NCEP CFSv2 forecasts over 17 hydroclimatic regions in China. J. Hydrometeorol. 2014, 15, 1546–1559. [Google Scholar] [CrossRef]
  50. Fu, X.; Wang, B. Differences of boreal summer intraseasonal oscillations simulated in an atmosphere–ocean coupled model and an atmosphere-only model. J. Clim. 2004, 17, 1263–1271. [Google Scholar] [CrossRef]
  51. Wang, Q.J.; Shao, Y.; Song, Y.; Schepen, A.; Robertson, D.E.; Ryu, D.; Pappenberger, F. An evaluation of ECMWF SEAS5 seasonal climate forecasts for Australia using a new forecast calibration algorithm. Environ. Model. Softw. 2019, 122, 104550. [Google Scholar] [CrossRef]
  52. Barriopedro, D.; Gouveia, C.l.M.; Trigo, R.M.; Wang, L. The 2009/10 Drought in China: Possible Causes and Impacts on Vegetation. J. Hydrometeorol. 2012, 13, 1251–1267. [Google Scholar] [CrossRef] [Green Version]
  53. Xie, Y.; Xing, J.; Shi, J.; Dou, Y.; Lei, Y. Impacts of radiance data assimilation on the Beijing 7.21 heavy rainfall. Atmos. Res. 2016, 169, 318–330. [Google Scholar] [CrossRef]
  54. Lavaysse, C.; Vogt, J.; Pappenberger, F. Early warning of drought in Europe using the monthly ensemble system from ECMWF. Hydrol. Earth Syst. Sci. 2015, 19, 3273–3286. [Google Scholar] [CrossRef] [Green Version]
  55. Robertson, A.; Vitart, F. Sub-seasonal to Seasonal Prediction: The Gap between Weather and Climate Forecasting; Elsevier: Amsterdam, The Netherlands, 2018. [Google Scholar]
  56. Wang, L.; Robertson, A.W. Week 3–4 predictability over the United States assessed from two operational ensemble prediction systems. Clim. Dyn. 2018, 1–15. [Google Scholar] [CrossRef] [Green Version]
Figure 1. Hydroclimatic regions over China.
Atmosphere 12 01049 g001
Figure 2. Mean and the coefficient of variation of daily precipitation over China during the boreal summer monsoon.
Atmosphere 12 01049 g002
Figure 3. Mean squared skill score of daily forecasts at different lead times (Day 1, 4, 7, 10, 14, 21, 28) of the ECMWF model, the ECCC model, the UKMO model, and the MME model over China during the boreal summer monsoon.
Atmosphere 12 01049 g003
Figure 4. Mean squared skill score of week 1, week 2, week 3, week 4, week 1–2, and week 3–4 forecasts of the ECMWF model, the ECCC model, the UKMO model, and the MME model over China during the boreal summer monsoon.
Atmosphere 12 01049 g004
Figure 5. Boxplot diagrams of mean squared skill score of precipitation forecasts at different temporal scales (daily, weekly, and fortnight) of the ECMWF model, the ECCC model, the UKMO model, and the MME model during the boreal summer monsoon. The box spans the interquartile range (IQR) of mean squared skill scores, while the whiskers span the [0.1, 0.9] quantile range. The red line denotes the median value of mean squared skill scores.
Atmosphere 12 01049 g005
Figure 6. Mean squared skill score of sub-seasonal precipitation forecasts at different temporal scales (daily, weekly, and fortnight) of the ECMWF model, the ECCC model, the UKMO model, and the MME model for each region during the boreal summer monsoon.
Atmosphere 12 01049 g006
Figure 7. Ranked probability skill score (RPSS) of daily forecasts at different lead times (Day1, 4, 7, 10, 14, 21, 28) of the ECMWF model, the ECCC model, the UKMO model, and the MME model over China during the boreal summer monsoon.
Atmosphere 12 01049 g007
Figure 8. Ranked probability skill score of week 1, week 2, week 3, week 4, week 1–2, and week 3–4 forecasts of the ECMWF model, the ECCC model, the UKMO model, and the MME model over China during the boreal summer monsoon.
Atmosphere 12 01049 g008
Figure 9. Boxplot diagrams of ranked probability skill score of precipitation forecasts at different temporal scales (daily, weekly, and fortnight) of the ECMWF model, the ECCC model, the UKMO model, and the MME model during the boreal summer monsoon. The box spans the interquartile range (IQR) of mean squared skill scores, while the whiskers span the [0.1, 0.9] quantile range. The red line denotes the median value of mean squared skill scores.
Atmosphere 12 01049 g009
Figure 10. Ranked probability skill score of sub-seasonal precipitation forecasts at different temporal scales (daily, weekly, and fortnight) of the ECMWF model, the ECCC model, the UKMO model, and the MME model for each region during the boreal summer monsoon.
Atmosphere 12 01049 g010
Figure 11. Attribute diagram of daily forecasts at different lead times (Day 1, 4, 7, 10, 14, 21, 28) of the MME model over China during the boreal summer monsoon for tercile based categorical probabilistic forecasts. Forecast probability is binned with width of 0.2, and the size of the dots indicates the sharpness of probabilistic forecasts.
Atmosphere 12 01049 g011
Figure 12. Same as Figure 11, but for week 1, week 2, week 3, week 4, week 1–2, and week 3–4 forecasts.
Atmosphere 12 01049 g012
Figure 13. Composites of weekly precipitation anomalies (mm) in each of the ENSO and MJO phases during the boreal summer monsoon. Statistical significance at the 5% level is labelled.
Atmosphere 12 01049 g013
Figure 14. Ranked probability skill score of week 1, week 2, week 3, and week 4 precipitation forecasts in each of the ENSO phases during the boreal summer monsoon.
Atmosphere 12 01049 g014
Figure 15. Ranked probability skill score of week 1, week 2, week 3, and week 4 precipitation forecasts in each of the MJO phases during the boreal summer monsoon.
Atmosphere 12 01049 g015
Table 1. Configuration of S2S models.
S2S ModelTime Range (Days)Spatial ResolutionHindcast FrequencyHindcast PeriodEnsemble SizeOcean Coupling
ECMWF *46Tco639/Tco319, L912/weekPast 20 years11Yes
UKMO *60N216, L854/month1993–20177Yes
ECCC *320.45° × 0.45°, L40Weekly1998–20184No
* Hindcasts are produced on the fly (model version is not fixed).
Publisher’s Note: MDPI stays neutral with regard to jurisdictional claims in published maps and institutional affiliations.

