Abstract
Vegetation is a climate modifier: It is a primary modifier, such as the Amazon rain forest, or secondary modifier, such as the agricultural fields of Pannonian lowlands in Central Europe. At periods of winter crop spring renewal and the start of the orchard growing season, enhanced evapotranspiration shifts energy balance partitions from sensible toward latent heat flux. This surface flux alteration converges into the boundary layer, and it can be detected in the daily variations of air temperature and humidity as well as daily temperature range records. The time series of micrometeorological measurements and phenological observations in dominant plant canopies conducted by Forecasting and Reporting Service for Plant Protection of the Republic of Serbia (PIS) are explored to select indices that best record the signatures of plant growth stages in temperature and humidity daily variations. From the timing of extreme values and inflection points of relative humidity (R1 and R2) and normalized daily temperature range (DTR/Td), we identified the following stages: (a) start of flowering (orchard)/spring start of the growing season (crop), (b) full bloom (orchard)/development (crop), (c) maximum LAI reached/yield formation (orchard and crop), and (d) start of dormancy (orchard)/leaf drying (crop). The average day of year (DOY) for dominant plants corresponds to the timing obtained from climatological time series recorded on a representative climate station.
1. Introduction
By altering surface heat and water fluxes along with changes in roughness and albedo, leaf emergence in deciduous vegetation annually delivers a natural boundary condition for sensitivity experiments. In areas of widespread midlatitude forests, observations (e.g., [1]) demonstrate how the energy balance partition shifts between sensible and latent heat fluxes with leaf emergence, even as increased available energy increases with increasing sun angle and day length.
This shift in energy flux allocation appear in the regional climate record in the form of an increasing daily increment during the afternoon in terms of specific humidity, with a corresponding decrease in temperature increments [2]. In many forests, albedo decreases with leaf emergence, promoting local increases in near-surface air temperatures. Water vapor flux from transpiration, sometimes complemented early in the day by the evaporation of water intercepted during rainfall or as a result of dewfall, converges into the lower atmosphere, increasing the daily averaged specific humidity. The daily temperature range (DTR) increases rapidly for several weeks into the foliated season, and then it levels off [3]. Collatz et al. [4] noted that changes in the diurnal temperature range exerted by vegetation changes could outweigh the importance of greenhouse gas increases in climate models over longer time scales.
Guided by these studies, we designed a comprehensive study of the impact of plant development on local and regional weather and climate by considering atmospheric conditions at the scale of orchard and climate station as being surrounded by the “sea of air” conditioned by the surrounding agricultural landscape. Initial results [5] showed that the beginning of the growing season triggers extreme temperature and DTR variations. Regionally averaged crop and orchard data show that, outside of the growing season, daily humidity and maximum air temperature can be viewed as perturbations from a basic state registered at a representative climate station (Figure 1). Therefore, we aim to identify changes in air temperature and humidity that are a consequence of plant phenology dynamics and to assess the degree to which climate station records track those changes. We examined what specific changes in the daily increments of temperature and humidity in the orchard and crop plant canopies distinguish the arrival of different seasons in the region.
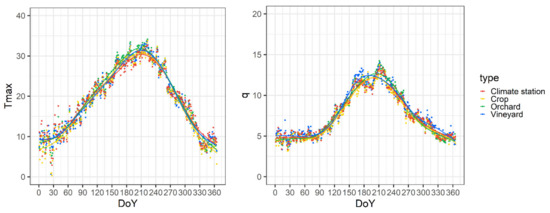
Figure 1.
Regional average of maximum air temperature (Tmax (°C)) and specific humidity (q (g kg−1)) in orchards and crop canopies and at climate station Rimski Sancevi (grass) during the 2014–2020 period.
Therefore, our study addresses the following three related research questions:
- How does leaf emergence affect the annual course of air temperature and humidity in different plant canopies?
- Can temperature and humidity measurements made within the canopy help identify phenological state indicators so that we can apply our findings at sites that lack direct phenology observations?
- Are there changes in annual course of temperature and humidity that appear in the records of nearby weather stations related to the phenological dynamics of the surrounding vegetation?
To address the first and second questions, we seek to link the time of observed phenological stages with changes in the daily trends of temperature and humidity measurements from automated weather stations (AWSs) located in an apple orchard (Cenej, in further text NS/CE) and winter wheat/sugar beet canopies (Temerin, in further text NS/TE (Section 3.1).
We address the third question by comparing measurements from selected canopies with those from made at a conventional climate station at 5 km distance (Rimski Sancevi, RS) (Section 3.2).
Let us elaborate our choice of the representative region and the comparison study’s locations. To limit topographic effects, we start our study in Vojvodina, a province in northern Serbia that is largely flat (Figure 2). The landscape is dominated by crops (winter and spring), but there were increasing acreages of orchards and vineyards in recent times. Vojvodina accounts for 83% of agricultural land in the country (17,890 km2 out of 21,614 km2) [6]. In 2019, 74.1% was arable land, 5.3% was covered with orchards and 1.7% had vineyards at the country level. In this part of the country, the spatial variation of annual temperature is between 11.2 °C and 11.5 °C (Figure 3). The largest difference in average seasonal maximum temperature among Vojvodina orchards is ≈1 °C in the summer [5]. Therefore, we expect our conclusions to be representative for the other four climate stations and automatic weather station (AWS) measurements available in nearby orchards and crop canopies (Figure 4).
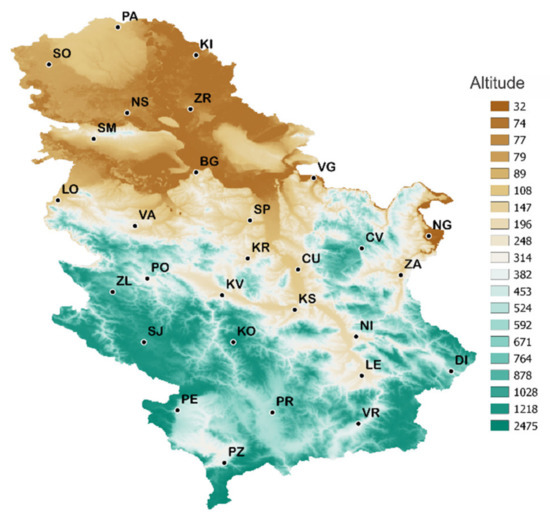
Figure 2.
Landscape of Serbia and climate station locations.
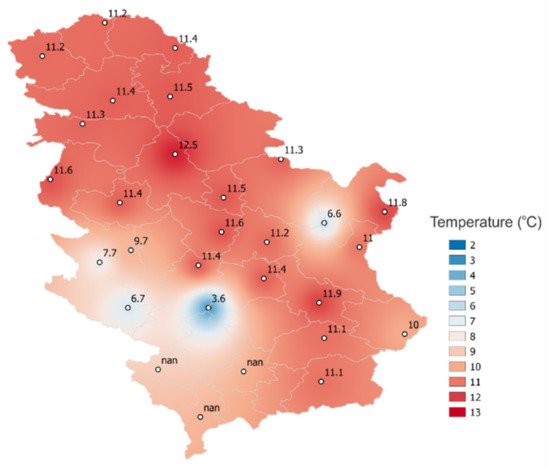
Figure 3.
Annual temperatures at Serbian climate stations (1981–2010) (Source: RHMS Serbia).
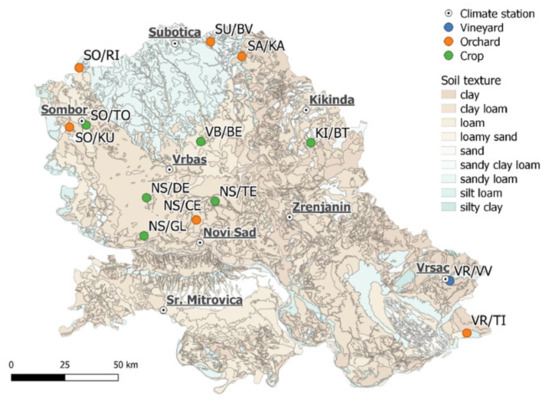
Figure 4.
Distribution of AWS in various plant canopies in the Vojvodina region.
We used daily meteorological and phenological data obtained at apple, plum and pear orchards and in winter wheat/sugar beet canopies during the 2014–2021 period (Section 2), and they are chosen to represent a typical set of meteorological data measured in the field by AWS, offering the opportunity to facilitate the application of these results in other areas.
We note the following: (a) Causality between seasonal variations of canopy air temperature and humidity and plant development cannot be confirmed and quantified from individual, year-to-year measurements because varying synoptic disturbances may diminish the microclimatic impact of vegetation in a given year; (b) five-year averages can hardly be considered to be “long-term”. However, acquiring a few decades of permanent micrometeorological and phenological monitoring in apple orchards is difficult due to recent changes in apple cultivation practices. We compensate for this lack of a more extended data series by including more measurement locations within a relatively small, flat region (90 × 90 km). During the study, daily averages at 13 locations were used to limit the effects of synoptic-scale events, potentially masking local effects in daily averages.
2. Data Sets
Phenological and meteorological data used in the study are obtained from the Forecasting and Reporting Service for Plant Protection (PIS) observational network. Regional offices established in local agricultural stations employ plant protection experts in charge of monitoring activities. Thirty-four regional PIS offices have been established in local agricultural stations and put into force across the country: 12 in Vojvodina and 22 in central Serbia. Hourly values of air temperature and humidity, soil temperature, precipitation and leaf wetness have been archived since 2011 using 166 AWSs located in orchards, vineyards and crop fields across Serbia.
More details about the PIS meteorological and biological observational network and information system can be found in Lalic et al. [7].
2.1. Locations
For our study, only locations with at least five years of continuous daily measurements are selected. More details about locations, canopies and surroundings can be found in Table 1. The apple orchard NS/CE is selected as a reference orchard site because of its continuous time series and relatively common (for this region) canopy architecture, as well as management practices.

Table 1.
Selected locations.
2.2. Phenological Data
Weekly phenological and plant growth stages for the selected locations were recorded during 2014–2020 according to the BBCH scale (Figure 5) [8]. Since observations are conducted weekly, the recorded phenological stage can correspond with the observation day or to any other day in the previous week. Over the years and at different locations, large differences can be observed at the start date for the growing period. By the end of April, differences among locations and varieties become negligible. To facilitate the use of the existing phenological data for our micrometeorological analysis, we note that BBCH 50–60 corresponds to flowering, BBCH 60–70 corresponds to intensive leaf appearance and development and BBCH 70–80 corresponds to fruit development.
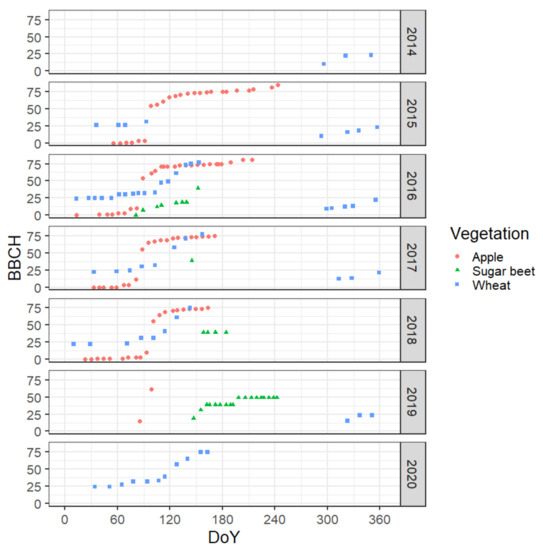
Figure 5.
Phenology dynamics.
2.3. Micrometeorological Data
Meteorological data used in the study include daily values of the following: air temperature (Td), relative humidity (Rh), calculated specific humidity (q), maximum (Tmax) and minimum (Tmin) air temperatures. Air temperature and humidity sensors are radiation-shield and mounted at 1.5 m height (approximately mid-crown); a resistance soil thermometer is positioned at 20 cm depth; an electronic rain gauge is set between the rows of trees; a leaf wetness duration sensor is attached to a leaf surface within the crown.
Before examining the patterns of changes in the trend of selected indices (denoted by the timing of extreme values and inflection points), we eliminated outliers using the interquartile range criteria [9]. Following Simpson [10], we applied Generalized Additive Models (GAMs) to smooth data and estimate the trends of selected indices. Extreme values and inflection points (IP) are calculated as a first and second derivative of GAM-smoothed data series. Numerical derivations are performed using central differencing.
Due to the limited amount of data and a lack of flux measurements, we are not in the position to make straightforward conclusions about the plant development’s impact on heat and water vapor fluxes over the analyzed period. Therefore, we followed Fitzjarrald et al. [2] by examining the seasonal variations of the indices listed below for 1990–2020 climatology and 2013–2020 measurement periods at the RS climate station and made comparisons with the phenology dynamics of dominant crop plants. Additionally, we searched for signatures of specific growth stages in the seasonal trends of the selected indices:
- The daily averaged saturation-specific humidity calculated using daily minimum temperature [qsat(Tmin)] is associated with afternoon and evening humidity of the previous day (Figure 6) assuming that air becomes saturated at the minimum temperature, which is approximately valid in humid and vegetated climates during the growing season. This is the same as saying that q is at saturation when the minimum temperature occurs, qsat(Tmin); moreover, (b) q (or dew point) does not change appreciably during the day. This follows the insights presented by [2,11]. This situation does indeed hold during much of the growing season.
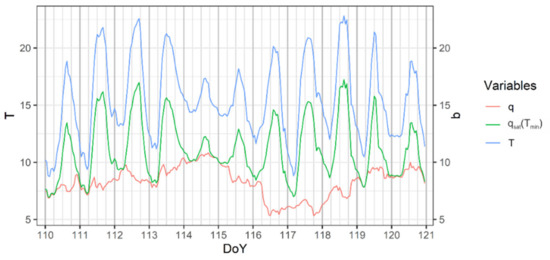 Figure 6. Daily variation of hourly air temperature (T (°C)), specific humidity (q (g kg−1)) and saturated specific humidity (qsat(Tmin) (g kg−1)) in NS/CE orchard for DOY 110–121 in 2014.
On many evenings, the onset of the stable conditions in the surface layer can effectively ‘trap’ specific humidity at its late-afternoon value, which we take as a measure of the value of q in the afternoon convective boundary layer. Subsequent cooling in the surface layer keeps the situation near saturation such that qsat(Tmin) ≈ qmixed layer (afternoon) [2,12,13]. Figure 6 shows that this assumption is approximately valid. We are aware that there is a short period during which evaporative fluxes remain positive even as sensible heat flux trends are negative, causing a characteristic specific humidity “jump” (Acevedo and Fitzjarrald [14]), but this transient effect does not seriously affect this analysis. A small fraction of the enhanced evaporative flux after leaf emergence converges into the deeper boundary layer, and this is sufficient to account for the seasonal q growth.
An increase in daily increment in qsat(Tmin) (Figure 7) at approximately DOY 110 denotes the time of abrupt increases in the winter wheat crop coefficient (crop coefficient is the ratio between real and reference evapotranspiration) from 0.78 in March to 0.97 in April [15]. In mid-May, at DOY 133 (Table 2), the qsat(Tmin) inflection point (IP) corresponds with the time when winter wheat reaches the maximum of its development with the maximum crop coefficient, LAI and the intensity of evapotranspiration.
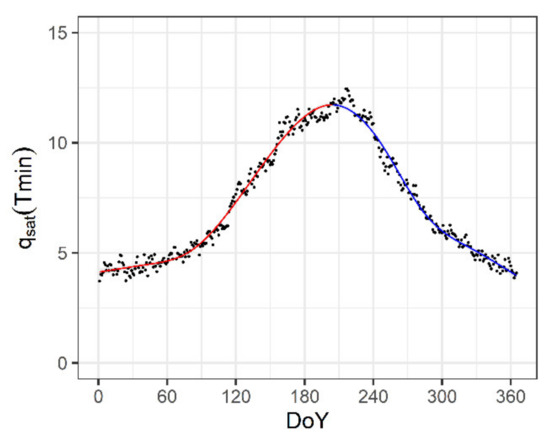
Figure 7.
For the period 1990–2020, the daily averages of qsat(Tmin) (g kg−1) for RS climate station (note the denotations used in all the following figures: observed (black dot) and GAM-fitted (red—increasing; blue—decreasing).
Table 2.
Timing of extreme values and inflection points of qsat(Tmin), R1, R2 and DTRT at RS climate station (1990–2020) (note the denotations used in all the following tables: (a) fitted value/measurement-based value; (b) italic—minimum; underline—maximum].
- 2.
- The daily afternoon average relative humidity (R1 = q/qsat(Tmax)), calculated using average daily specific humidity (q) and maximum temperature (Tmax), identifies the minimum daily relative humidity. It is expected that the R1 annual signal reflects the influence of plant phenology and consequent changes in surface flux partitioning.
- 3.
- Relative humidity R2 (R2 = qsat(Tmin)/qsat(Tmax)) is calculated to verify the impact of plant development on the daily ratio of humidity “stored” in nocturnal/early morning RSL occupied by canopy (qsat(Tmin)) and humidity in the well-developed layer associated with Tmax (qsat(Tmax)). According to RS climatology, the first minimum of both R1 and R2 at DOY 92–98 corresponds with the start of an intensive growth in winter wheat (i.e., start of the full growing season in the area (second half of March) (Table 2 and Figure 8)).
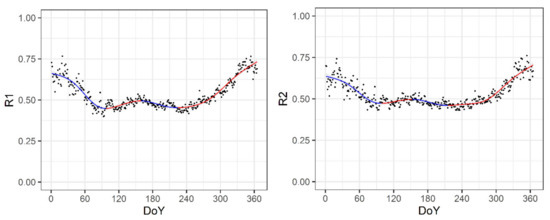 Figure 8. For the period 1990–2020, daily averages of R1 and R2 for RS climate station.
- 4.
- Daily temperature (Td) and daily temperature range (DTR) seasonal variations have annual patterns that can be attributed to the annual variations of solar radiation, clear sky duration, cloudiness, albedo and snow cover (if appropriate) as major climate factors (see for example [16,17]) as well as plant phenology dynamics. When properly identified and addressed, differences and similarities among Td and DTR patterns allow a better understanding of the processes dominating daily air heating (“responsible” for DTR) and cooling “responsible” for daily temperature changes. The significance of DTR as a climatic index strongly affected by plant phenology is proven in the results of numerous studies [3,18]. At the RS climate station, for example, the start and the end of the growing season of dominant crops (approximately from April to October) can be clearly observed from DTR’s annual trend during the 1990–2020 climatological period (Figure 9, left).
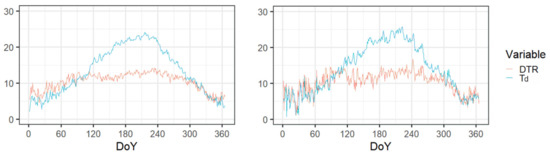 Figure 9. Annual trend of DTR (°C) and Td (°C) at RS climate station for 1990–2020 (left) and 2013–2020 (right).
However, for shorter averaging periods (Figure 9, right), the impacts of advection, daily variations in the timing and magnitude of cloudiness and vegetation dynamics cause significant DTR variabilities. Therefore, the timing of phenological stages cannot be clearly identified from their seasonal variations alone. In our attempt to use temperature and humidity measurements within plant canopy to find phenological state indications in weather (not climate) data, we introduce a normalized daily temperature range (DTRT = DTR/Td) to allow meaningful comparisons of daily temperature variations across the wide range of air temperatures found over most of the mid-year growing season. We hypothesize that periods lacking a significant DTRT trend correspond to times of the year with more steady climate modifiers symmetrically affecting both daily air heating and cooling (winter and summer), while a decreasing/increasing DTRT trend indicates an acceleration of specific warming or cooling effects that are common in spring and autumn seasons. At the RS climate station, for example, winter highs and summer lows can be clearly observed using both climatological and weather data (Figure 10). In this region, two parameters for which their annual variations fully comply with these described scenarios are cloudiness and vegetation dynamics. Since cloudiness (or clear sky duration, its complement) also affects growth dynamics, we expect that the extreme values and inflection points (zero values of first and second derivatives) of DTRT during the year correspond with the timing of phenological events.
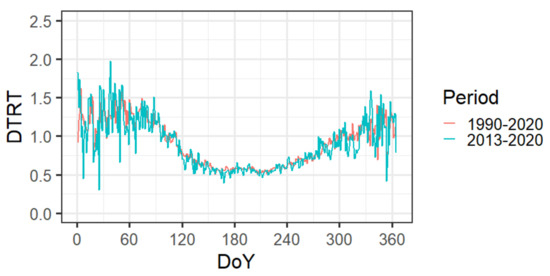
Figure 10.
DTRT annual trend for 1990–2020 (red) and 2013–2020 (blue) period.
An obvious weakness of an analysis based on DTRT is that, due to numerical reasons, it can be performed only if the temperature is expressed in °C and if daily air temperature is not 0 °C. Since we examined the signatures of phenology dynamics in atmospheric conditions within the growing season, cold winter days with 0 °C daily temperature are not germane to our study. In spite of such potential shortcomings, the results obtained convinced us that DTRT is useful for the identification of plant growing stages in real-time.
3. Results
3.1. Seasonal Patterns of Air Temperature and Humidity
Over the annual cycle, conditions within plant canopies are closely related to plant growth. Examining the timing of air temperature and humidity pattern changes in trend and temporal inflection points offers more profound insights with respect to the phases in plant phenology dynamics that affect RSL conditions. In the following discussion, the timing of extreme values and inflection points of selected indices (denoted with “max”, “min” and “IP” in subscript) is traced with reference to associated phenological phases. The results presented in Table 3 and Table 4 and Figure 11, Figure 12, Figure 13 and Figure 14 include the following: when it is possible and both GAM-fitted and measurement-based results in order to avoid misinterpretations caused by fitting. The averaging periods correspond with the operation times of AWS at the selected location (Table 1).
Table 3.
Timing of extreme values and inflection points of qsat(Tmin), R1, R2 and DTRT in NS/CE orchard and NS/TE crop canopy (note the denotations used in all the following tables: (a) fitted value/measurement-based value; (b) italic—minimum; underline—maximum].
Table 4.
Start and end values and timing of DTRT “plateau” in NS/CE orchard, NS/TE crop canopy and at the RS climate station.
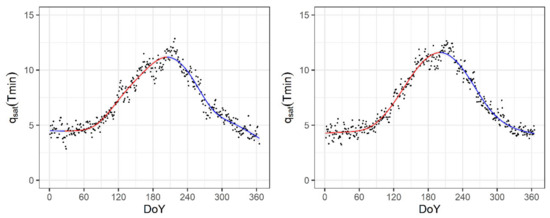
Figure 11.
Seasonal variation of qsat(Tmin) (g kg−1) in apple orchard (NS/CE; (left)) and winter wheat/sugar beet canopy (NS/TE; (right)).
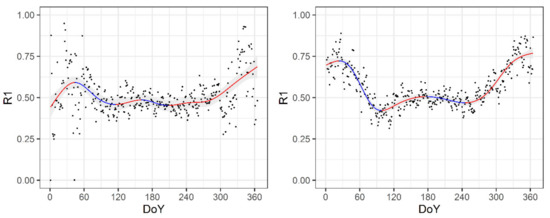
Figure 12.
Seasonal variation of R1 in apple orchard (NS/CE; (left)) and winter wheat/sugar beet canopy (NS/TE; (right)).
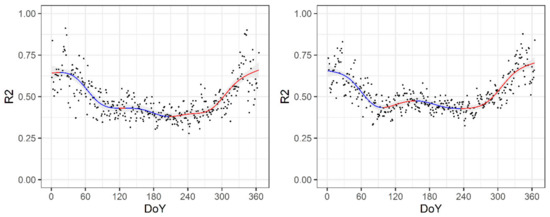
Figure 13.
Seasonal variation of R2 in apple orchard (NS/CE; (left)) and winter wheat/sugar beet canopy (NS/TE; (right)).
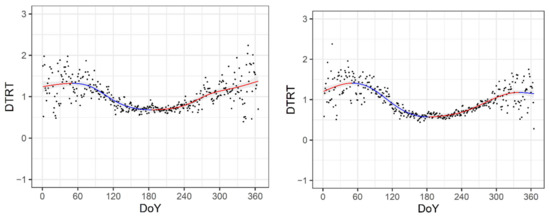
Figure 14.
Seasonal variation of DTRT in apple orchard (NS/CE; (left)) and winter wheat/sugar beet canopy (NS/TE; (right)).
From the beginng of the year to mid-March (DOY 75), qsat(Tmin) in both orchard and crop canopy differs no more than 0.37 mb, while the DTRT winter maximum (DTRTmax) ends at DOY 51 on both canopies (onset of early spring). The concurrency of the noted trends is expected since leafless orchards surrounded by crops follow the temperature and humidity of the dominant plant canopy. In the absence of intensively transpiring plants, an initial DTRT decrease indicates that the seasonally increasing solar radiation duration, even with high cloudiness, results in a higher Td daily increment compared to DTR. One consequence typically noted in orchards is that 20 days before the first biological effects can be identified, the soil has warmed up enough to allow an intensive uptake of soil nutrients. Therefore, the end of the DTRTmax period precedes the visible start of vegetation (BBCH 10) by about 20 days. An increase in surface heating increases air temperature, but the lack of leaves in orchards and low crop canopy density enhances water vapour transfer from the soil surface into the boundary layer. This situation is depicted by R2 decreases in this period, reaching the same minimum value (R2min) at DOY 80 in winter wheat canopy and at DOY 90 in orchards (Table 3). The timing of R2min corresponds with the spring initiation of winter crop development, including first blossoms in orchards.
There are several consequences of blossom expansion in orchards and LAI increases in the crop canopy during April (DOY 90–120). In both plant canopies, the beginning of the aforementioned phenological phase corresponds with timing of R1min and DTRTIP (DOY 100–110). Slight differences between the timing and magnitude of R1min in orchard and crop canopy are the results of differences in their day-to-day variations (apple: 6%, crop: 22%). Variations of DTRT in that period differ less (apple: 19%, crop: 33%), leaving us with almost the same value for DTRTIP (0.92–1.08) during the same period (DOY 107–110) in both canopies. The causes of these effects should be related to the smaller (and heterogenous) plant area density of still-leafless orchards compared to the crop canopy, which allows lower aerodynamic resistances typical for taller vegetation (Jarvis and McNaughton, 1986), and this results in more intensive heat and mass transfers between soil surfaces and the atmosphere at orchard sites. The qsat(Tmin) inflection point at DOY 114 in orchard and DOY 137 in crop canopies and the further decrease in DTRT denote two very important phenological stages. For an apple orchard, this is the period of full blooming when leaf development accelerates, while wheat reaches its maximum development in crop canopies. The increase in evapotranspiration intensity along with high LAI values, typical for a crop canopy, further shifts net radiative balance partitioning toward latent heat fluxes. Reduced sensible heat flux reduces daily heating, slowing DTR increases. Increased latent heat flux and reduced canopy resistance increase the specific humidity of canopy air space, retaining more afternoon and early evening humidity captured in plant canopies during the night available for condensation if/when the air temperature drops below dew point. As a result, qsat(Tmin) increases while DTRT further decreases, witnessing that the increase rate for Td surpasses DTR.
In winter crop canopies, this period ends in mid-June (DOY 165) when AWSs are typically shifted from winter crops (reducing evapotranspiration and preparing for harvesting) to summer crops or sugar beet. NS/TE AWS shifted to sugar beet, and the upcoming analysis follows its phenology dynamics from this point onward.
From June to August, the LAIs of a fruit tree and sugar beet canopy are almost constant, and all physiological processes (starting from July) are focused on yield formation. These processes separate the period of almost-constant DTRT values with the overall DTRTmin at DOY 182–184, which coincides with R1IP in orchards (Table 4). The DTRT “plateau” is determined as a period in which DTRT values are in the range of DTRTmin +/− 1σ. In this period, cloudiness is at its lowest; it is the longest period of clear sky duration; the highest values of incoming solar radiation are observed; plant phenology affecting radiation balance does not change (yield formation phase). It keeps DTRT on its annual minimum with a coefficient of variation between 16% and 17%.
The end of the DTRT “plateau” in orchard (DOY 229) corresponds with the period when orchard trees finish the formation of buds for the next year and fruit formation, “going slowly” to dormancy. In cases of sugar beet (DOY 226), it is the time of intensive yield formation and the start of the process of leaf drying. During this period, plants start to reduce evapotranspiration, shifting radiation balance toward sensible heat flux. Canopy resistance increases in this period and contributes to the second minimum of both R1 and R2 at DOY 242–262. Due to the high variability of both indices, particularly in apple orchard, the timing and magnitudes of R1min and R2min are taken from measured data instead of from the minimum of GAM functions. An increase in daily decrement of temperature that overrides DTR decrease (and leads to an increase in DTRT) can be additionally addressed by the abrupt decrease in sunshine duration from August (285 h) to September (205 h) with the same cloudiness as in July (1981–2010 climatology; Source: RHMS of Serbia).
At the time of harvest (differing little between orchards and crop canopies), qsat(Tmin) and DTRT have their inflection point IP at DOY 260 and DOY 262, respectively, as it was the case at the beginning of the growing season (DOY 107 and DOY 110). The DTRIP values (1.08) for both plant canopies are close to the one at first IP, which can be considered as the end of the growing season.
From the end of September to mid-November (DOY 315), the micrometeorological conditions in apple orchards are a result of the presence of physiologically inactive leaves (BBCH 91–93). During this part of the growing season, leaves, although no longer a source of water vapor, play the role of active surfaces for downward and upward radiation fluxes and still serve as roughness elements to enhance momentum transport. The consequences of leaf drop at mid-November appear as inflection points (IPS) in qsat(Tmin), R1 and DTRT time series at DOY 313–316. When trees are leafless, q and Tmax maintain the same trend in winter.
3.2. Impact of Vegetation on a Small-Scale Variation of Atmospheric Conditions
Atmospheric conditions at climatic stations located in rural or forested areas are clearly influenced by the surrounding vegetation. The RS climatic station has operated in the midst of crop fields (winter and summer crops) for more than sixty years.
To assess the impact of the plant phenology dynamics on RS station records, we compared temperature and humidity indices analyzed in the study with those calculated using RS station measurements (Table 5, Figure 1, Figure 15 and Figure 16). Since R1, R2 and DTRT provided the strongest signatures of phenology dynamics in the air associated with plant canopies, we decided to keep it for further assessment while limiting graphical presentation on R1 and DTRT only because R1 and R2 differences are not quite clear from the graphs.
Table 5.
Timing of extreme values and inflection points of R1, R2 and DTRT at RS climate station for different observational periods (note the denotations used in all the following tables: (a) fitted value/measurement-based value; (b) italic—minimum; underline—maximum].
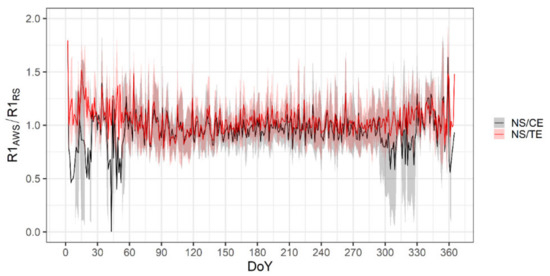
Figure 15.
Seasonal variation of R1 ratio between orchard (black) and crop canopy (red) with respect to RS climate station.
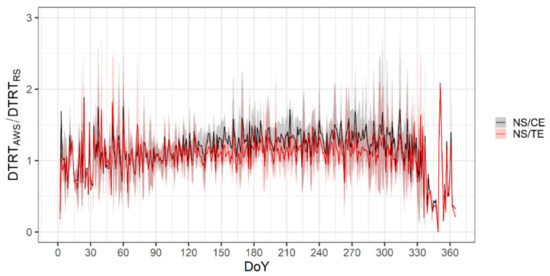
Figure 16.
Seasonal variation of DTRT ratio between orchard (black) and crop canopy (red) with respect to RS climate station.
Visual examination shows that the most prominent feature of orchard/crop canopy R1 difference with respect to the RS climate station (denoted as R1 ratio) is its variability over the year (Figure 15). Since the period examined is from DOY 50–60 (“onset of early spring”) to DOY 315 (end of growing season), R1 ratio variability decreases, reaching its minimum during the summer when crop canopy R1 values are typically higher, while orchard values are typically below the station’s values. During the same period, the DTRT ratio is always higher in the field than at the RS station, remaining higher in orchard than in the crop canopy. Since the end of September, i.e., after spring crop harvest, DTRT at the location associated with crop canopy varies around the RS station’s values, while DTRT in orchard retains higher values due to the still-present leaves.
An analysis of R1 and R2 trends (Table 3 and Table 5) shows that the minimum values in NS/CE and NS/TE plant canopies appear 10−20 days after the minimum determined from RS observations due to an increase in humidity supply in plant canopies and reduced R1 decreases caused by canopy warming. However, R1min and R2min values at RS station, for all analyzed periods, are almost equal to R1min and R2min values found for all crops in the Vojvodina region (Table 6). The timing and values of DTRT extreme values and first IP at the RS station deviates from these values in both canopies up to 2 days and up to 0.1, respectively. The DTRT “plateau” at the RS station has the same scale (69–73 days) for the analysed periods, and it is up to one week longer than in NS/CE and NS/TE canopies due to an earlier start at the beginning of June. Since all climate factors (e.g., solar radiation, cloudiness) and advection impacts are the same due to the small distances involved, the difference identified is largely the result of vegetation impact or a lack of it in the case of the RS station.
Table 6.
Timing/magnitude of extreme values and IPs of R1, R2 and DTRT from GAM fit for all locations analyzed in the study. DOY|DTRT=1 denotes GAM fitted/measurement-based data.
It is important to observe that the average DOY for R1min, R2min, DTRTmax, DTRTmin and DTRTIP for all selected crop locations in Vojvodina equal to the (±2 days) DOY obtained from RS climatological data (1990–2020) (Table 6).
4. Discussion
In this section, we first discuss the novelties of this approach and its limitations from the perspective of previous studies by pointing out what we consider to be the most relevant aspects: (a) use of extreme values and inflection points of temperature and humidity records to identify changes in plant phenology, (b) identification of phenological stages without site-and variety-specific calibration and (c) upscaling the approach from individual plant canopy measurements relative to climate station records and regionally dominant plants (Section 4.1). In Section 4.2, we discuss potential applications and plans.
4.1. Novelties and Limitations
Studies mostly focused on indices that describe how plant phenology (commonly including the start of the growing season and full-leaf period) impacts near-surface air temperature and humidity and commonly used the long-term (climatological) averages of selected indices (see for example [2,3,18,19,20], as well as hourly data and/or flux measurements for their calculation (see for example [21,22,23]). While hourly data and flux measurements are not widely available, using indices resulting from long-period averaging for year-to-year applications is a difficult task. In particular, the seasonal variation of atmospheric state variables and derived indices (T, q and DTR) are frequently disrupted by synoptic-scale events that change their pattern and increase their variability. Therefore, one main novelty of the presented study is that we confirmed, for two previously used indices obtained from conventional data (R1 and R2) and new ones (DTRT), the low variability of the timing of extreme values and inflection points on a short-term (7 years) time series and a strong correlation with observed plant phenological stages. Our findings related to cloudiness’ impact on the trend of the selected indices during the growing season, which aligned with the results obtained for urban areas [16]. The presented approach’s main limitation is the DTRT index, which cannot be used when daily temperature equals zero. However, it is not a practical problem since the entire approach should be applied during the plant growing season.
From the first phenological model developed by Reamur in 1735 [24], other numerous models using accumulated degree-days to determine the timing of phenological stages of different plants (for example [25,26]) and studies dealing with growing stages as a biometeorological index of climate change (for example [27]) have been proposed; they are all variety specific. In particular, a phenological model should always be validated and calibrated for a particular variety of specific plant types, and spatial variation should still be expected under the same thermal conditions. The novelty of the present approach is rooted in the establishment of the correlation between the timing of extremes and inflection points of the selected indices with the observed growing stages of plants. In the next phase of this study, this concept will be applied in mountain regions and across a range of latitudes; moreover, for plant types, this concept is used to assess how widely the approach can be applied.
The successful upscaling of conclusions from the canopy-scale to the regional level clearly reinforces the idea that vegetation is an important regional climate modifier. It also facilitates our search for a more general use of the obtained results. However, the impact of vegetation on climate remains very much region-specific, limiting the application of the presented approach. The present studies commonly use long-term averages of indicators to identify the relationship between changes in dominant plants and regional climatology and, typically, to demonstrate how climate change affects plant phenology (see for example [28,29]). We emphasize the interplay between these two factors and that the plant dynamic is a climate change factor that deserves a better-quantified role in CC adaptation strategies.
One consequence of the tested approach is that the results obtained allow us to find the period of transition between the beginning and end of each season from a regional (using climate station data) and site-specific (using data measured at specific rural or urban locations) perspective.
Table 7 presents an example of the seasonal transition for the Novi Sad (Serbia) region obtained using data from the nearest R.S. climate station. The results obtained support the pattern of the distinct emergence of seasons in a different region, allowing us an observational tool to identify the “vernal front” as spring advances in the Northern Hemisphere [2].
Table 7.
Seasonal transition based on R1 and DTRT extreme values and IP for R.S. climate station.
4.2. Potential Applications and Plans
Our findings can help (a) identify some phenological stages in areas with automatic weather stations (AWS) installed but that lack permanent phenological observations and (b) manage phenological observations according to the expected time of growth stage emergence.
Additionally, it can be used for the following: (a) the initial calibration of plant phenology-related remote sensing (NDVI, VI, for example) due to higher quality temperature remote sensing in comparison to vegetation states, and it can contribute results toward already developed methodology [30,31], (b) the initialization of dynamical vegetation models and (c) initialization of canopy module in the surface scheme of numerical weather prediction and/or climate models when they already have a well-calibrated surface scheme.
The foreseen challenge will be to test the relevancy of the presented approach in urban areas with and without plants. In particular, urban microclimate is the vast issue of sustainable living in the near and distant future. An important contribution to this topic is providing tailor-made green solutions for urban areas by introducing the presented methodology [32].
In future research, we will address several related topics: (a) test the presented results in different world regions (with respect to longitude, latitude, altitude and landscape) and in forested, rural and urban areas; (b) refine phenological stage calibration on a year-to-year basis for different plant varieties and test the sensitivity of the selected indices on synoptic-scale events; (c) test the efficacy of medium-range and monthly weather forecast in predicting phenology dynamics using selected indices; (d) identify the presence/absence of climate change signal in a climate series of selected indices.
5. Conclusions
Orchards and vineyards, such as forests, are perennial vegetative ground covers; therefore, their impact on atmospheric stability and soil–vegetation–atmosphere scalar exchange in regions where they dominate is important for weather and climate analyses and forecasting. In regions such as Vojvodina or even across the entire Pannonian region, winter and spring crops are also permanent types of vegetation that contribute to the “ocean of agriculturally modified air” in this region.
Using only daily air temperature (Tmax, Tmin and Td) and humidity (q) measured in plant canopies, we sought to describe atmospheric responses on plant phenology dynamics and found the following responses to our three research questions:
- The strongest signature of leaf emergence we found in the annual course of R1, R2 and DTRT includes the timing and magnitude of their extreme values and inflection points. We managed to relate the timing of R1min, R2min, DTRTmin, DTRTmax and the scale of DTRT “plateau” with fruit and crop phenological stages as follows:
- (a)
- R2min1 (from observations (we were unable to obtain the same signal after applying smoothening)): orchard—start of flowering; winter crop—spring start of growing season;
- (b)
- R1min1 and DTRT_IP1: orchard—full bloom; winter crop—full development;
- (c)
- DTRTmin, R1_IP2 and DTRT “plateau”: orchard and crop canopy—maximum LAI reached, phase of yield formation;
- (d)
- From the end of the DTRT “plateau” in orchard to R1min2 (from observations): orchard—trees complete the formation of buds for the next year and fruit formation; “going slowly” to dormancy; crop (sugar beet)—intensive leaf drying.
- We demonstrated how one can use daily temperature and humidity measurements within a plant canopy to identify phenological states. If only climate station measurements are available, the results obtained can be associated with the phenology dynamics of dominant plants.
- In the annual course of temperature- and humidity-related indices selected for this study and calculated using RS climate station measurements, the signatures of phenology dynamics of the surrounding plants can be clearly seen. Due to its high coverage, crops (winter and spring) dominate regional climates while orchards develop specific microclimates during the growing season.
The results obtained allow us to find the period of transition between the beginning and end of each season from a regional (using climate station data) and site-specific (using data measured at specific rural or urban locations) perspective.
Author Contributions
Conceptualization, B.L. and D.R.F.; methodology, B.L., D.R.F. and A.F.S.; software, A.F.S.; validation, A.F.S. and M.M.; formal analysis, B.L., D.R.F., A.F.S., M.M. and M.P.; investigation, B.L., D.R.F., A.F.S., M.M. and M.P.; data curation, M.M.; writing—original draft preparation, B.L. and A.F.S.; writing—review and editing, B.L., D.R.F., A.F.S., M.M. and M.P.; visualization, A.F.S.; supervision, D.R.F.; project administration, B.L. and A.F.S.; funding acquisition, B.L. All authors have read and agreed to the published version of the manuscript.
Funding
The study was funded by the Ministry of Education, Science and Technological Development of the Republic of Serbia (Grant No. 451-03-68/2022-14/200117) and project AGROFORECAST of the Austrian Climate Research Program (ACRP).
Institutional Review Board Statement
Not applicable.
Informed Consent Statement
Not applicable.
Data Availability Statement
Field climate: https://ng.fieldclimate.com/auth/login (accessed on 20 March 2022)—access to AWSs; Forecasting and Reporting Service for Plant Protection (PIS): http://www.pisvojvodina.com/ (accessed on 20 March 2022)—host of the Field climate; RHMS of Serbia: https://www.hidmet.gov.rs/index_eng.php (accessed on 20 March 2022).
Acknowledgments
Micrometeorological measurements and phenological observations in crop canopies, orchards and vineyards by Forecasting and Reporting Service for Plant Protection of the Republic of Serbia (PIS) are financed by the Ministry of Agriculture, Forestry and Water Management of the Republic of Serbia and Provincial Secretariat for Agriculture, Water management and Forestry of the Vojvodina province, Republic of Serbia.
Conflicts of Interest
The authors declare no conflict of interest.
References
- Moore, K.E.; Fitzjarrald, D.R.; Sakai, R.K.; Goulden, M.L.; Munger, J.W.; Wofsy, S.C. Seasonal Variation in Radiative and Turbulent Exchange at a Deciduous Forest in Central Massachusetts. J. Appl. Meteorol. Climatol. 1996, 35, 122–134. [Google Scholar] [CrossRef]
- Fitzjarrald, D.R.; Acevedo, O.C.; Moore, K.E. Climatic Consequences of Leaf Presence in the Eastern United States. J. Clim. 2001, 14, 598–614. [Google Scholar] [CrossRef]
- Schwartz, M.D. Examining the Spring Discontinuity in Daily Temperature Ranges. J. Clim. 1996, 9, 803–808. [Google Scholar] [CrossRef][Green Version]
- Collatz, G.J.; Bounoua, L.; Los, S.O.; Randall, D.A.; Fung, I.Y.; Sellers, P.J. A Mechanism for the Influence of Vegetation on the Response of the Diurnal Temperature Range to Changing Climate. Geophys. Res. Lett. 2000, 27, 3381–3384. [Google Scholar] [CrossRef]
- Firanj Sremac, A.; Lalic, B.; Cuxart, J.; Marcic, M. Maximum, Minimum, and Daily Air Temperature Range in Orchards: What Do Observations Reveal? Atmosphere 2021, 12, 1279. [Google Scholar] [CrossRef]
- Gavrilović, D. Statistical Yearbook of the Republic of Serbia; Statistical Service of Serbia: Belgrade, Serbia, 2020; pp. 205–234. [Google Scholar]
- Lalic, B.; Marcic, M.; Sremac, A.F.; Eitzinger, J.; Koci, I.; Petric, T.; Ljubojevic, M.; Jezerkic, B. Landscape Phenology Modelling and Decision Support in Serbia. In Landscape Modelling and Decision Support; Mirschel, W., Terleev, V.V., Wenkel, K.-O., Eds.; Innovations in Landscape Research; Springer International Publishing: Cham, Switzerland, 2020; pp. 567–593. [Google Scholar] [CrossRef]
- Meier, U. Growth Stages of Mono- and Dicotyledonous Plants: BBCH Monograph; Federal Research Centre for Cultivated Plants: Quedlinburg, Germany, 2018. [Google Scholar] [CrossRef]
- Dekking, F.M.; Kraaikamp, C.; Lopuhaä, H.P.; Meester, L.E. A Modern Introduction to Probability and Statistics; Springer Texts in Statistics; Springer: London, UK, 2005. [Google Scholar] [CrossRef]
- Simpson, G.L. Modelling Palaeoecological Time Series Using Generalised Additive Models. Front. Ecol. Evol. 2018, 6, 149. [Google Scholar] [CrossRef]
- Hayden, B.P. Ecosystem Feedbacks on Climate at the Landscape Scale. Phil. Trans. R. Soc. Lond. B 1998, 353, 5–18. [Google Scholar] [CrossRef]
- Fitzjarrald, D.R.; Lala, G.G. Hudson Valley Fog Environments. J. Appl. Meteorol. Climatol. 1989, 28, 1303–1328. [Google Scholar] [CrossRef]
- Hubbard, K.G.; Mahmood, R.; Carlson, C. Estimating Daily Dew Point Temperature for the Northern Great Plains Using Maximum and Minimum Temperature. Agron. J. 2003, 95, 323–328. [Google Scholar] [CrossRef]
- Acevedo, O.C.; Fitzjarrald, D.R. The Early Evening Surface-Layer Transition: Temporal and Spatial Variability. J. Atmos. Sci. 2001, 58, 2650–2667. [Google Scholar] [CrossRef]
- Jaćimović, G. Optimization of Wheat Mineral Nutrition Depending on the Weather Conditions of the Year. Ph.D. Thesis, Faculty of Agriculture, University of Novi Sad, Novi Sad, Serbia, 2012. [Google Scholar]
- Ruschy, D.L.; Baker, D.G.; Skaggs, R.H. Seasonal Variation in Daily Temperature Ranges. J. Clim. 1991, 4, 1211–1216. [Google Scholar] [CrossRef][Green Version]
- Dai, A.; Trenberth, K.E.; Karl, T.R. Effects of Clouds, Soil Moisture, Precipitation, and Water Vapor on Diurnal Temperature Range. J. Clim. 1999, 12, 2451–2473. [Google Scholar] [CrossRef]
- Schwartz, M.D.; Ault, T.R.; Betancourt, J.L. Spring Onset Variations and Trends in the Continental United States: Past and Regional Assessment Using Temperature-Based Indices: Spring Onset Variations and trends in the Continental United States. Int. J. Clim. 2013, 33, 2917–2922. [Google Scholar] [CrossRef]
- Durre, I.; Wallace, J.M. The Warm Season Dip in Diurnal Temperature Range over the Eastern United States. J. Clim. 2001, 14, 354–360. [Google Scholar] [CrossRef]
- Zani, D.; Crowther, T.W.; Mo, L.; Renner, S.S.; Zohner, C.M. Increased Growing-Season Productivity Drives Earlier Autumn Leaf Senescence in Temperate Trees. Science 2020, 370, 1066–1071. [Google Scholar] [CrossRef] [PubMed]
- de Souza, P.J.O.P.; Rodrigues, J.C.; de Sousa, A.M.L.; de Souza, E.B. Diurnal Energy Balance in a Mango Orchard in the Northeast of Pará, Brazil. Revista Brasileira de Meteorologia 2018, 33, 537–546. [Google Scholar] [CrossRef]
- Liu, H.; Zhang, Y.; Liu, S.; Jiang, H.; Sheng, L.; Williams, L.Q. Eddy covariance measurements of surface energy budget and evaporation in a cool season over southern open water in Mississippi. J. Geophys. Res. 2009, 114, D04110. [Google Scholar] [CrossRef]
- Panwar, A.; Renner, M.; Kleidon, A. Imprints of Evaporative Conditions and Vegetation Type in Diurnal Temperature Variations. Hydrol. Earth Syst. Sci. 2020, 24, 4923–4942. [Google Scholar] [CrossRef]
- Shelford, V.E. Phenology and One of Its Modern Descendants. Q. Rev. Biol. 1930, 5, 207–216. [Google Scholar] [CrossRef]
- Di Paola, A.; Chiriacò, M.V.; Di Paola, F.; Nieddu, G. A Phenological Model for Olive (Olea Europaea L. var Europaea) Growing in Italy. Plants 2021, 10, 1115. [Google Scholar] [CrossRef]
- Piña-Rey, A.; Ribeiro, H.; Fernández-González, M.; Abreu, I.; Rodríguez-Rajo, F.J. Phenological Model to Predict Budbreak and Flowering Dates of Four Vitis Vinifera L. Cultivars Cultivated in DO. Ribeiro (North-West Spain). Plants 2021, 10, 502. [Google Scholar] [CrossRef] [PubMed]
- Schröder, W.; Schmidt, G.; Schönrock, S. Modelling and Mapping of Plant Phenological Stages as Bio-Meteorological Indicators for Climate Change. Environ. Sci. Eur. 2014, 26, 5. [Google Scholar] [CrossRef]
- Piao, S.; Liu, Q.; Chen, A.; Janssens, I.A.; Fu, Y.; Dai, J.; Liu, L.; Lian, X.; Shen, M.; Zhu, X. Plant Phenology and Global Climate Change: Current Progresses and Challenges. Glob. Chang. Biol. 2019, 25, 1922–1940. [Google Scholar] [CrossRef]
- Vitasse, Y.; Baumgarten, F.; Zohner, C.M.; Rutishauser, T.; Pietragalla, B.; Gehrig, R.; Dai, J.; Wang, H.; Aono, Y.; Sparks, T.H. The Great Acceleration of Plant Phenological Shifts. Nat. Clim. Change 2022, 12, 300–302. [Google Scholar] [CrossRef]
- Geng, X.; Zhang, Y.; Fu, Y.H.; Hao, F.; Janssens, I.A.; Peñuelas, J.; Piao, S.; Tang, J.; Wu, Z.; Zhang, J.; et al. Contrasting Phenology Responses to Climate Warming across the Northern Extra-Tropics. Fundam. Res. 2022, S2667325822000401. [Google Scholar] [CrossRef]
- Xie, Z.; Zhu, W.; He, B.; Qiao, K.; Zhan, P.; Huang, X. A Background-Free Phenology Index for Improved Monitoring of Vegetation Phenology. Agric. For. Meteorol. 2022, 315, 108826. [Google Scholar] [CrossRef]
- Zhou, Y. Understanding Urban Plant Phenology for Sustainable Cities and Planet. Nat. Clim. Chang. 2022, 12, 302–304. [Google Scholar] [CrossRef]
Publisher’s Note: MDPI stays neutral with regard to jurisdictional claims in published maps and institutional affiliations. |
© 2022 by the authors. Licensee MDPI, Basel, Switzerland. This article is an open access article distributed under the terms and conditions of the Creative Commons Attribution (CC BY) license (https://creativecommons.org/licenses/by/4.0/).