Article

Analysis of the Effect of Economic Development on Air Quality in Jiangsu Province Using Satellite Remote Sensing and Statistical Modeling

1
School of Management, Hefei University of Technology, Hefei 230009, China
2
School of Economics and Management, Hefei University, Hefei 230601, China
3
National Observation and Research Station of Coastal Ecological Environments in Macao, Macao Environmental Research Institute, Macau University of Science and Technology, Macau SAR 999078, China
*
Authors to whom correspondence should be addressed.
These authors contributed equally to this work.
Atmosphere 2022, 13(5), 697; https://doi.org/10.3390/atmos13050697
Submission received: 28 March 2022 / Revised: 25 April 2022 / Accepted: 25 April 2022 / Published: 27 April 2022
(This article belongs to the Special Issue Recent Advances in Optical Remote Sensing of Atmosphere)

Abstract

:
In recent decades, the economy of China has developed rapidly, but this has brought widespread damage to the environment, which forces us to explore a sustainable, green, economic development model. Therefore, it is particularly necessary to clarify the relationship between economic development and environmental pollution. In this paper, we used satellite remote sensing tropospheric NO2 vertical column density (VCD) as an air quality indicator; the total exports, total imports, and industrial electricity consumption as the economic indicators; and the wind speed, temperature, and planetary boundary layer height as the meteorological factors to perform a Generalized Additive Modeling (GAM) analysis. By deducing the influence of meteorological factors, the relationship between economic indicators and the air quality indicator can be determined. When total exports increased by one billion USD (United States Dollar), the tropospheric NO2 VCDs of Nanjing and Suzhou increased by about 15% and 6%, respectively. The tropospheric NO2 VCDs of Suzhou increased by about 5% when the total imports increased by one billion USD. In addition, when the industrial electricity consumption increased by one billion kWh, the tropospheric NO2 VCDs of Nanjing, Suzhou and Xuzhou increased by about 25%, 12%, and 59%, respectively. This study provides a method to quantify the contribution of economic growth to air pollution, which is helpful for better understanding of the relationship between economic development and air quality.

1. Introduction

The rapid development of urbanization and industrialization in recent decades has placed great pressure on the environment and has led to a series of environmental pollution problems. In the last two decades, the type of air pollution in China has gradually changed from traditional soot pollution to extremely complex, regional, air compound pollution. Haze pollution, represented by fine particles (PM2.5), and photochemical smog, represented by ozone (O3), are the two main air pollution problems faced by China [1,2,3,4,5]. As an important precursor of PM2.5 and O3 pollution, nitrogen oxides (NOx = NO + NO2) play a very important role in atmospheric photochemical processes. In the troposphere, NOx chemically reacts to produce acid (HNO3) and further to nitrate aerosols. In addition, NOx also actively participate in the formation of ozone. These have significant damage to human health and climate [6,7,8]. Compared with natural sources, anthropogenic sources (industrial emissions, power generation and traffic emissions, etc.) account for a large part of the total NOx emissions [6,9,10,11,12]. The deterioration of atmospheric air quality will not only restrict the development of the economy and society but will also have an adverse impact on human health [13,14,15,16]. These factors force us to explore green and sustainable development models.
In recent years, our government has implemented a series of air pollution control measures. On 10 September 2013, the State Council issued the Air Pollution Prevention and Control Action Plan [17]. The specific target was that by 2017, the concentration of inhalable particulate matter in prefecture-level cities and above will be reduced by more than 10% compared with that in 2012, and the number of days with excellent air quality will increase year by year; the concentration of fine particles in Beijing–Tianjin–Hebei, the Yangtze River Delta, and the Pearl River Delta region will be decreased by about 25%, 20%, and 15%, respectively, and the annual average concentration of fine particles in Beijing will be controlled at about 60 μg/m3. Subsequently, the Three-Year Action Plan to Win the Blue Sky Defense War [18] was publicly released by the State Council on 3 July 2018. The goals of the plan are to significantly reduce the total emissions of major air pollutants, thus simultaneously reducing greenhouse gas emissions, and to significantly further reduce PM2.5 concentration, significantly reduce the number of days of heavy pollution, significantly improve the air quality, and significantly enhance people’s blue sky happiness through three years of efforts. The Action Plan for Carbon Dioxide Peaking before 2030 [19] was issued by the State Council on 24 October 2021. The plan calls for accelerating the green transformation of production and lifestyles, promoting economic and social development that is green, low-carbon, and based on efficient utilization of resources, and to ensure that the carbon peak goal by 2030 is achieved on schedule. The implementation of these environmental protection policies has weakened the damage of economic development to the environment to a certain extent, but to further carry out pollution prevention and control, it is necessary to clarify the internal relationship between environmental pollution and economic development.
The smog events in London over the last century and the serious air pollution problems in some cities in China in this century have caused economic development and environmental quality to become the research focus of scholars in relevant fields. Grossman and Krueger obtained the concept of Environmental Kuznets Curve (EKC) by studying the relationship between environmental pollution and economic growth [20]. They believe that there is an “inverted U-shaped” relationship between environmental pollution and economic growth. This means that environmental pollution will intensify in the early stage of economic growth. However, with the development of economy and the rise of emerging industries, traditional high-pollution emission industries are gradually replaced, and people pay more attention to environmental protection. These factors together promote environmental pollution reduction to a certain extent. Because the technical and structural effects of economic development on the environment are positive, and the scale effect is negative, the curve shows the characteristics of an “inverted U” [21]. Economists and environmental scholars in various countries take the Environmental Kuznets curve hypothesis as the basic theory used to study the relationship between economic growth and environment, and they use different data to confirm the existence of the EKC curve [22,23,24,25]. Chinese scholars have also carried out research on the relationship between domestic urban economic development and environmental pollution based on the EKC model [26,27,28]. In addition, some statistical models are also used to study the relationship between economic development and environmental pollution [29,30,31].
Generalized Additive Modeling (GAM) is a useful statistical model that analyzes the complex nonlinear relationship between response variables and explanatory variables by controlling the influence of confounding factors on the research object [32,33,34]. It is flexible in exploring the relationship between response variables and explanatory variables, and its results have high reliability. The model is widely used when looking at the relationship between anthropogenic emissions, meteorological factors, and environmental pollution [34,35,36,37].
In this paper, we used the GAM model to study the relationship between economic development and air pollution in the cities of Nanjing, Suzhou, and Xuzhou in Jiangsu Province. The industrial structure layout of the three typical cities is quite different. Nanjing is the capital of Jiangsu Province. In 2020, the proportions of the primary, secondary, and tertiary industrial structures, which refer to agriculture, industry, and service, respectively, of Nanjing were 2.0%, 35.2%, and 62.8%, respectively [38]. Nanjing has a prosperous tertiary industry. Suzhou, located in the southeast of Jiangsu Province, is one of the most important central cities in the Yangtze River Delta and one of the top 10 cities in terms of China’s GDP. In 2020, the proportions of the primary, secondary, and tertiary industrial structures of Suzhou were 1.0%, 46.5%, and 52.5%, respectively [39]. The secondary industry of Suzhou is relatively developed. Xuzhou is located in the northwest of Jiangsu Province, a provincial sub central city and a national comprehensive transportation hub. In 2020, the proportion of the primary, secondary, and tertiary industrial structures of Xuzhou were 9.8%, 40.1%, and 50.1%, respectively [40]. Compared with Nanjing and Suzhou, Xuzhou’s primary industry accounts for a larger proportion. Jiangsu Province is located in the Yangtze River Delta region with a developed economy. It is one of the most economically developed provinces in China. Studying the relationship between economic development and environmental pollution in Jiangsu Province is of great significance in order to explore the development mode of a green economy.

2. Data and Methodology

2.1. The Research Data

2.1.1. The NO2 Tropospheric Vertical Column Densities

In this study, the tropospheric Vertical Column Densities (VCDs) of nitrogen dioxide (NO2) were obtained from satellite remote sensing. Satellite remote sensing can realize long-term observations with a wide range and full coverage, which is of great significance for the study of long-term changes in air quality [41,42,43]. The Ozone Monitoring Instrument (OMI) is situated onboard the NASA Aura satellite, launched in 2004 [44]. The spectrometer of OMI covers a wavelength range from 270 to 500 nm with a full width at half maximum (FWHM) of 0.45–1.0 nm. OMI can be used to detect atmospheric trace components such as ozone, NO2, and SO2 with a spatial resolution of about 13 × 24 km2 at nadir. OMI operates in a sun-synchronous orbit, which can achieve global daily coverage, and the overpass time is about 13:45 local solar time. In this research, NASA’s version 3 OMI tropospheric NO2 standard data product (https://acdisc.gesdisc.eosdis.nasa.gov/data/Aura_OMI_Level3/OMNO2d.003, accessed on 28 March 2022) is used [45,46]. The detailed retrieval procedure is as follows. Firstly, the Slant Column Densities (SCDs) of NO2 are obtained from the Differential Optical Absorption Spectroscopy (DOAS) [47] fit of the OMI spectra. Secondly, the stratospheric and tropospheric columns are separated by the local analysis of the stratospheric field from unpolluted areas. Lastly, the tropospheric OMI NO2 SCDs are converted to VCDs by applying air mass factors (AMF)—the AMFs are calculated based on the NO2 profiles from a model simulation. In this study, NASA’s OMI tropospheric NO2 product is first filtered with the criteria of a relative error less than 100% and cloud fraction less than 0.4 [48,49,50], and then the monthly or annual mean values from 2016 to 2020 were derived from the areas of Nanjing, Suzhou, and Xuzhou. The area under the jurisdiction of each city is considered in the processing of satellite data, and the value within the city boundary is averaged.

2.1.2. The Economic Indicators

Economic indicators cover all aspects of economic development. In order to study the relationship between economic development and air quality, the selection of indicators directly or indirectly related to air quality is particularly necessary. The development of industry and foreign trade is closely related to air quality, and these are also two important factors used to indicate the level of urban economic development. In this study, the industrial electricity consumption and the total imports and exports, which indicate the intensity of industrial production and the degree of foreign trade development, respectively, were selected for analysis. The five-year data from 2016 to 2020 are available from the official websites of the local bureaus of statistics of the three typical cities (Nanjing: http://tjj.nanjing.gov.cn/bmfw/njsj/, accessed on 28 March 2022; Suzhou: http://tjj.suzhou.gov.cn/sztjj/tjsj/tjsj.shtml, accessed on 28 March 2022; Xuzhou: http://tj.xz.gov.cn/xwzx/001003/subPage.html, accessed on 28 March 2022).

2.1.3. The Meteorological Factors

In this study, the monthly average wind speed, temperature, planetary boundary layer height, and other useful meteorological data of the three typical cities from 2016 to 2020 were determined from simulation of the Weather Research and Forecasting (WRF) model [51,52,53,54]. The global meteorological dataset (0.5° spatial resolution and 6-h time resolution) obtained from the National Center for Environmental Prediction (NCEP) Global Forecasting Model (GFS) was used as the initial and boundary conditions for meteorological field simulation. Through the simulation of WRF, we achieved meteorological data with a horizontal resolution of ~20 km.

2.2. Generalized Additive Models

To deeply understand the relationship between the development of industry and foreign trade and air quality, we performed several analyses using the Generalized Additive Model (GAM). GAM is an extension of the Generalized Linear Model (GLM). It analyzes the complex nonlinear relationship between response variables and explanatory variables by controlling the influence of confounding factors on the research object [31]. It is more flexible in exploring the relationship between response variables and explanatory variables, and its results have higher reliability. The general form of the GAM model is as follows:
y = c + i n s x i + ε
Here, y is the monthly averaged tropospheric NO2 VCDs, c is the constant mean of the response, s(xi) is the smoothing function of ith variable (xi) of the total n variables and describes the responses of the transformation y and the ith variable, and ε is the fitting residual.
When the degree of freedom (DOF) is 1, the function is a linear equation. When the DOF is greater than 1, it means that the function is a nonlinear curve equation, and the larger the value is, the more significant the nonlinear relationship is.
In this paper, the meteorological data and main indicators of economic development were selected as the explanatory variables, and the tropospheric NO2 VCDs was used as the response variable in order to construct the basic model. The wind speed, temperature, and boundary layer height were the main meteorological factors, while the industrial electricity consumption, total exports, and total imports were the main indicators of economic development chosen as input variables for our GAM research on the three typical cities. In addition, the month number as a time variable was also introduced in the GAM calculation to explain the short-term temporal persistence and to control the temporal autocorrelation in the fitting residuals. The detailed input variables of the three typical cities are listed in Table 1.

3. Results

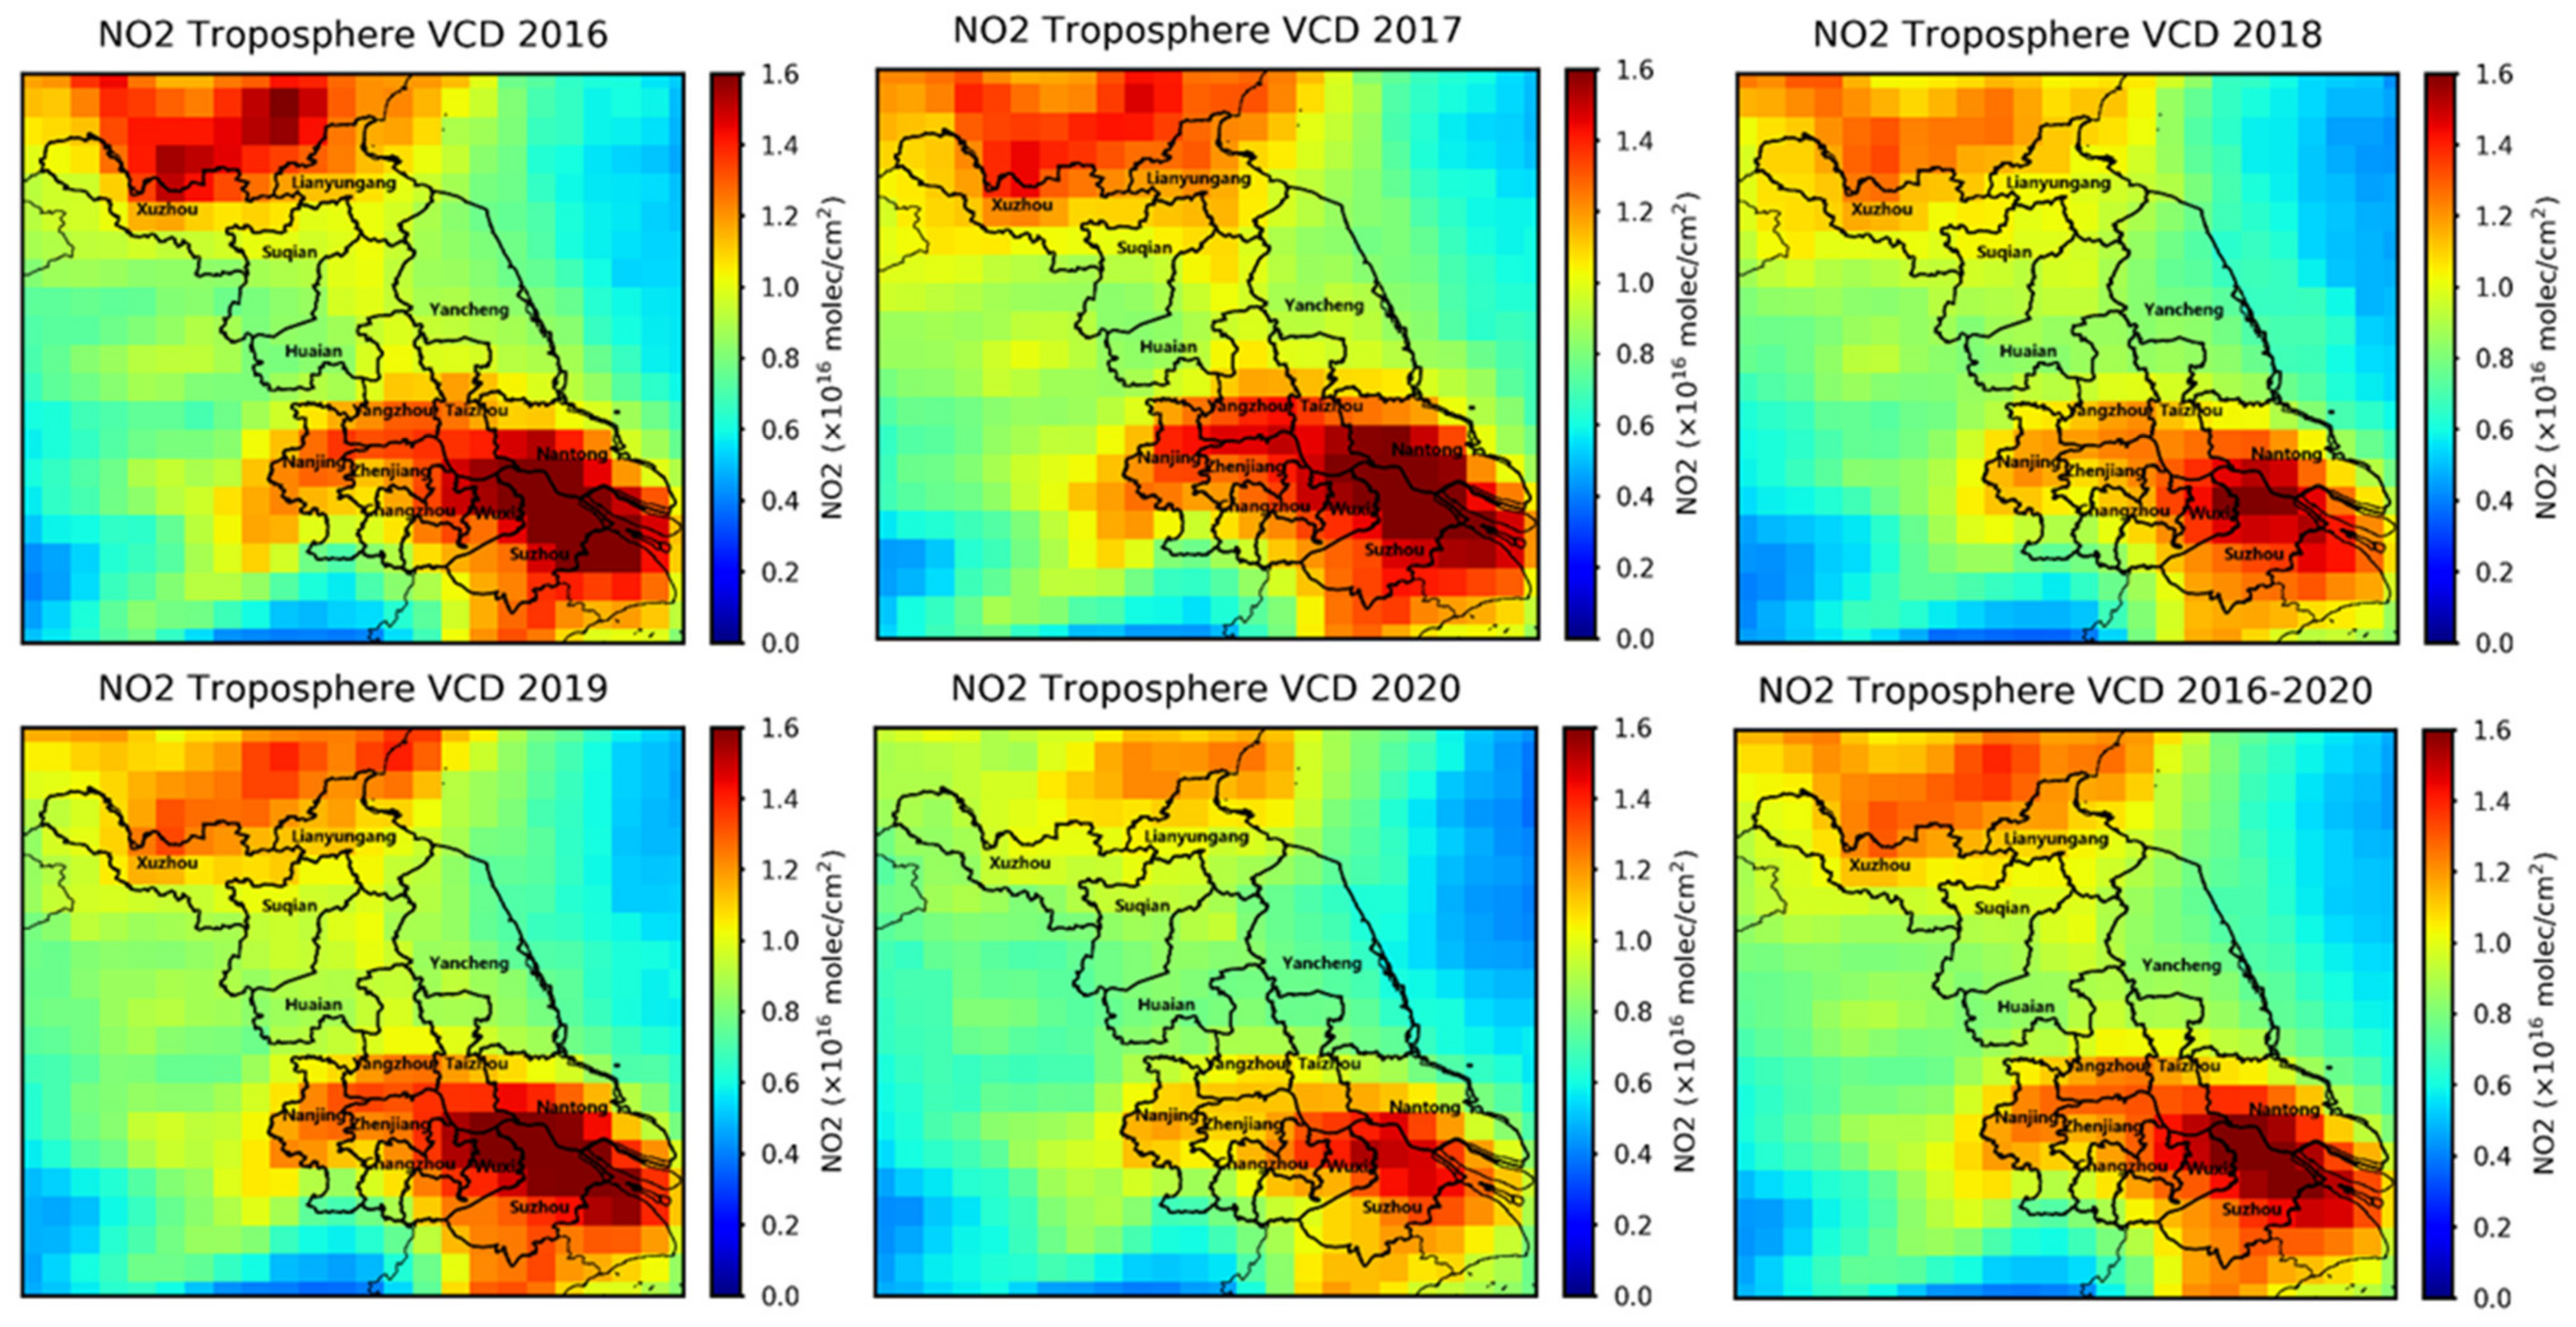
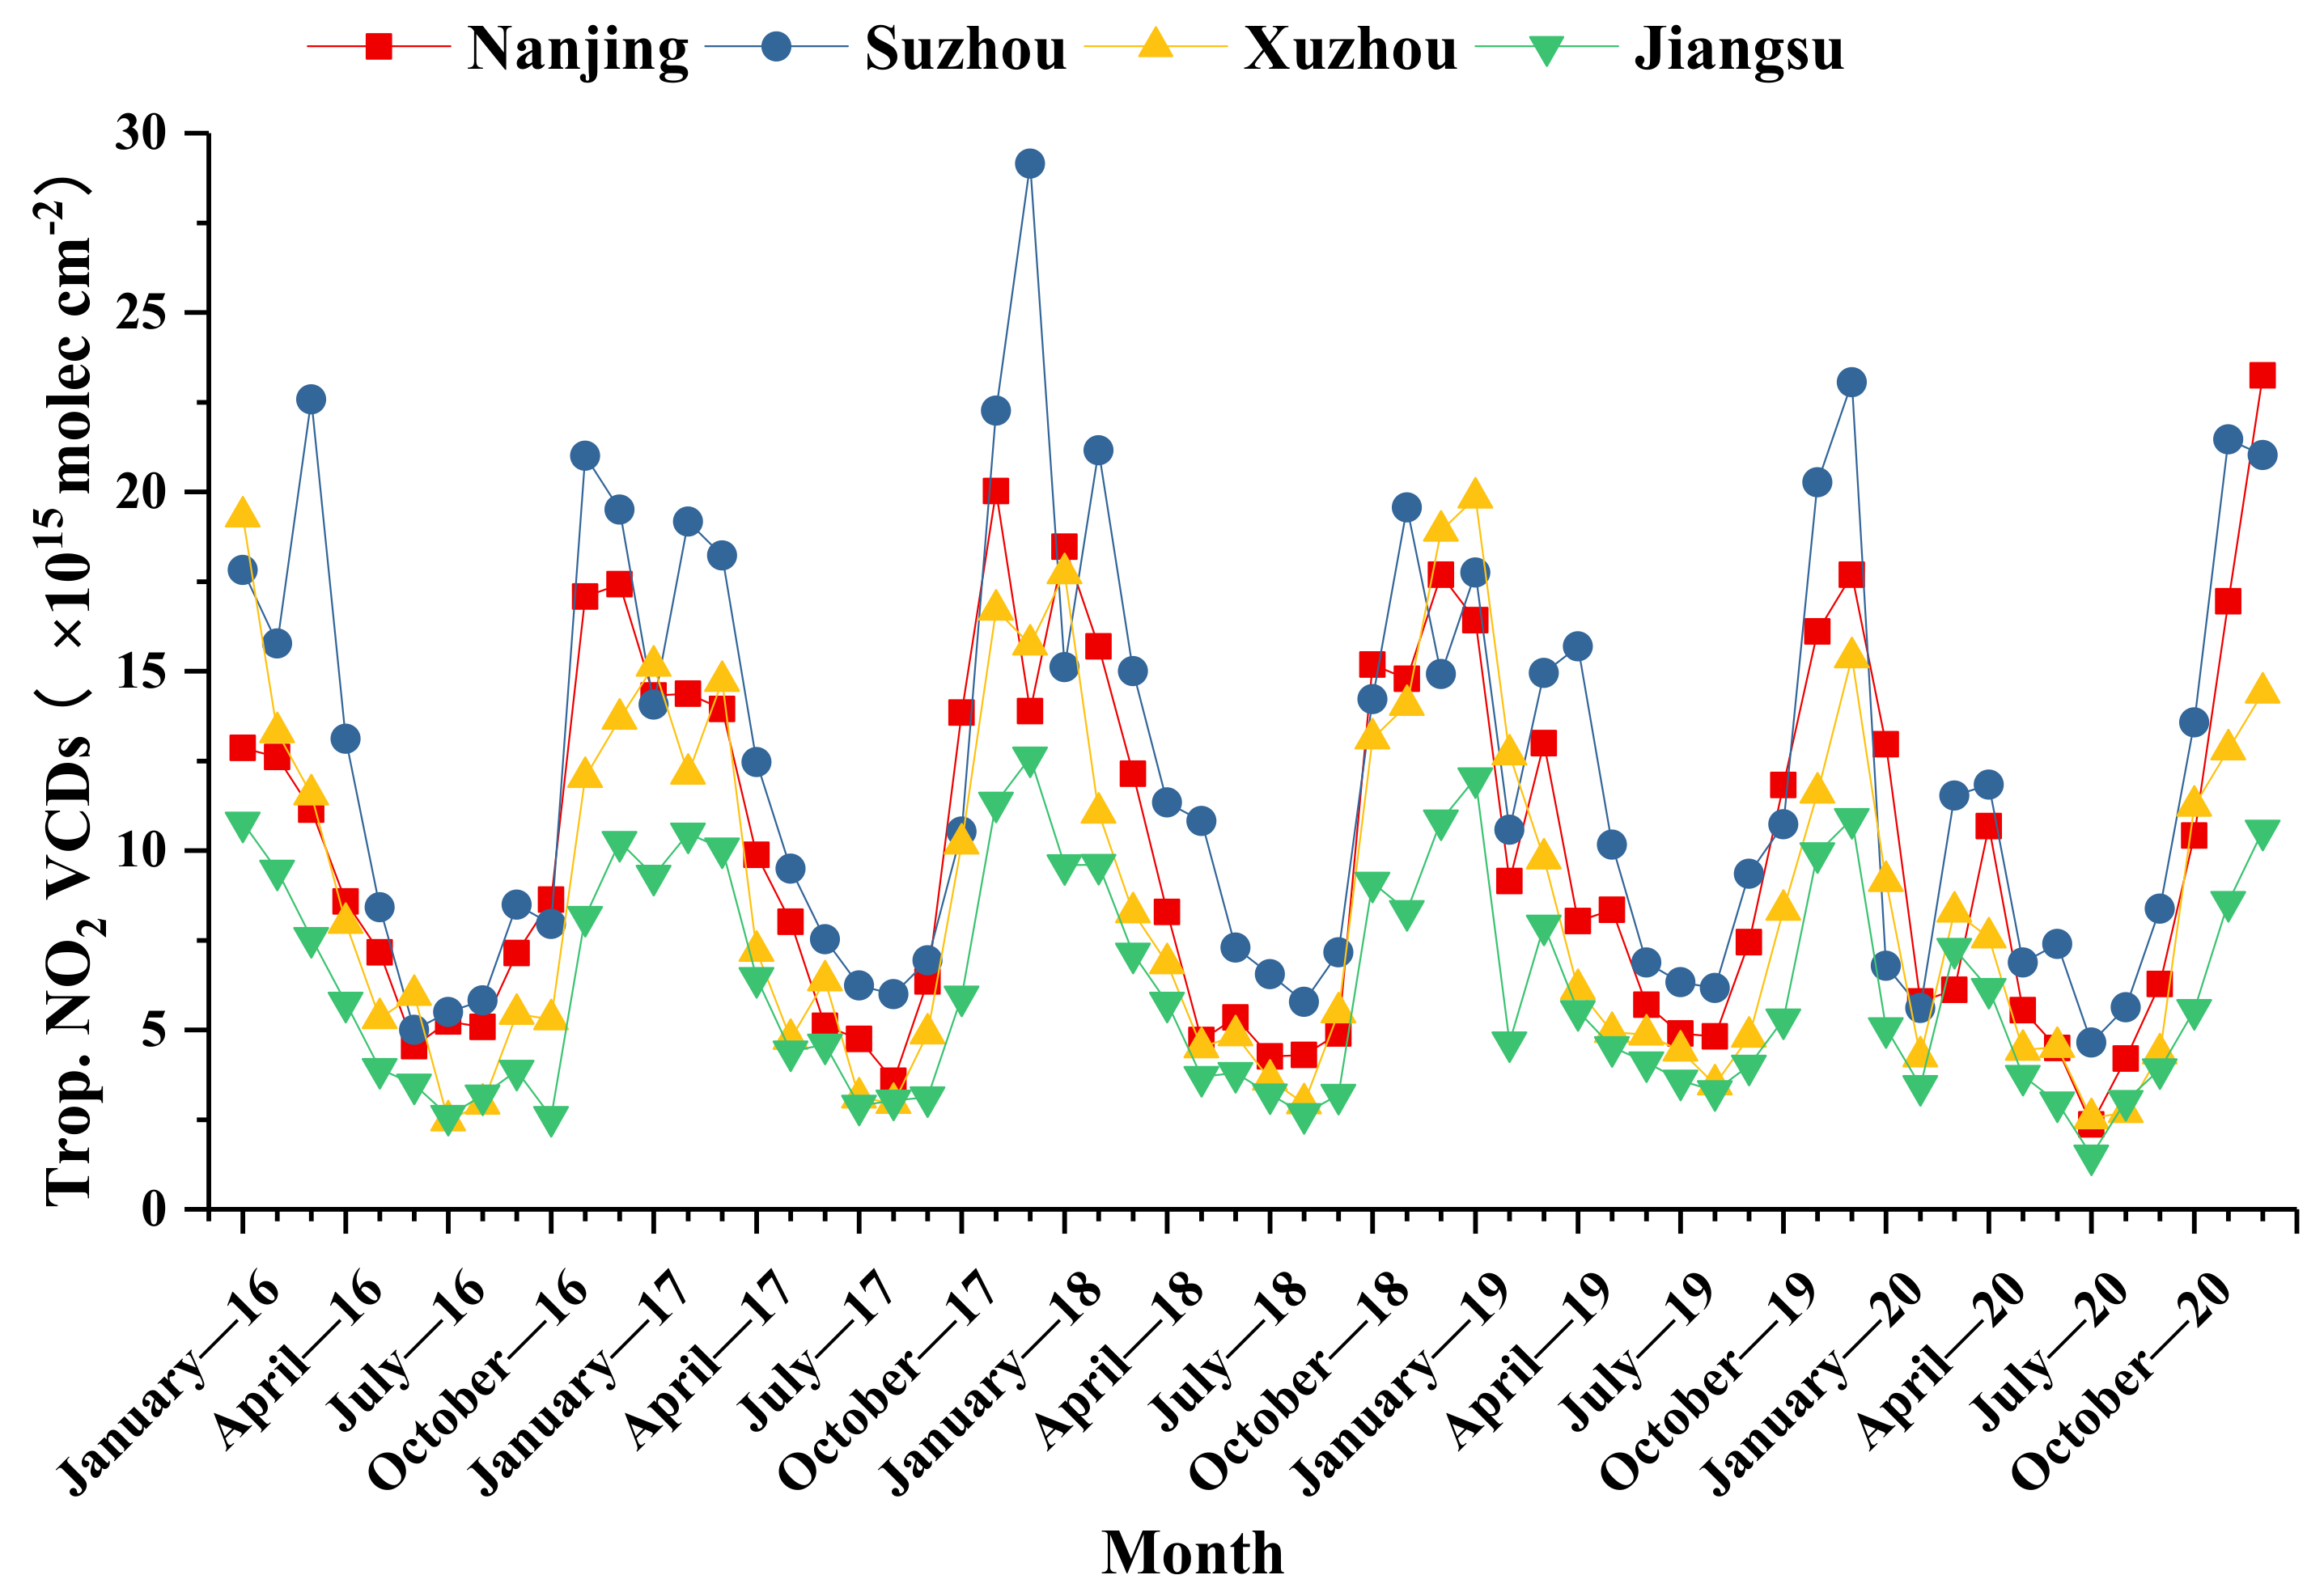
3.1. Spatial–Temporal Variations of Tropospheric NO2 VCDs

The spatial distribution results of the annual average tropospheric NO2 VCDs of Jiangsu province from 2016 to 2020 are shown in Figure 1. From these results, it can be seen that there are high concentrations of NO2 pollution in southern and northern Jiangsu Province. The concentration of NO2 in southern Jiangsu province, where urbanization and industrialization are more developed, is relatively higher. Nanjing, Changzhou, Wuxi, and Suzhou along the Yangtze River are economically developed and densely populated, and the emissions of NO2 are also notable. NO2 pollution is also serious in northern Jiangsu. As an inland, resource-based, industrial city, Xuzhou relies on traditional industries such as coal, electric power, metallurgy, coking, and building materials as its economic pillar. The proportion of electricity generated by coal burning is high, and the emission of industrial pollutants is large [55]. The central Jiangsu area is relatively clean, and the concentration of NO2 is low. In 2020, influenced by the prevention and control of COVID-19, the mean NO2 concentration was lower than other years. This spatial distribution characteristic of the tropospheric NO2 VCDs in Jiangsu province is consistent with previous NO2 studies in the Yangtze River Delta [56,57], and the different concentrations in different cities are mainly caused by the emission changes.
Figure 2 shows the monthly average NO2 VCDs time series of the cities of Nanjing, Suzhou, Xuzhou, and Jiangsu province from 2016 to 2020. The average NO2 VCDs have obvious monthly variation characteristics; that is, they are high in winter and low in summer. In the winter heating season, energy consumption is large, and NO2 emissions are exacerbated. Moreover, the diffusion conditions of pollution in winter are poor, and pollutants accumulate easily. The monthly average NO2 VCDs vary in the range of (2.36–23.24) × 1015, (4.64–29.15) × 1015, (2.47–19.84) × 1015, and (1.50–12.60) × 1015 molec. cm−2 for Nanjing, Suzhou, Xuzhou, and Jiangsu province, respectively. Generally, the monthly average NO2 VCDs of these three typical cities are greater than that of the entirety of Jiangsu Province, and the monthly average NO2 VCDs of Suzhou are greater than that of Nanjing, and the average NO2 VCDs of Xuzhou are the lowest. This is directly related to the intensity of industrial activities and the intensity of anthropogenic emissions in different cities. Anthropogenic sources NO2 emissions mainly come from fossil fuel combustion, such as industrial and motor vehicle emissions. From the comparison of the GDP, total exports and industrial electricity consumption of each city (detailed in Section 3.2), it can be seen that the intensity of economic activities in Suzhou is also stronger than that in Nanjing and Xuzhou, and the air pollution situation is in good agreement with the total economy. During January and February 2020, the average NO2 VCDs of the three typical cities were lower than that in the same period in previous years. During the outbreak of COVID-19, China’s epidemic prevention and control measures were very strong, and the reduction in pollution in the corresponding period was obvious.

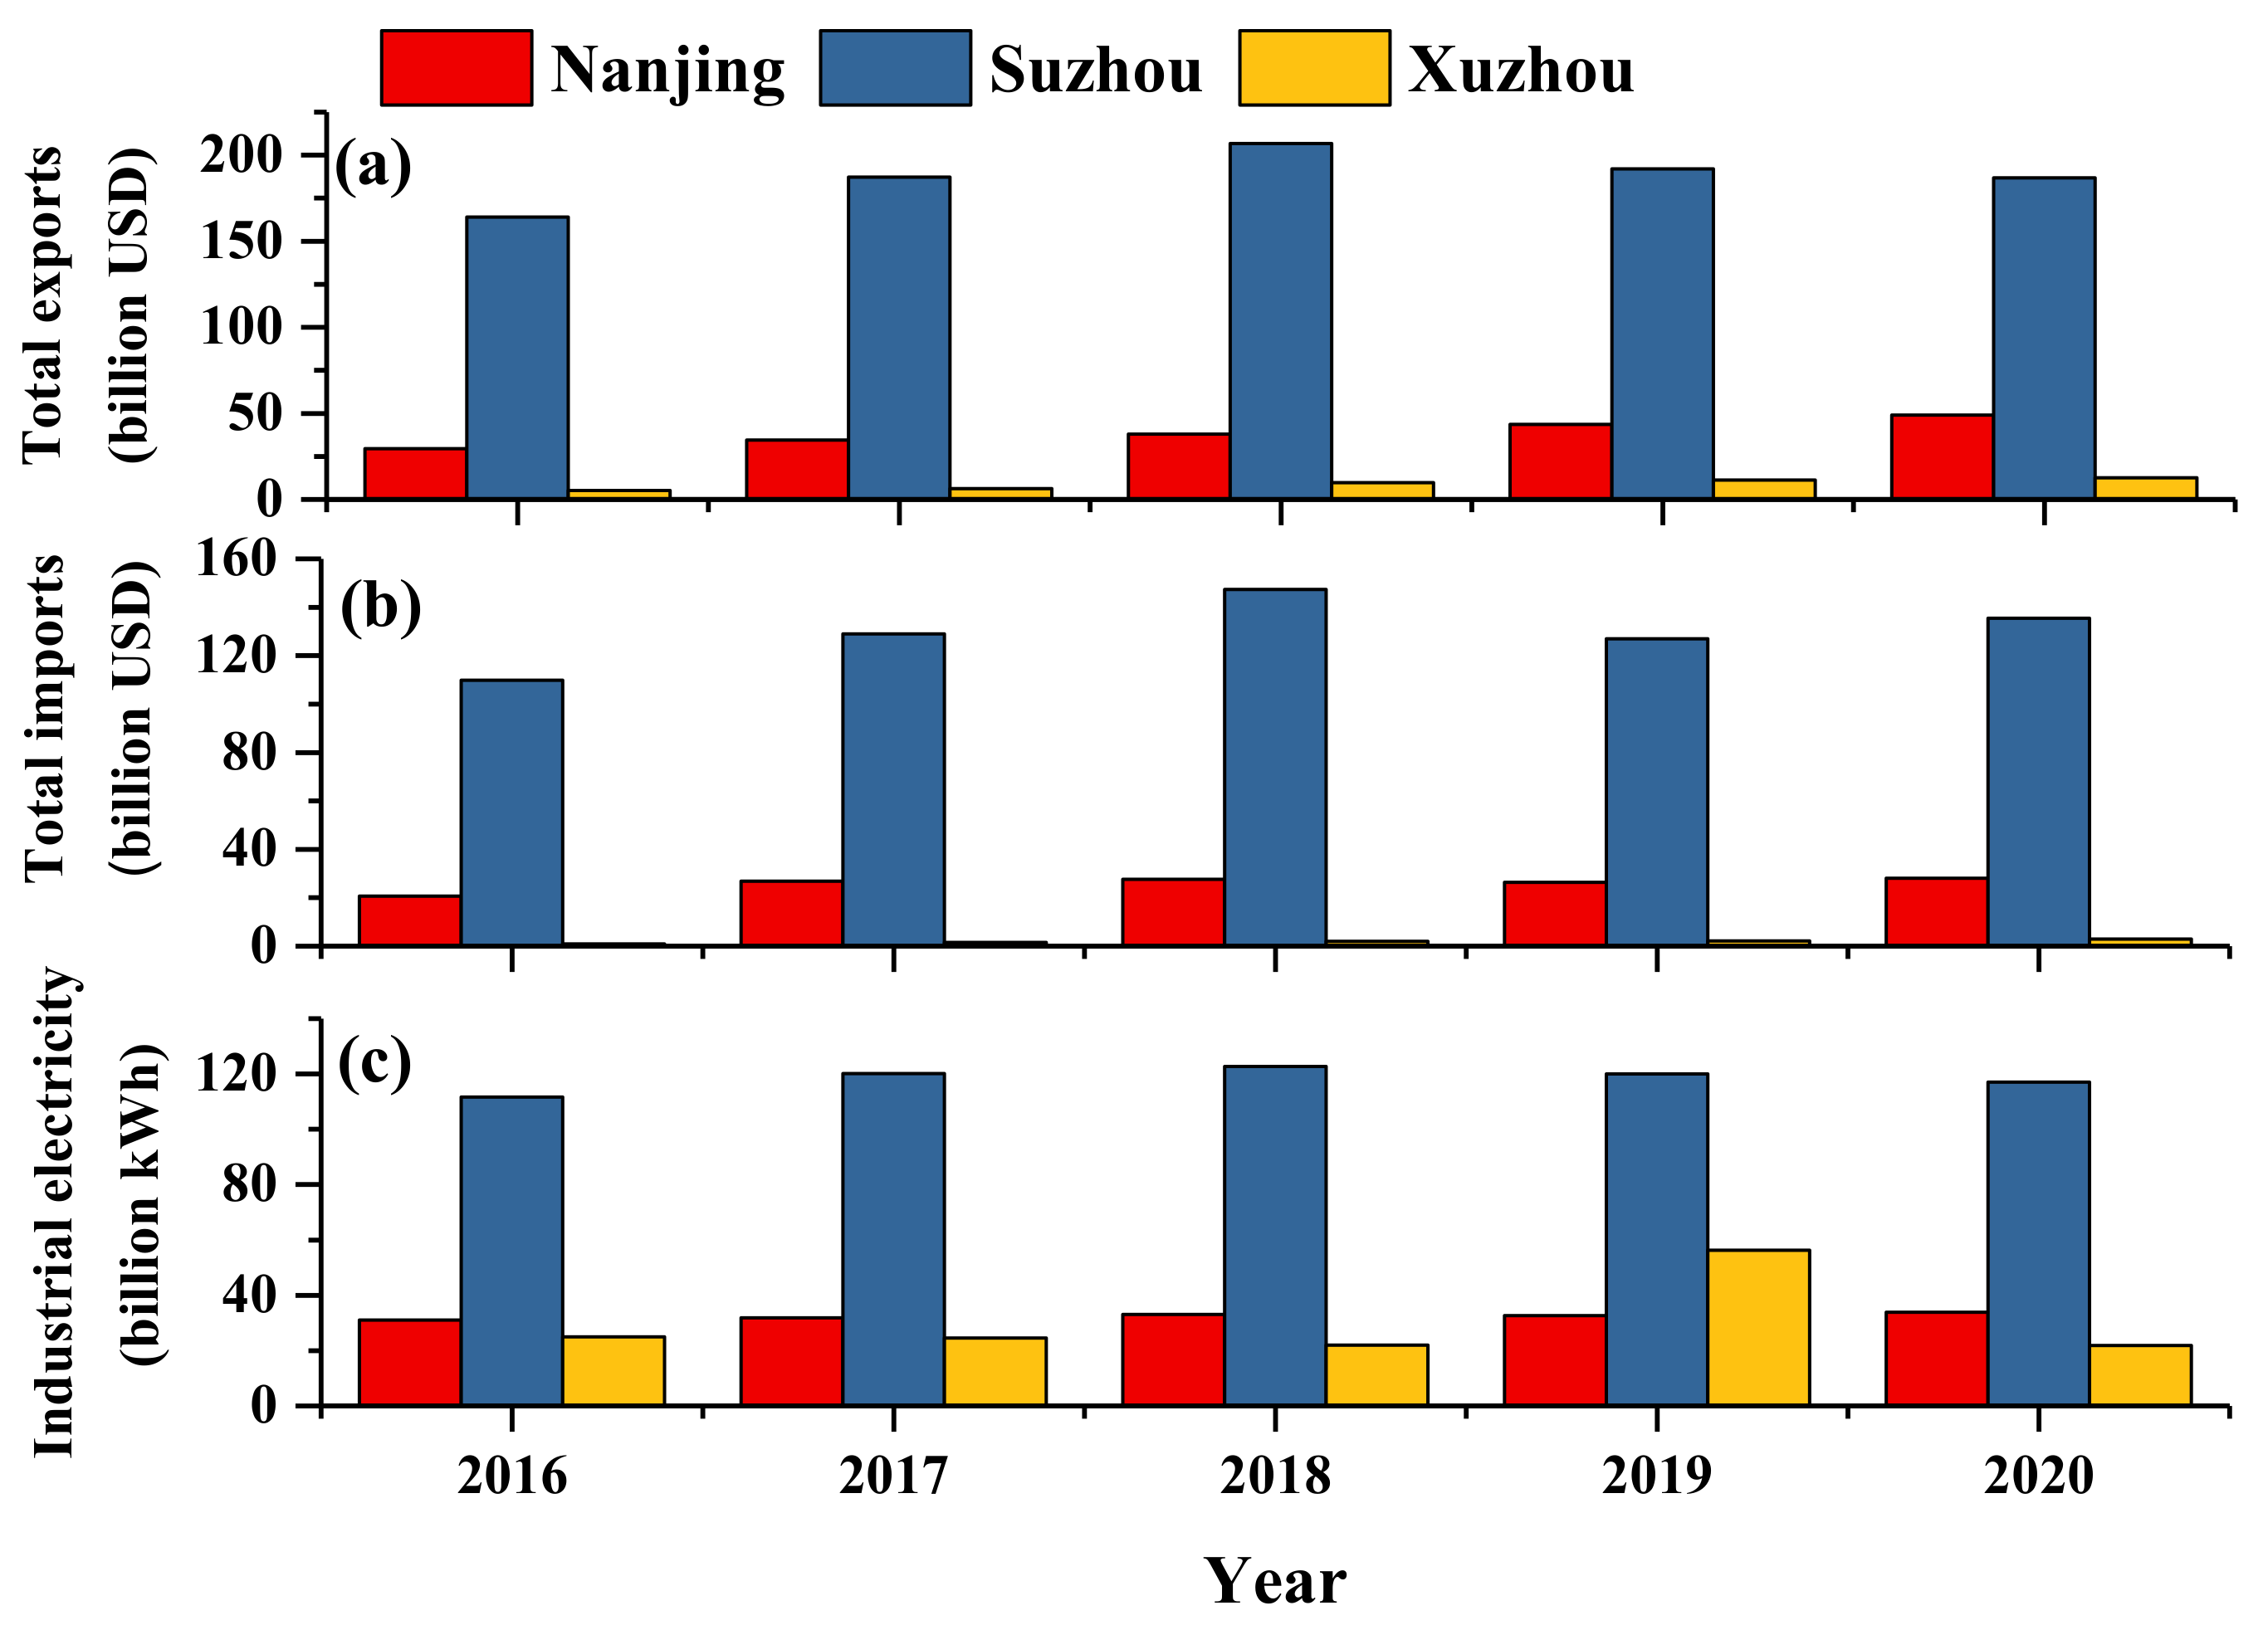
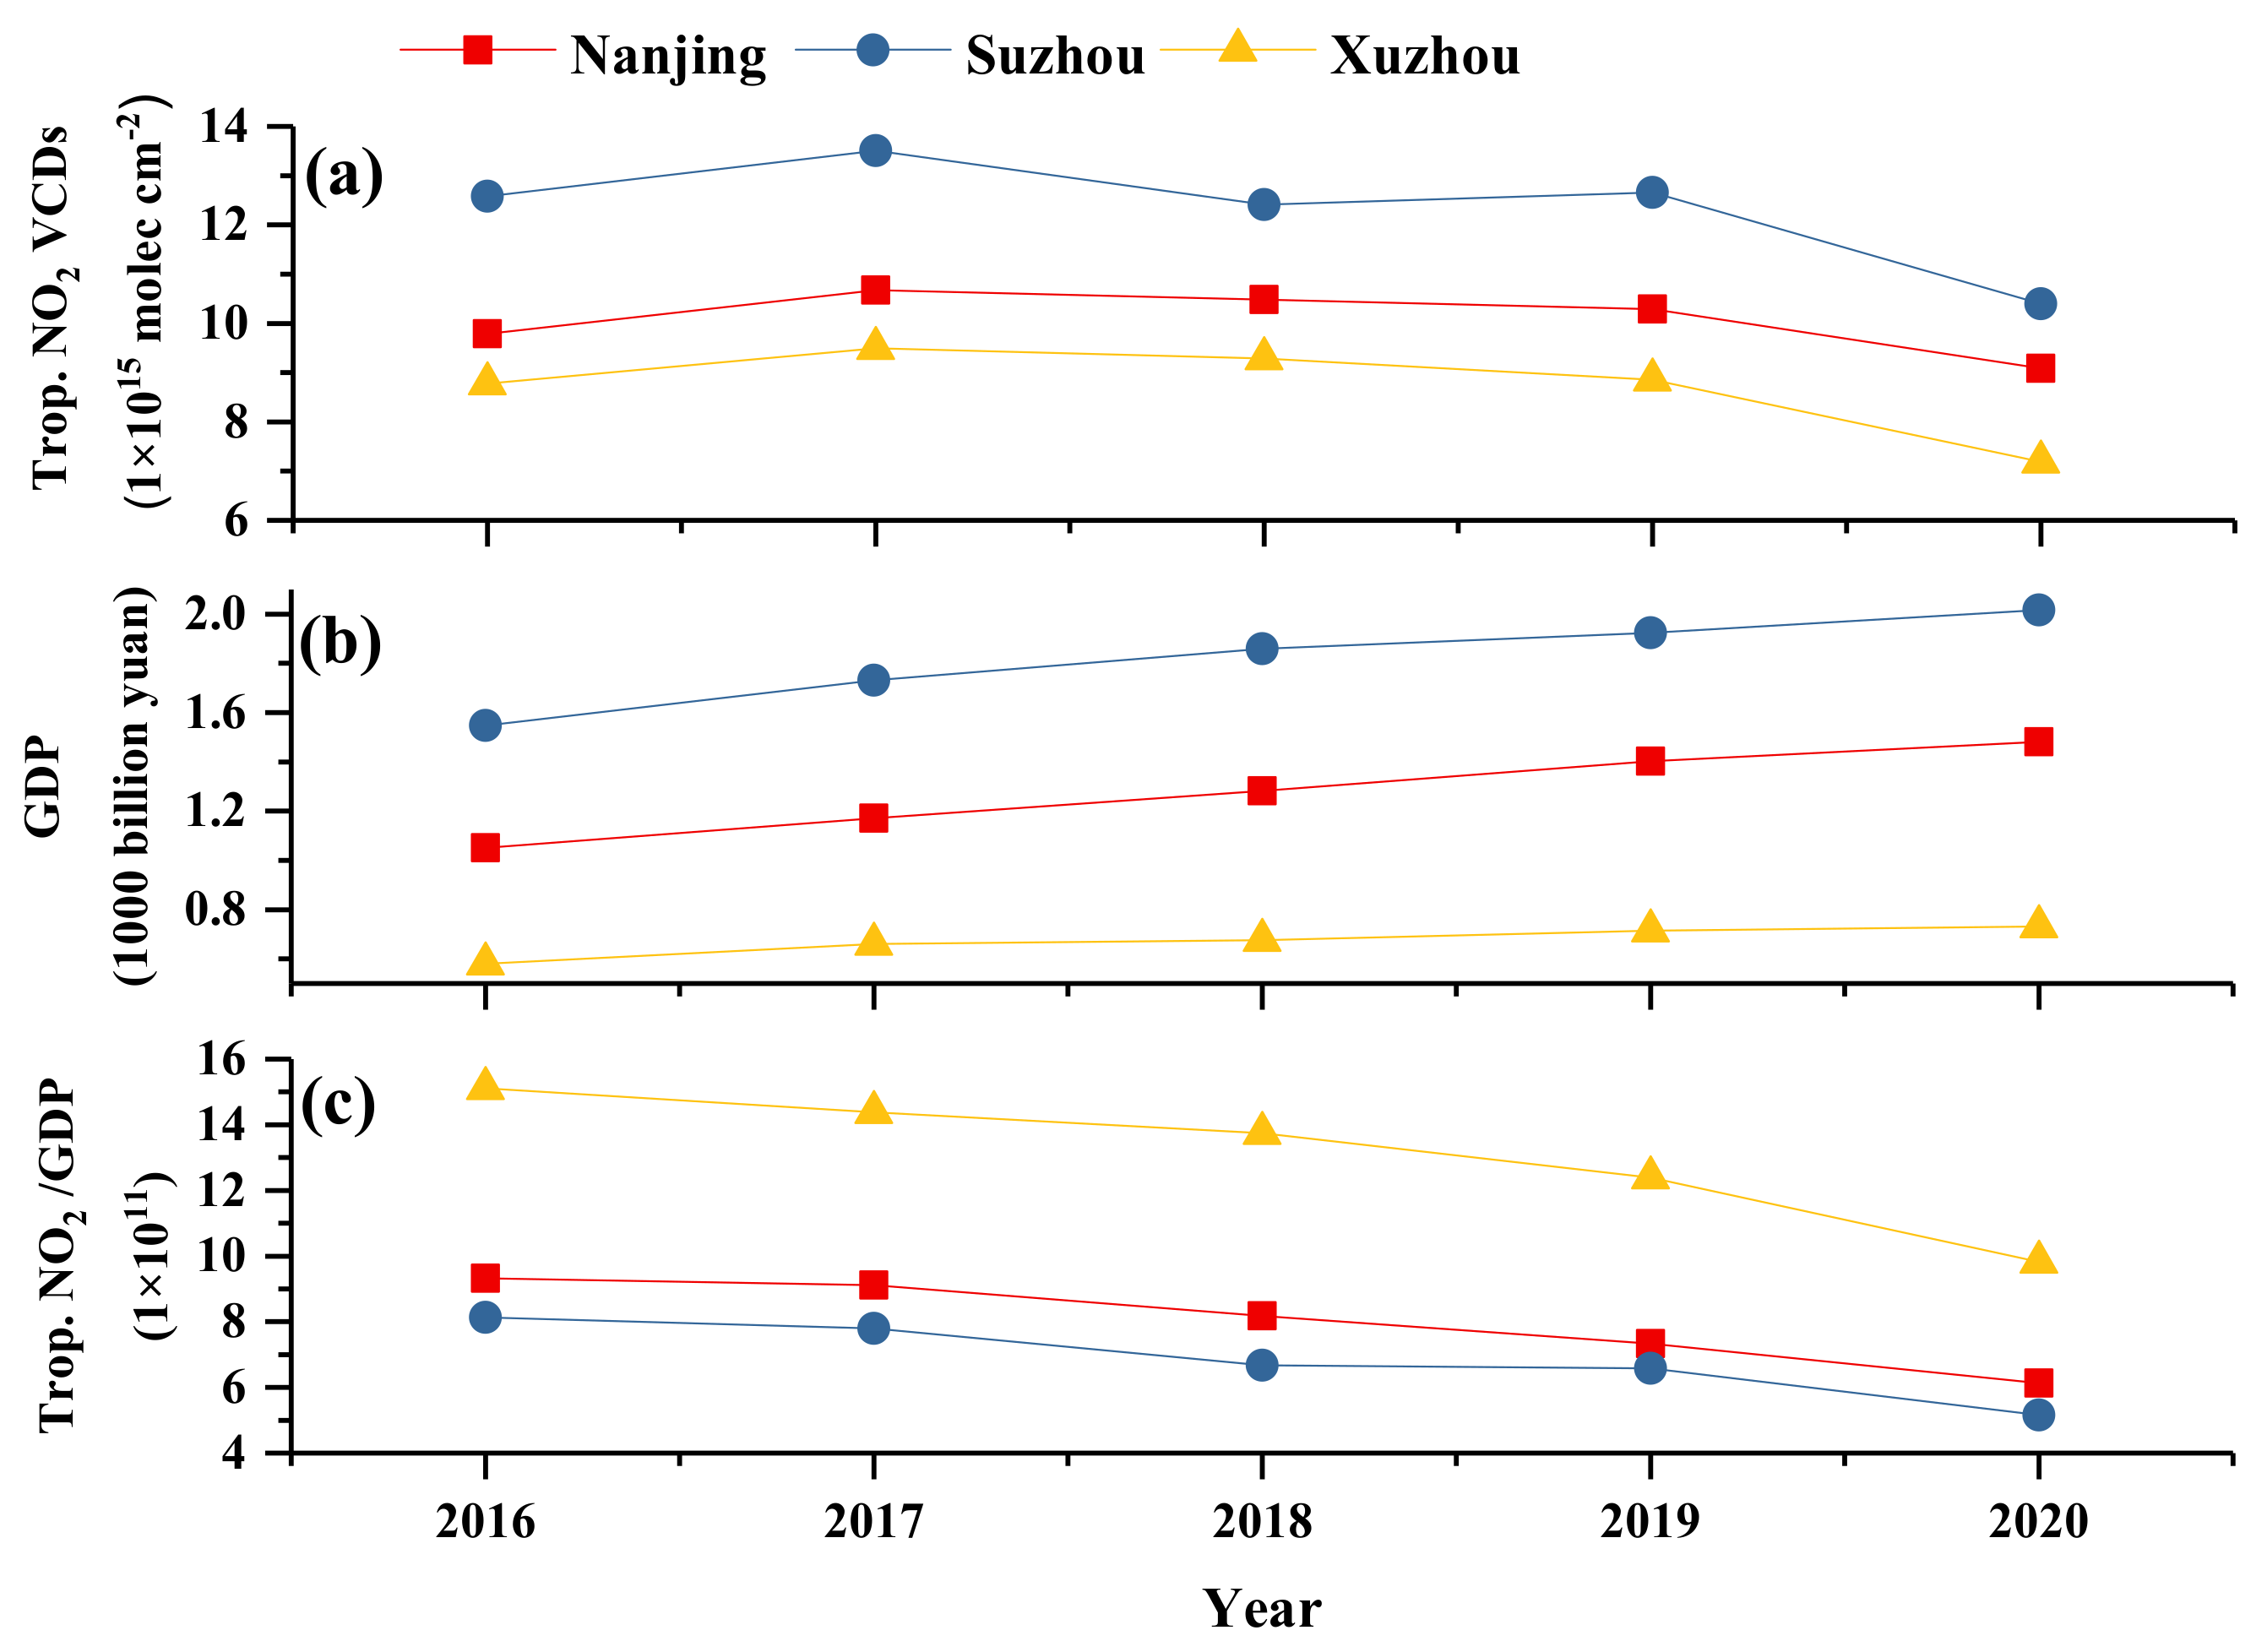
3.2. Annual Variation Characteristics of Tropospheric NO2 VCDs and Economic Indicators

The annual variations of tropospheric NO2 VCDs, gross domestic product (GDP), and the ratio of tropospheric NO2 VCDs to GDP are shown in Figure 3. Figure 3a shows the annual average of tropospheric NO2 VCDs in each city from 2016 to 2020, where the value changed from (9.09 to 10.67) × 1015, (10.39 to 13.50) × 1015, and (7.19 to 9.50) × 1015 molec. cm−2 for Nanjing, Suzhou, and Xuzhou, respectively. Generally, the tropospheric NO2 VCDs peaked in 2017, and then began to decrease year by year, especially in 2020 compared with 2019. COVID-19 began to spread in early 2020, and then a series of epidemic prevention and control policies were implemented. For example, locking down, restricting travel, stopping production, and other measures were carried out in different cities, which led to a significant reduction in direct pollution emissions [58]. Figure 3b shows the GDP in each city from 2016 to 2020, which changed from 1050.302 to 1481.795, 1547.509 to 2017.045, and 580.852 to 731.977 billion CNY for Nanjing, Suzhou, and Xuzhou, respectively. The GDP of each city increased year by year, even if the growth rate slowed down. Despite the tough roadblocks, the GDP of each city in 2020 was still higher than in 2019, and Suzhou’s GDP exceeded 2000 billion CNY for the first time. The ratio of yearly average tropospheric NO2 VCDs to GDP of each city from 2016 to 2020 is shown in Figure 3c. The ratio can be used to indicate the pollution emissions per unit GDP. Generally, the ratio of NO2 to GDP for these three typical cities decreased with time. The ratio of Suzhou was the lowest, the ratio of Nanjing was close to that of Suzhou but higher, and the ratio of Xuzhou was the highest. It can be seen that Suzhou had the lowest pollution emissions of per unit GDP, and its industrial structure was relatively reasonable. In addition, Xuzhou had the highest pollution emissions per unit GDP, so it is necessary to further optimize its industrial structure.
Figure 4a shows the annual average of total exports from 2016 to 2020 of the three typical cities, and the total exports changed from 29.592 to 49.114 billion USD, 163.941 to 206.831 billion USD, and 5.254 to 12.485 billion USD, for Nanjing, Suzhou, and Xuzhou, respectively. From 2016 to 2018, the total exports of Suzhou increased year by year, reached the peak in 2018, and then began to decrease year by year. The total exports of Nanjing and Xuzhou increased year by year from 2016 to 2020. There was a decline in Suzhou’s total exports in 2019–2020, which was significantly influenced by the changes in the international trade situation and the outbreak of COVID-19. Furthermore, the inverted U-shaped curve of Suzhou’s total exports also shows that Suzhou’s industrial structure was greatly adjusted in recent years. In general, the export trade of Suzhou was very developed; the five-year average of Suzhou’s total exports from 2016 to 2020 was 4.82 times that of Nanjing and 20.79 times that of Xuzhou. Figure 4b shows the annual average of the total imports from 2016 to 2020 of the three typical cities, and the total imports change of 20.620–28.065 billion USD, 109.817–147.283 billion USD, and 0.994–2.948 billion USD for Nanjing, Suzhou, and Xuzhou, respectively. Similar to the variations in total exports, the total imports of Suzhou increased from 2016 to 2018, peaked at 2018, and then decreased in 2019 and 2020. The five-year average of Suzhou’s total imports from 2016 to 2020 was 5.00 times that of Nanjing and 67.03 times that of Xuzhou. Figure 4c shows the annual average of industrial electricity consumption from 2016 to 2020 of the three typical cities; the industrial electricity consumption changed from 31.081 to 33.888 billion kWh, 111.630 to 122.777 billion kWh, and 21.917 to 56.331 billion kWh, for Nanjing, Suzhou, and Xuzhou, respectively. The variation in industrial electricity consumption of Suzhou showed an inverted U-shaped pattern, which increased year by year from 2016 to 2018 and decreased year by year from 2018 to 2020. The five-year average of Suzhou’s industrial electricity consumption from 2016 to 2020 is 3.64 times that of Nanjing and 3.95 times that of Xuzhou, which indicated that Suzhou’s industrial activities were more active.

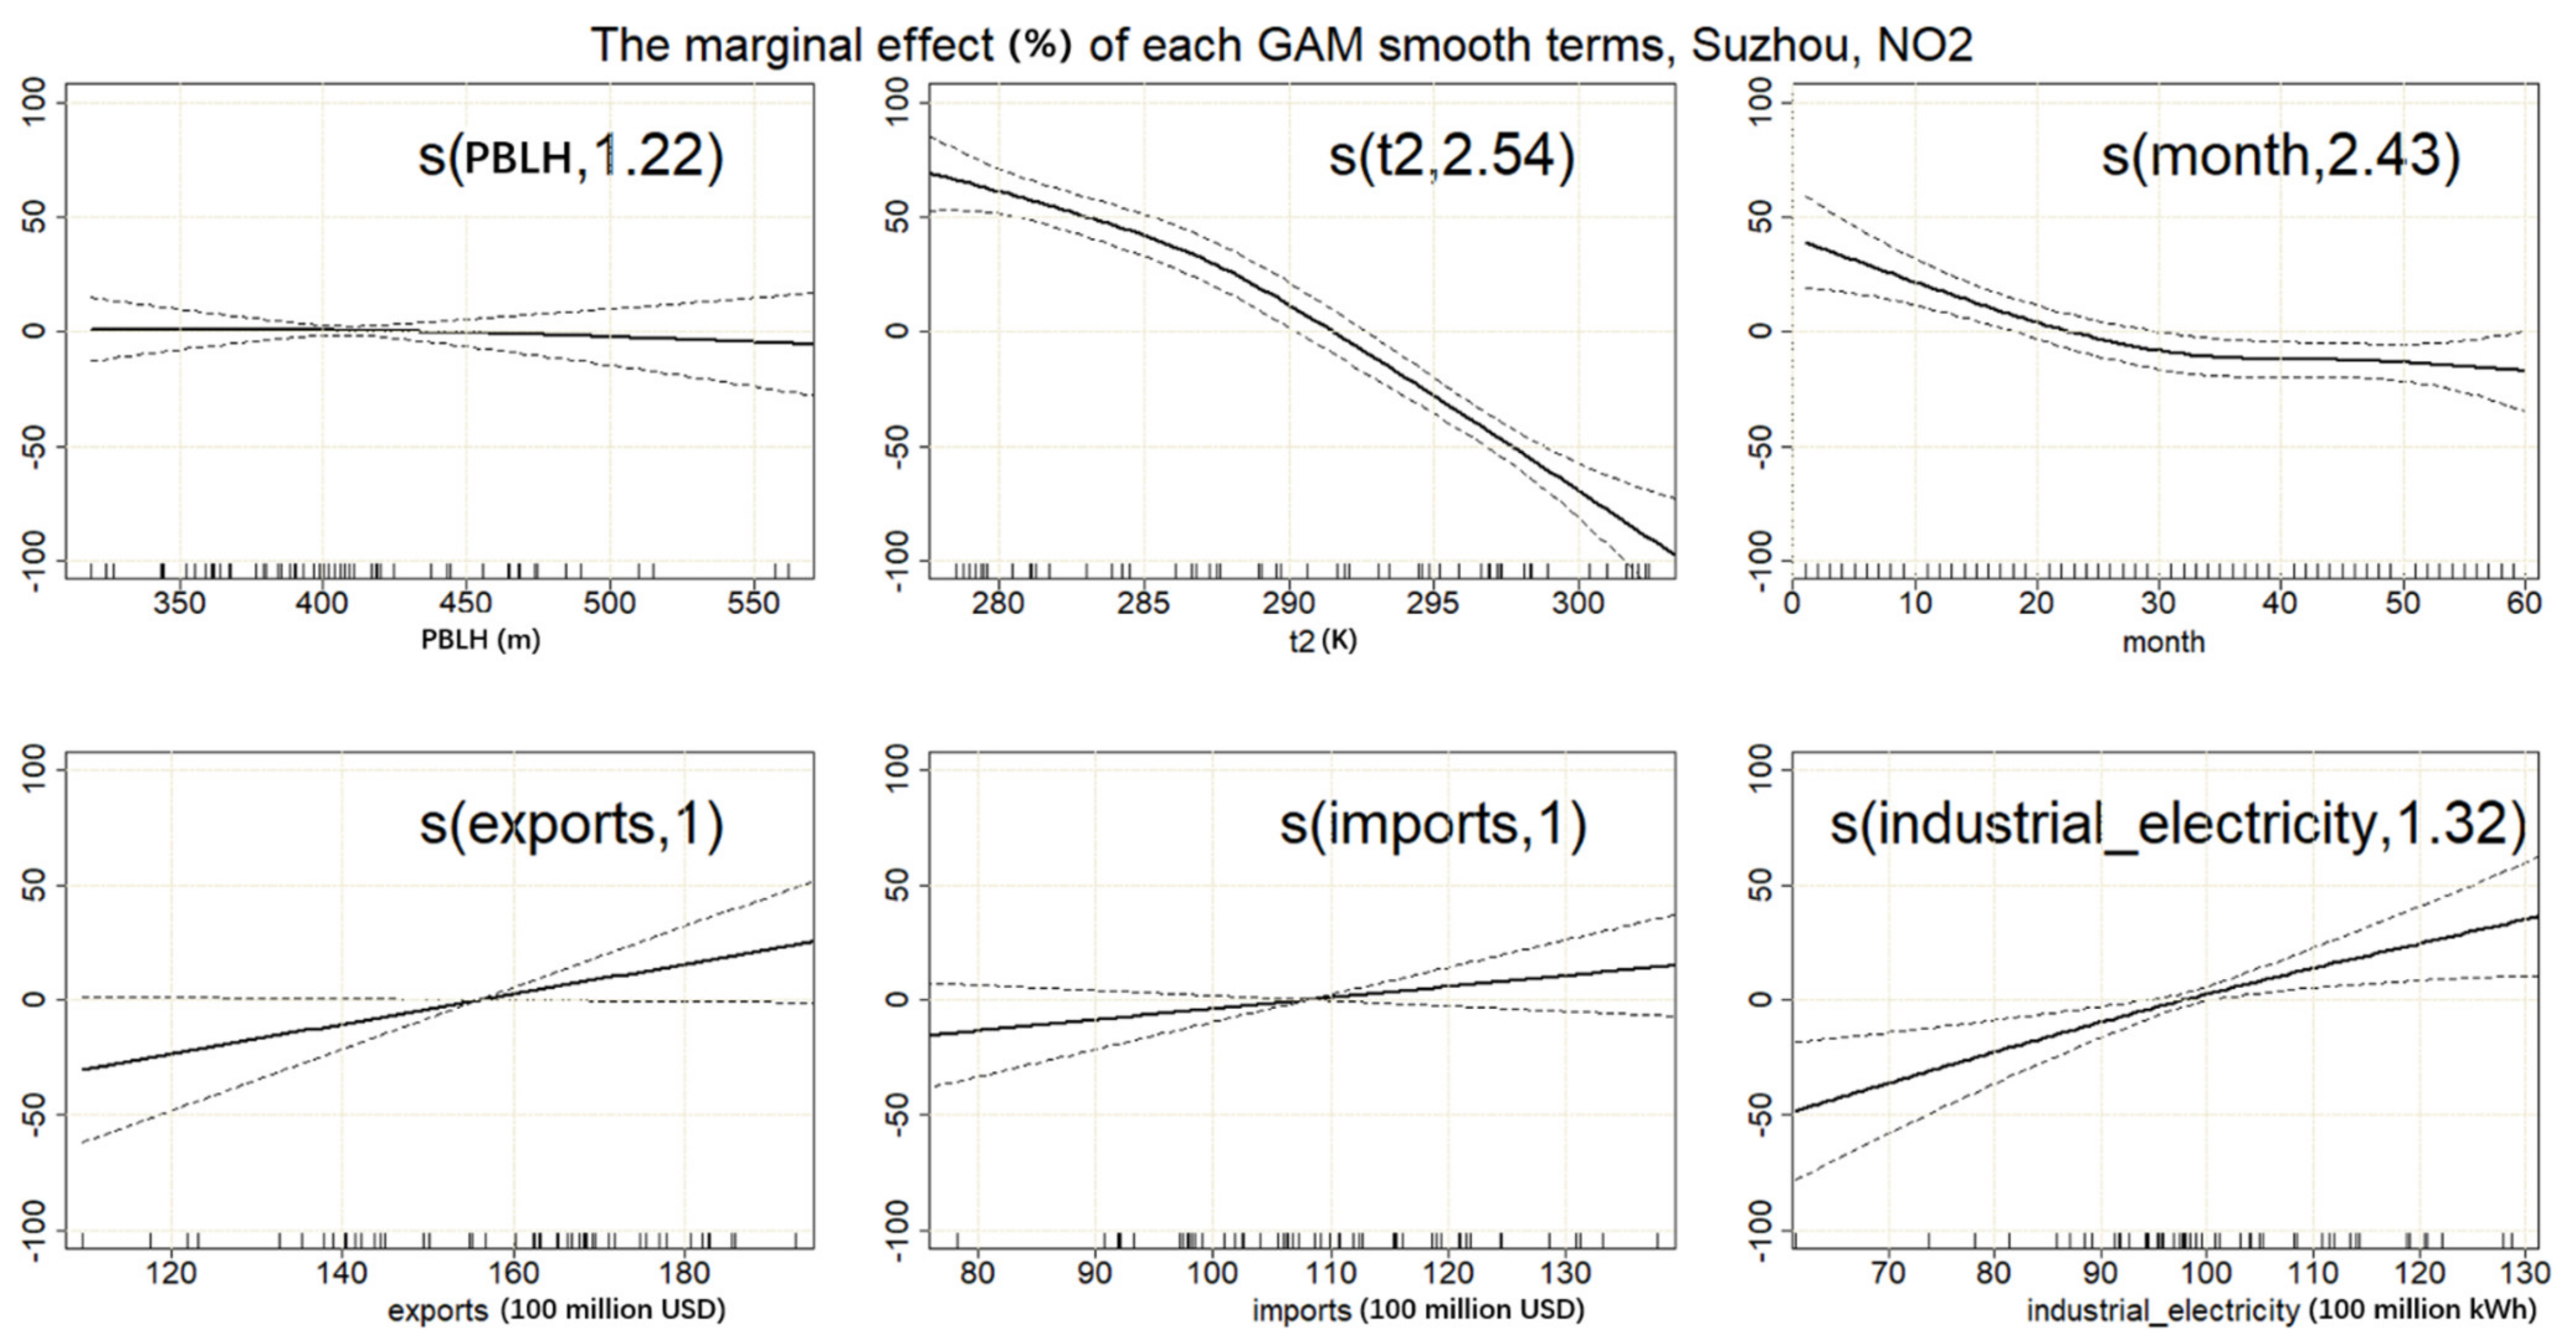
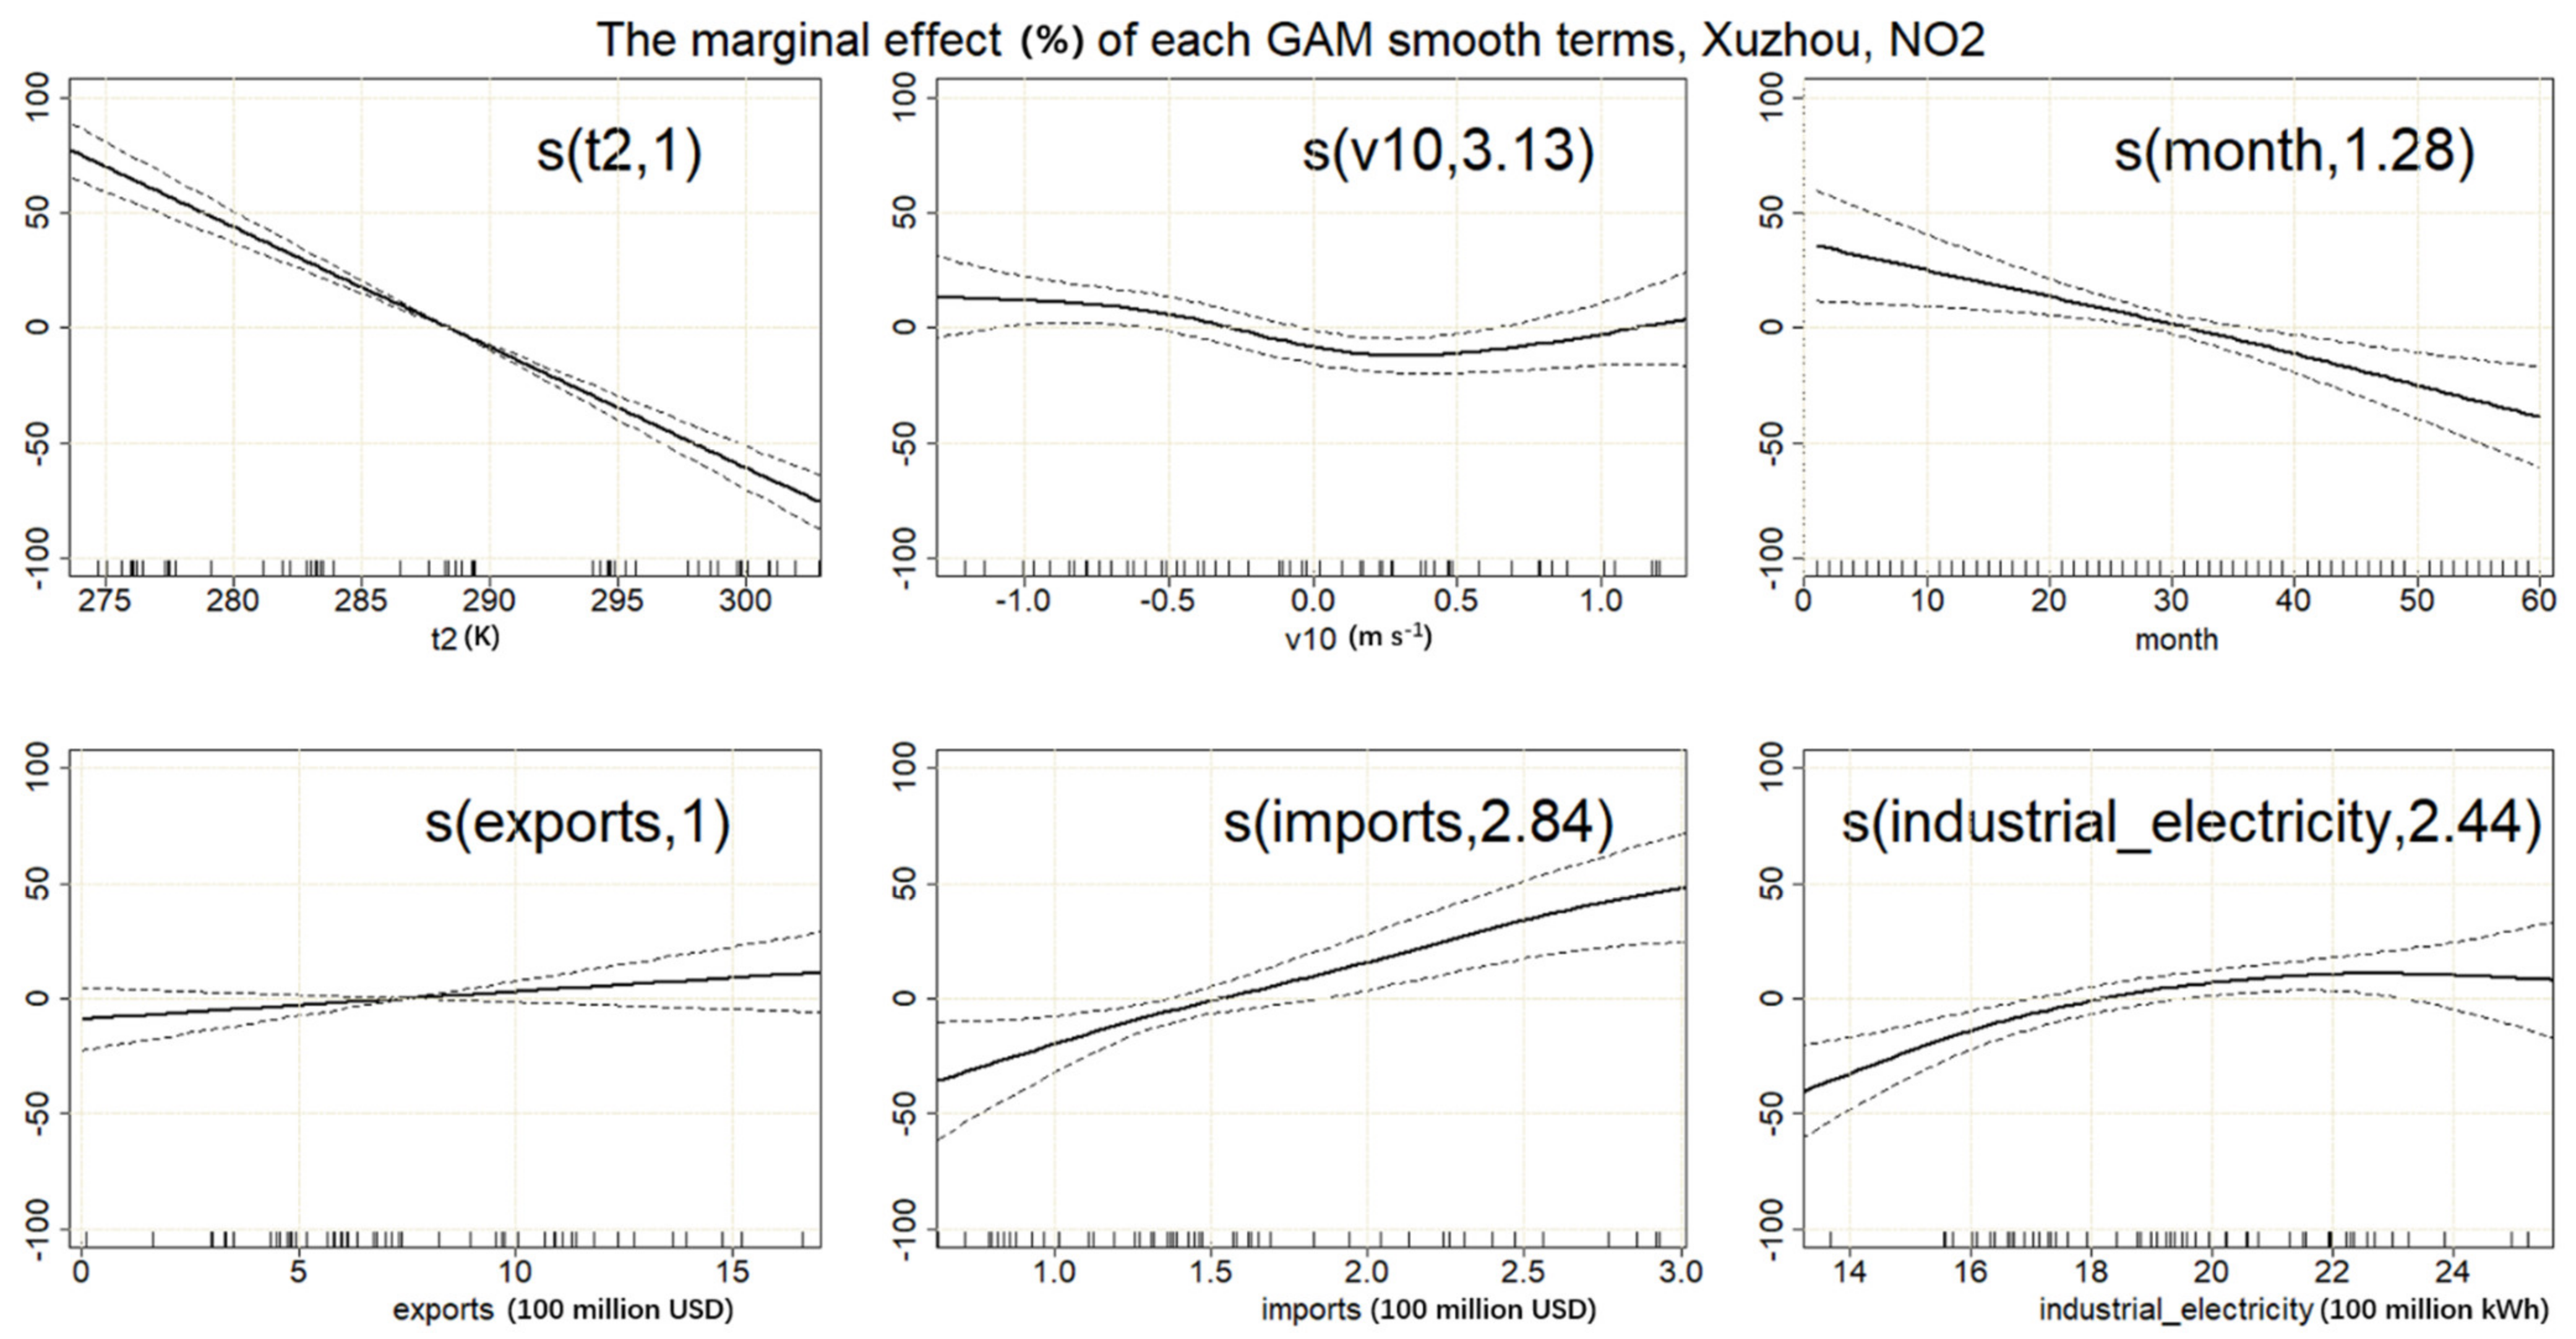
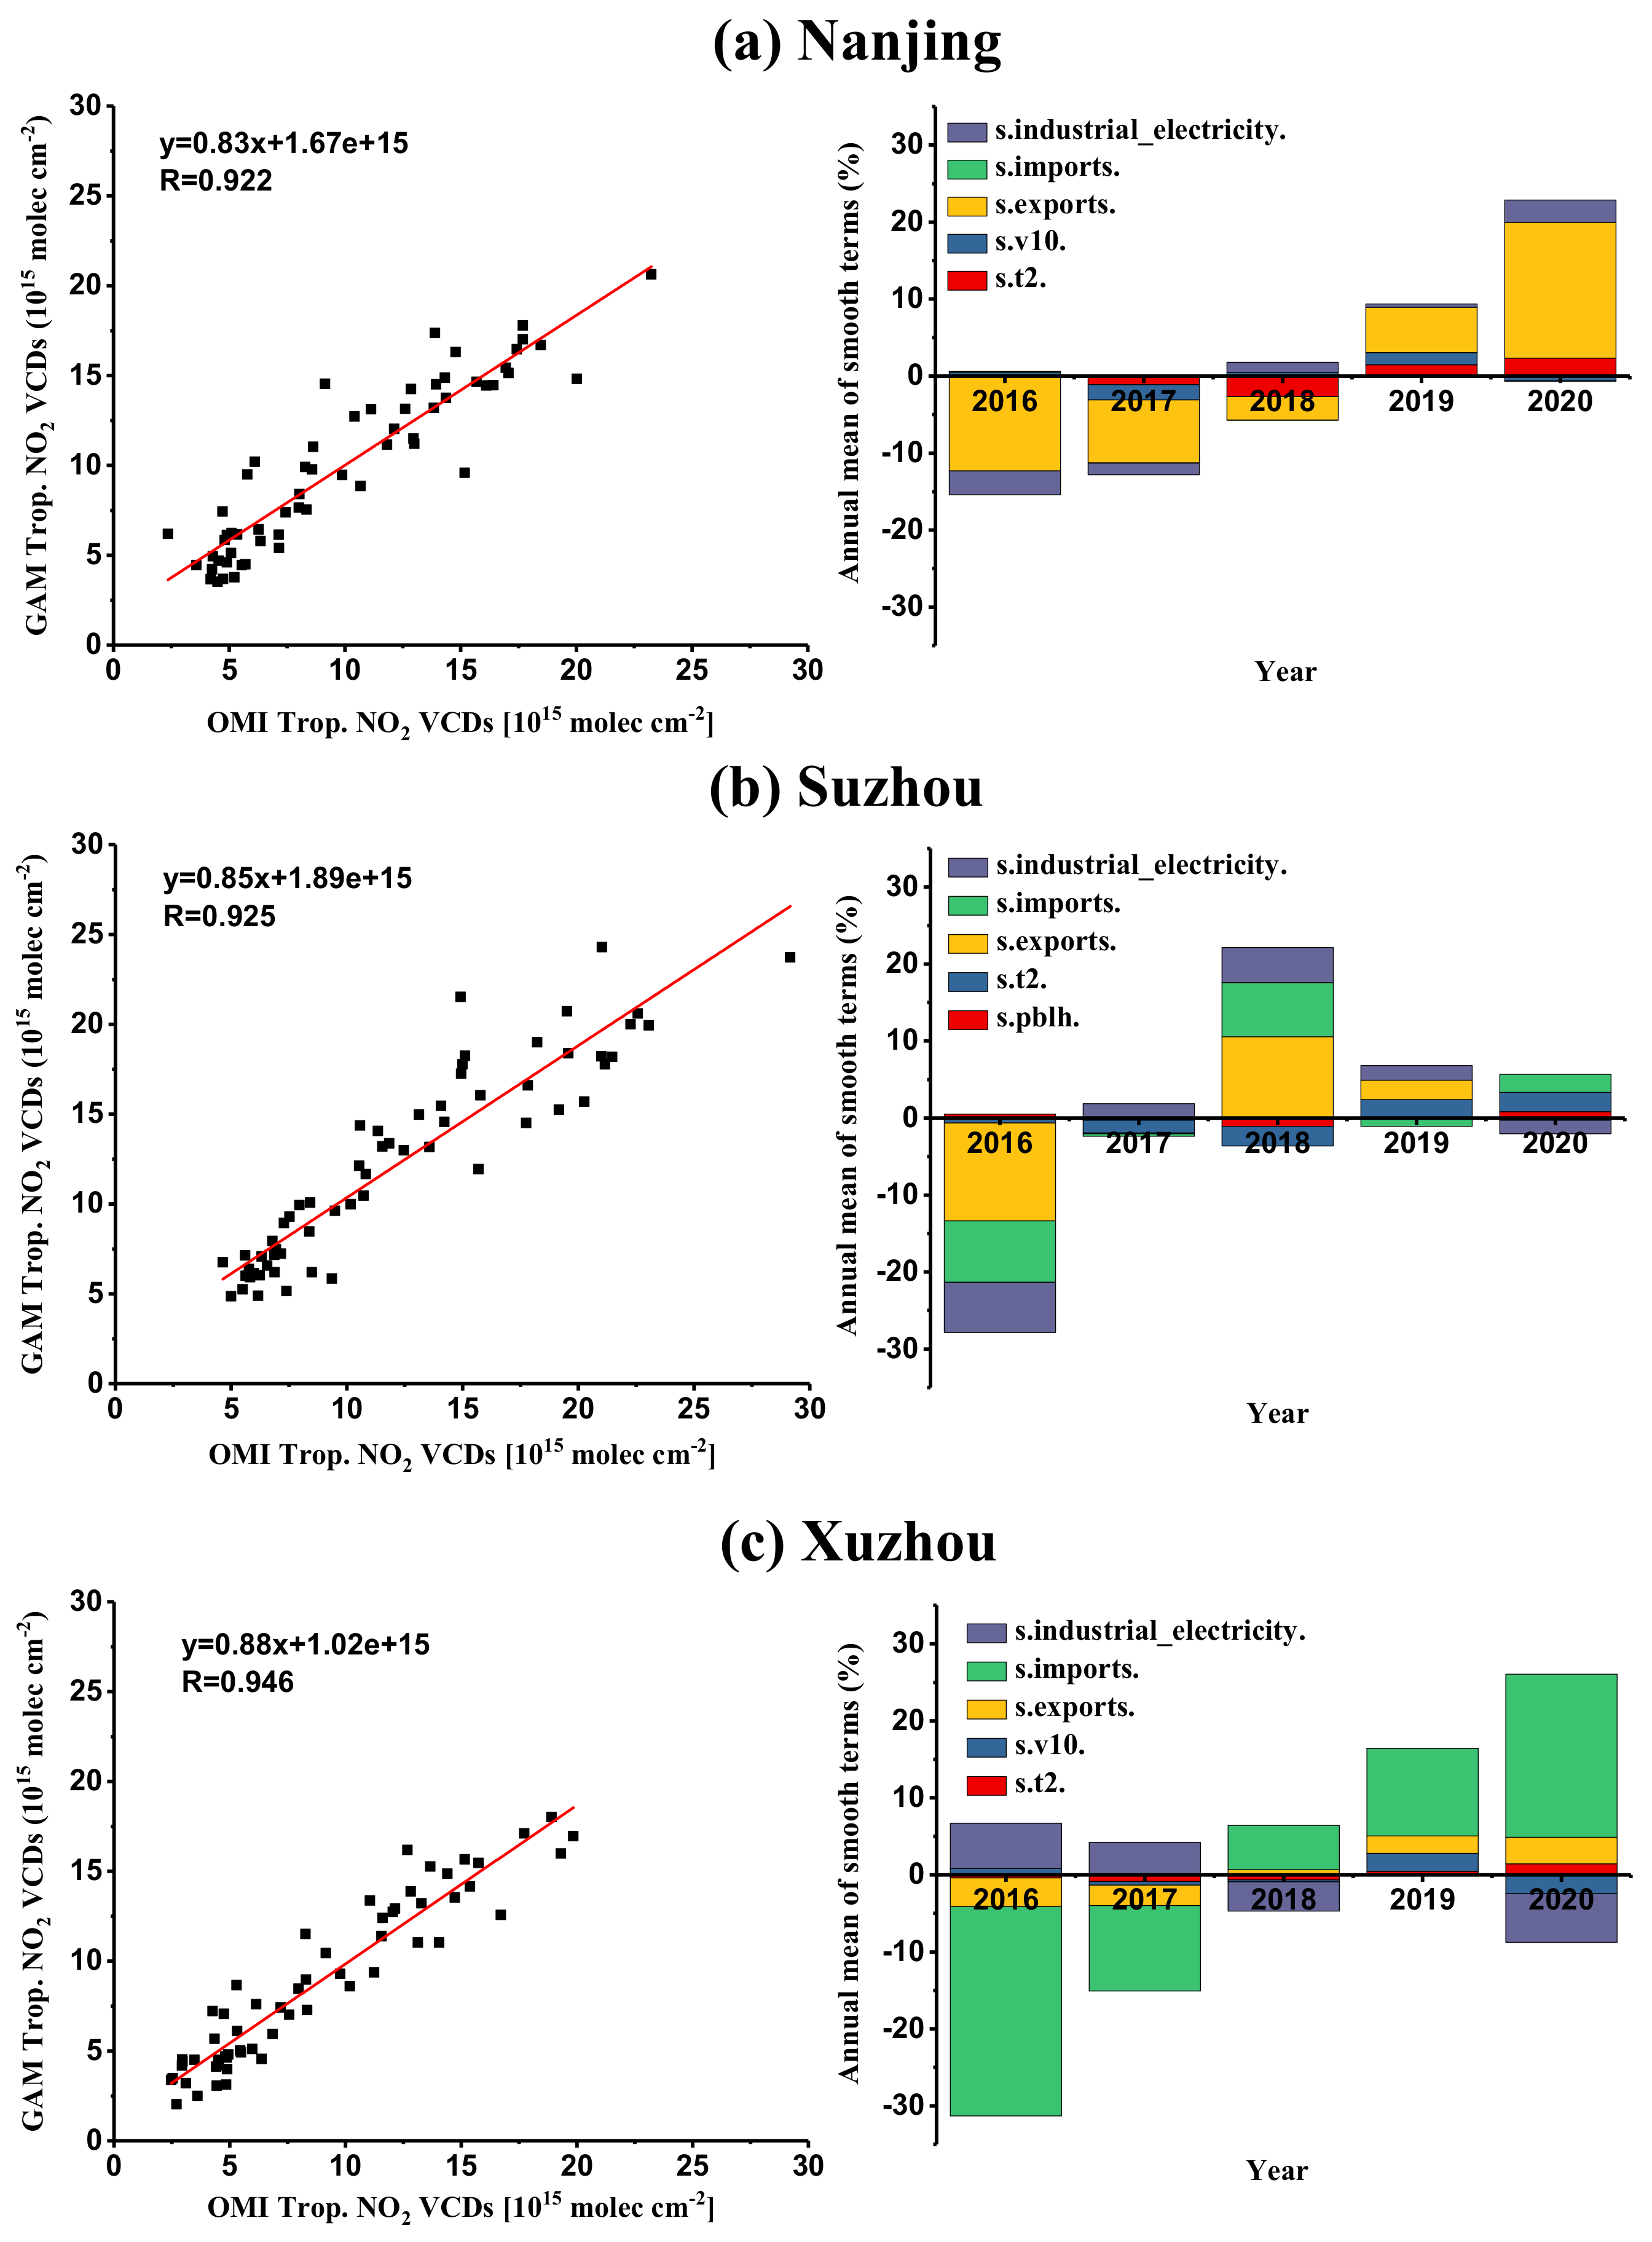
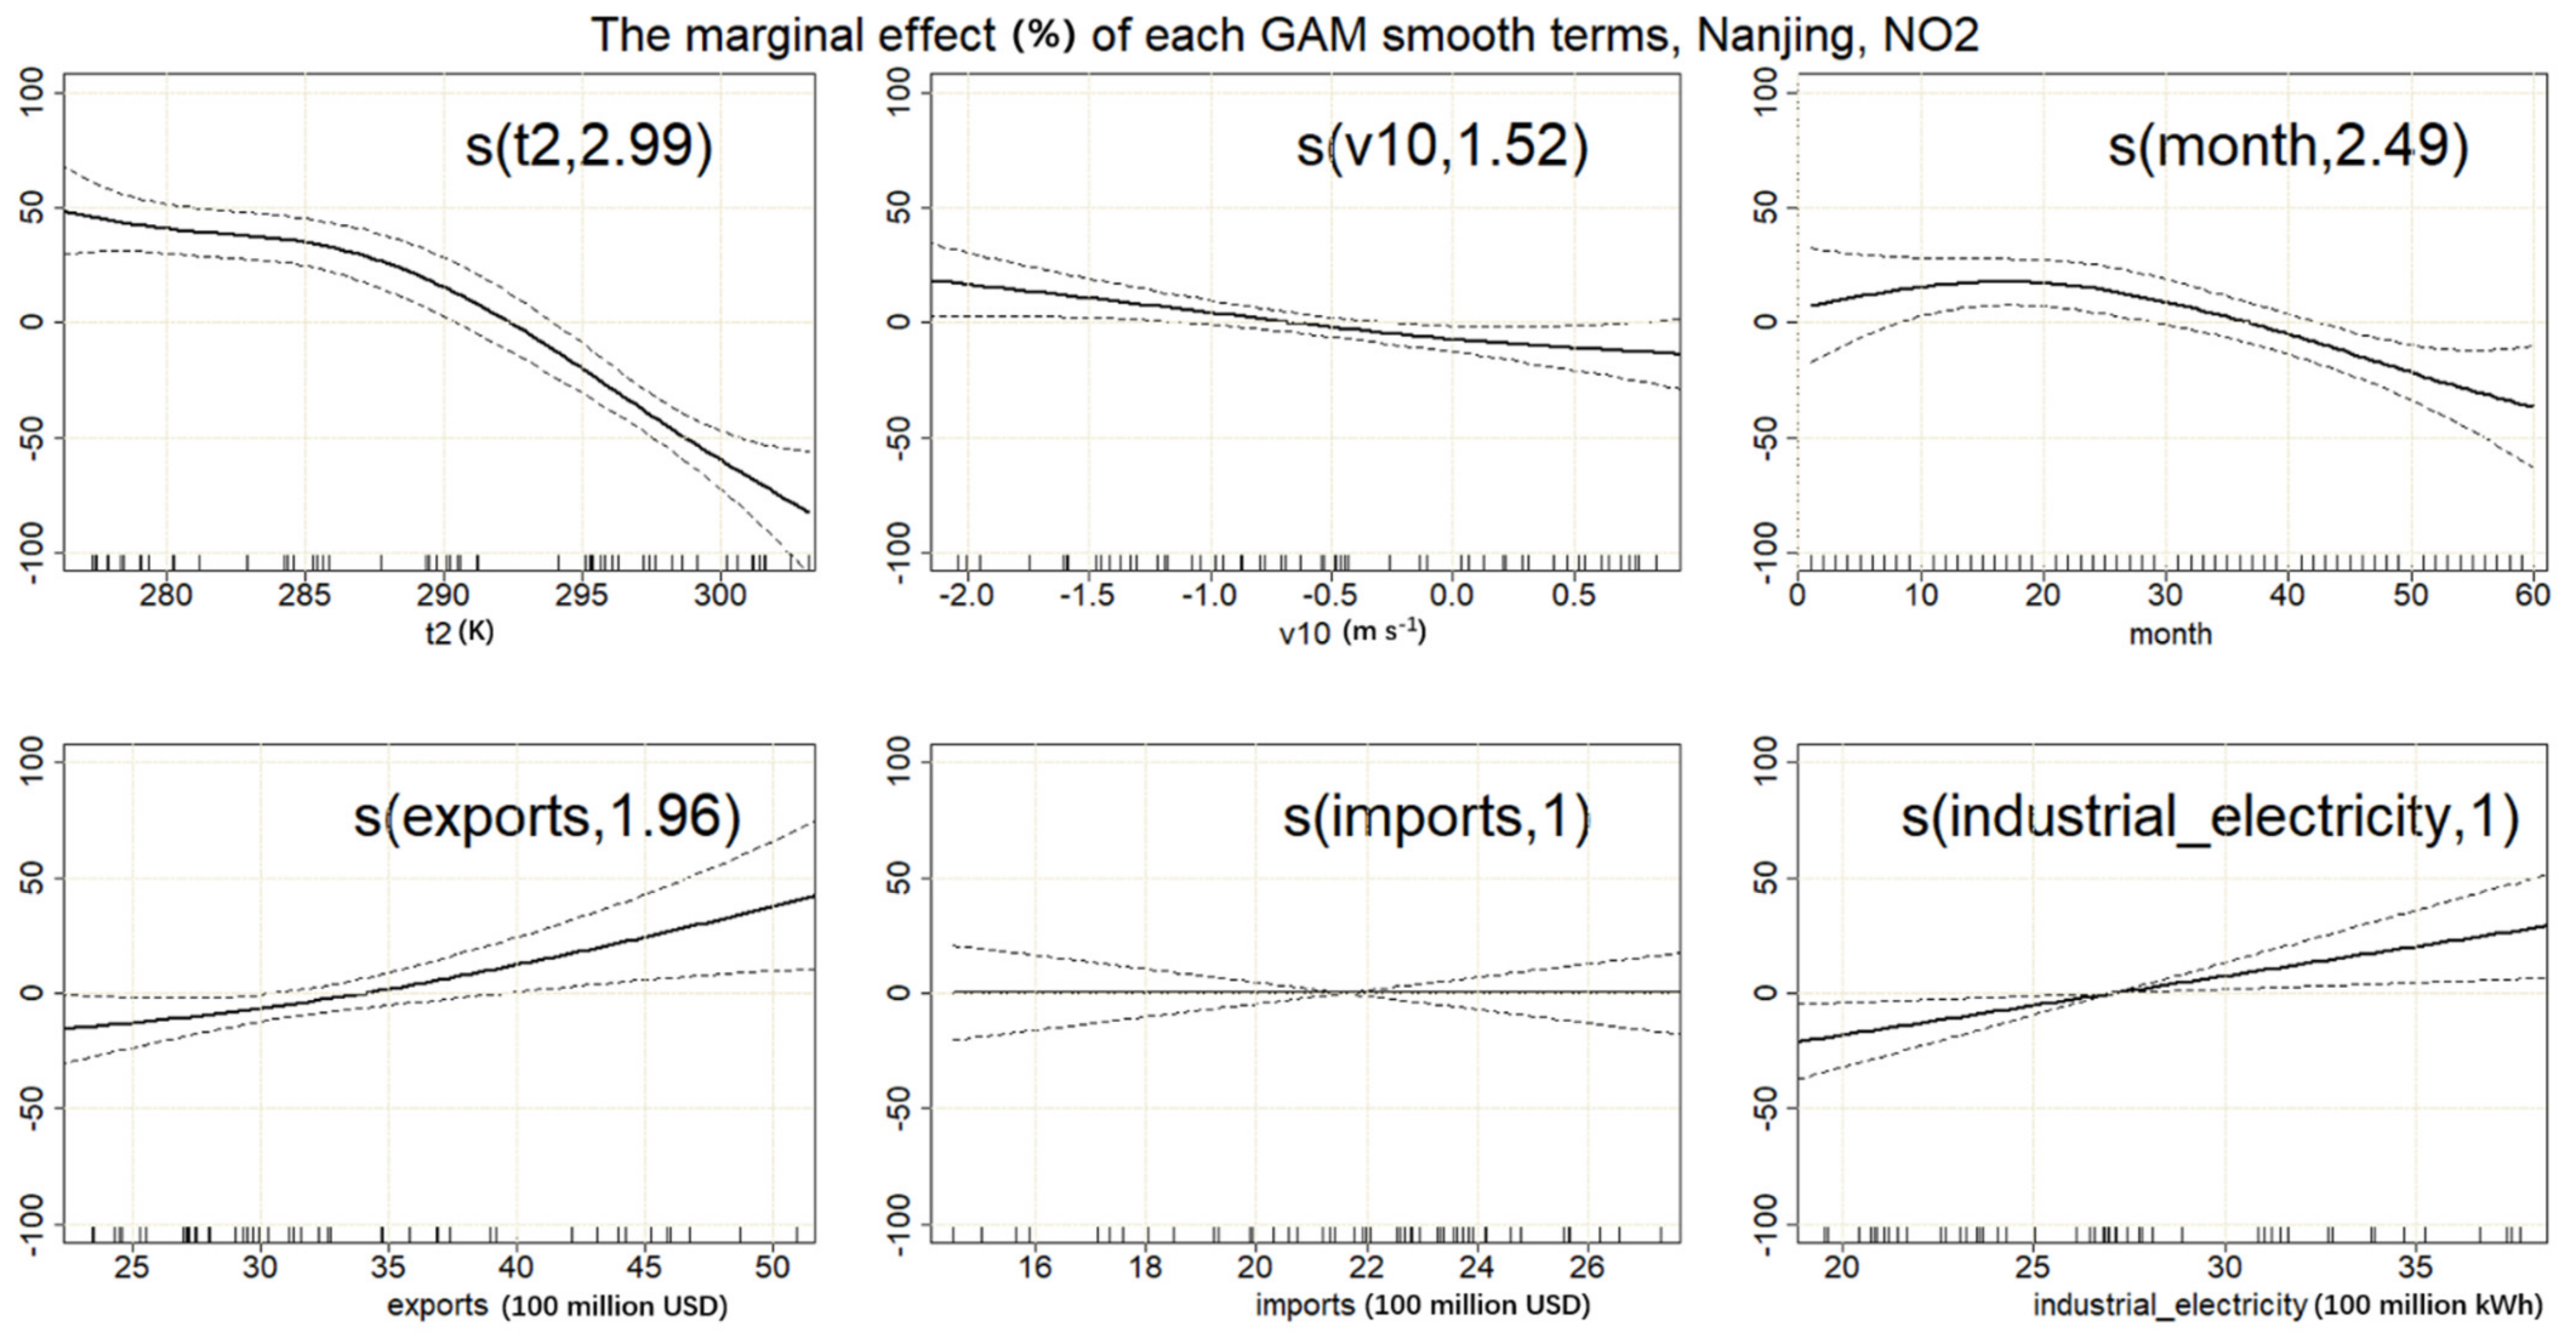
3.3. The Relationship between Economic Indexes and Air Quality Factors

In the GAM analysis of Nanjing, t2, v10, month, exports, imports, and industrial electricity (see Table 1) are used as explanatory variables, and NO2 VCDs is used as the response variable. The marginal effect of the meteorological factors and economic indexes on tropospheric NO2 VCDs of Nanjing is shown in Figure 5. The tropospheric NO2 VCDs fitted by the GAM model were in good agreement with those observed by OMI, and their correlation analysis slopes and Pearson correlation coefficients were 0.83 and 0.922, respectively (detailed in Section 4). As seen in the top row of Figure 5, the tropospheric NO2 VCDs decreased with the increase of temperature and wind speed, both of which are favorable for the diffusion of pollutants. In addition, the tropospheric NO2 VCDs first increased and then decreased with time, which is consistent with the effective implementation of emission reduction measures by government departments. The lower part of Figure 5 shows the relationship between economic indexes and the tropospheric NO2 VCDs. The tropospheric NO2 VCDs of Nanjing increased with the increase of total exports. When total exports increased from 2.5 billion USD to 3.5 billion USD (one billion USD), the tropospheric NO2 VCDs increased by about 15%, and when the total exports exceeded 3.5 billion USD, the tropospheric NO2 VCDs increase rate increased slightly. In terms of commodity composition, the exports mainly consist of machinery, electronic products, electrical equipment and parts, textiles and textile articles, base metals and articles of base metal, plastics and articles thereof, rubber and articles thereof, products of the chemical or industries, and so on. The processing and production of all these items directly or indirectly releases NO2 pollution into the atmosphere, which has a negative impact on the atmospheric environment. The improvement trade is one of the main forms of trade, which refers to the production and business activities in which enterprises import some or all of the raw and auxiliary materials, parts, components, and packaging materials, and re-export industrial products after processing or assembly. Although the rapid development of the processing trade has promoted economic development, there are also many problems in the development of this trade, such as low industrial level, low product grade, restriction of resource factors, and especially the destruction of the regional environment. In recent years, government departments has attached importance to high-quality development and has continuously promoted the transformation and upgrading of the processing trade. The proportion that the processing trade contributed to the total export trade of Nanjing increased from 29.12% in 2016 to 31.58% in 2017, and then it decreased year by year from 2018 to 2020, when it was 24.34%, 21.71%, and 21.15%, respectively. There is no obvious relationship between the total imports and the tropospheric NO2 VCDs of Nanjing. The imported products are not produced in China and do not contribute directly to air pollution. Moreover, the import impact may be indirectly transmitted to the export or other data. Additionally, from Figure 5 we can see there was a positive correlation between the industrial consumption of electricity and the tropospheric NO2 VCDs. When the industrial electricity consumption increased from 2 to 3 billion kWh (one billion kWh), tropospheric NO2 VCDs increased by about 25%. The increase of industrial electricity consumption requires increasing fossil fuel combustion for power generation. In addition, the increase of industrial electricity consumption also indicates that industrial activities are active. Both these aspects will aggravate environmental pollution and lead to more NO2 emissions in the atmospheric environment.
The PBLH, t2, month, exports, imports, and industrial electricity (see Table 1) were used as explanatory variables, and NO2 VCDs was used as the response variable to conduct the GAM analysis for Suzhou. Figure 6 shows the marginal effect of meteorological factors and economic indexes on tropospheric NO2 VCDs of Suzhou. The correlation analysis between the tropospheric NO2 VCDs fitted by the GAM model and that observed by OMI performed well, with the slopes and Pearson correlation coefficients being 0.85 and 0.925, respectively (detailed in Section 4). As shown in the upper part of Figure 6, the tropospheric NO2 VCDs decreased with the increase of PBLH and temperature, especially with the increase of temperature. The higher the PBLH, the larger the diffusion and mixing space of pollutants and the lower the concentration. Moreover, the tropospheric NO2 VCDs decreased directly with time, and the emission reduction effect was more obvious. The relationship between economic indexes and the tropospheric NO2 VCDs is shown in the lower part of Figure 6. There was a positive correlation between total exports or total imports and tropospheric NO2 VCDs; when total exports increased from 16 billion USD to 17 billion USD (one billion USD), the tropospheric NO2 VCDs increased by about 6%, and when the total imports increased from 10 billion USD to 11 billion USD (one billion USD), the tropospheric NO2 VCDs increased by about 5%. The proportion that the processing trade contributed to the total export trade of Suzhou decreased year by year, from 56.96% in 2016 to 48.95% in 2018, and then remained stable at about 50% in 2019 and 2020, and it was difficult to continue to optimize the trade structure. Machinery, electronic products, electrical equipment and parts, and textiles and textile articles are the main export commodities of Suzhou. Among them, mechanical and electrical products accounted for 77.37–79.66% of the total exports, while high-tech products accounted for 51.13–53.01% of the total exports from 2016 to 2020. The high-tech products have high added value with lower emissions compared with traditional processing industries. In addition, when the industrial electricity consumption increased from 9 billion to 10 billion kWh (one billion kWh), tropospheric NO2 VCDs increased by about 12% in Suzhou. When the industrial electricity consumption exceeded 10 billion kWh, the growth rate of tropospheric NO2 VCDs slowed down gradually. With the development of industrialization, the industrial structure has been gradually adjusted, and production methods generating heavy pollution emissions have been phased out.
For the GAM analysis of Xuzhou, the t2, v10, month, exports, imports, industrial electricity, and NO2 VCDs (see Table 1) are used as variables, and the marginal effect of the meteorological factors and economic indexes on tropospheric NO2 VCDs of Xuzhou is shown in Figure 7. The comparison of tropospheric NO2 VCDs fitted by the GAM model and that observed by OMI showed high consistency, and the correlation analysis slopes and Pearson correlation coefficients were 0.88 and 0.946, respectively (detailed in Section 4). As shown in the top row of Figure 7, the tropospheric NO2 VCDs decreased with the increase of temperature. With the change of wind speed, the tropospheric NO2 VCDs fluctuated to some extent. When the wind speed increased, the tropospheric NO2 VCD increased slightly, which may have been affected by the transportation of surrounding emissions. Similar to Nanjing and Suzhou, the tropospheric NO2 VCDs decreased with time in Xuzhou. The lower row of Figure 7 shows the relationship between economic indexes and the tropospheric NO2 VCDs. Although the magnitude of total imports and total exports of Xuzhou is low, the tropospheric NO2 VCDs increased with the increase of both total imports and total exports.
The use and reprocessing of import goods such as bituminous coal, chemical products, and metal material emit pollutants into the atmosphere, which have a negative impact on the atmospheric environment. In addition, when the industrial electricity consumption increased from 1.24 to 2.24 billion kWh (one billion kWh), tropospheric NO2 VCDs increased by about 59% in Xuzhou, and the growth rate of tropospheric NO2 VCDs slowed down gradually. Subsequently, when the industrial electricity consumption increased from 2.24 to 2.66 billion kWh, tropospheric NO2 VCDs decreased by about 4%. Similar to Suzhou, with the development of industrialization, the industrial structure has been gradually adjusted, and production methods generating heavy pollution emissions have been phased out.

4. Discussion

Although the causes of pollution are different, NO2 pollution is serious in southern and northern Jiangsu province. In this paper, Nanjing and Suzhou (typical cities in southern Jiangsu province) and Xuzhou (a typical city in northern Jiangsu province) were selected to study the relationship between economic development and air quality in Jiangsu Province. The five-year average values of tropospheric NO2 VCDs in Suzhou from 2016 to 2020 were 1.22 and 1.41 times that of Nanjing and Xuzhou, respectively. Generally, the annual average values of tropospheric NO2 VCDs of the three typical cities reached a peak in 2017 and then began to decrease year by year. Due to the influence of COVID-19, the annual average value of tropospheric NO2 VCDs in 2020 decreased significantly compared with that in 2019. The five-year average value of GDP in Suzhou from 2016 to 2020 was 1.42 and 2.70 times that of Nanjing and Xuzhou, respectively. The ratio of annual average tropospheric NO2 VCDs to GDP of each city can be used to indicate the pollution emissions per unit GDP. Normally, the ratio of Xuzhou is higher than that of Nanjing and Suzhou (Figure 5); the five-year average value of this ratio in Xuzhou from 2016 to 2020 was 1.63 and 1.91 times that of Nanjing and Suzhou, respectively. It can be seen that Suzhou has the lowest pollution emission of per unit GDP, and its industrial structure is relatively reasonable, and Xuzhou has the highest pollution emissions per unit GDP, so it is necessary to further optimize its industrial structure. In general, the export trade of Suzhou is very developed, and the five-year average of Suzhou’s total exports from 2016 to 2020 is 4.82 times that of Nanjing and 20.79 times that of Xuzhou. The five-year average of Suzhou’s total imports from 2016 to 2020 is 5.00 times that of Nanjing and 67.03 times that of Xuzhou. The five-year average of Suzhou’s industrial electricity consumption from 2016 to 2020 is 3.64 times that of Nanjing and 3.95 times that of Xuzhou, which indicates that Suzhou’s industrial activities were more active.
In addition, the tropospheric NO2 VCDs have obvious monthly variation characteristics, in that they are high in winter and low in summer. This is not only related to the variations in pollution emission intensity in different seasons, but also to the seasonal change of meteorological conditions. Therefore, it is necessary to deduct the influence of meteorological factors in the process of GAM research in order to quantify the change of air quality brought about by economic development.
In Nanjing, when total exports increased by one billion USD, the tropospheric NO2 VCDs increased by about 15%, and when the total exports exceed 3.5 billion USD, the tropospheric NO2 VCDs increase rate increased slightly. When the industrial electricity consumption increased by one billion kWh, the tropospheric NO2 VCDs increased by about 25%.
In Suzhou, there is a positive correlation between total exports or total imports and tropospheric NO2 VCDs; when total exports increased by one billion USD, the tropospheric NO2 VCDs increased by about 6%, and when the total imports increased by one billion USD, the tropospheric NO2 VCDs increased by about 5%. In addition, when the industrial electricity consumption increased by one billion kWh, tropospheric NO2 VCDs increased by about 12%.
In Xuzhou, when the industrial electricity consumption increased by one billion kWh, the tropospheric NO2 VCDs increased by about 59%, and the growth rate of tropospheric NO2 VCDs slowed down gradually.
When total exports increased by one billion USD, the tropospheric NO2 VCDs of Nanjing and Suzhou increased by about 15% and 6%, respectively. As the total exports of Suzhou is significantly higher than that of Nanjing, the relative changes of the tropospheric NO2 VCDs caused by the same increment of total exports for Suzhou is less than that in Nanjing. In addition, when the industrial electricity consumption increased by one billion kWh, the tropospheric NO2 VCDs of Nanjing, Suzhou, and Xuzhou increased by about 25%, 12%, and 59%, respectively. As the industrial electricity consumption of the three typical cities are different (see Figure 4), the relative changes of the tropospheric NO2 VCDs caused by the same increment of the industrial electricity consumption are also different. The relative change of the tropospheric NO2 VCDs in Suzhou is the smallest and that in Xuzhou is the largest.
The correlation analysis of tropospheric NO2 VCDs observed by OMI and the fitted GAM model is shown in the left panel of Figure 8. The Pearson correlation coefficients, R, are 0.922, 0.925, and 0.946 for Nanjing, Suzhou, and Xuzhou, respectively. The inter-annual variations of smooth terms explained by each variable for the three typical cities are shown in right panel of Figure 8. The smooth terms show the contribution of both meteorological and non-meteorological factors to the variation of NO2 pollution. Compared with the meteorological factors, the economic factors have a larger contribution to the change of air quality.

5. Summary and Conclusions

In this paper, we used the NASA OMI tropospheric NO2 product as the air quality indicator, the total exports, total imports, and industrial electricity consumption as the economic indicators, and the wind speed, temperature, and the planetary boundary layer height as the meteorological factors in order to conduct the GAM analysis. By deducting the influence of meteorological factors, the relationship between the economic indicators and the air quality indicator can be determined. In Nanjing, when the total exports increased by one billion USD, the tropospheric NO2 VCDs increased by about 15%, and when the industrial electricity consumption increased by one billion kWh, the tropospheric NO2 VCDs increased by about 25%. In Suzhou, when total exports increased by one billion USD, the tropospheric NO2 VCDs increased by about 6%, and when the total imports increased by one billion USD, the tropospheric NO2 VCDs increased by about 5%. In addition, when the industrial electricity consumption increased by one billion kWh, tropospheric NO2 VCDs increased by about 12%. In Xuzhou, when the industrial electricity consumption increased by one billion kWh, the tropospheric NO2 VCDs increased by about 59%. It is necessary to adjust the trade structure, reduce the proportion of the processing trade in the export trade, and increase the proportion of high-tech products in the export trade. Strengthening technological innovation and increasing the added value of finished products in the processing trade will contribute to the transformation and upgrading of this trade. In addition, it is urgent to adjust the industrial structure, phase out high energy-consuming industries, develop high-tech industries, and increase production capacity while reducing industrial power consumption. This paper provides a method to quantify the contribution of economic development to air pollution, which is useful for the government to formulate environmental protection policies and adjust the industrial and trade structure.

Author Contributions

Conceptualization, J.J. and Y.Y.; methodology, J.J., Y.Y. and S.Y.; software, J.J., Y.Y. and Q.S.; validation, J.J., Y.Y. and S.Y.; formal analysis, J.J. and Y.Y.; investigation, J.J. and Y.Y.; resources, J.J., Y.Y. and S.Y.; data curation, J.J., Y.Y. and Q.S.; writing—original draft preparation, J.J. and Y.Y.; writing—review and editing, J.J. and Y.Y.; visualization, J.J. and Y.Y.; supervision, J.J., Y.Y. and S.Y.; project administration, J.J. and Y.Y. All authors have read and agreed to the published version of the manuscript.

Funding

This research was funded by Macao Science and Technology Development Fund, grant number 0064/2020/A2.

Data Availability Statement

The research data related to this study can be made available for scientific purposes upon request to the corresponding author.

Acknowledgments

We acknowledge NASA for sharing the data acquired from the Ozone Monitoring Instrument (OMI) on-board the EOS-Aura satellite. We thank the Nanjing Bureau of Statistics (http://tjj.nanjing.gov.cn/bmfw/njsj/, accessed on 28 March 2022), the Suzhou Bureau of Statistics (http://tjj.suzhou.gov.cn/sztjj/tjsj/tjsj.shtml, accessed on 28 March 2022), and the Xuzhou Bureau of Statistics (http://tj.xz.gov.cn/xwzx/001003/subPage.html, accessed on 28 March 2022) for the availability of economic statistics. We thank the NCEP for providing access to the meteorological data.

Conflicts of Interest

The authors declare no conflict of interest.

References

  1. Chen, Z.; Chen, D.; Wen, W.; Zhuang, Y.; Kwan, M.-P.; Chen, B.; Zhao, B.; Yang, L.; Gao, B.; Li, R.; et al. Evaluating the “2 + 26” regional strategy for air quality improvement during two air pollution alerts in Beijing: Variations in PM2.5 concentrations, source apportionment, and the relative contribution of local emission and regional transport. Atmos. Chem. Phys. 2019, 19, 6879–6891. [Google Scholar] [CrossRef] [Green Version]
  2. Lin, J.; Nielsen, C.P.; Zhao, Y.; Lei, Y.; Liu, Y.; McElroy, M.B. Recent changes in particulate air pollution over China observed from space and the ground: Effectiveness of emission control. Environ. Sci. Technol. 2010, 44, 7771–7776. [Google Scholar] [CrossRef] [PubMed]
  3. Tao, M.; Chen, L.; Su, L.; Tao, J. Satellite observation of regional haze pollution over the North China Plain. J. Geophys. Res.-Atmos. 2012, 117, D12203. [Google Scholar] [CrossRef]
  4. Zheng, B.; Tong, D.; Li, M.; Liu, F.; Hong, C.; Geng, G.; Li, H.; Li, X.; Peng, L.; Qi, J.; et al. Trends in China’s anthropogenic emissions since 2010 as the consequence of clean air actions. Atmos. Chem. Phys. 2018, 18, 14095–14111. [Google Scholar] [CrossRef] [Green Version]
  5. Yin, H.; Lu, X.; Sun, Y.; Li, K.; Gao, M.; Zheng, B.; Liu, C. Unprecedented decline in summertime surface ozone over eastern China in 2020 comparably attributable to anthropogenic emission reductions and meteorology. Environ. Res. Lett. 2021, 16, 124069. [Google Scholar] [CrossRef]
  6. Atkinson, R. Atmospheric chemistry of VOCs and NOx. Atmos. Environ. 2000, 34, 2063–2101. [Google Scholar] [CrossRef]
  7. Seinfeld, J.H.; Pandis, S.N. Atmospheric Chemistry and Physics: From Air Pollution to Climate Change; John Wiley and Sons: New York, NY, USA, 2006; pp. 204–275. [Google Scholar]
  8. Yin, H.; Sun, Y.; Liu, C.; Zhang, L.; Lu, X.; Wang, W.; Shan, C.; Hu, Q.; Tian, Y.; Zhang, C.; et al. FTIR time series of stratospheric NO2 over Hefei, China, and comparisons with OMI and GEOS-Chem model data. Opt. Express 2019, 27, A1225–A1240. [Google Scholar] [CrossRef]
  9. Beirle, S.; Platt, U.; Wenig, M.; Wagner, T. Weekly cycle of NO2 by GOME measurements: A signature of anthropogenic sources. Atmos. Chem. Phys. 2003, 3, 2225–2232. [Google Scholar] [CrossRef] [Green Version]
  10. Lin, J.-T. Satellite constraint for emissions of nitrogen oxides from anthropogenic, lightning and soil sources over East China on a high-resolution grid. Atmos. Chem. Phys. 2012, 12, 2881–2898. [Google Scholar] [CrossRef] [Green Version]
  11. Lin, J.-T.; McElroy, M.B. Detection from space of a reduction in anthropogenic emissions of nitrogen oxides during the Chinese economic downturn. Atmos. Chem. Phys. 2011, 11, 8171–8188. [Google Scholar] [CrossRef] [Green Version]
  12. Jang, M.; Kamens, R.M. Characterization of secondary aerosol from the photooxidation of toluene in the presence of NOx and 1-propene. Environ. Sci. Technol. 2001, 35, 3626–3639. [Google Scholar] [CrossRef]
  13. Pope, C.A.; Dockery, D.W. Health effects of fine particulate air pollution: Lines that connect. J. Air Waste Manag. Assoc. 2006, 56, 709–742. [Google Scholar] [CrossRef]
  14. Jiang, X.; Zhang, Q.; Zhao, H.; Geng, G.; Peng, L.; Guan, D.; Kan, H.; Huo, H.; Lin, J.; Brauer, M.; et al. Revealing the hidden health costs embodied in Chinese exports. Environ. Sci. Technol. 2015, 49, 4381–4388. [Google Scholar] [CrossRef]
  15. Day, D.B.; Xiang, J.B.; Mo, J.H.; Li, F.; Chung, M.; Gong, J.C.; Weschler, C.J.; Ohman-Strickland, P.A.; Sundell, J.; Weng, W.G.; et al. Association of Ozone Exposure with Cardiorespiratory Pathophysiologic Mechanisms in Healthy Adults. JAMA Intern. Med. 2017, 177, 1344–1353. [Google Scholar] [CrossRef]
  16. Yue, X.; Unger, N.; Harper, K.; Xia, X.; Liao, H.; Zhu, T.; Xiao, J.; Feng, Z.; Li, J. Ozone and haze pollution weakens net primary productivity in China. Atmos. Chem. Phys. 2017, 17, 6073–6089. [Google Scholar] [CrossRef] [Green Version]
  17. The Central People’s Government of the People’s Republic of China. Air Pollution Prevention and Control Action Plan. Available online: http://www.gov.cn/jrzg/2013-09/12/content_2486918.htm (accessed on 24 January 2022).
  18. The Central People’s Government of the People’s Republic of China. Three-Year Action Plan for Winning the Blue Sky Defense War. Available online: http://www.gov.cn/zhengce/content/2018-07/03/content_5303158.htm (accessed on 24 January 2022).
  19. The Central People’s Government of the People’s Republic of China. Action Plan for Peak Carbon Dioxide Emissions before 2030. Available online: http://www.gov.cn/zhengce/content/2021-10/26/content_5644984.htm (accessed on 24 January 2022).
  20. Grossman, G.M.; Krueger, A.B. Environmental Impacts of a North American Free Trade Agreement; National Bureau of Economic Research: Cambridge, MA, USA, 1992; Volume 8, pp. 223–250. [Google Scholar]
  21. Grossman, G.M.; Krueger, A.B. Economic Growth and the Environment. Q. J. Econ. 1995, 110, 353–377. [Google Scholar] [CrossRef] [Green Version]
  22. Hamit-Haggar, M. Greenhouse gas emissions, energy consumption and economic growth: A panel cointegration analysis from Canadian industrial sector perspective. Energy Econ. 2012, 34, 358–364. [Google Scholar] [CrossRef]
  23. Shahbaz, M.; Tiwari, A.K.; Nasir, M. The effects of financial development, economic growth, coal consumption and trade openness on CO2 emissions in South Africa. Energy Policy 2013, 61, 1452–1459. [Google Scholar] [CrossRef] [Green Version]
  24. Saboori, B.; Sulaiman, J.; Mohd, S. Economic growth and CO2 emissions in Malaysia: A cointegration analysis of the Environmental Kuznets Curve. Energy Policy 2012, 51, 184–191. [Google Scholar] [CrossRef]
  25. Al-Mulali, U.; Ozturk, I.; Solarin, S.A. Investigating the environmental Kuznets curve hypothesis in seven regions: The role of renewable energy. Ecol. Indic. 2016, 67, 267–282. [Google Scholar] [CrossRef]
  26. Li, T.; Wang, Y.; Zhao, D. Environmental Kuznets Curve in China: New evidence from dynamic panel analysis. Energy Policy 2016, 91, 138–147. [Google Scholar] [CrossRef]
  27. Brajer, V.; Mead, R.W.; Xiao, F. Searching for an Environmental Kuznets Curve in China’s air pollution. China Econ. Rev. 2011, 22, 383–397. [Google Scholar] [CrossRef]
  28. Chang, H.-Y.; Wang, W.; Yu, J. Revisiting the environmental Kuznets curve in China: A spatial dynamic panel data approach. Energy Econ. 2021, 104, 105600. [Google Scholar] [CrossRef]
  29. Jago-on, K.A.; Kaneko, S.; Fujikura, R.; Fujiwara, A.; Imai, T.; Matsumoto, T.; Zhang, J.; Tanikawa, H.; Tanaka, K.; Lee, B.; et al. Urbanization and subsurface environmental issues: An attempt at DPSIR model application in Asian cities. Sci. Total Environ. 2009, 407, 3089–3104. [Google Scholar] [CrossRef]
  30. Llop, M. Economic structure and pollution intensity within the environmental input–output framework. Energy Policy 2007, 35, 3410–3417. [Google Scholar] [CrossRef]
  31. Bichler, R.; Bittner, M. Comparison between economic growth and satellite-based measurements of NO2 pollution over northern Italy. Atmos. Environ. 2022, 272, 118948. [Google Scholar] [CrossRef]
  32. Wood, S.N.; Augustin, N.H. GAMs with integrated model selection using penalized regression splines and applications to environmental modelling. Ecol. Model. 2002, 157, 157–177. [Google Scholar] [CrossRef] [Green Version]
  33. Pearce, J.L.; Beringer, J.; Nicholls, N.; Hyndman, R.J.; Tapper, N.J. Quantifying the influence of local meteorology on air quality using generalized additive models. Atmos. Environ. 2011, 45, 1328–1336. [Google Scholar] [CrossRef]
  34. Hua, J.; Zhang, Y.; de Foy, B.; Shang, J.; Schauer, J.J.; Mei, X.; Sulaymon, I.D.; Han, T. Quantitative estimation of meteorological impacts and the COVID-19 lockdown reductions on NO2 and PM2.5 over the Beijing area using Generalized Additive Models (GAM). J. Environ. Manag. 2021, 291, 112676. [Google Scholar] [CrossRef] [PubMed]
  35. Zhang, C.; Liu, C.; Hu, Q.; Cai, Z.; Su, W.; Xia, C.; Zhu, Y.; Wang, S.; Liu, J. Satellite UV-Vis spectroscopy: Implications for air quality trends and their driving forces in China during 2005–2017. Light Sci. Appl. 2019, 8, 100. [Google Scholar] [CrossRef] [PubMed] [Green Version]
  36. Yin, H.; Liu, C.; Hu, Q.; Liu, T.; Wang, S.; Gao, M.; Xu, S.; Zhang, C.; Su, W. Opposite impact of emission reduction during the COVID-19 lockdown period on the surface concentrations of PM2.5 and O3 in Wuhan, China. Environ. Pollut. 2021, 289, 117899. [Google Scholar] [CrossRef] [PubMed]
  37. Tong, C.; Zhang, C.; Liu, C. Investigation on the Relationship between Satellite Air Quality Measurements and Industrial Production by Generalized Additive Modeling. Remote Sens. 2021, 13, 3137. [Google Scholar] [CrossRef]
  38. Nanjing Municipal Bureau of Statistics. 2020 National Economic and Social Development Statistical Bulletin of Nanjing. Available online: http://tjj.nanjing.gov.cn/bmfw/njsj/202201/t20220107_3256261.html (accessed on 24 January 2022).
  39. Suzhou Municipal Bureau of Statistics. Overview of Suzhou’s Economic and Social Development in 2020. Available online: http://tjj.suzhou.gov.cn/sztjj/tjgb/202103/8876edc5eb7e402ba58f02ba2c9d1a26.shtml (accessed on 24 January 2022).
  40. Xuzhou Bureau of Statistics. Statistical Bulletin of Xuzhou National Economic and Social Development in 2020. Available online: http://tj.xz.gov.cn/xwzx/001004/20210323/3faca3ed-3a25-4bfb-8cec-36e60e1e0bb5.html (accessed on 24 January 2022).
  41. Zhang, C.X.; Liu, C.; Chan, K.L.; Hu, Q.H.; Liu, H.R.; Li, B.; Xing, C.Z.; Tan, W.; Zhou, H.J.; Si, F.Q.; et al. First observation of tropospheric nitrogen dioxide from the Environmental Trace Gases Monitoring Instrument onboard the GaoFen-5 satellite. Light-Sci. Appl. 2020, 9, 66. [Google Scholar] [CrossRef] [PubMed] [Green Version]
  42. Liu, F.; Beirle, S.; Zhang, Q.; van der A, R.J.; Zheng, B.; Tong, D.; He, K. NOx emission trends over Chinese cities estimated from OMI observations during 2005 to 2015. Atmos. Chem. Phys. 2017, 17, 9261–9275. [Google Scholar] [CrossRef] [Green Version]
  43. Veefkind, J.P.; Aben, I.; McMullan, K.; Förster, H.; de Vries, J.; Otter, G.; Claas, J.; Eskes, H.J.; de Haan, J.F.; Kleipool, Q.; et al. TROPOMI on the ESA Sentinel-5 Precursor: A GMES mission for global observations of the atmospheric composition for climate, air quality and ozone layer applications. Remote Sens. Environ. 2012, 120, 70–83. [Google Scholar] [CrossRef]
  44. Levelt, P.F.; Oord, G.H.J.V.D.; Dobber, M.R.; Malkki, A.; Visser, H.; Vries, J.D.; Stammes, P.; Lundell, J.O.V.; Saari, H. The ozone monitoring instrument. IEEE Trans. Geosci. Remote Sens. 2006, 44, 1093–1101. [Google Scholar] [CrossRef]
  45. Bucsela, E.J.; Krotkov, N.A.; Celarier, E.A.; Lamsal, L.N. A new stratospheric and tropospheric NO2 retrieval algorithm for nadir-viewing satellite instruments: Applications to OMI. Atmos. Meas. Tech. 2013, 6, 2607–2626. [Google Scholar] [CrossRef] [Green Version]
  46. Krotkov, N.A.; Lamsal, L.N.; Celarier, E.A.; Swartz, W.H.; Marchenko, S.V.; Bucsela, E.J.; Chan, K.L.; Wenig, M.; Zara, M. The version 3 OMI NO2 standard product. Atmos. Meas. Tech. 2017, 10, 3133–3149. [Google Scholar] [CrossRef] [Green Version]
  47. Platt, U.; Stutz, J. Differential Optical Absorption Spectroscopy; Springer: Berlin/Heidelberg, Germany, 2008; pp. 2458–2462. [Google Scholar]
  48. Tan, W.; Liu, C.; Wang, S.S.; Xing, C.Z.; Su, W.J.; Zhang, C.X.; Xia, C.Z.; Liu, H.R.; Cai, Z.N.; Liu, J.G. Tropospheric NO2, SO2, and HCHO over the East China Sea, using ship-based MAX-DOAS observations and comparison with OMI and OMPS satellite data. Atmos. Chem. Phys. 2018, 18, 15387–15402. [Google Scholar] [CrossRef] [Green Version]
  49. Tan, W.; Zhao, S.; Liu, C.; Chan, K.L.; Xie, Z.; Zhu, Y.; Su, W.; Zhang, C.; Liu, H.; Xing, C.; et al. Estimation of winter time NOx emissions in Hefei, a typical inland city of China, using mobile MAX-DOAS observations. Atmos. Environ. 2019, 200, 228–242. [Google Scholar] [CrossRef]
  50. Chan, K.L.; Hartl, A.; Lam, Y.F.; Xie, P.H.; Liu, W.Q.; Cheung, H.M.; Lampel, J.; Pöhler, D.; Li, A.; Xu, J.; et al. Observations of tropospheric NO2 using ground based MAX-DOAS and OMI measurements during the Shanghai World Expo 2010. Atmos. Environ. 2015, 119, 145–158. [Google Scholar] [CrossRef]
  51. Su, W.; Liu, C.; Hu, Q.; Fan, G.; Xie, Z.; Huang, X.; Zhang, T.; Chen, Z.; Dong, Y.; Ji, X.; et al. Characterization of ozone in the lower troposphere during the 2016 G20 conference in Hangzhou. Sci. Rep. 2017, 7, 17368. [Google Scholar] [CrossRef] [Green Version]
  52. Liu, H.; Cheng, L.; Xie, Z.; Ying, L.; Xin, H.; Wang, S.; Jin, X.; Xie, P. A paradox for air pollution controlling in China revealed by “APEC Blue” and “Parade Blue”. Sci. Rep. 2016, 6, 34408. [Google Scholar] [CrossRef] [Green Version]
  53. Grell, G.A.; Peckhama, S.E.; Schmitzc, R.; McKeenb, S.A.; Frostb, G.; William, C.S.; Eder, B. Fully coupled “online” chemistry within the WRF model. Atmos. Environ. 2005, 39, 6957–6975. [Google Scholar] [CrossRef]
  54. Hong, S.Y.; Lim, J.O.J. The WRF Single-Moment 6-Class Microphysics Scheme (WSM6). J. Korean Meteor. Soc. 2006, 42, 129–151. [Google Scholar]
  55. Liu, M.; Lin, J.; Wang, Y.; Sun, Y.; Zheng, B.; Shao, J.; Chen, L.; Zheng, Y.; Chen, J.; Fu, T.-M.; et al. Spatiotemporal variability of NO2 and PM2.5 over Eastern China: Observational and model analyses with a novel statistical method. Atmos. Chem. Phys. 2018, 18, 12933–12952. [Google Scholar] [CrossRef] [Green Version]
  56. Xue, R.; Wang, S.; Li, D.; Zou, Z.; Chan, K.L.; Valks, P.; Saiz-Lopez, A.; Zhou, B. Spatio-temporal variations in NO2 and SO2 over Shanghai and Chongming Eco-Island measured by Ozone Monitoring Instrument (OMI) during 2008–2017. J. Clean. Prod. 2020, 258, 120563. [Google Scholar] [CrossRef]
  57. Xue, R.; Wang, S.; Zhang, S.; He, S.; Liu, J.; Tanvir, A.; Zhou, B. Estimating city NOX emissions from TROPOMI high spatial resolution observations—A case study on Yangtze River Delta, China. Urban Clim. 2022, 43, 101150. [Google Scholar] [CrossRef]
  58. Gao, C.; Li, S.; Liu, M.; Zhang, F.; Achal, V.; Tu, Y.; Zhang, S.; Cai, C. Impact of the COVID-19 pandemic on air pollution in Chinese megacities from the perspective of traffic volume and meteorological factors. Sci. Total Environ. 2021, 773, 145545. [Google Scholar] [CrossRef]
Figure 1. Averaged tropospheric NO2 VCDs of Jiangsu province from 2016 to 2020.
Atmosphere 13 00697 g001
Figure 2. Comparison of monthly average tropospheric NO2 VCDs of Nanjing, Suzhou, Xuzhou, and Jiangsu province.
Atmosphere 13 00697 g002
Figure 3. The annual variation of tropospheric NO2 VCDs (a), gross domestic product (GDP) (b), and the ratio of tropospheric NO2 VCDs to GDP (c).
Atmosphere 13 00697 g003
Figure 4. The annual variation of the total exports (a), total imports (b) and industrial electricity consumption (c) of Nanjing, Suzhou and Xuzhou.
Atmosphere 13 00697 g004
Figure 5. The marginal effect (%) of each GAM smooth term on tropospheric NO2 VCDs of Nanjing. The response curves of t2, v10, month, exports, imports, and industrial electricity are shown in separate panels.
Atmosphere 13 00697 g005
Figure 6. The marginal effect (%) of each GAM smooth term on NO2 pollution of Suzhou. The response curves of pblh, t2, month, t2, exports, imports, and industrial electricity are shown in separate panels.
Atmosphere 13 00697 g006
Figure 7. The marginal effect (%) of each GAM smooth term on NO2 pollution of Xuzhou. The response curves of t2, v10, month, exports, imports, and industrial electricity are shown in separate panels.
Atmosphere 13 00697 g007
Figure 8. The correlation analysis of tropospheric NO2 VCDs observed by OMI and the fitted GAM model, and the inter-annual variations of smooth terms explained by each variable. The results of Nanjing (a), Suzhou (b), and Xuzhou (c) are presented, respectively.
Atmosphere 13 00697 g008
Table 1. The input variables for GAM modeling research of the three typical cities.
NameMeaningUnit
NO2 VCDNO2 vertical column densitymolec. cm−2
v10The wind speed component along latitude at a height of 10 m above the surfacem s−1
t2The temperature at a height of 2 m above the surfaceK
monthMonth number /
PBLHThe planetary boundary layer heightm
exportsTotal exports100 million USD
importsTotal imports100 million USD
industrial electricityIndustrial consumption of electricity100 million kWh
Publisher’s Note: MDPI stays neutral with regard to jurisdictional claims in published maps and institutional affiliations.

