1. Introduction
Ultrafine aerosols in the air may cause potentially adverse effects on the environment and human health and have caused extensive research and discussion in recent years [
1,
2,
3,
4]. In the studies of air pollution and public health, the measurement of the particle size distribution and number concentration of nanoparticles is very important. Differential mobility analysis is a common instrument used to measure the particle size distribution and number concentration of these ultrafine aerosols [
5,
6]. Since the particle size measuring instrument through electro-differential mobility analysis requires the particles to have a unipolar charge with a known charge distribution, it is necessary to explore the charged and uncharged behavior of ultrafine aerosols for some corona chargers [
7,
8,
9].
The corona chargers use a non-uniform electrostatic field between the needle and the wall or between the wire and the tube and have been applied to charged particles as the first step in electrical mobility analysis [
10,
11,
12]. The direct needle charger in these corona dischargers has the advantages of simple design, easy manufacturing and low cost. To know the charged distribution of particles for the application of the needle charger, it needs to pay attention to its high charging efficiency and low particle loss [
13,
14,
15]. Alonso et al. [
16] conducted an experimental method containing many parameters to measure the performance of the needle charger, including intrinsic and extrinsic charging efficiencies, as well as diffusion and electrostatic particle losses. The research results showed that the extrinsic and intrinsic charging efficiencies were important parameters in the applications of the needle charger. In addition, the electrostatic loss of the needle charger increased with an increasing charger voltage, while the diffusion loss decreased. When the needle charger was turned off, the diffusion loss in the charger reached the maximum value. Although experimental studies have utilized increased flow rates to reduce the particle deposition, a quantitative analysis of the ultrafine aerosol deposition inside the needle charger without applied voltage has not been fully reported in the literature. In addition, the influences of particle sizes and flow rates on the distances of ultrafine aerosols adhering to the electrode wall are also lacking.
For improving the charging efficiency of the needle charger, the particle depositions caused by diffusion and electrostatic effects have become an important issue. Many studies have shown that the charging efficiency of the needle charger can be improved by reducing the loss of ultrafine particles inside the needle charger [
15,
16,
17,
18]. Some researchers employed an additional sheath air to shroud the aerosol to reduce the particle diffusion deposition of the charger [
19]. However, the use of this method must consider that the design was more complicated, and the aerosol concentration was diluted at the charger outlet. Therefore, the calculations of the ultrafine aerosol depositions and trajectories within the simple charger without applied voltage are well worth exploring. Furthermore, it is important to see if the ultrafine aerosol trajectories closely follow the flow field when the corrected Stokes drag force and the Brownian force are considered, because it can have a significant effect on the particle deposition in the needle charger.
Recently, Alonso and Huang [
20] evaluated a needle charger for efficient charging of particles with a diameter of a few nanometers. Research results showed that the needle charger with a smaller effective volume caused smaller nanoparticle diffusion depositions. Since the electrostatic and diffusion losses of ultrafine aerosols inside the needle charger were reduced, the extrinsic charging efficiency of the needle charger was improved. Intra et al. [
21] evaluated the charging efficiencies and losses of ultrafine particles with the size range of 15–75 nm for a unipolar corona-based ionizer. Their results showed that smaller particles will have higher diffusion deposition than larger particles due to Brownian diffusion effect. In addition, for particles with a particle diameter greater than 20 nm, the Brownian diffusion losses were negligible. However, it was difficult to quantify the relative contribution of the particle’s attachment positions to the diffusional deposition in the needle charger under different flow rates, especially for the ultrafine aerosols smaller than 10 nm. Therefore, the purpose of this study is to construct a method to investigate the influences of particle diffusional trajectories on attachment positions and ultrafine aerosol depositions in the needle charger. A numerical model was employed to calculate the diffusion deposition of uncharged particles in the needle charger. The ultrafine aerosol deposition in the needle charger without applied voltage was investigated numerically by simulating the flow field and particle trajectory for different particle diameters, flow rates, entrance radial positions and deposition axial distances.
2. Methods
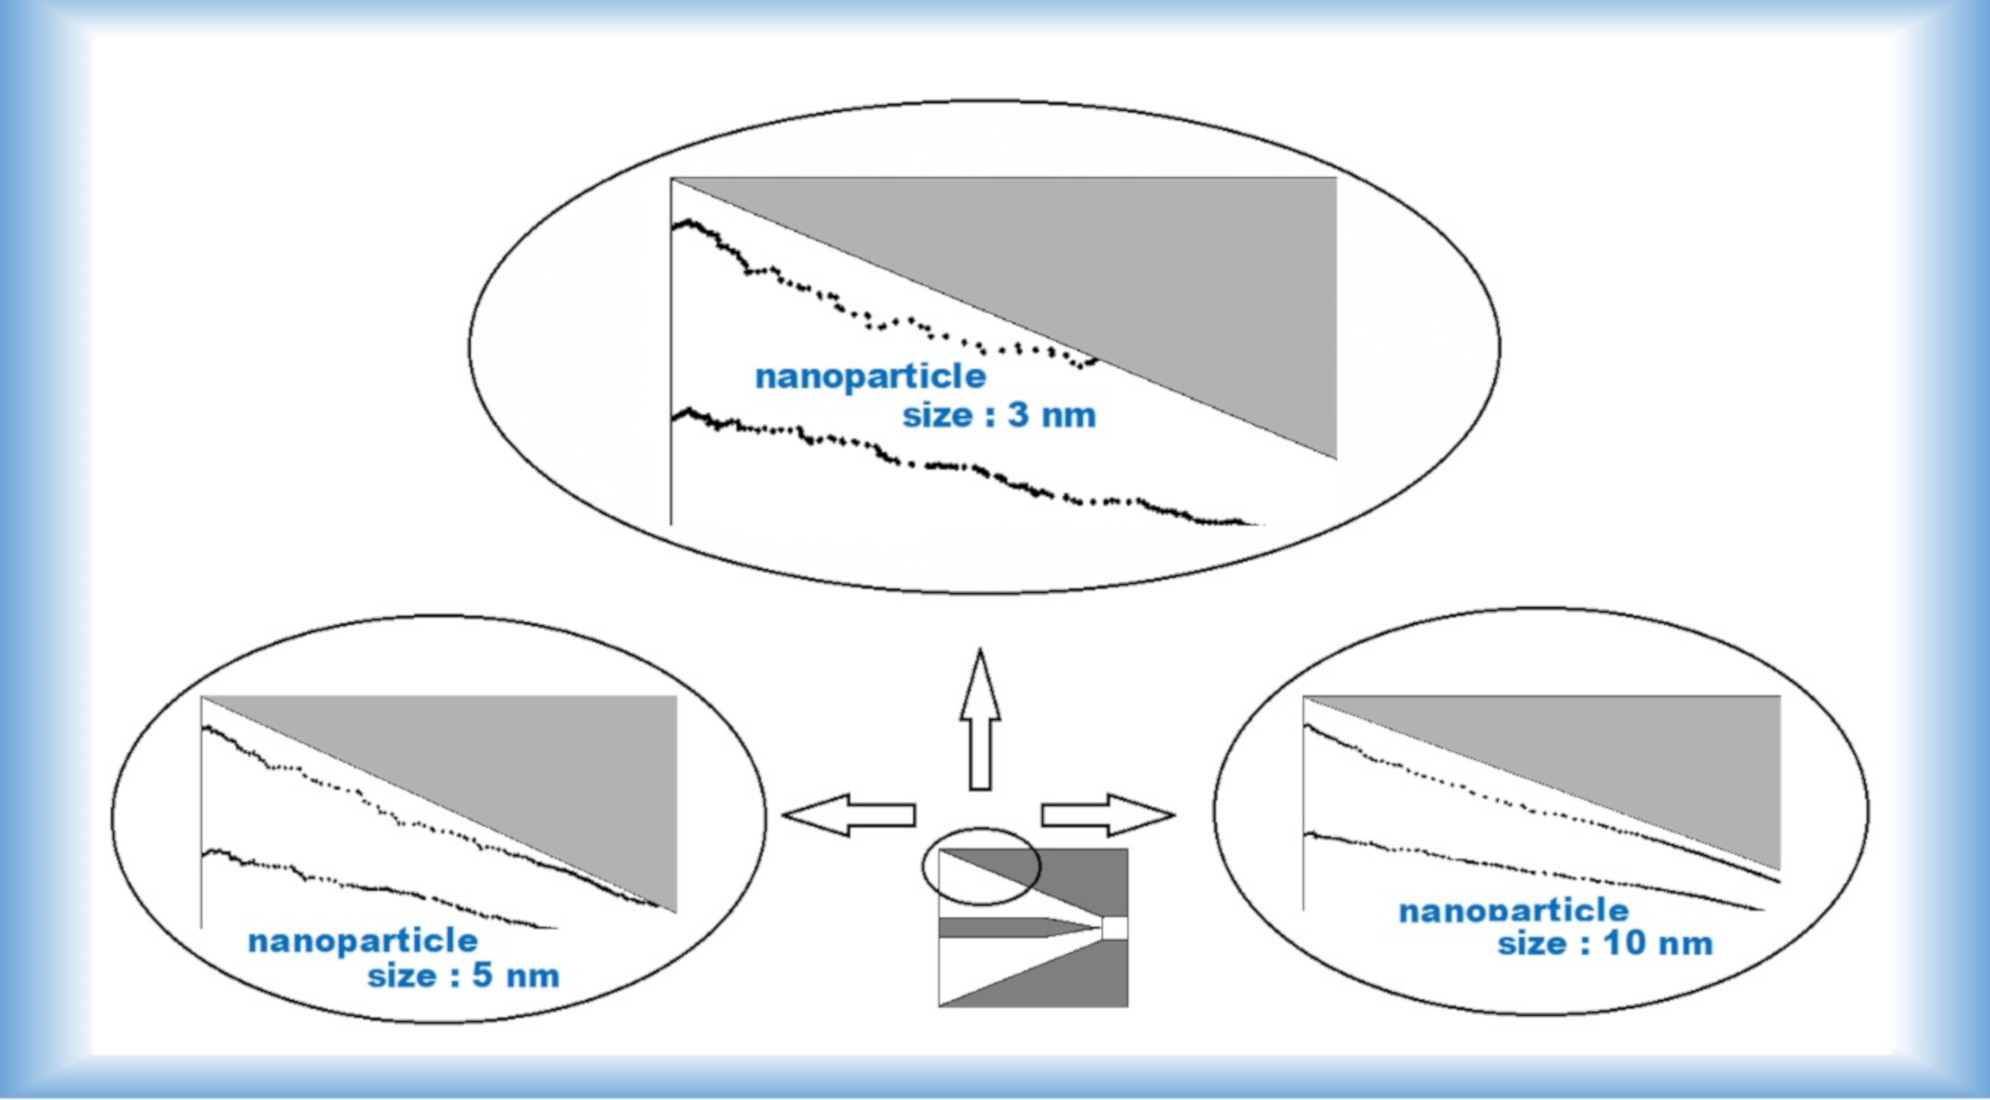
Figure 1 depicts the schematic diagram of the needle charger in this investigation. The charger was composed of an outer electrode with a conical shape and an inner electrode with a sharp point end. The inner electrode was designed to use the stainless steel, so high voltages could be applied to the electrode. The conical outer wall coaxial with the electrode was designed with the grounded metal material. The radii of the inlet,
r1, and outlet,
r3, for the conical sections are 1 cm and 0.175 cm, respectively. The radius of the needle electrode,
r2, is 0.15 cm, and the height of the cone is 2 cm. The design dimensions were based on the studies of nanoparticle loss measurements in corona chargers [
16]. It was originally expected to help reduce nanoparticle diffusion losses by moving the electrode holder at the particle inlet. The results showed that the nanoparticle loss through the sidewall was approximately the same as the presence of the electrode holder. However, the manufacture of a non-fixed electrode holder was easier to carry out. This study adopted a geometric design similar to that of the non-fixed electrode holder. The numerical results could therefore be compared with the experimental data. Calculations of the fluid flow fields and particle trajectories inside the needle charger without power supply were performed under different conditions. For the calculation of flow field inside the uncharged needle charger, it was simulated by solving two-dimensional continuity and Navier–Stokes equations assuming steady, incompressible, axisymmetric, viscous and laminar fluid flow.
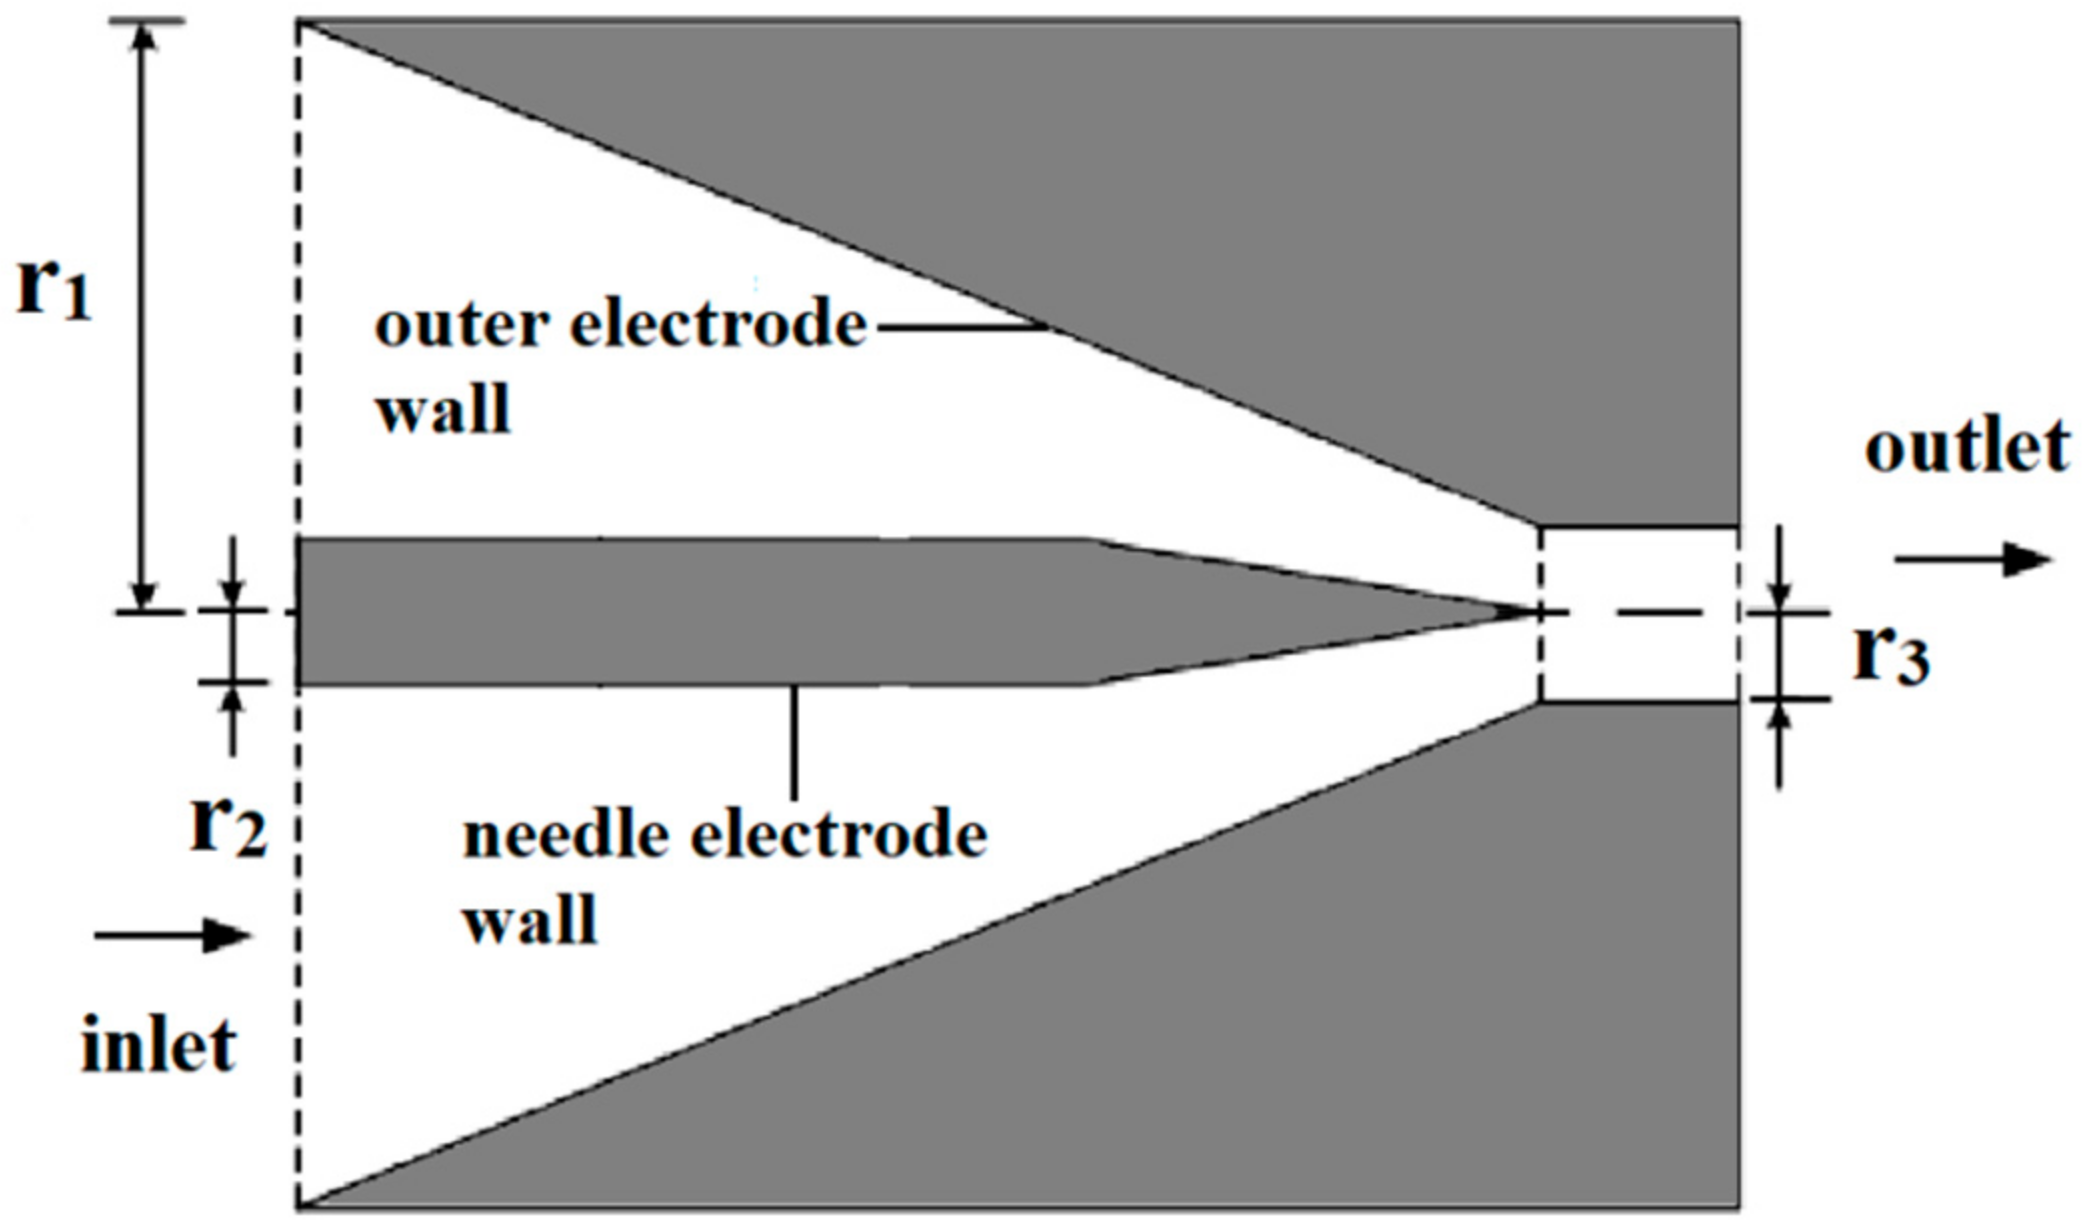
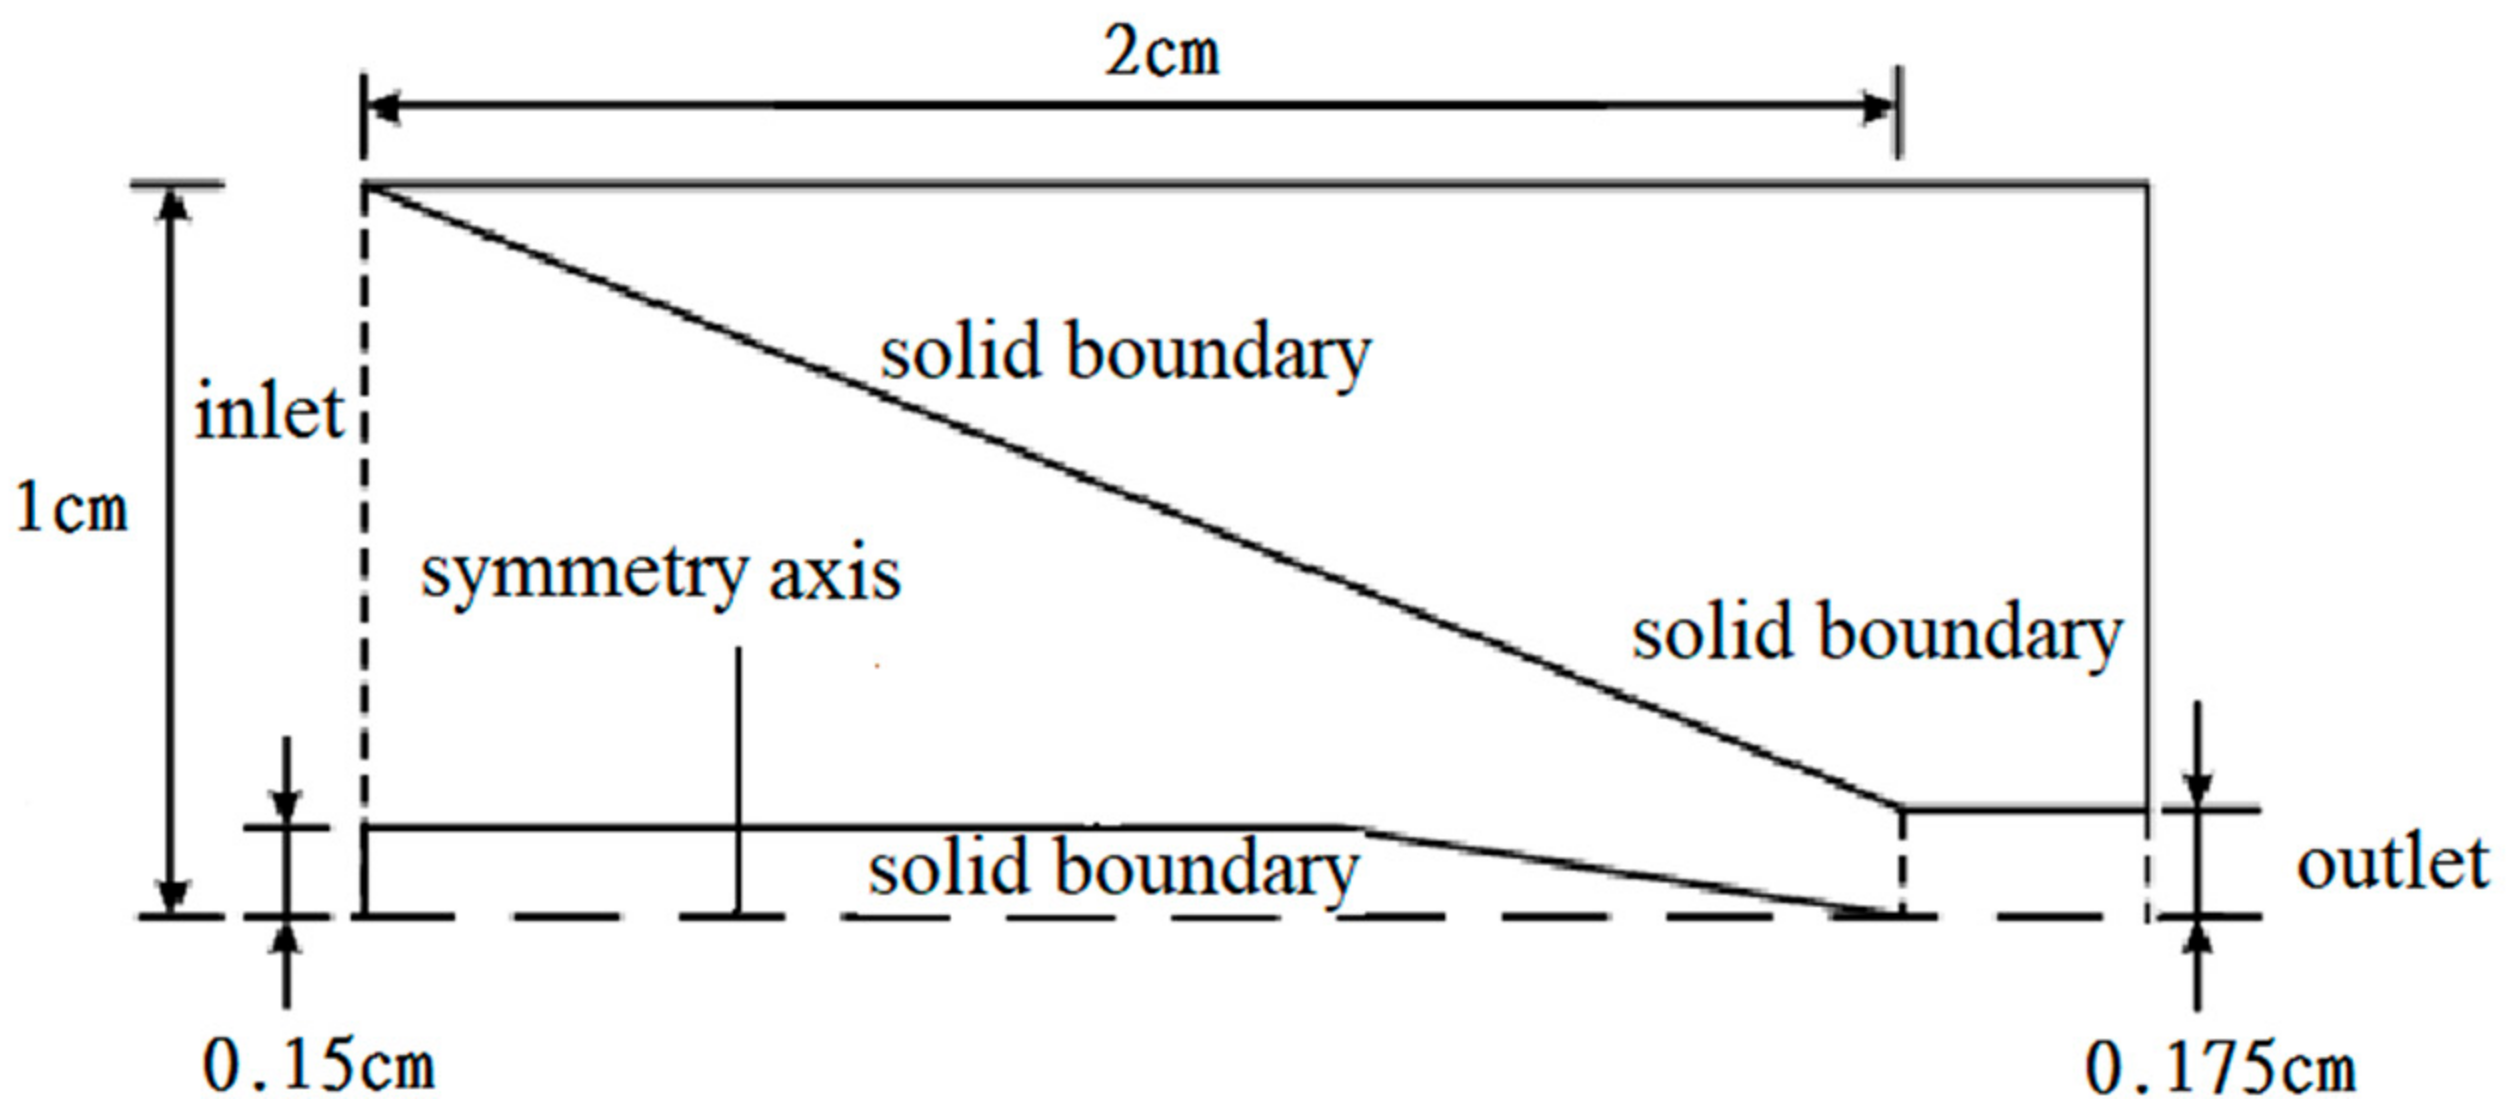
Figure 2 is the main numerical domain used to calculate the flow field of the needle charger. The outer electrode wall and needle electrode wall are set as solid boundary conditions. Three grid numbers of 21,000, 84,000 and 336,000 were used in the computational domain to test the grid independence. When the number of grids was increased from 21,000 to 84,000, the particle deposition in the needle charger without applied voltage for 3 nm particles at 2 L min
−1 changed from 25.2% to 27.4%. When the number of grids was increased from 84,000 to 336,000, the particle deposition changed from 27.4% to 27.7%. The number of grids varied from 84,000 to 336,000 resulting in a difference of only 0.3% in the calculated results. Therefore, a total of 84,000 (200 in the
r-direction × 420 in the
z-direction) non-uniform rectangular grids were used during the computational simulation. Air is assumed to be at 20 °C and 1 atm. The governing equations are discretized using the finite volume method and solved by the SIMPLE algorithm [
22].
where
and
is the air velocity in
r (radial) and
z (axial) direction, respectively,
is the air density,
P is the pressure, and
is the air viscosity.
After calculating the flow field, the particle motion equation is integrated using the fourth-order Runge–Kutta method. The particle motion equation is governed by the following:
where
is the drag force per unit mass,
is the Brownian force per unit mass, and
is the particle velocity.
The drag force per unit mass including Cunningham correction in the particle motion equation is described by Stokes’s law as [
23]:
where
Cd is the empirical drag coefficient,
Rep is the particle Reynolds number,
Dp is the particle diameter,
C is the Cunningham correction factor,
is the particle density and
is the air velocity.
For the ultrafine aerosols suspended in a fluid and subjected to the random impact of unbalanced gas molecules, the Brownian motion in an irregular path is described by a zero mean Gaussian random process [
24,
25]:
where
is the inverse of the particle relaxation time,
is the diffusion coefficient,
mp is the particle mass,
is the time step,
G is the zero mean unit variance Gaussian random number given by
and
, and
and
are the pairs of uniform random numbers. The time step in the calculation should be chosen as much smaller than the relaxation time of the particles. Such a small enough time step keeps the drag force approximately constant during the interval, so the integral error of the particle motion equation is very small.
If the velocity profiles and particle concentration at the inlet of the needle charger are assumed to be uniform and we suppose the particles are collected when they reach the wall, then the ultrafine aerosols deposition in the charger equals the outer electrode deposition,
, plus the needle electrode deposition,
, which can be calculated as:
where
and
represent the critical collection radius of the particles for the outer electrode and the needle electrode, respectively. The particles entering the needle charger in the radial direction between
and
, or
and
will adhere to the outer electrode or the needle electrode wall.
In the calculation of the fluid flow fields and particle trajectories in the needle charger without power supply, the interaction between particles is ignored. When particles are introduced into the system to obtain their trajectories, it is assumed that the particles are spherical and the presence of particles does not affect the fluid flow field. The particle mass of 3–20 nm ultrafine aerosols is assumed to be . In addition, the flow field inside the needle charger without a power supply is assumed to be axisymmetric and there is no flow in the azimuth direction. Therefore, when the particle passes through the aerodynamic system of the needle charger, the calculation of the trajectory in the (r, z) plane is sufficient to give a statistically reasonable result of the particle deposition inside the needle charger.
3. Results and Discussion
3.1. Particle Motion inside Charger
To obtain the diffusion adhesion and the deposition of ultrafine aerosols, this study calculated the flow field and particle trajectories inside the needle charger without applied voltage.
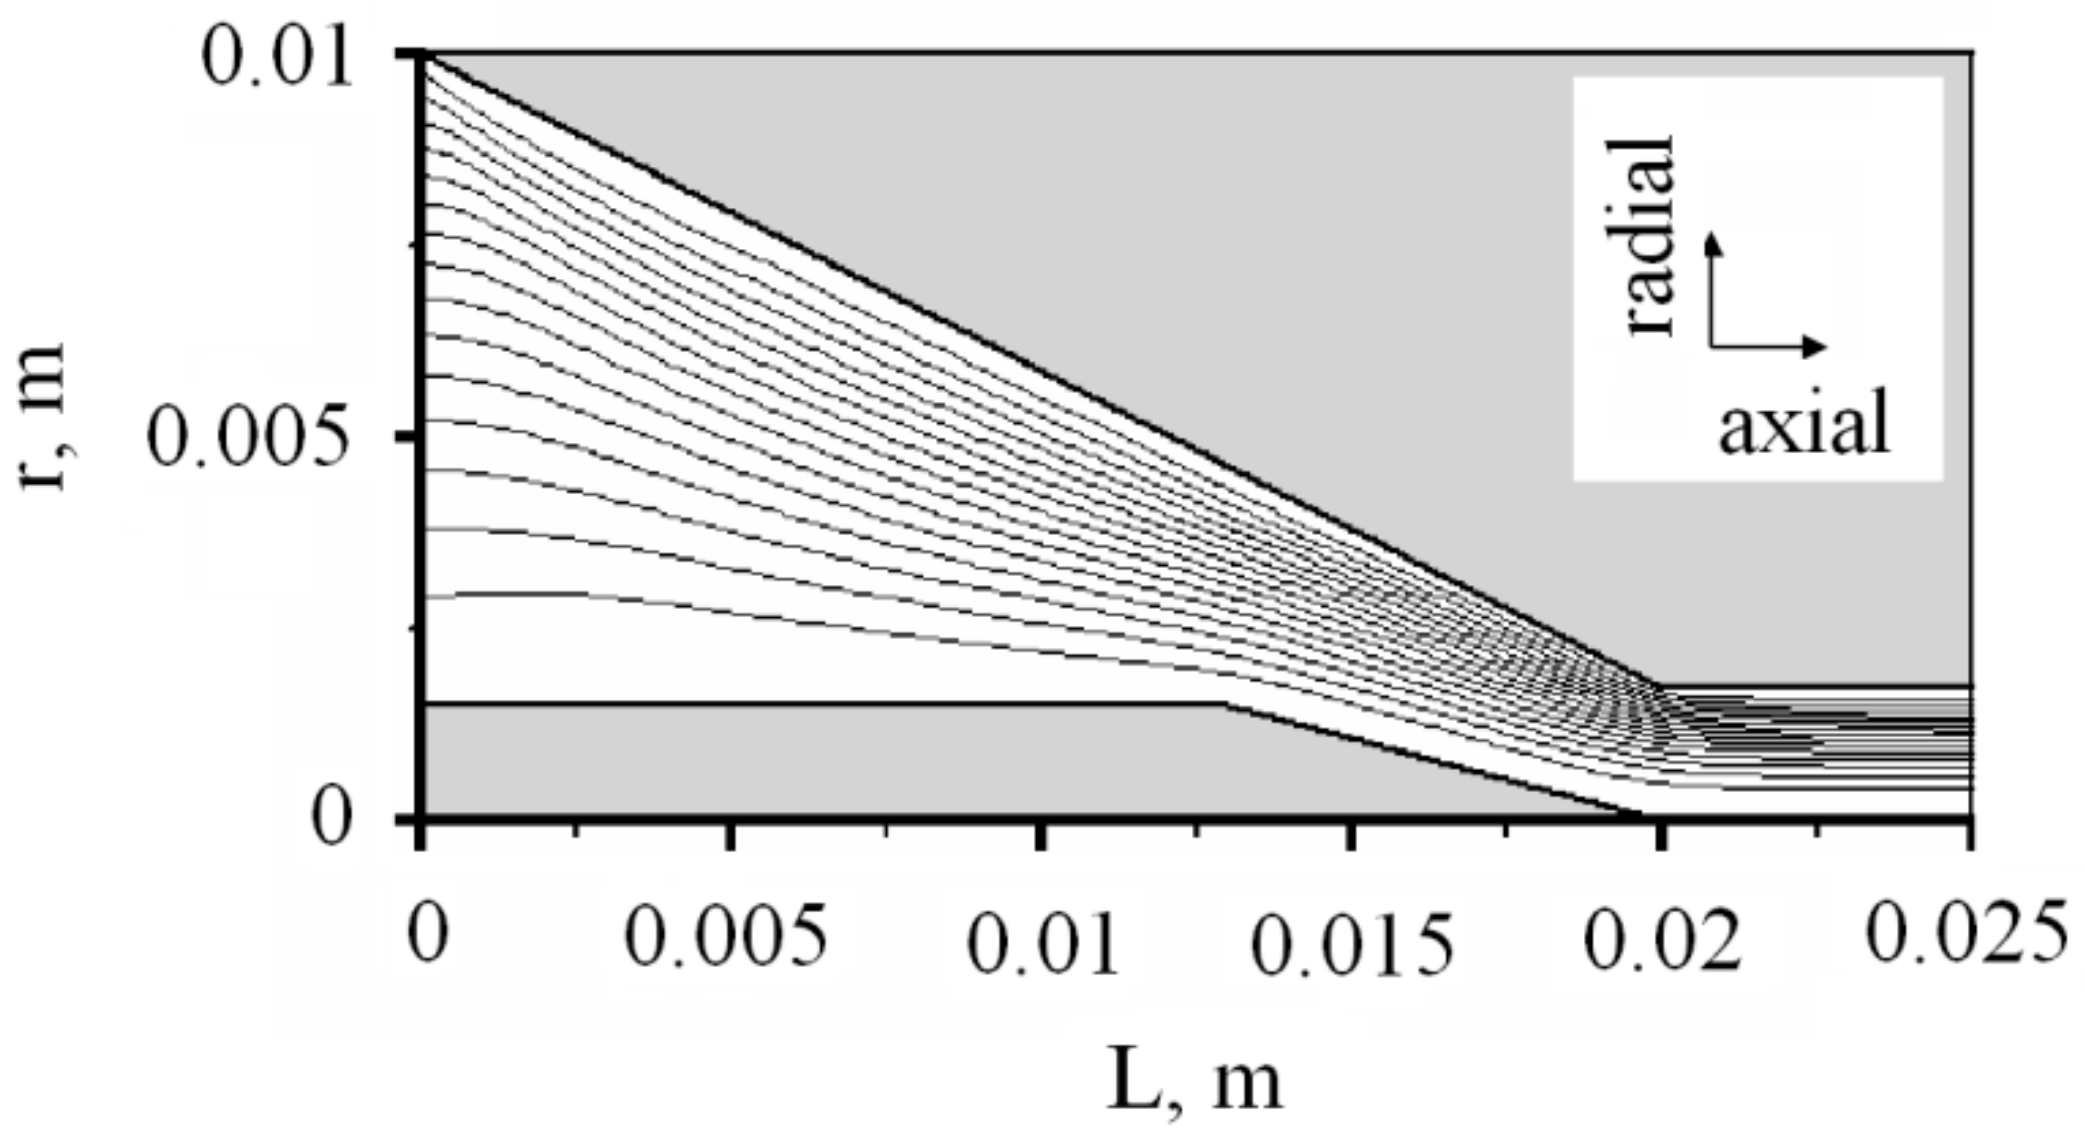
Figure 3 shows the streamlines in the charger without power supply at a flow rate of 2 L min
−1. The airflow enters the charger from the inlet and gradually accelerates until it leaves the charger and reaches the maximum value. From the development of the flow velocity profile inside the charger, there is a lower velocity distribution near the walls of the outer electrode and needle electrode, while a higher velocity value is found close to the center of the airflow.
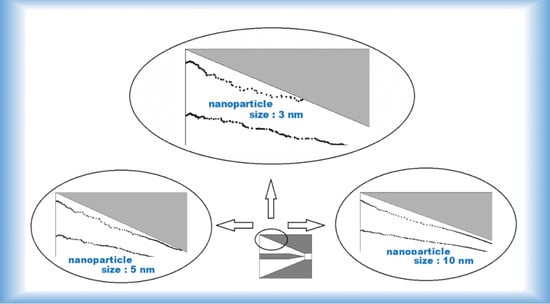
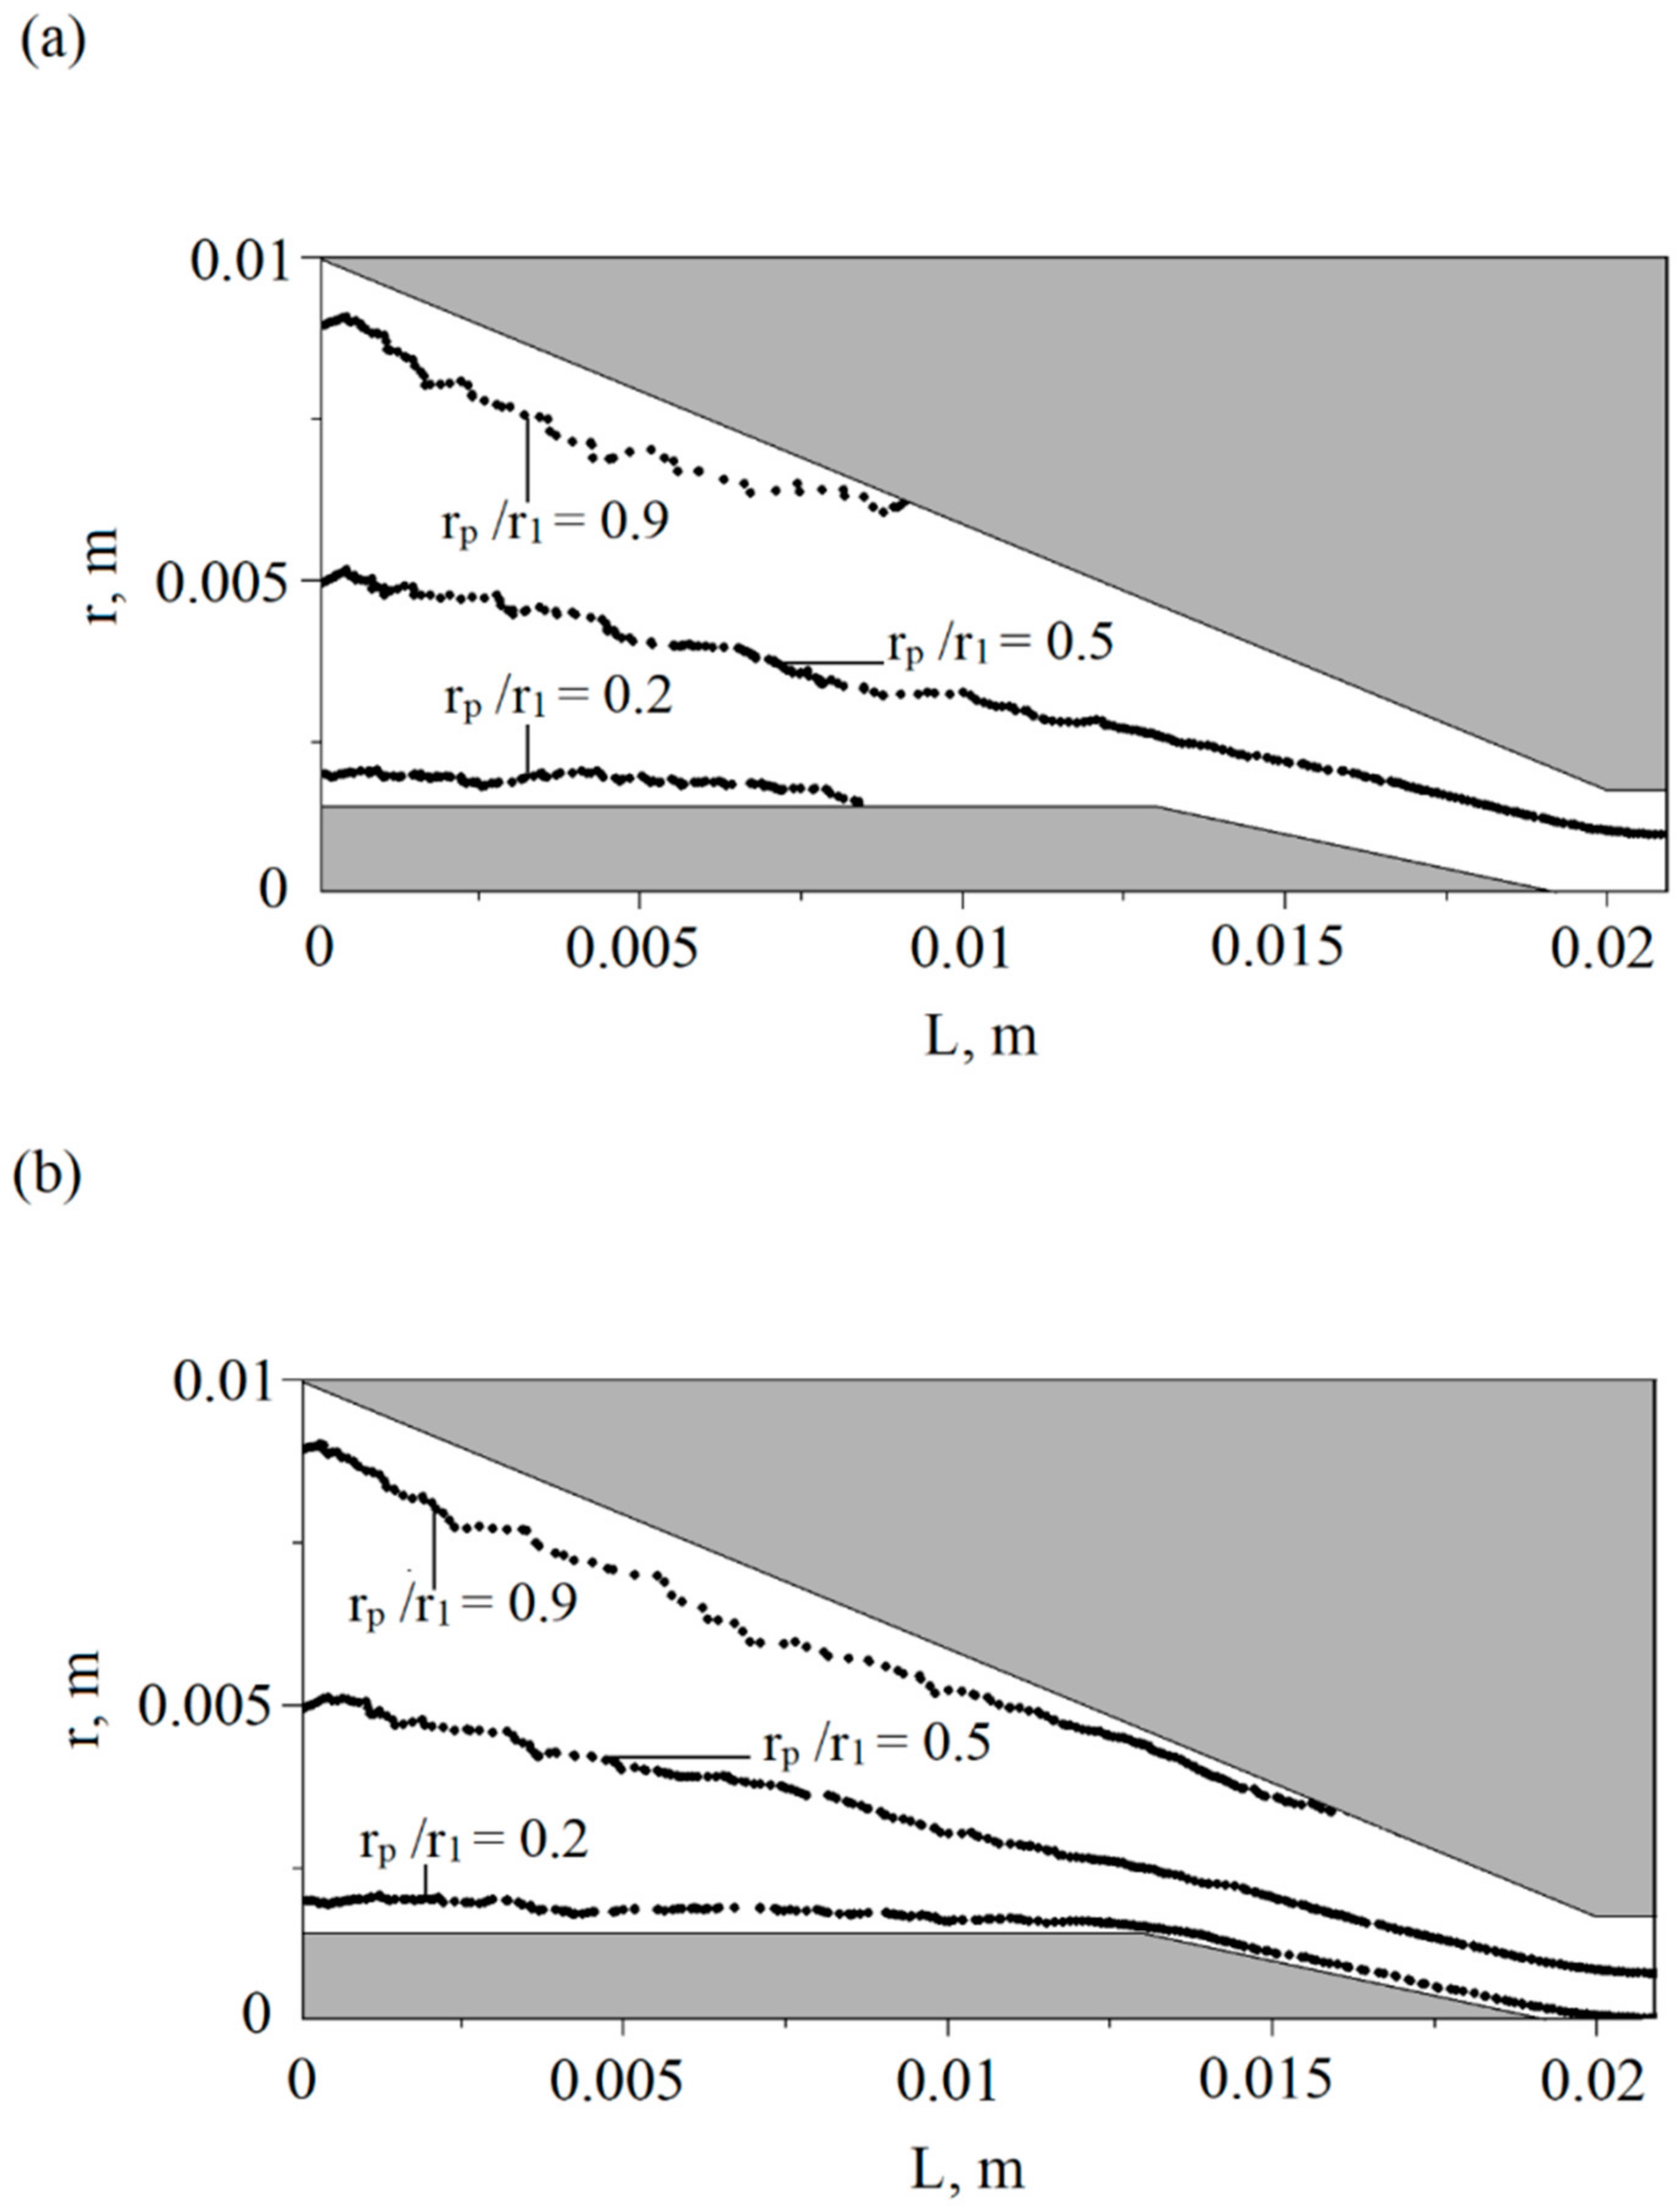
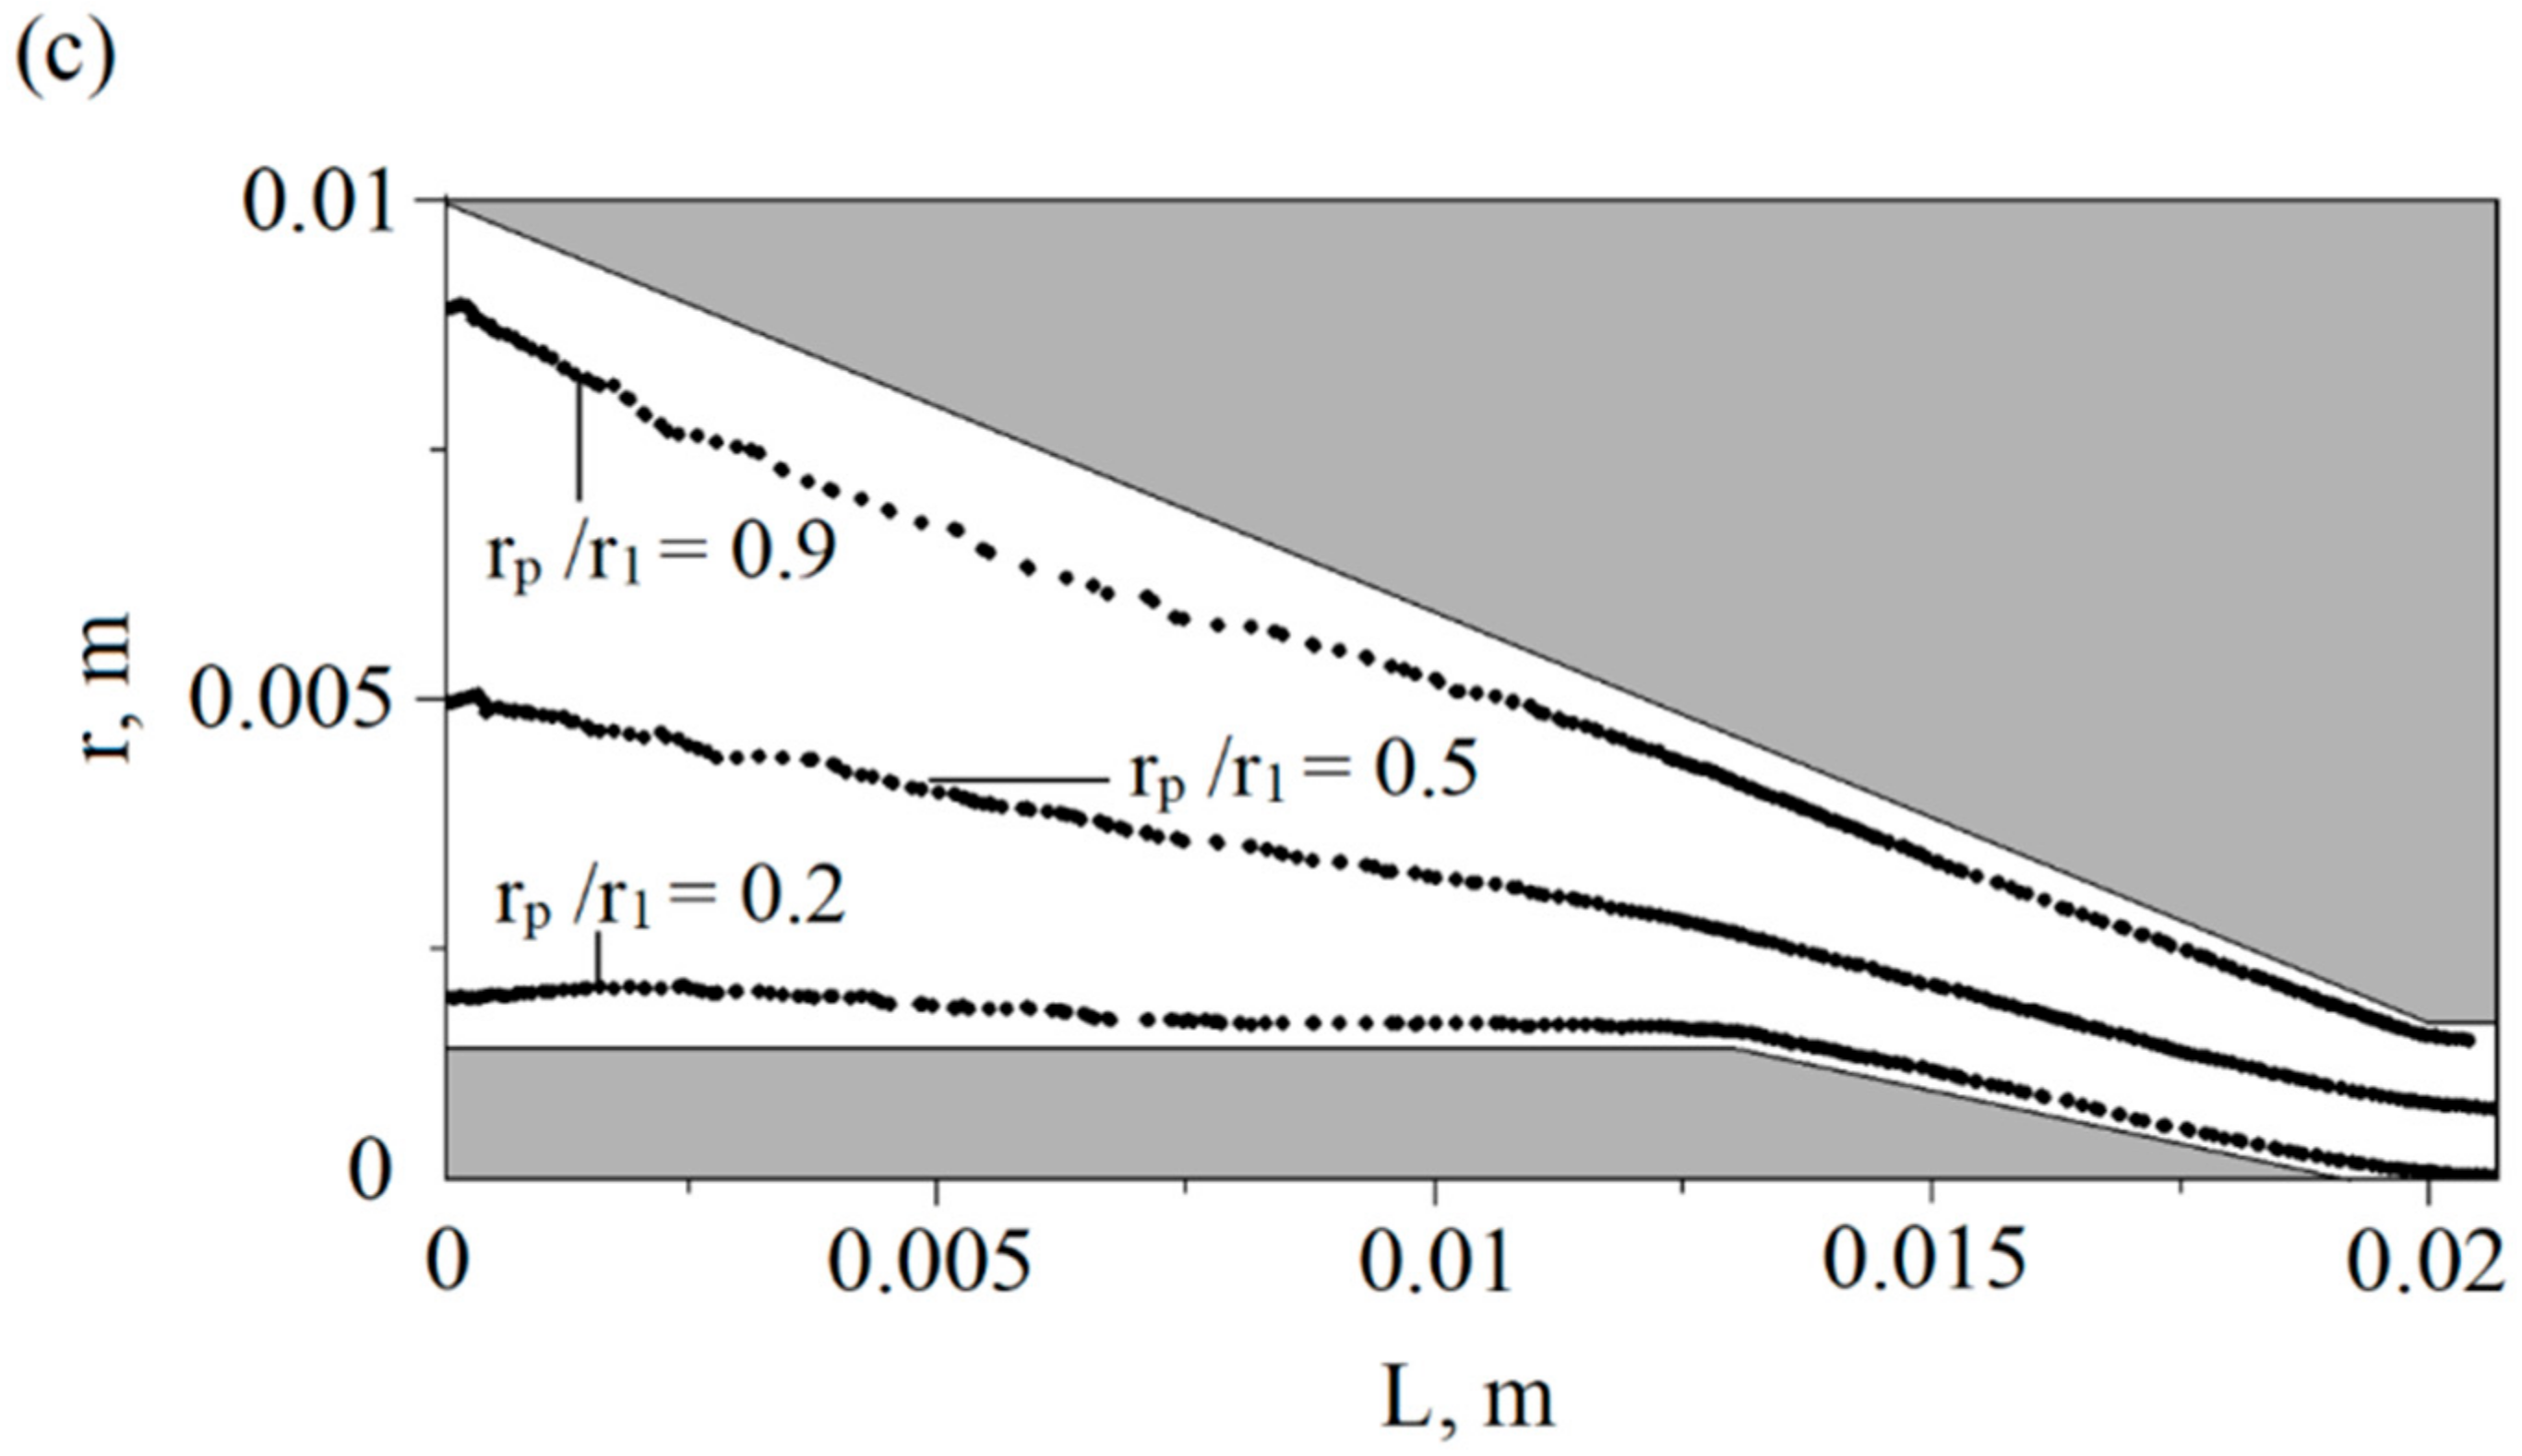
Figure 4 shows the trajectory of particles with diameters of 3 nm, 5 nm and 10 nm releasing at different radial positions (
rp) at a flow rate of 2 L min
−1. For the particles introduced close to the outer electrode (
rp/r1 = 0.9), the trajectory of the 3 nm nanoparticle significantly drifts away from the streamline driven by the particle diffusion force, and it is deposited on the outer electrode wall.
On the contrary, the particles with a diameter of 10 nm can leave the charger without being lost to the wall due to the diffusion force not being enough to bring them close to the wall. The trajectories of the particles with a diameter of 5 nm also deviate from the streamline by a diffusion force and deposits on the wall of the external electrode. Compared with the trajectories of the 3 nm particles, it is found that 5 nm particles move for longer and their attachment positions are closer to the downstream area. In the case of particles introduced close to the centerline (rp/r1 = 0.5), three particle sizes leave the charger without adherence to the wall. It is seen that 3 nm particle trajectories drift more significantly in the early stage than the other two particles. When they reach the downstream region, the Brownian motion mechanism of the particles reduces due to the acceleration of the airflow, and the particle trajectories gradually tend to the corresponding streamline.
For particles entering close to the needle electrode (rp/r1 = 0.2), the trajectories of 3 nm nanoparticles deviate from the streamline by the diffusion force, and then adhere to the wall of the needle electrode. However, the particles with a diameter of 5 nm and 10 nm survive the diffusion deposition process and pass through the charger smoothly without depositing on the needle electrode wall. In general, the trajectory of the smaller particles (3 nm) moves closer to the wall, while the trajectory of the larger particles (10 nm) approaches closer to the corresponding streamline. Notably, this study solves the movement of ultrafine aerosols under the combined forces of corrected Stokes drag and Brownian force. Hence, it is informative to provide a comparison of the two forces for ultrafine aerosols with various particle sizes, so as to understand the underlying physics more easily. Furthermore, this study is also useful for exploring how ultrafine aerosols follow the flow field. For ultrafine aerosols, it is worth investigating in the future to see if the particles will closely follow the flow field inside the charger when only the corrected Stokes drag is considered.
3.2. Ultrafine Aerosols Deposition
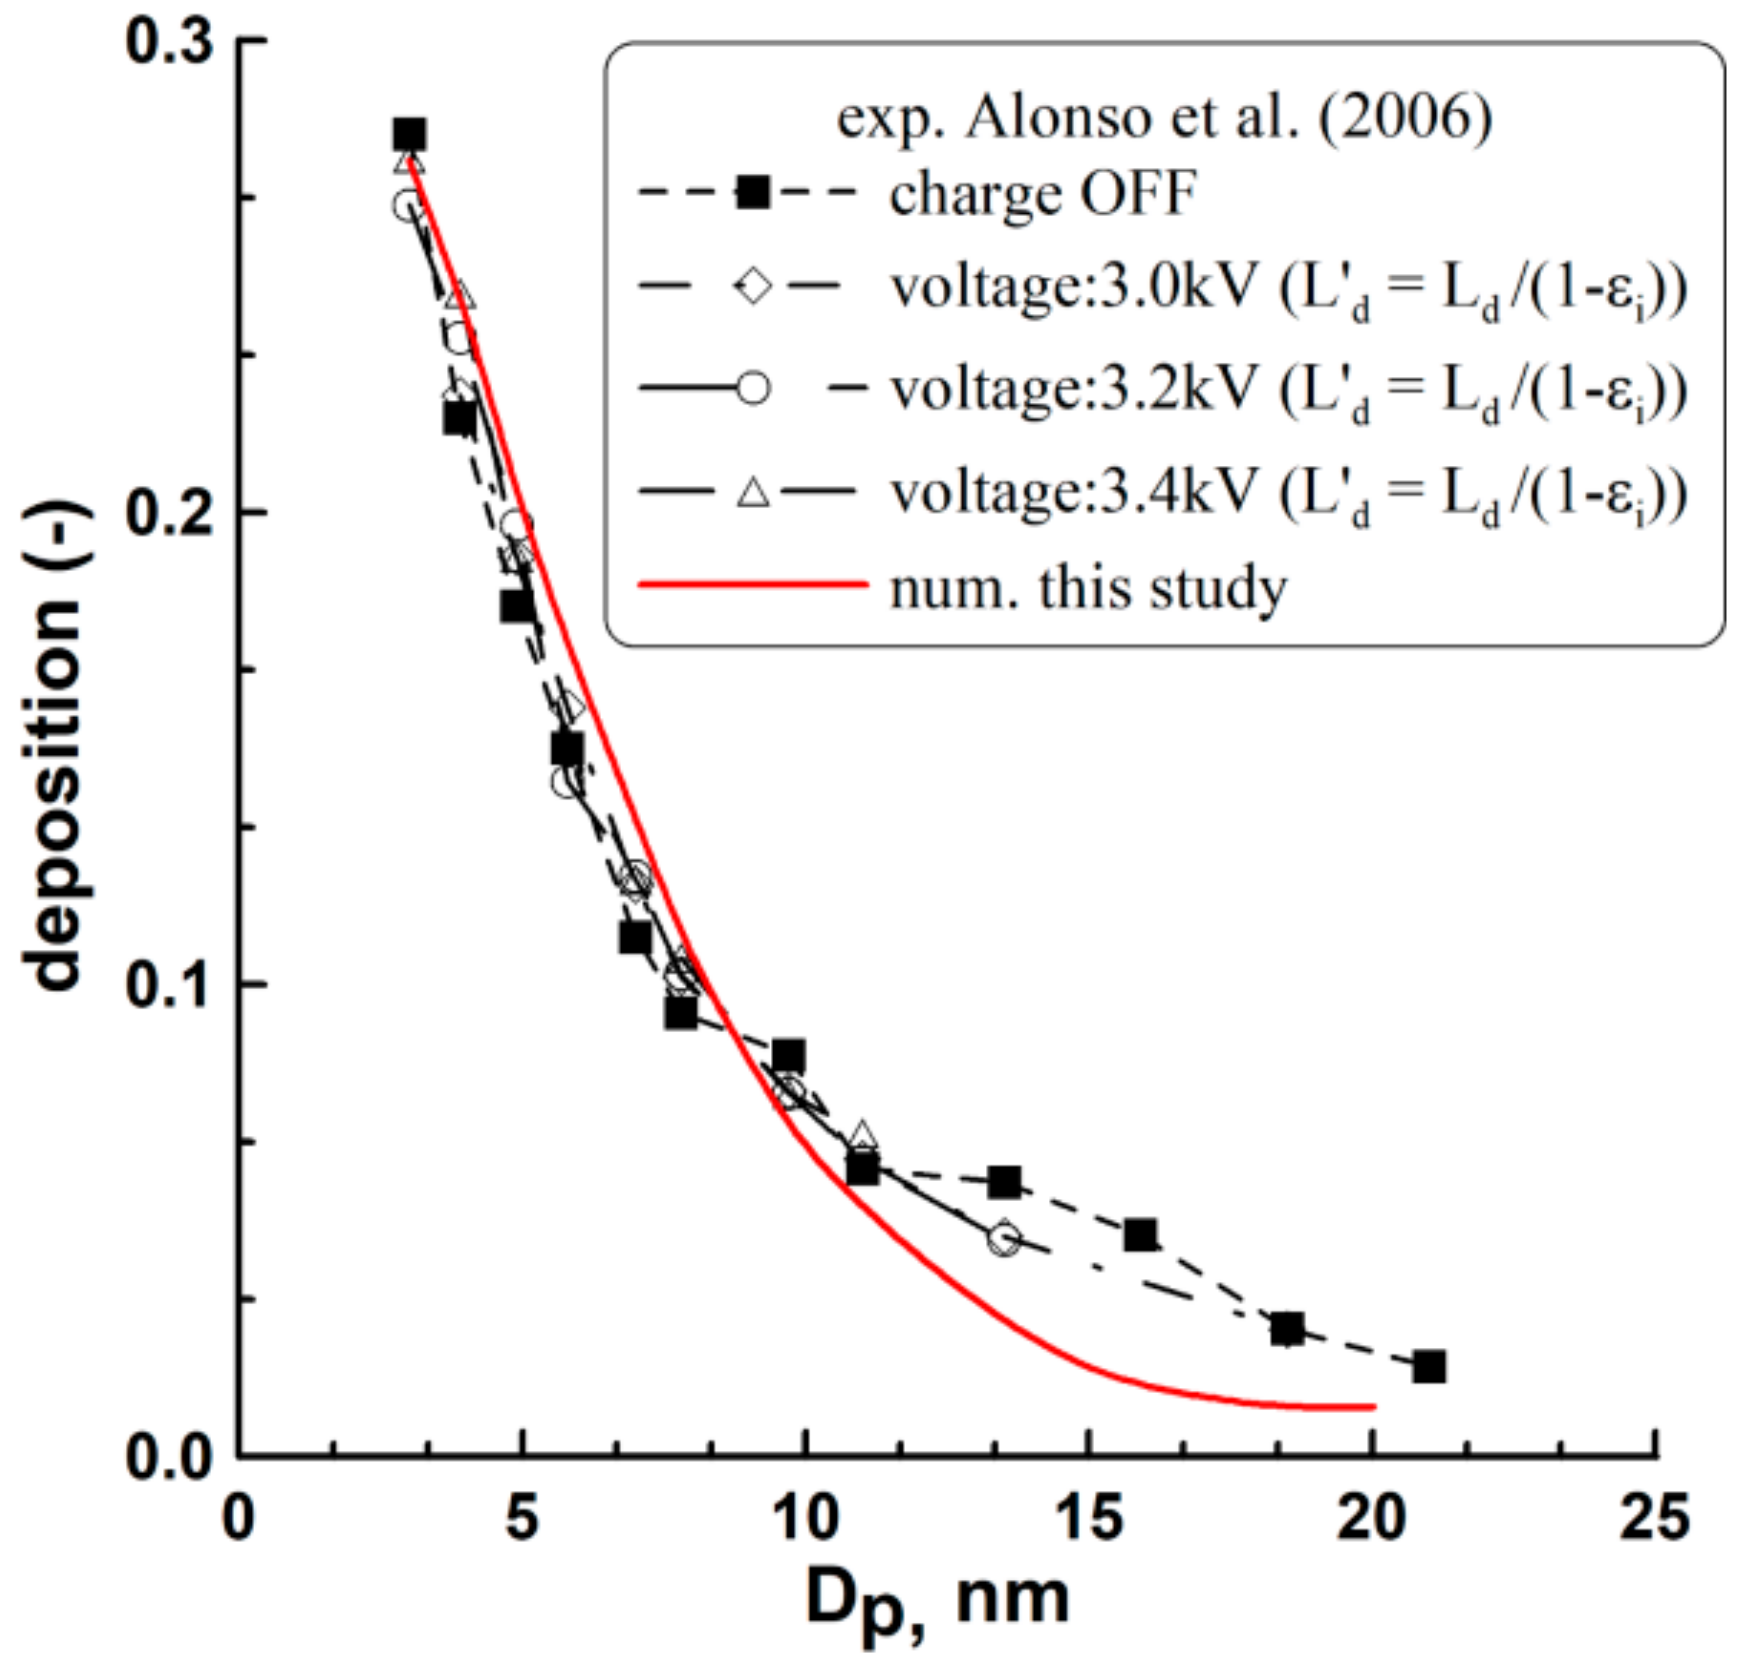
The numerically obtained results of the particle deposition in the needle charger are compared with the experimental data in the literature [
16], shown in
Figure 5. The plot demonstrates that the deposition of particles predicted by the present numerical model is close to the experimental data for the flow rate of 2.0 L min
−1. The figure also shows that the deposition fraction of particles in the needle charger without applied voltage is close to the fraction of particles lost by diffusion to the wall of the needle charger with various voltages. After corona discharge occurs, the proportion of intrinsically charged particles increases as the voltage increases, while the diffusion loss of particles decreases with the increase in voltage. Intrinsic charging efficiency is defined as the ratio of charged particles to originally neutral particles inside the charger [
16]. Although the diffusion losses decrease with increasing voltage, the proportion of remaining uncharged particles also decreases. In this situation, the diffusion losses will be close to each other regardless of whether the chargers are turned on or off. Additionally, for a charger without an applied electric field or when the charger works at a voltage lower than the voltage required for corona onset, the diffusional penetrations of uncharged particles are similar to one another.
3.3. Effect of Flow Rate
This study then examines the effect of flow rate on the particle deposition of the needle charger.
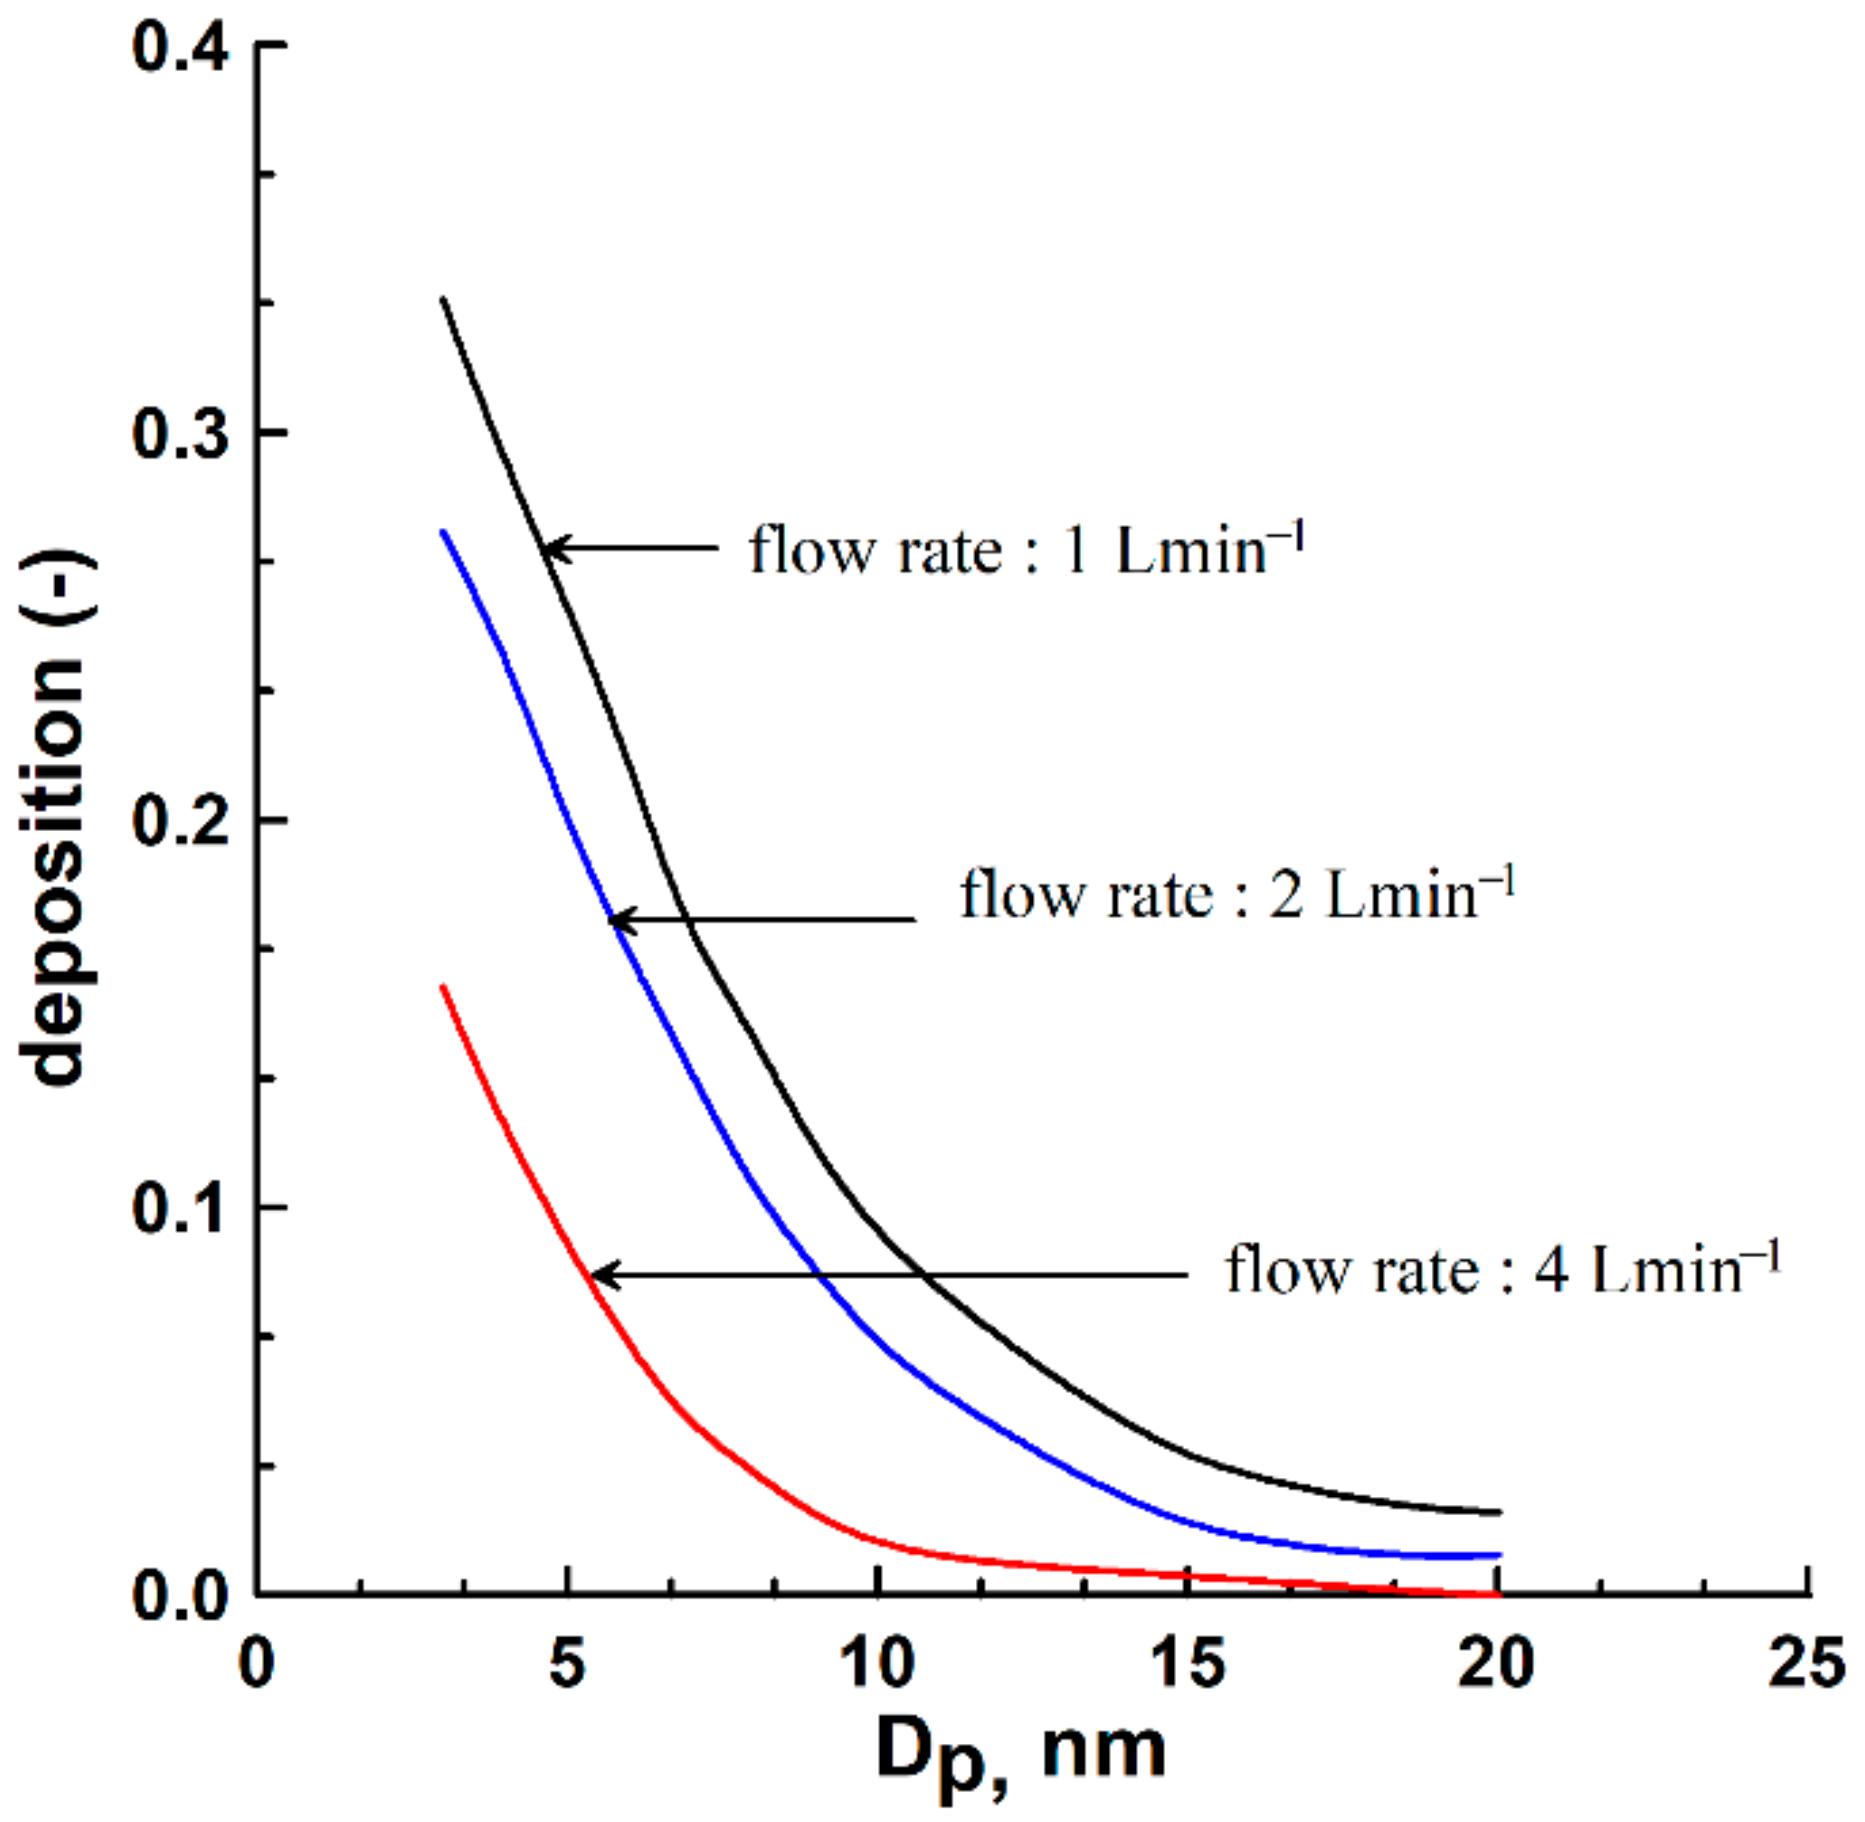
Figure 6 shows the particle deposition in the needle charger as a function of the particle diameter for the flow rates of 1 L min
−1, 2 L min
−1 and 4 L min
−1. For the needle charger at operating flow rates of 1, 2 and 4 L min
−1, the inlet flow velocity is 5.4, 10.8 and 21.7 cm s
−1, and the Reynolds number,
(
: inlet average flow velocity,
: the diameter of the inlet,
: the diameter of the needle electrode) is 61, 122 and 245, respectively. It is seen that the particle deposition decreases with increasing values of the particle diameter inside the needle charger for various flow rates. For the particles with a diameter of 3 nm, the particle deposition within the needle charger is about 33.4% at a flow rate of 1 L min
−1, and it is reduced to about 15.7% at a flow rate of 4 L min
−1. This is because the increasing flow rate of the needle charger reduces the diffusion time available for particles to reach the wall. For example, the diffusion time is 0.156, 0.078 and 0.039 s for the needle charger with a flow rate of 1, 2 and 4 L min
−1, respectively. For 15 nm particles, the particle deposition is about 2.9% at the flow rate of 1 L min
−1, and about 0.5% at the flow rate of 4 L min
−1. Since the diffusion for larger particles becomes weaker, the effect of flow rate on the particle deposition is less significant.
In general, the particle deposition in the needle charger with a larger flow rate is lower than that with a smaller flow rate. It is worth noting that the increase in flow rate reduces the diffusion time of particles within the needle charger and reduces the effective collisions between particles and ions, which affects its intrinsic charging efficiency. The intrinsic charging efficiency represents the proportion of neutral particles charged in the charger, regardless of whether they subsequently survive the deposition of particles in the needle charger.
3.4. Position of Particle Deposition
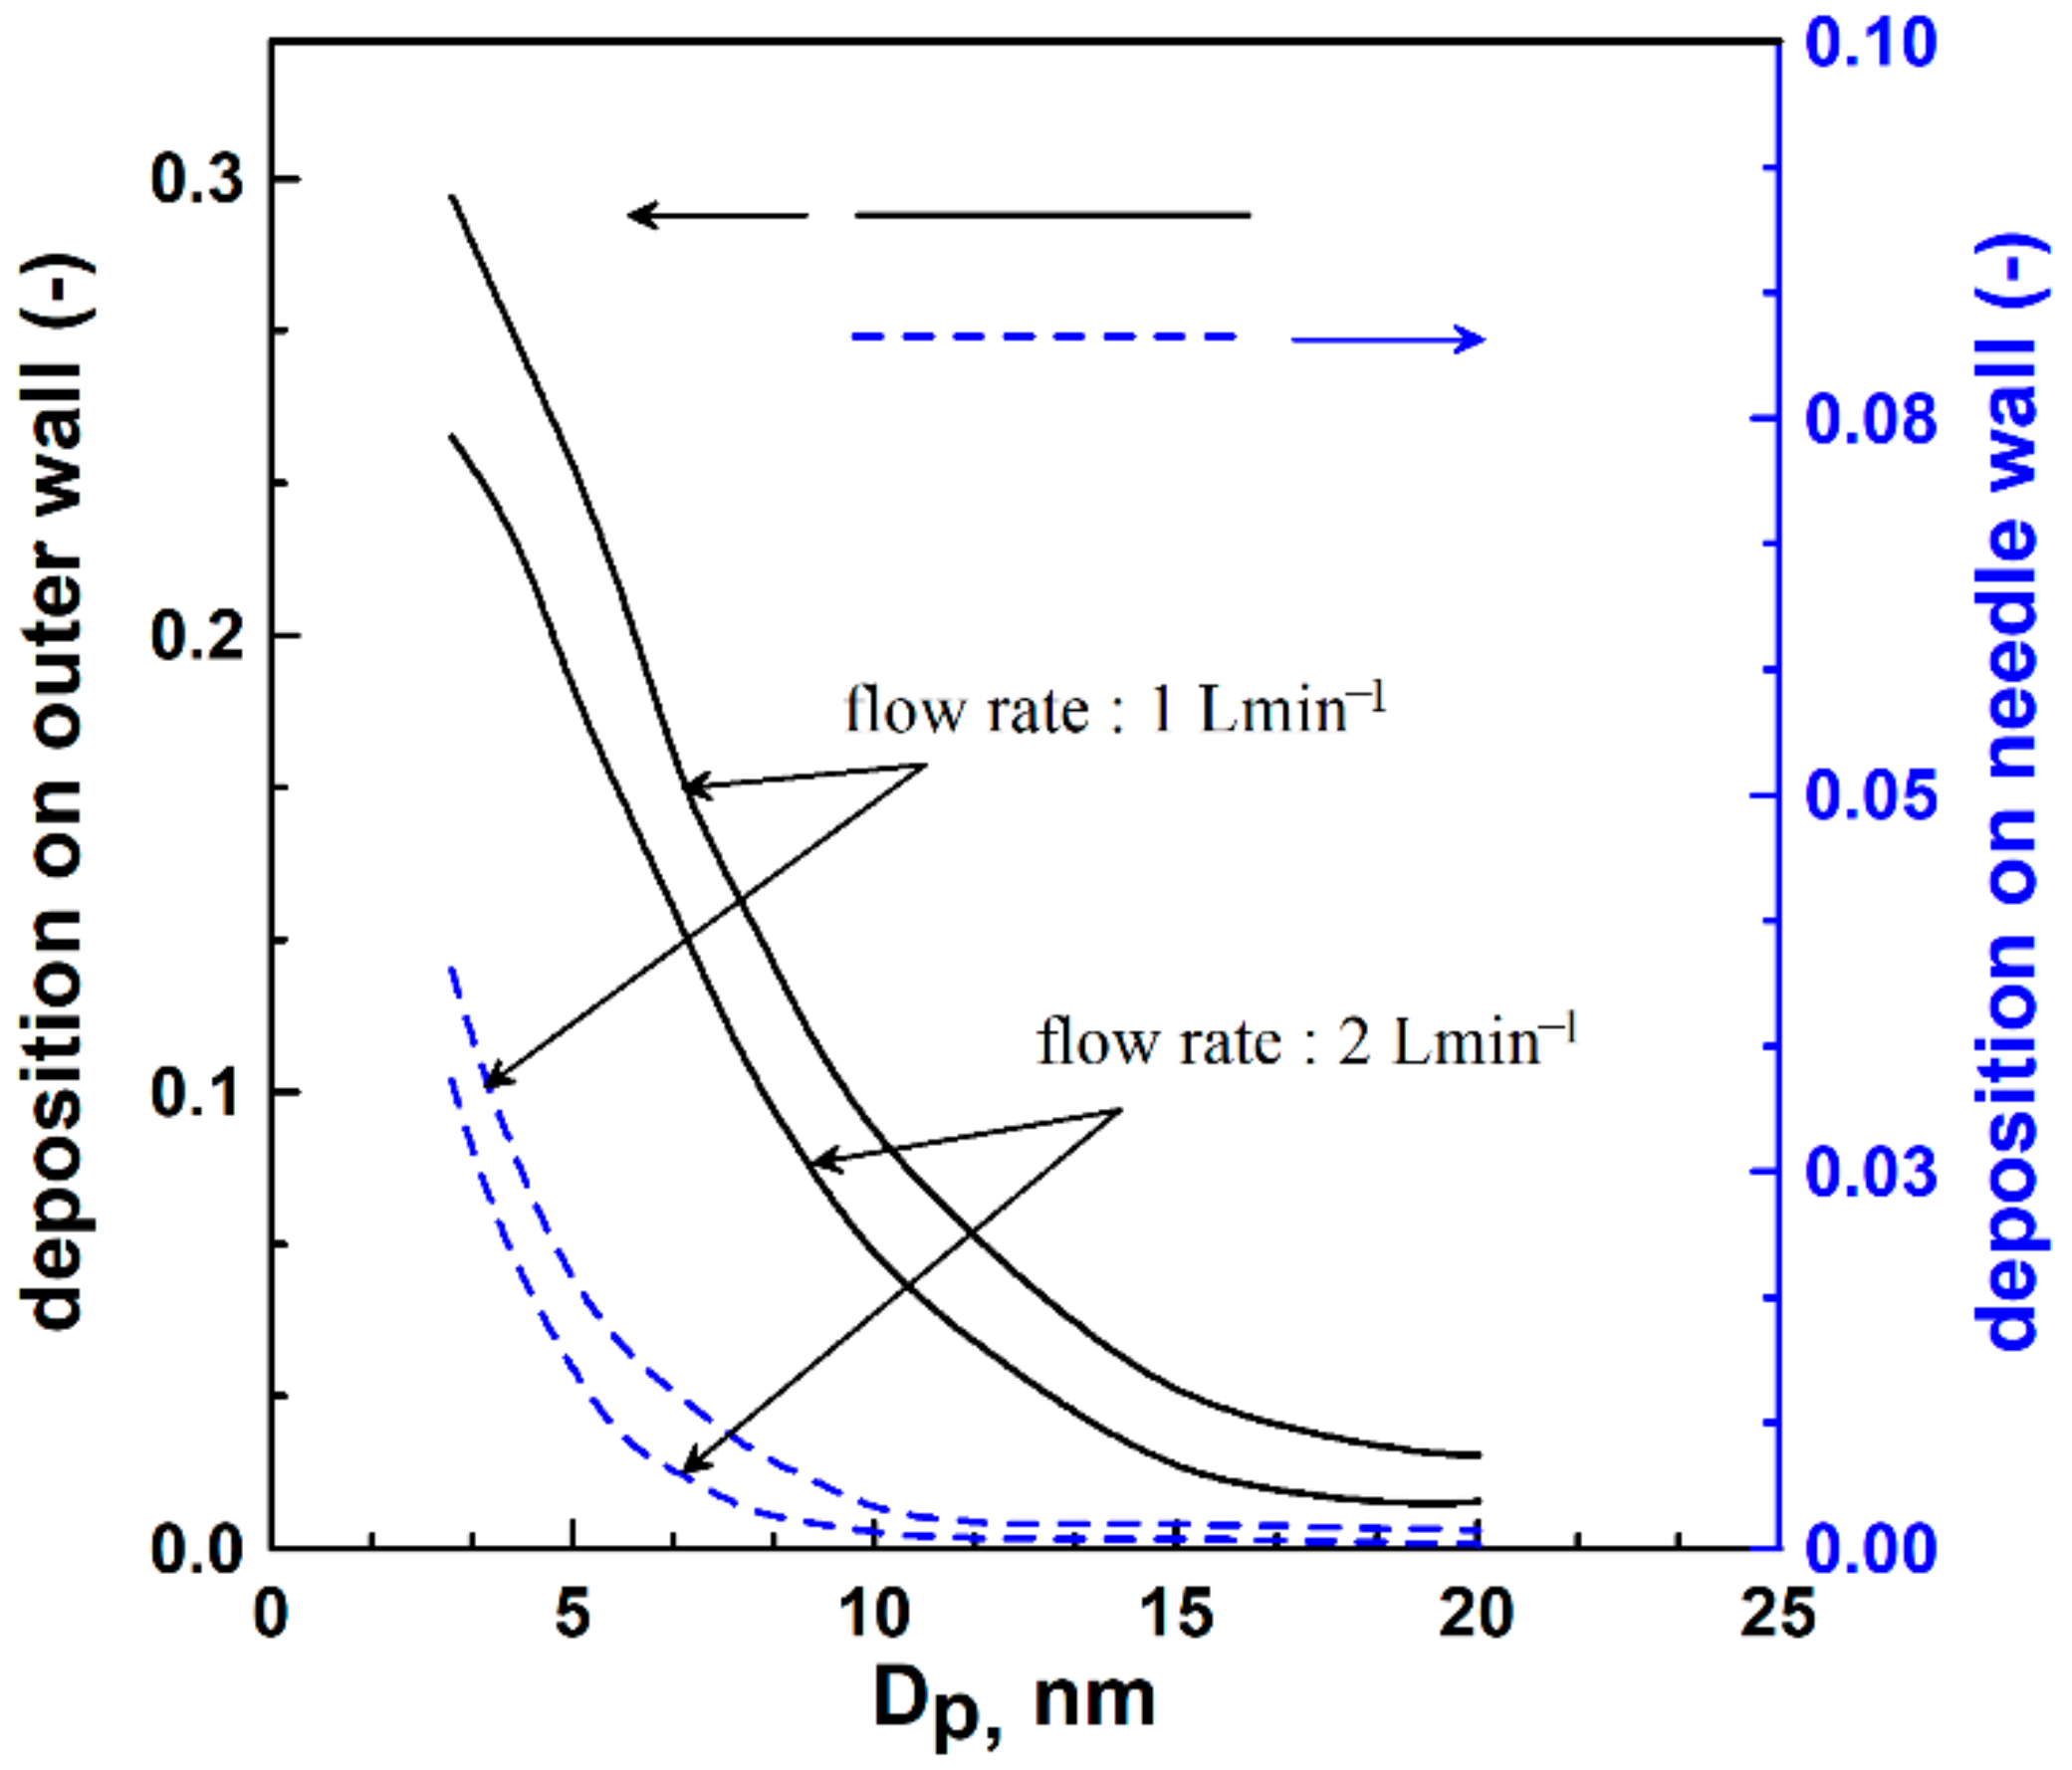
Figure 7 shows the percentage of particle deposition on the outer electrode wall and needle electrode wall of the needle charger at different flow rates. This figure shows that most of the particle deposition occurs in the outer electrode area for different particle sizes and flow rates. The particle deposition for the particle diameter of 3 nm on the outer electrode wall at the flow rate of 1 L min
−1 and 2 L min
−1 is about 29.6% and 24.3%, respectively. Particles with a larger flow rate stay in the needle charger for a shorter time, resulting in less diffusion deposition of the particles on the charger wall. For the needle electrode wall, the deposition of particles with a diameter of 3 nm is less than 4% at different flow rates.
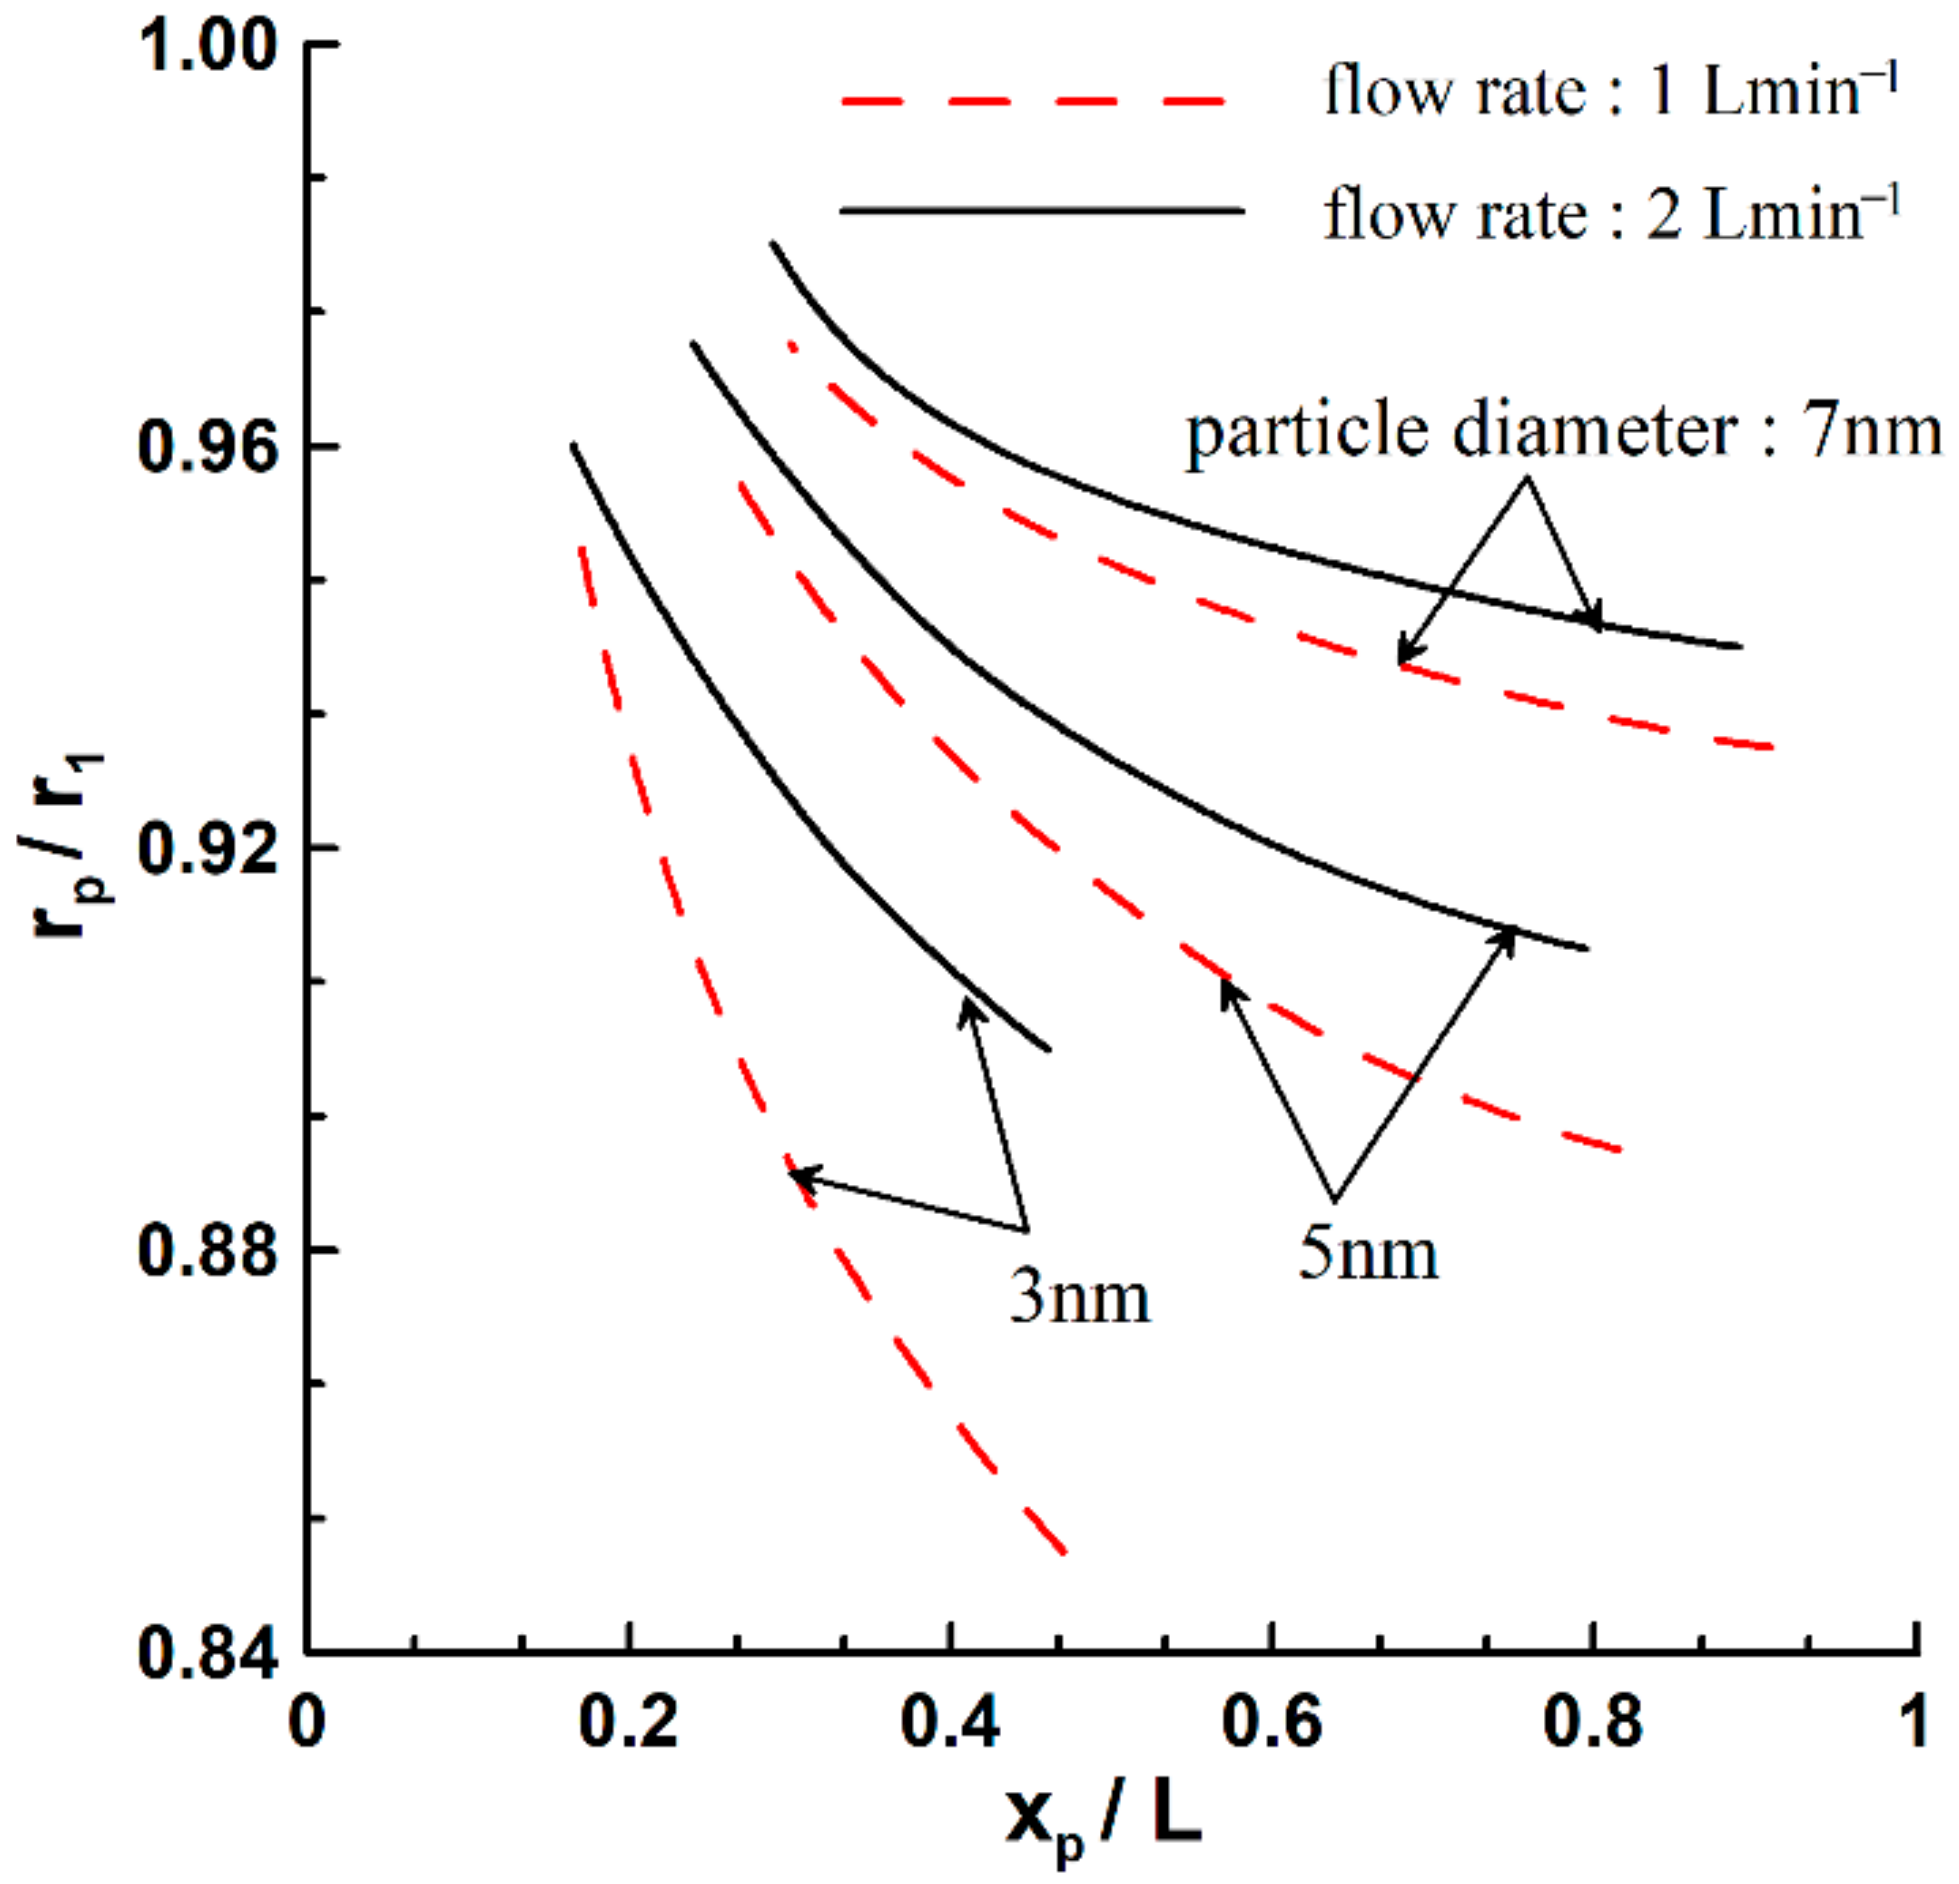
Figure 8 shows the deposition axial distance (
xp/L) of the outer electrode wall as a function of the entrance radial position (
rp/r1) for various particle diameters and flow rates. The deposition axial distance increases with the decrease in the entrance position in the needle charger. In other words, the particles collected by the outer electrode wall at the corresponding smaller entrance position indicate that the particles have larger particle diffusion depositions. Currently, the deposition distances for particles with a smaller entrance position are longer. The results show that the distance of the outer electrode wall affects the particle adhesion for different particle diameters and flow rates. In addition, for particles entering with the same position at various flow rates, the larger particles have a larger deposition distance because they are closer to the streamline and exhibit less diffusion deposition.


