Article

Seasonal Climate Trends across the Wild Blueberry Barrens of Maine, USA

1
School of Biology and Ecology, University of Maine, Orono, ME 04469, USA
2
Ecology and Environmental Science, University of Maine, Orono, ME 04469, USA
3
Climate Change Institute, University of Maine, Orono, ME 04469, USA
4
Cooperative Extension, University of Maine, Orono, ME 04469, USA
5
School of Earth and Climate Sciences, University of Maine, Orono, ME 04469, USA
6
School of Food and Agriculture, University of Maine, Orono, ME 04469, USA
*
Authors to whom correspondence should be addressed.
Atmosphere 2022, 13(5), 690; https://doi.org/10.3390/atmos13050690
Submission received: 30 March 2022 / Revised: 19 April 2022 / Accepted: 21 April 2022 / Published: 26 April 2022

Abstract

:
Wild blueberries in Maine, USA are facing threats from our changing climate. While summer climate variations have been affecting this important commercial crop directly, significant climate variations in other seasons also can be potentially detrimental to blueberry production. Therefore, we analyzed annual and seasonal climate trends (temperature, rainfall, snow cover) over the past 41 years (1980–2020) for seven Maine counties (Piscataquis, Washington, Hancock, Knox, Lincoln, Kennebec, York) with large wild blueberry areas. We found that, across all blueberry production fields (or “barrens”), historical temperatures increased significantly (p < 0.05) in the fall and winter followed by summer, but not in the spring. Additionally, precipitation increased slightly (0.5–1.2 mm/year) in the winter and fall, whereas no changes were found in the spring and summer. Furthermore, we found that historical temperatures were lower in Piscataquis (north-central) and Washington (north-east) counties, whereas in south-western counties (Hancock to York) experienced a relatively warmer climate. The rate of increasing temperature was comparatively slower in the warmer barrens located towards the south-west (Hancock to York). Moreover, the growing season lengthened towards the fall season consistently in all locations, whereas lengthening towards the spring was inconsistent. These findings inform the wild blueberry growers in different locations of Maine about the seasonal shifts occurring for their crop. This knowledge may assist with land management planning in order for the growers to prepare for future impacts.

1. Introduction

Wild lowbush blueberry has been one of the three most economically important commercial crops native to North America for hundreds of years. This crop was not planted; rather, it started to grow naturally on large fields, or “barrens”, formed through glacial outwash plains 10,000 years ago [1]. In fact, this naturally growing and evolving temperate crop is one of the largest crops produced in Maine, USA, managed by over 480 growers across the state, and covering 41,000 acres [1]. These wild blueberry barrens are mainly distributed in the coastal climate region and a fraction of the interior climate region of Maine [1,2,3]. These coastal regions followed by the interior region are experiencing faster annual atmospheric temperature increments and extremes, longer growing seasons, and more drastic rainfall events [2,3]. Therefore, wild blueberries growing in those regions are also exposed and potentially vulnerable to such drastic climate changes.
Meantime, there may be benefits of a warmer climate. Based on analyzed relationships between historical climate parameters and blueberry yield in Maine, blueberry yield may increase under a warmer climate with higher precipitation [3]. If increased precipitation came at appropriate times and amounts, it would improve soil moisture for the blueberries to counterbalance the water stress effects on this crop due to the warmer climate (increased water use under a warmer climate). On that note, wild blueberry barrens in the Downeast region of Maine are still vulnerable because they are experiencing a higher increase rate in temperature during their growing period compared to the rest of the state with no changes in rainfall [4]. Additionally, coarse-grained sandy soils in the wild blueberry barrens cannot efficiently hold soil moisture for the plants. Under such circumstances with low soil moisture availability due to less rainfall and sandy soils, higher crop water loss further adversely affects the physiological, morphological, and yield performances of the wild blueberry plants [4,5,6]. The Washington County is the largest (~70%) wild blueberry production region of Maine, USA [7], and climate warming at a faster rate would directly affect the local economy by hurting the livelihoods of wild blueberry growers in this region.
In order to stay in business, growers need to be vigilant and take necessary management actions in their wild blueberry fields. Necessary actions include investing in irrigation due to frequent droughts (higher temperatures with less rainfall in summer) and adopting strategies to retain soil moisture due to the low moisture-holding capacity of wild blueberry soils [4,5,6]. To adjust the management techniques accordingly, growers who manage fields in different towns and counties need to know the regions of most concern and the intensity of changing temperature and rainfall in their blueberry fields [4]. Wild blueberry fields in the Washington County of Maine have already experienced considerable variations in temperature and precipitation. Such spatial variations significantly depend on the geospatial locations of the wild blueberry barrens and are related to the latitude, longitude, elevation, and distances from the coast [4].
Although a previous study reported the importance of considering spatial climate variations for managing these barrens, it focused on one major production county (Washington) [4]. Wild blueberry barrens are also found in other counties (Hancock, Knox, Waldo, Lincoln, Kennebec, York) farther south and west from the Washington County along the coast (Figure 1) and in small parts of northern Maine (Piscataquis and Penobscot Counties in the interior climate region). Therefore, it is important to learn and compare the extent of climate variations that barrens in all regions are experiencing. This would better inform the growers about the local climate variations in their fields, thus increasing their awareness and better enabling them to manage their fields accordingly. Moreover, comparing the climate variations across different counties in different latitudinal and longitudinal directions (Figure 1) would indicate the temperatures to which this crop may migrate in order to find favorable growing conditions if the existing barrens cannot be managed properly.
In addition to the growing season (summer), other seasons (fall, winter, and spring) are also dramatically changing. For example, the growing season lengthened by 14 days over the last 20 years due to warmer spring and fall seasons, in addition to a shift in early fall frost and late spring frost dates [2,3,8,9,10]. Such an extended growing season has been shown to be beneficial for some crops [9], and cultivated crops can be managed with necessary actions in response to changing climate [8]. However, some crops such as the naturally growing wild blueberries cannot be managed like the cultivated crops. Some region-specific crops might face more negative impacts (pests, intense rainfall events, soil erosion, heat waves, seasonal droughts) than positive impacts (longer period for development through higher carbon assimilation for carbohydrate production) [2,3,5,6,8,9,10,11]. Moreover, warmer winters were found to adversely affect temperate grasslands more than the warmer summer [12]. In fact, abnormal higher temperatures in late winter and early spring can trigger the early development of plants and crops. In this scenario, they would be more susceptible to frost damage because unusually late last spring frost caused significant crop (apple, blueberry, peach) damage in some years (e.g., 2012, 2016, 2020) over the past decade [2,3,8]. Under such circumstances, seasonal climate variations for the wild blueberry barrens in temperate Maine need immediate assessment because we cannot rely on existing seasonal climate patterns for the whole state of Maine [4].
To this end, our study aims to: (1) quantify the historical (1980–2020) changes in maximum (Tmax indicating daytime temperature), minimum (Tmin indicating nighttime temperature) and average (Tavg) temperatures, total precipitation (Ptotal), and snow cover (snow water equivalent) annually and seasonally (summer, fall, winter, spring) for wild blueberry barrens in Maine; (2) characterize historical climate variations across different counties, from the north-central (Piscataquis) and north-east (Washington) regions, towards the south-west (Hancock, Knox, Lincoln, Kennebec, York) (Figure 1); and (3) assess the growing season length and the timing of the last spring frost and first fall frost across different counties for the wild blueberry barrens located both closer and farther from the coast at different latitudinal and longitudinal directions in Maine, USA. Based on these analyses, our study also presents a detailed analysis of the potential positive and negative impacts of the studied climate parameters and trends on wild blueberries of Maine. This work intended to assist researchers and growers in developing proper strategies, and to reveal the spatial and temporal extent of climate change threats to this unique natural agricultural system.

2. Materials and Methods

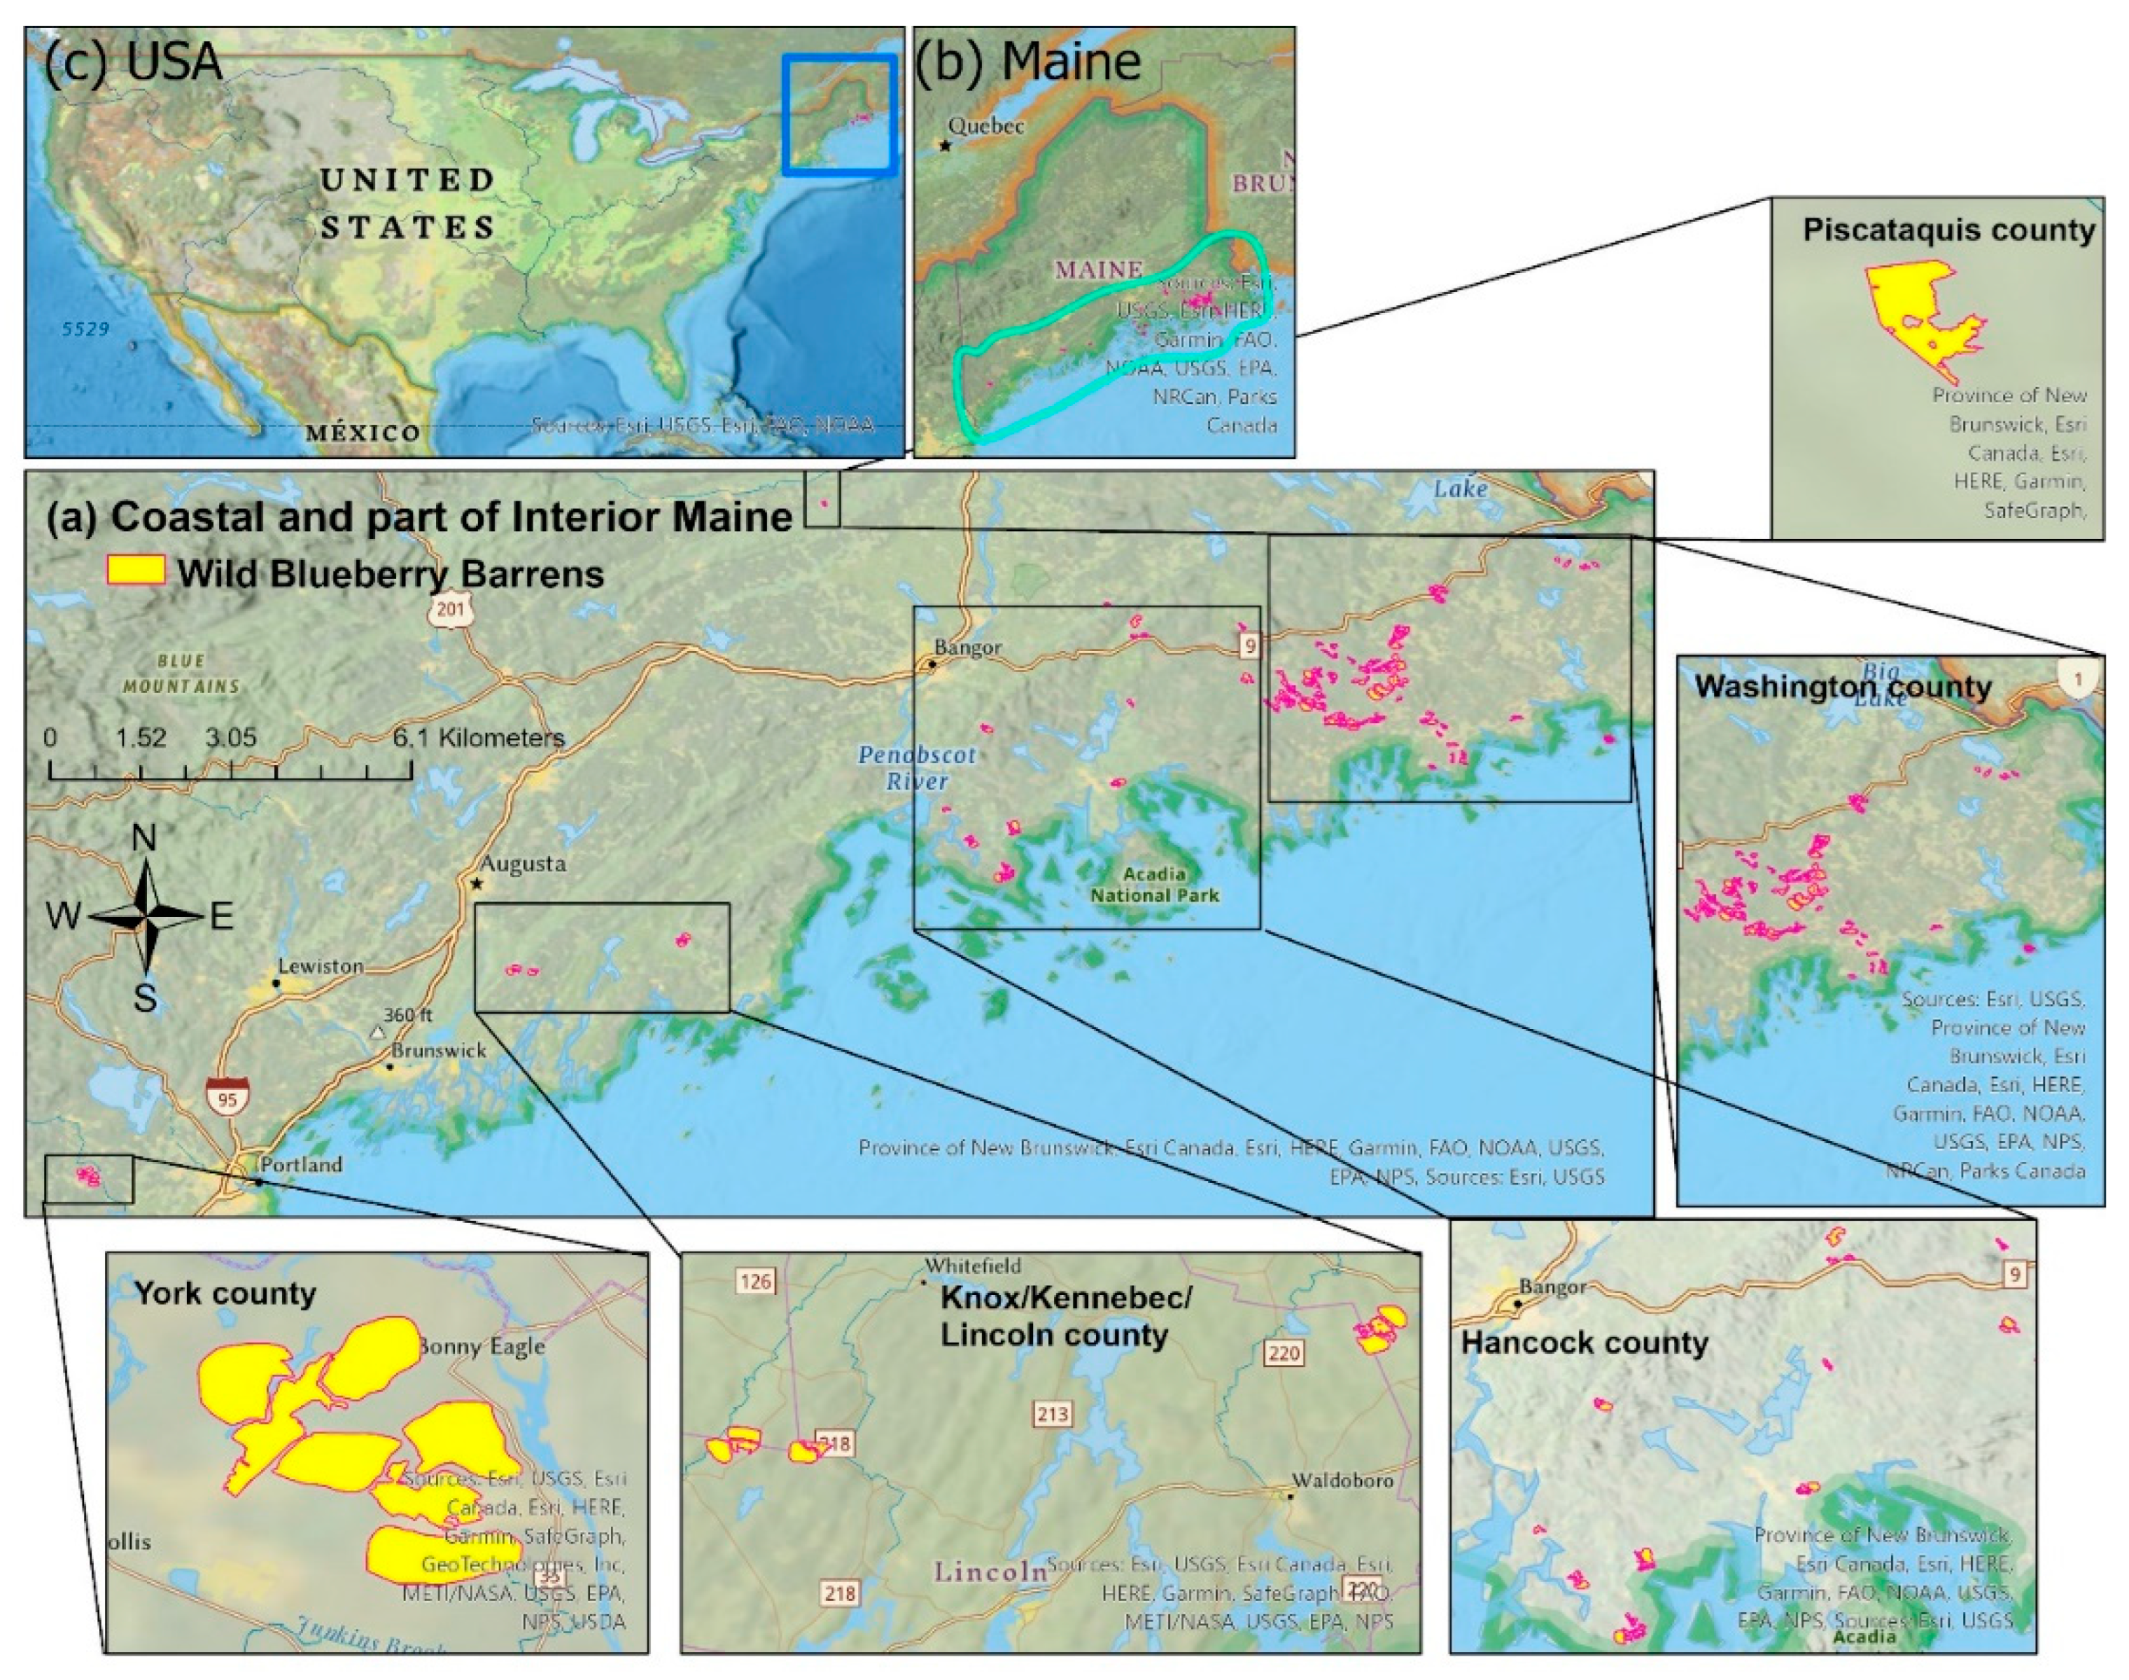
2.1. Data Source and Acquisition

The dataset of both annual and monthly climate variables (maximum temperature, minimum temperature, average temperature, total precipitation, snow water equivalent) from 1980 to 2020 for North America was acquired as raster files from Daymet (https://daymet.ornl.gov/getdata, accessed on 17 May 2020) [13,14]. These raster files were provided on a per-pixel basis at 1 km spatial resolution. Daymet data source was chosen over other gridded climate data sources (i.e., PRISM) because of its higher spatial resolution, suitability for our study, and the fact that some studies did not find significant differences among the climate data acquired from different gridded data sources [15,16]. After acquiring the raster climate files from Daymet, we used different tools of Arc GIS Pro 2.4.2 Software [17] to clip and extract the datasets for our studied wild blueberry barrens. These datasets were then transferred from Arc GIS Pro to an Excel spreadsheet (Microsoft, Redmond, WA, USA) for data arrangements and further analyses.
The polygons of the studied wild blueberry barrens in different counties of Maine (Figure 1) were acquired from a Google Earth Pro (https://www.google.com/earth/versions/#earth-pro; accessed on 1 April 2020) KMZ file based on a field survey carried out by David Yarborough, Professor Emeritus of Horticulture and Wild Blueberry Specialist, University of Maine. Since the spatial resolution of the datasets for climate variables was 1 km, we separated the wild blueberry barrens into two categories based on their area: (1) 0.5–1 km2 barrens and (2) >l km2 barrens. Then we compared the climate variables for these barrens of two different sizes and found that they did not differ from each other (data not shown here). Therefore, we finally used the wild blueberry barrens of 0.5 km2 and a larger area to analyze and compare the acquired climate variables for those barrens located in the studied different counties (Figure 1 and Figure S1). Here, it is to be noted that we found more 0.5 km2 and larger wild blueberry barrens in Washington and Hancock counties compared to the other studied counties (Knox, Lincoln, Kennebec, York, and Piscataquis) as shown in Figure 1. Therefore, we used the climate variables averaged across all the barrens from the studied different counties as categorized in Figure 1. Further, based on the annual average temperature cycle, we compared the approximate growing season length and the timing of the first fall frost and last spring frost during different periods (1980–1990, 1991–2000, 2001–2010, 2011–2020) for the wild blueberry barrens located in different counties of Maine. Growing season length was calculated based on the time duration when the average temperature was 55 °F (12.8 °C) and above. Last spring frost and first fall frost dates were determined when the average temperature was 32 °F (0 °C) on the last day of spring and the first day of fall, respectively.
The temperature data we used in this study were measured at 2 m (6.5′) height from the ground surface. The average wild blueberry plant height can be typically 20–30 cm (8”–12”). It is not unusual that the ground and shorter wild blueberry plants might experience significantly lower temperatures than the air temperatures measured at 2 m (6.5′). Therefore, we used the air temperature data measured at 2 m (6.5 ft) and also temperature measured with weather stations installed at ~60 cm (2′) close to the wild blueberry plants at the Blueberry Hill Farm, Jonesboro, Maine to fit a linear regression (Figure S2). For this purpose, we used available monthly average temperature data from 1980–1989 and 2010–2018. From the linear regression (R2 = 0.997 in Figure S2), we found that the plants were experiencing similar temperatures recorded at 2 m (6.5′), which is the typical height that air temperatures are recorded with deployed weather stations.

2.2. Data Analyses

Statistical analyses of the acquired data were conducted using JMP Pro 16.2 (SAS Institute Inc., Cary, NC, USA) [18] and XRealStats (Addinsoft, New York, NY, USA) [19]. Changes (increases or decreases) in climate variables (Tmax, Tmin, Tavg, Ptotal, SWE) over the past 41 years from 1980 to 2020 in the studied wild blueberry barrens in different counties of Maine (Figure 1 and Figure S1) were determined from linear regression trendlines. Trend analyses of the annual and seasonal climate variables were conducted using the Mann–Kendall (MK) trend test. Kendall’s tau with p-values and Mann–Kendall trend test results were computed using JMP Pro 16.2 and XRealStats [18,19] where continuity correction was applied, and the autocorrelation was taken into account using the Hamed and Rao method [20]. This Hamed and Rao method is a modified version of the original MK test by Mann and Kendall. Further, the differences in slopes of the linear fitted lines among the barrens in different counties were analyzed using Student’s t-test at the significance level of p < 0.05. Moreover, a Pearson correlation analysis was conducted between the changing rates of climate variables (increase in Tmax, increase in Tmin, increase in Tavg, increase in Ptotal, increase in SWE) and geographic factors (latitude, longitude, distance from the coast) for the studied wild blueberry barrens, as shown in Figure 1. Here, in order to provide multiple analysis significance protection, the p-values were adjusted using the Benjamini and Hochberg method at a false discovery rate (FDR) of 0.05 [21]. Basically, FDR is a statistical approach used in multiple hypothesis testing to correct for multiple comparisons in order to correct for random events that falsely appear significant. This FDR can be controlled by the Benjamini–Hochberg method [21], which uses sequential modified Bonferroni correction for analyzing significant differences in multiple comparisons.

3. Results

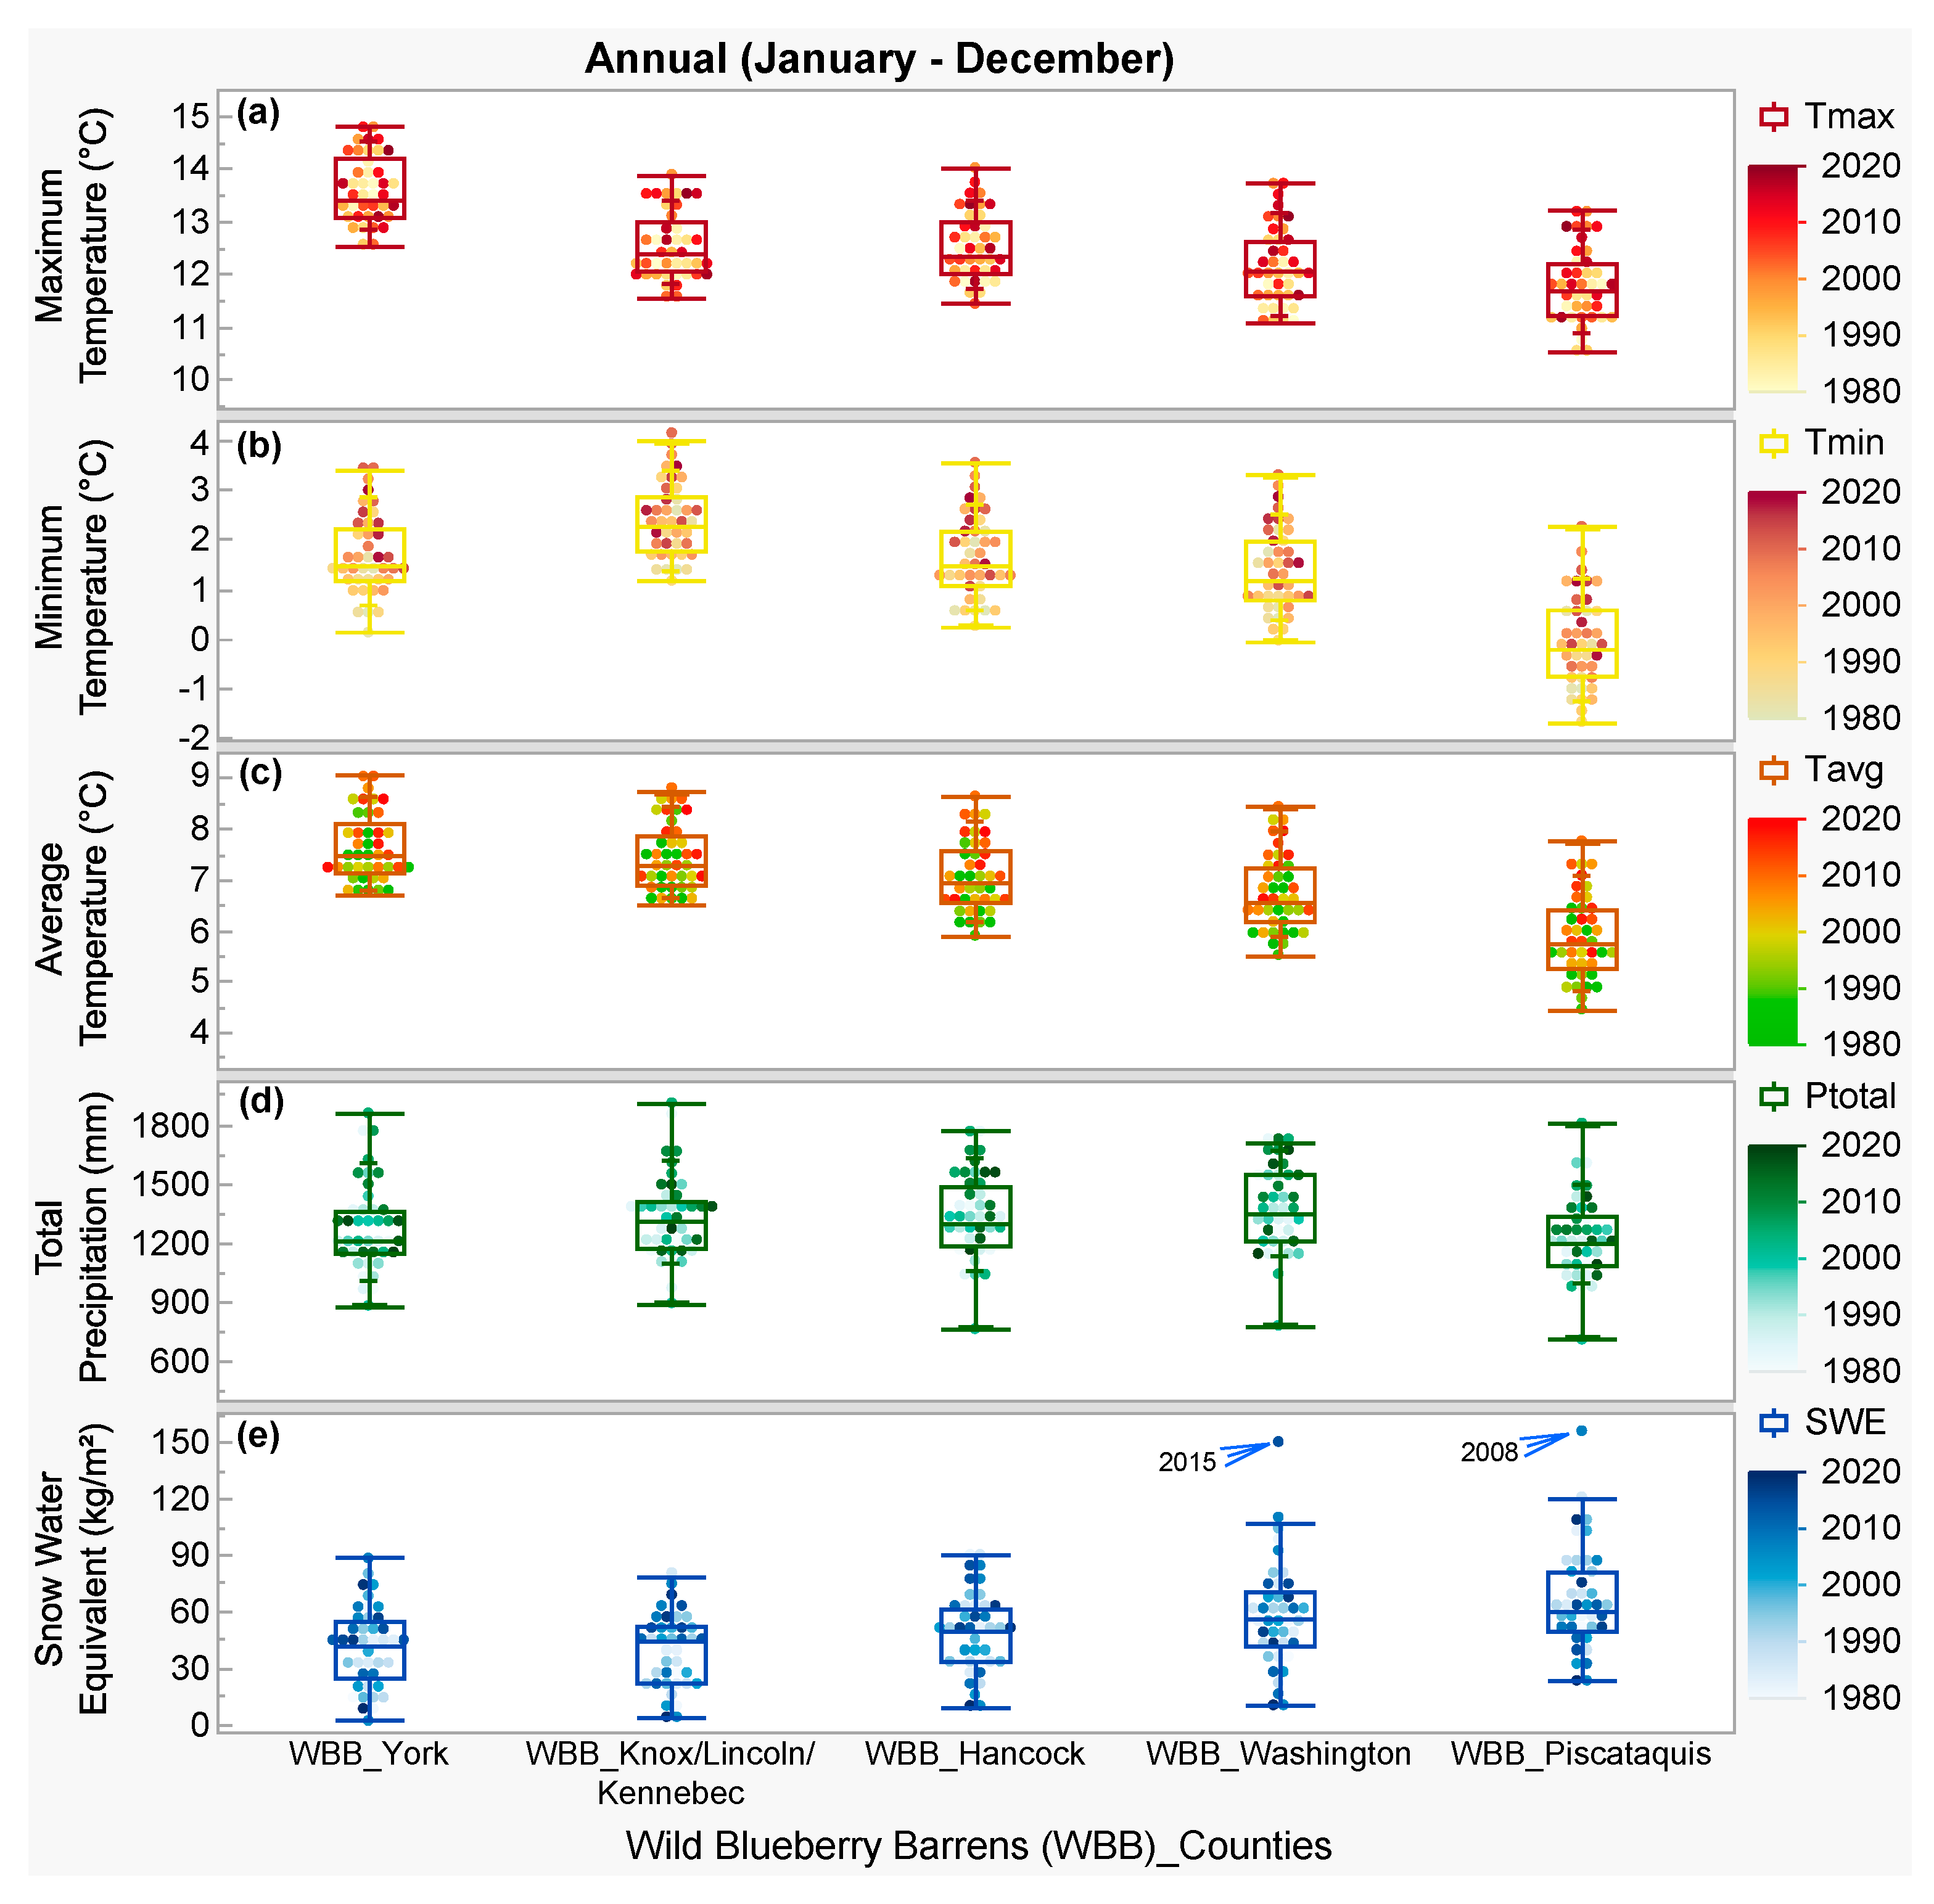
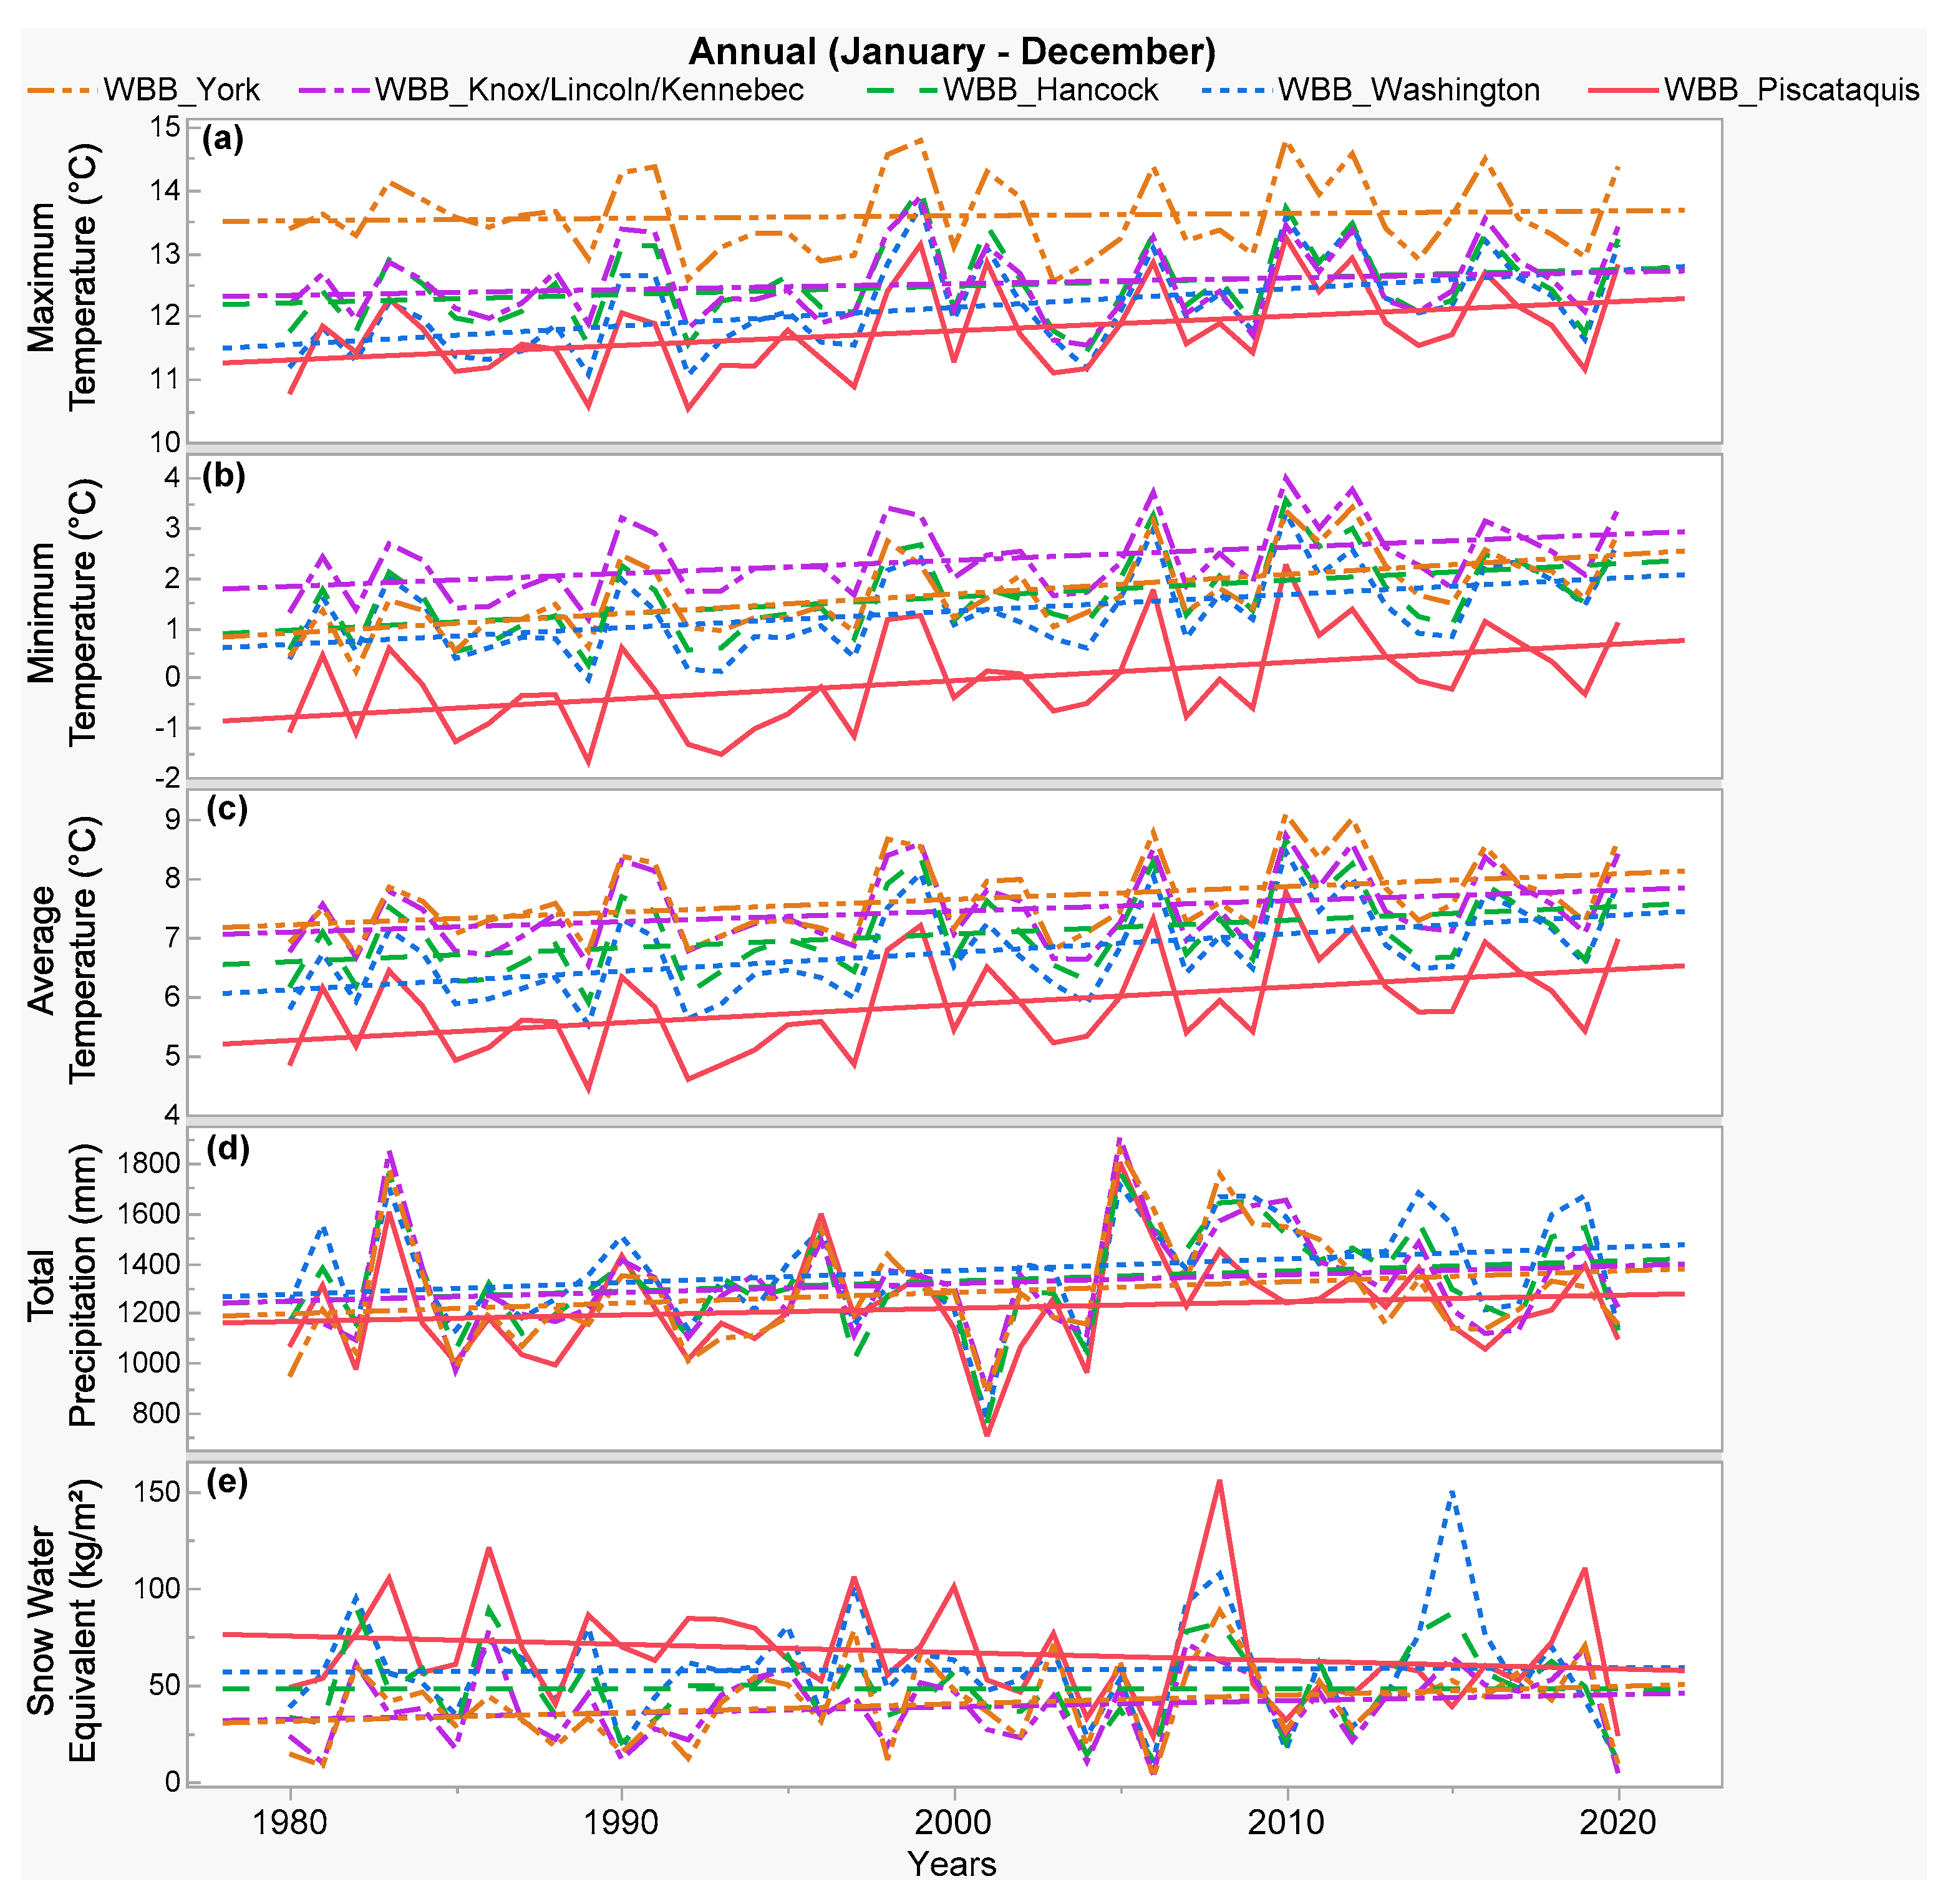
3.1. Annual Climate Changing Trends (1980–2020) in the Wild Blueberry Barrens

Based on the comparisons of temperature box plots (Figure 2a–c), annual temperatures were higher in barrens of the studied coastal counties (Washington to York) compared to Piscataquis County towards the north. In fact, temperatures were observed to be gradually higher in barrens of the studied coastal counties farther south-west from Washington to York (Figure 2a–c). In contrast, total annual precipitation was similar in barrens of all studied counties (Figure 2d). In agreement with the trends observed for temperatures, snow water was found to be slightly higher in barrens of the Piscataquis County followed by Washington County, compared to other studied coastal counties farther south-west (Hancock to York) (Figure 2e). Moreover, barrens in the Piscataquis County in 2008 and Washington County in 2015 experienced unusually higher (outliers in Figure 2e) snow cover.
The annual maximum temperature increased significantly in the wild blueberry barrens in Piscataquis (1 °C) and Washington (1.3 °C) Counties, compared to other studied coastal counties farther south-west (Hancock to York), where temperature increment rates (0.2–0.6 °C) were not significant (Figure 3a, Table 1). In contrast, the annual minimum temperature significantly increased (1.2–1.7 °C) in the barrens of all studied counties (Figure 3b, Table 1). Consequently, the annual average temperature (Figure 3c, Table 1) increased significantly (0.8–1.5 °C) in the barrens of all studied counties but the increase rate was higher in Piscataquis and Washington counties (1.3–1.5 °C) compared to other coastal counties (0.8–1 °C) farther south-west. Moreover, the annual total precipitation increased in the barrens of all studied counties, but the increase was significant at a rate of 5.61 mm/yr (~0.22”/yr) only in Washington County (Figure 3d, Table 1). The precipitation increase rate was significantly slower in Piscataquis County (2.93 mm/yr: 0.11”/yr) compared to the increase rate in other studied counties (4.4–5.6 mm: 0.17–0.22”/yr) (Table 1). There were no significant changes in historical snow cover trends (Figure 3e and Figure S3, Table 1). The increasing trend in snow cover (15 kg/m2) in the counties from Knox to York (Figure 1 and Figure S1), and the decreasing trend in snow cover (15 kg/m2) in Piscataquis County (Figure 3e) from 1980–2020 were not significant.

3.2. Seasonal Climate Changing Trends (1980–2020) in the Wild Blueberry Barrens

Based on the comparisons among different seasons, historical maximum, minimum, and average temperatures increased significantly (Table 2 and Table S1) in the blueberry barrens of Maine in the summer (Figure 4 and Figure 5), winter (Figure 6, Figure 7 and Figure 8), and fall (Figure 9 and Figure 10), but not in the spring (Figure 11 and Figure 12). Moreover, the overall historical temperature increase rates (Table S1) were higher for the barrens in the fall (0.9–2.9 °C) and winter (0.4–2.1 °C) seasons than in the summer (0.2–1.9 °C). In agreement with these seasonal temperature variations, the growing season for the barrens has lengthened consistently towards the fall season (September–October) after summer (Table 3) because of the highest rate of increasing temperatures in the fall (Figure 13). On the contrary, the lengthening of the growing season towards the spring season has been inconsistent (Table 3) because of the erratic fluctuations in spring temperatures over the past 41 years (Figure 11, Figure 12 and Figure 13). In contrast to the temperature patterns, historical precipitation did not change significantly in the barrens during any season, where ~20–50 mm increments in precipitation over the past 41 years were observed only in the fall and winter seasons (Table S1).

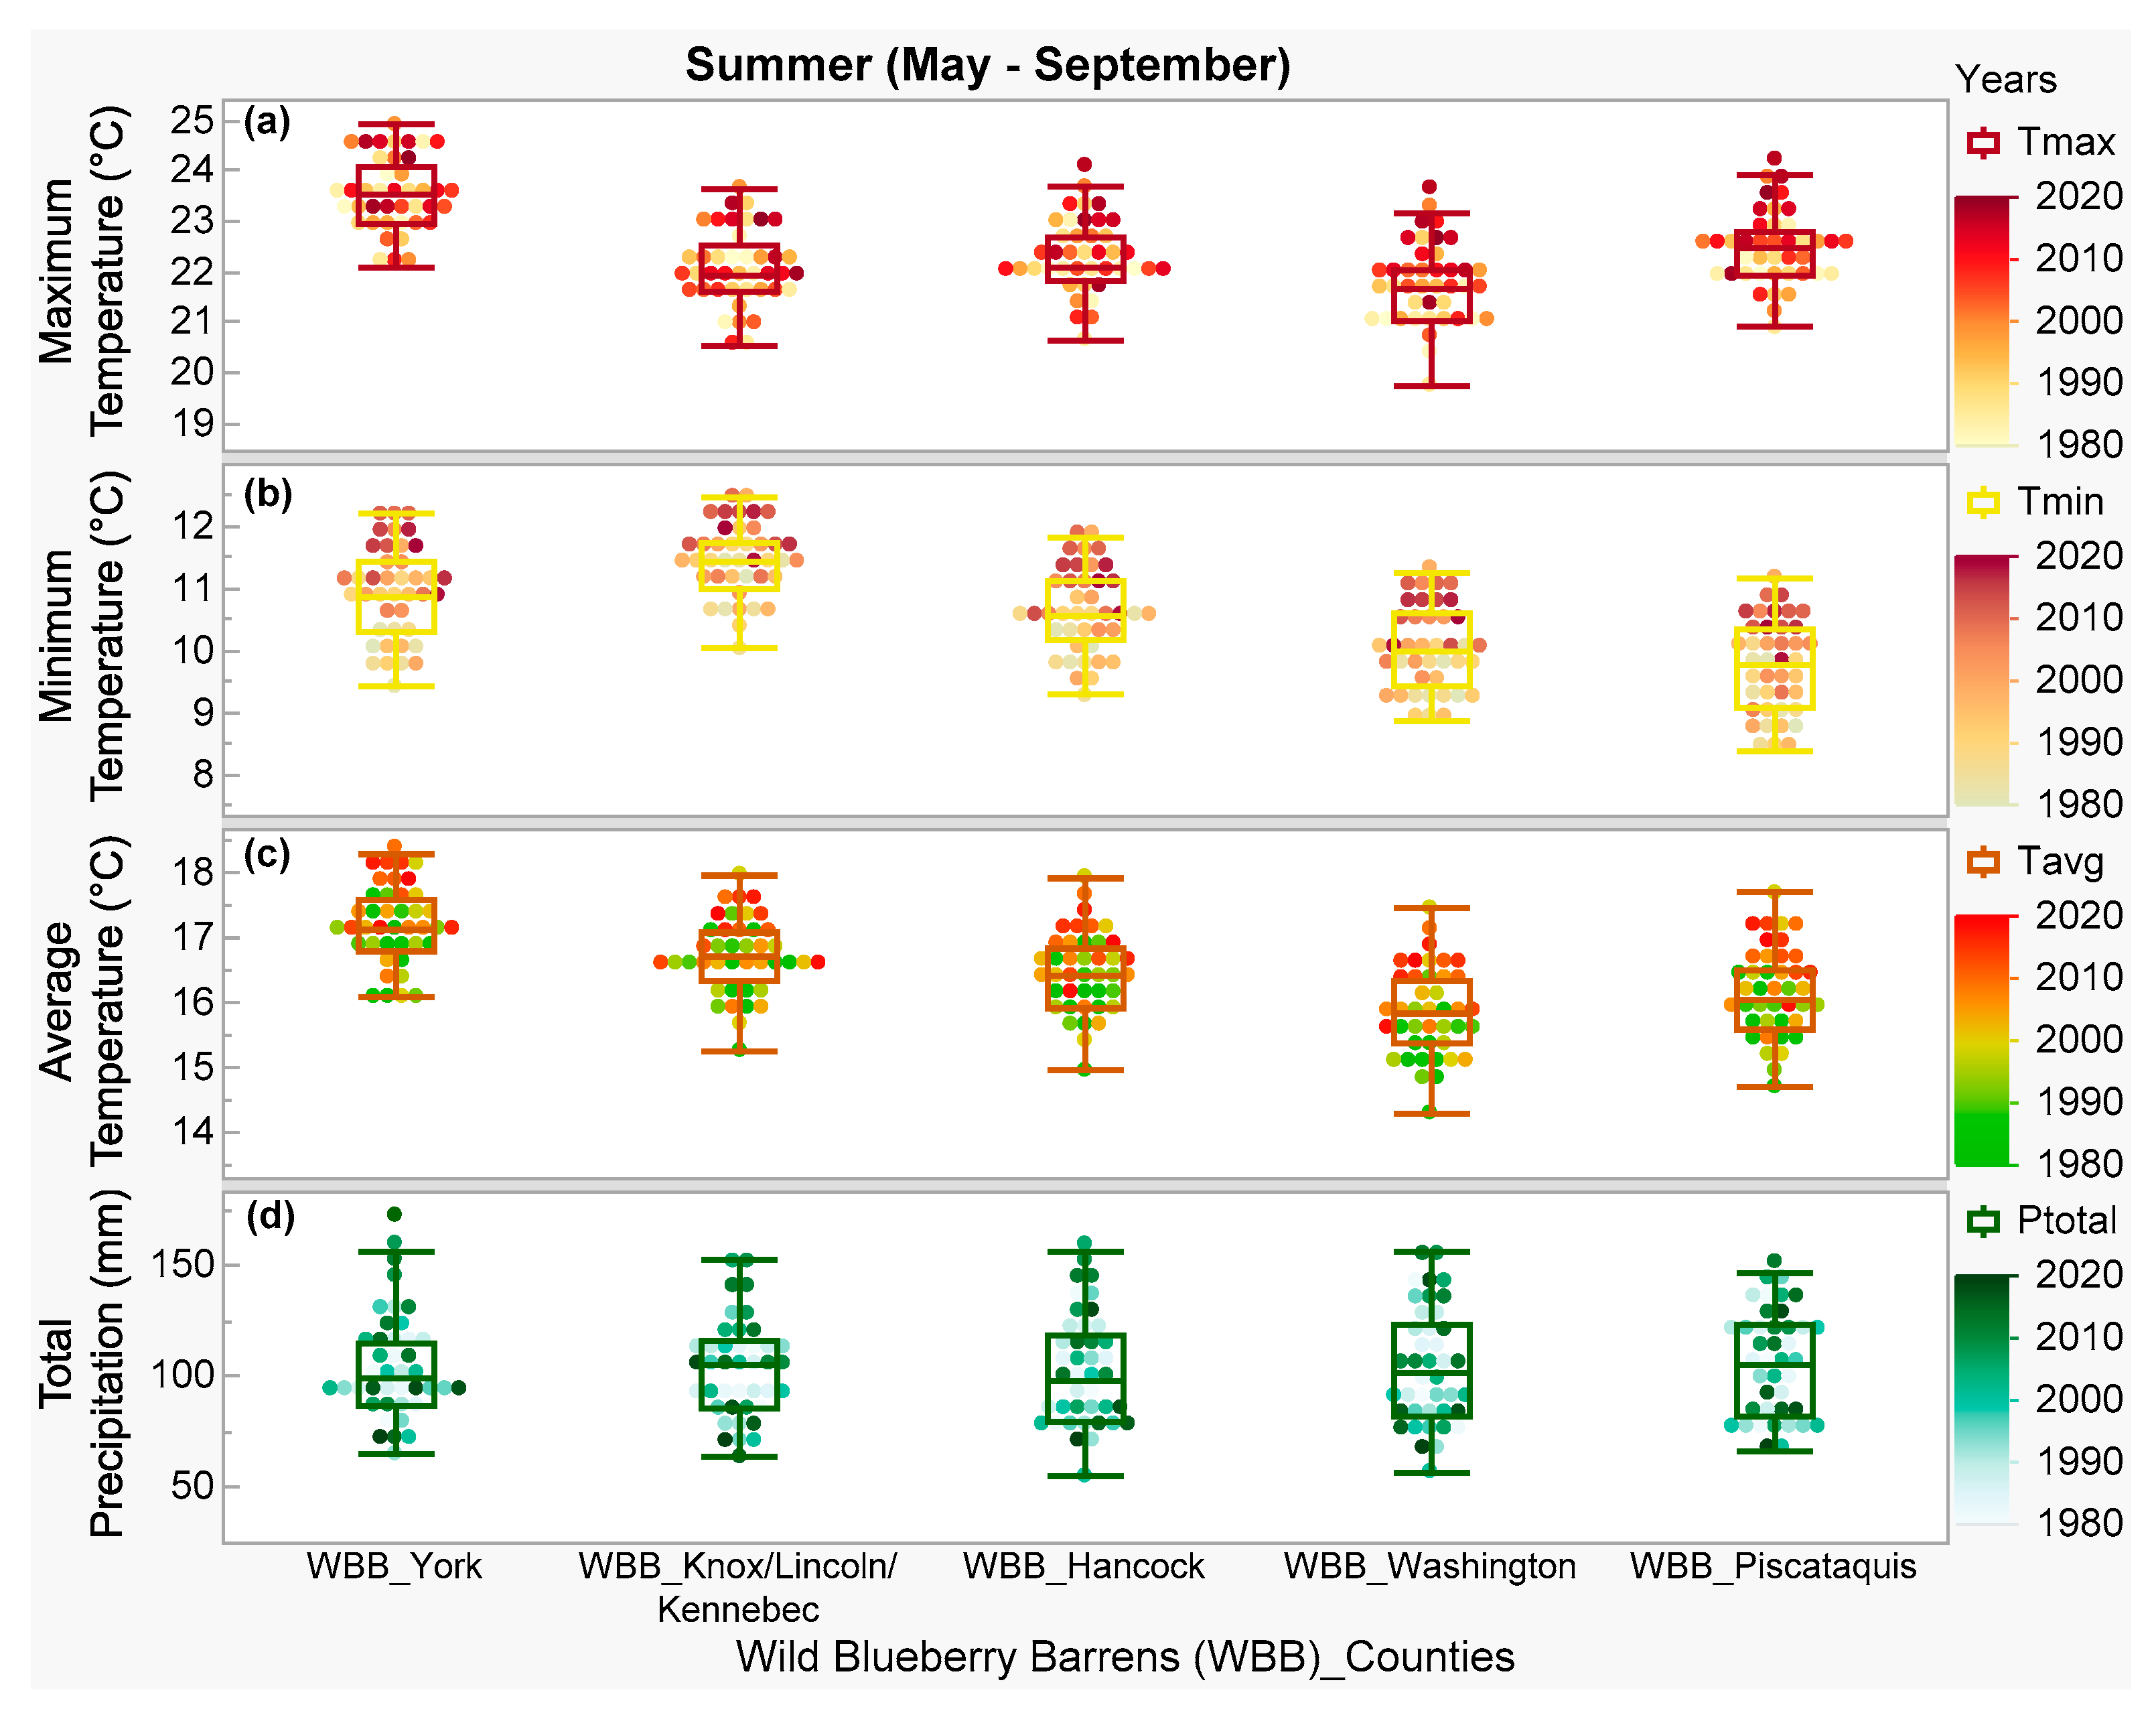
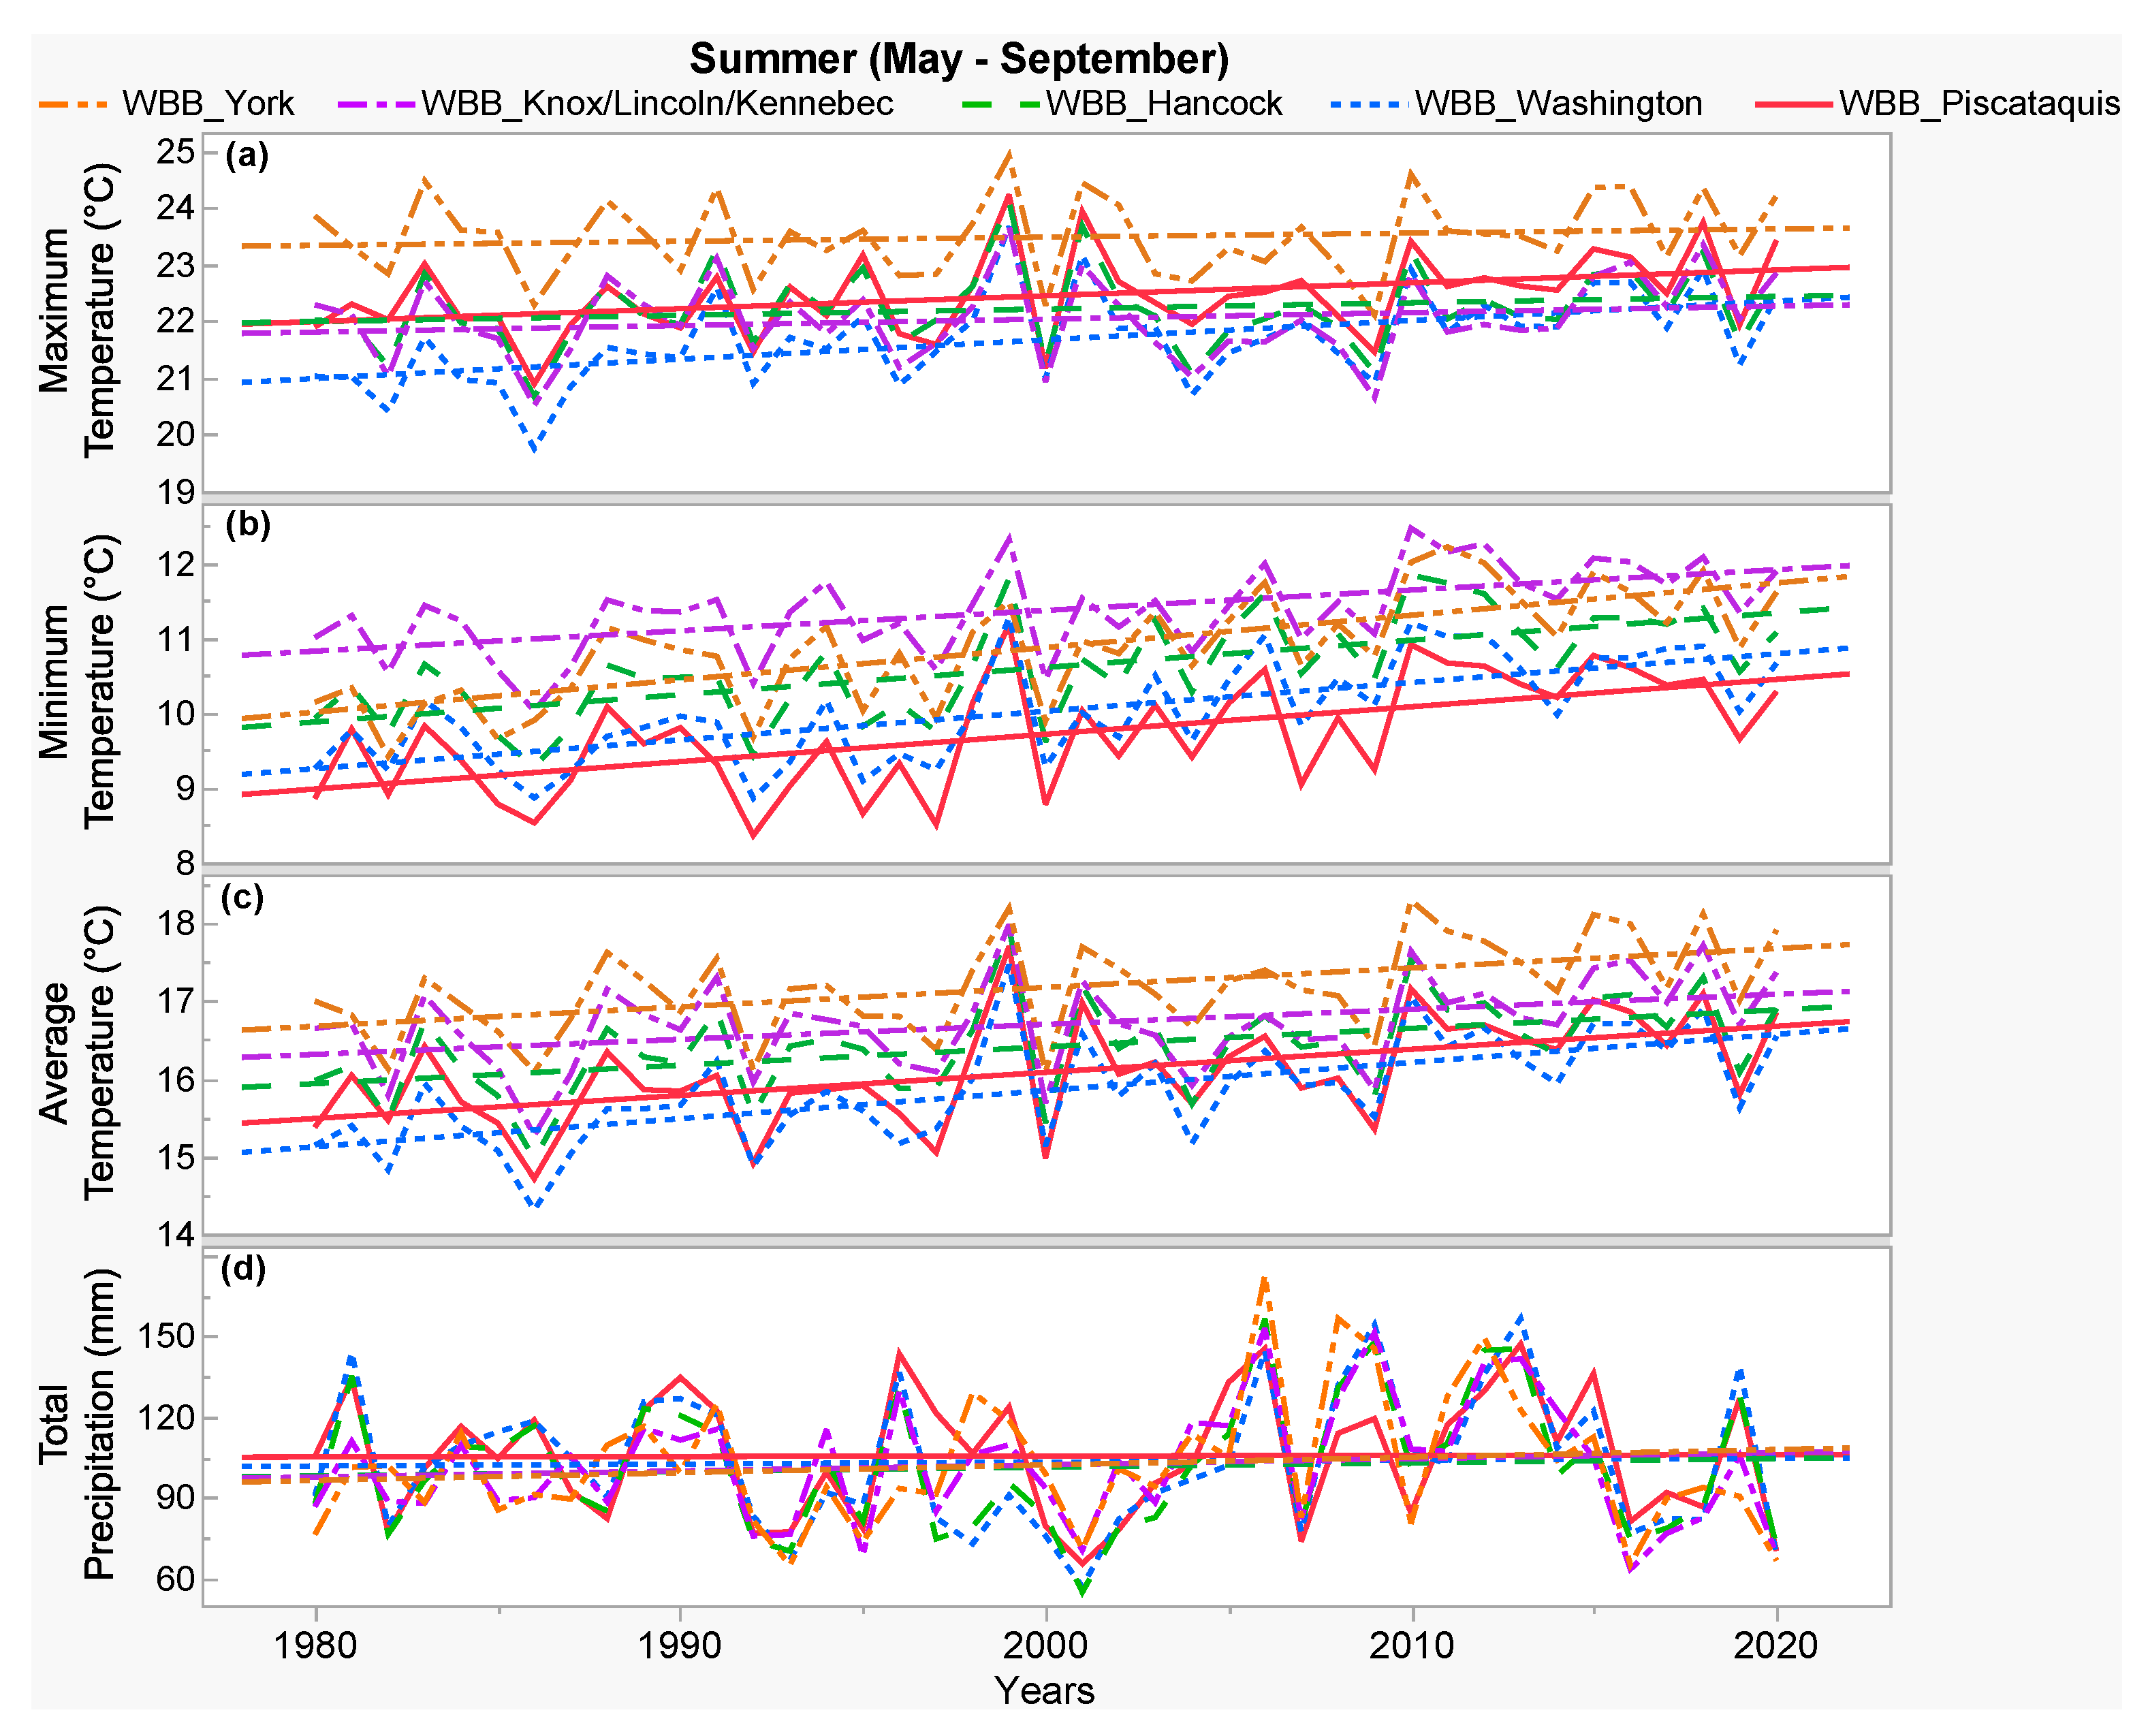
3.2.1. Summer (May–September) Climate in the Barrens

Based on the comparison of temperature box plots (Figure 4a–c), summer maximum temperatures of the barrens were the highest in York County and slightly higher in Piscataquis County compared to other studied coastal counties (Figure 4a). However, summer minimum temperatures and average temperatures were higher for the barrens in the studied coastal counties farther south-west from Washington to York (Figure 4a–c). In contrast, summer precipitation (~ 50 to 180 mm) was similar for the barrens in all studied counties (Figure 4d).
Historical summer temperature changing trends (Figure 5a–c) followed the annual temperature changing trends (Figure 3a–c) for the studied barrens. The summer maximum temperature of the wild blueberry barrens significantly increased in Piscataquis (1 °C) and Washington (1.5 °C) counties, compared to other studied coastal counties farther south-west (Hancock to York), where temperature increment rates (0.2–0.6 °C) were not significant (Figure 5a, Table 2 and Table S1). In contrast, the summer minimum temperature of the barrens significantly increased (1.4–1.9 °C) in all studied counties (Figure 5b, Table 2 and Table S1). Consequently, the summer average temperature (Figure 5c, Table 2 and Table S1) significantly increased (1–1.6 °C) in the barrens of all studied counties but the increase rate was higher in Piscataquis and Washington counties (1.3–1.6 °C) compared to other studied counties (1–1.1 °C). In contrast to the temperature changes, historical summer precipitation neither increased nor decreased in the barrens of the studied counties (Figure 5d, Table 2 and Table S1).

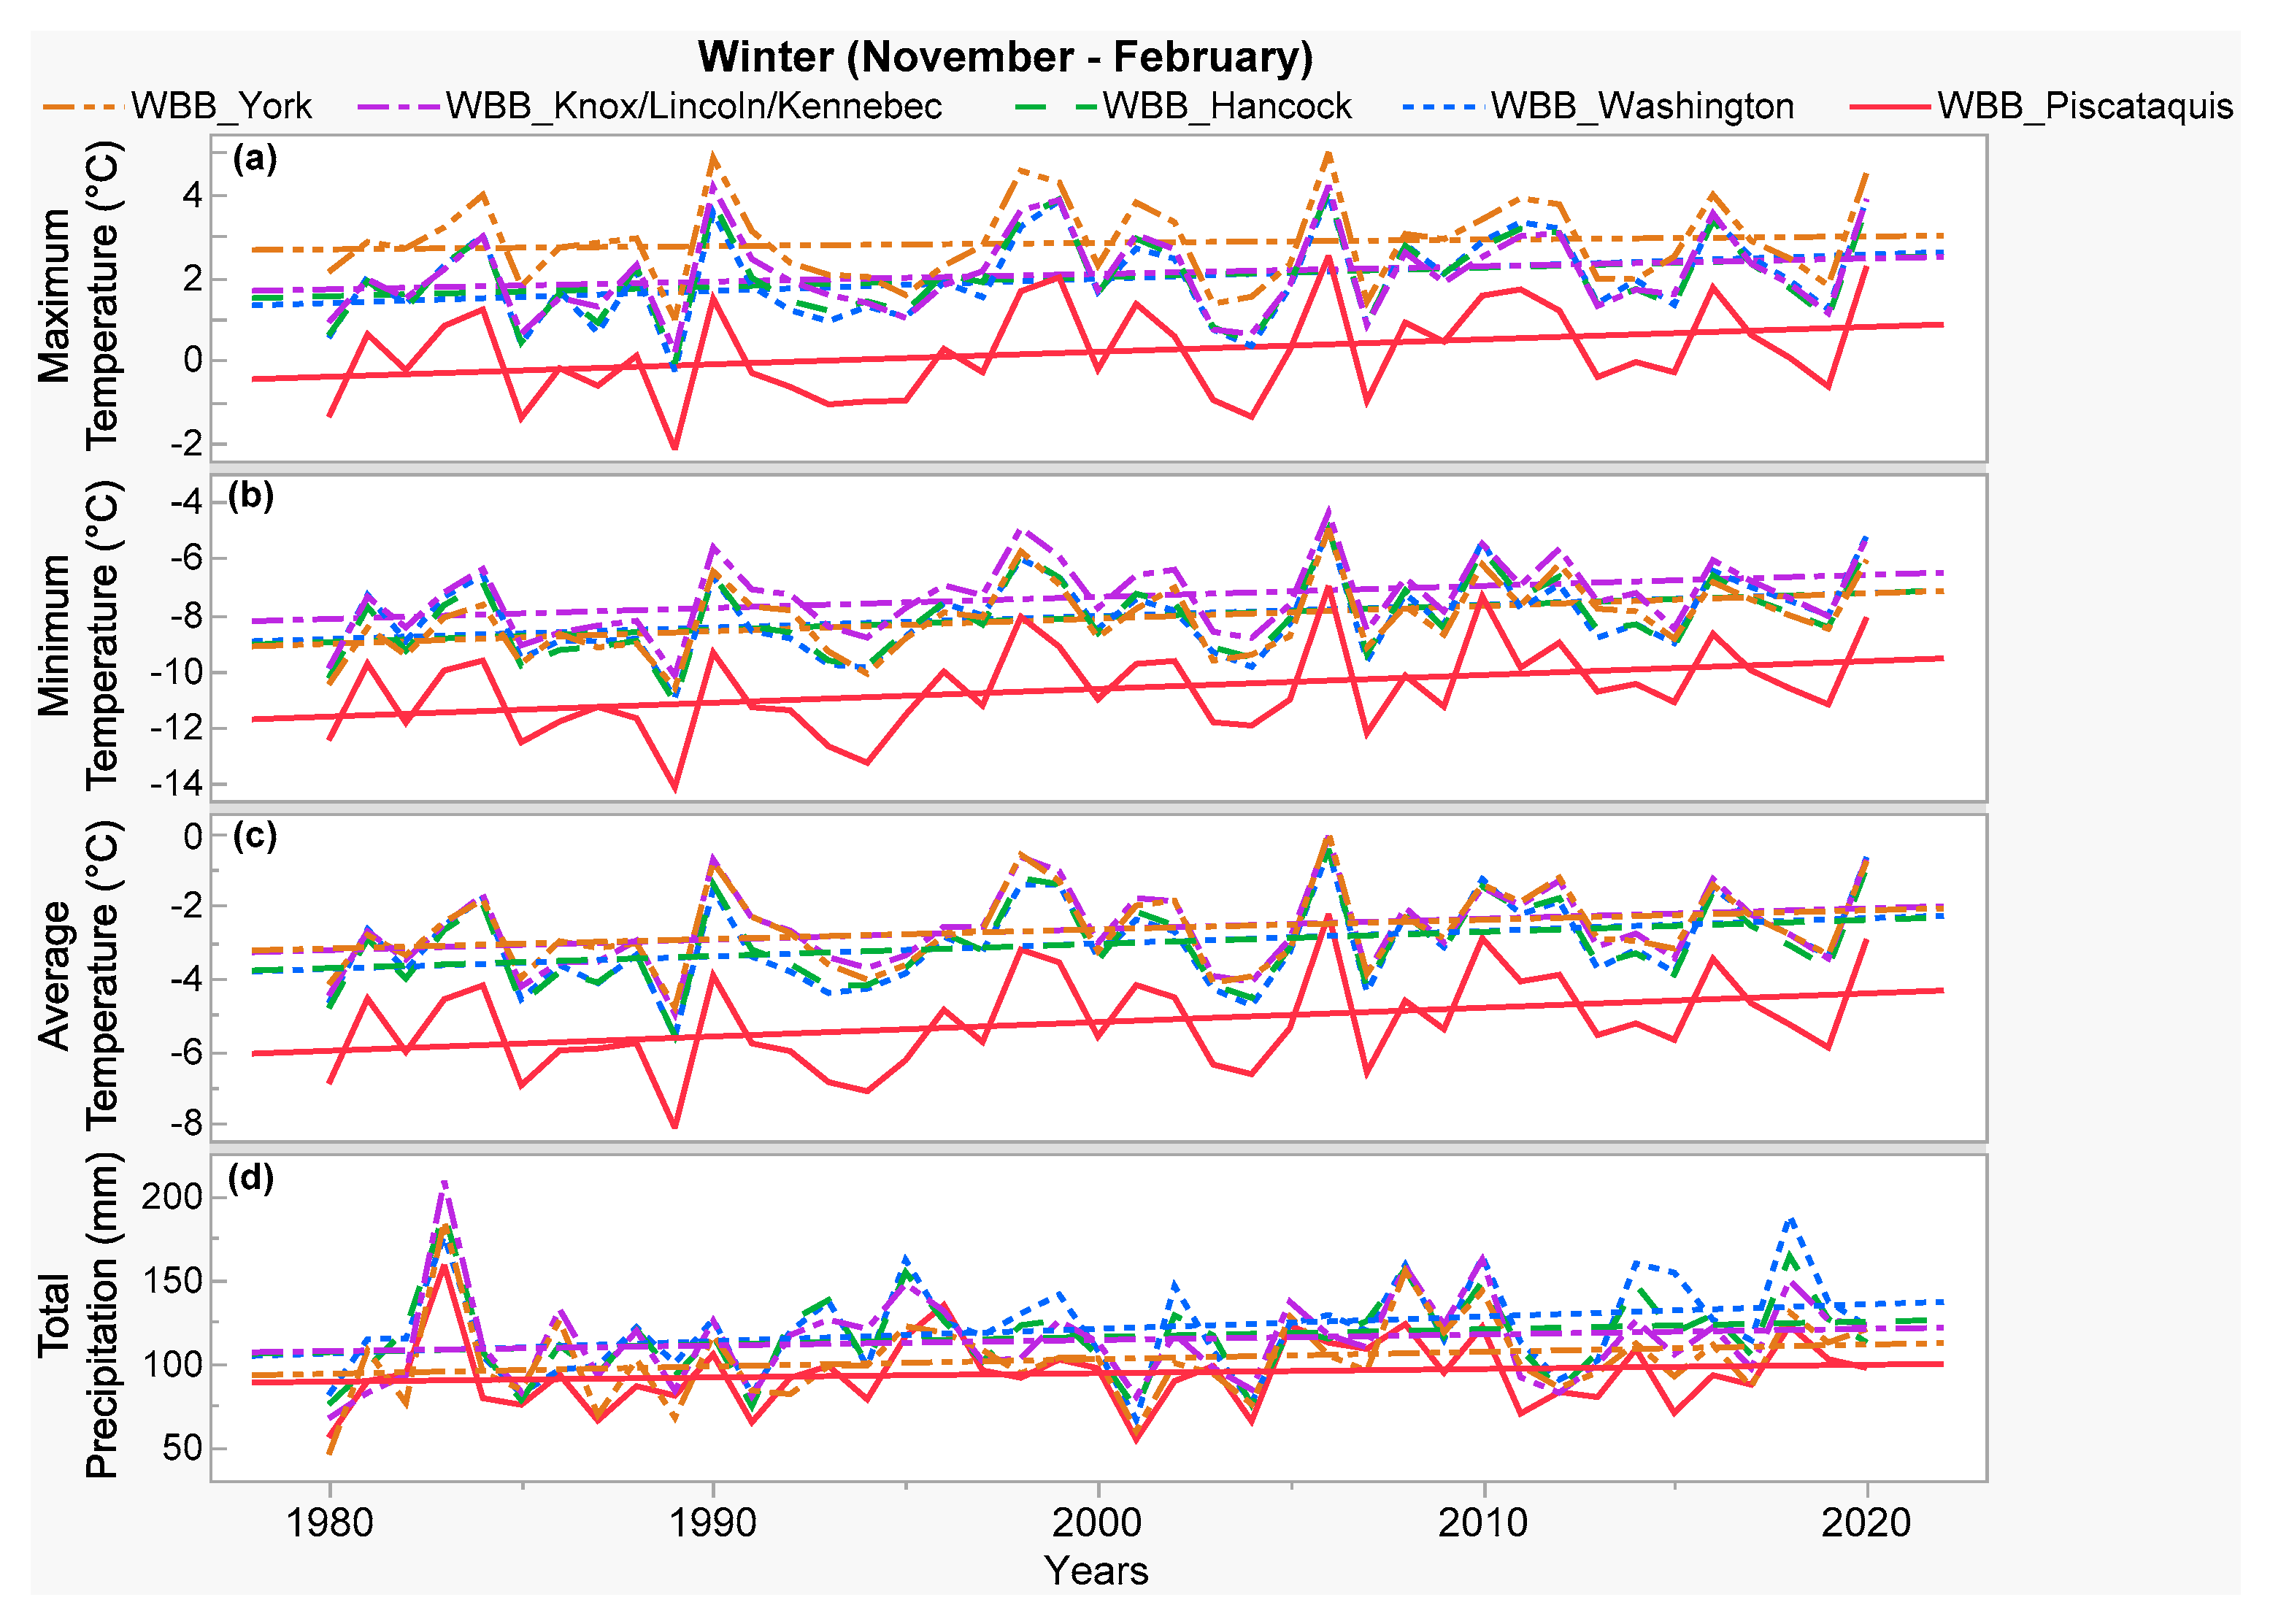
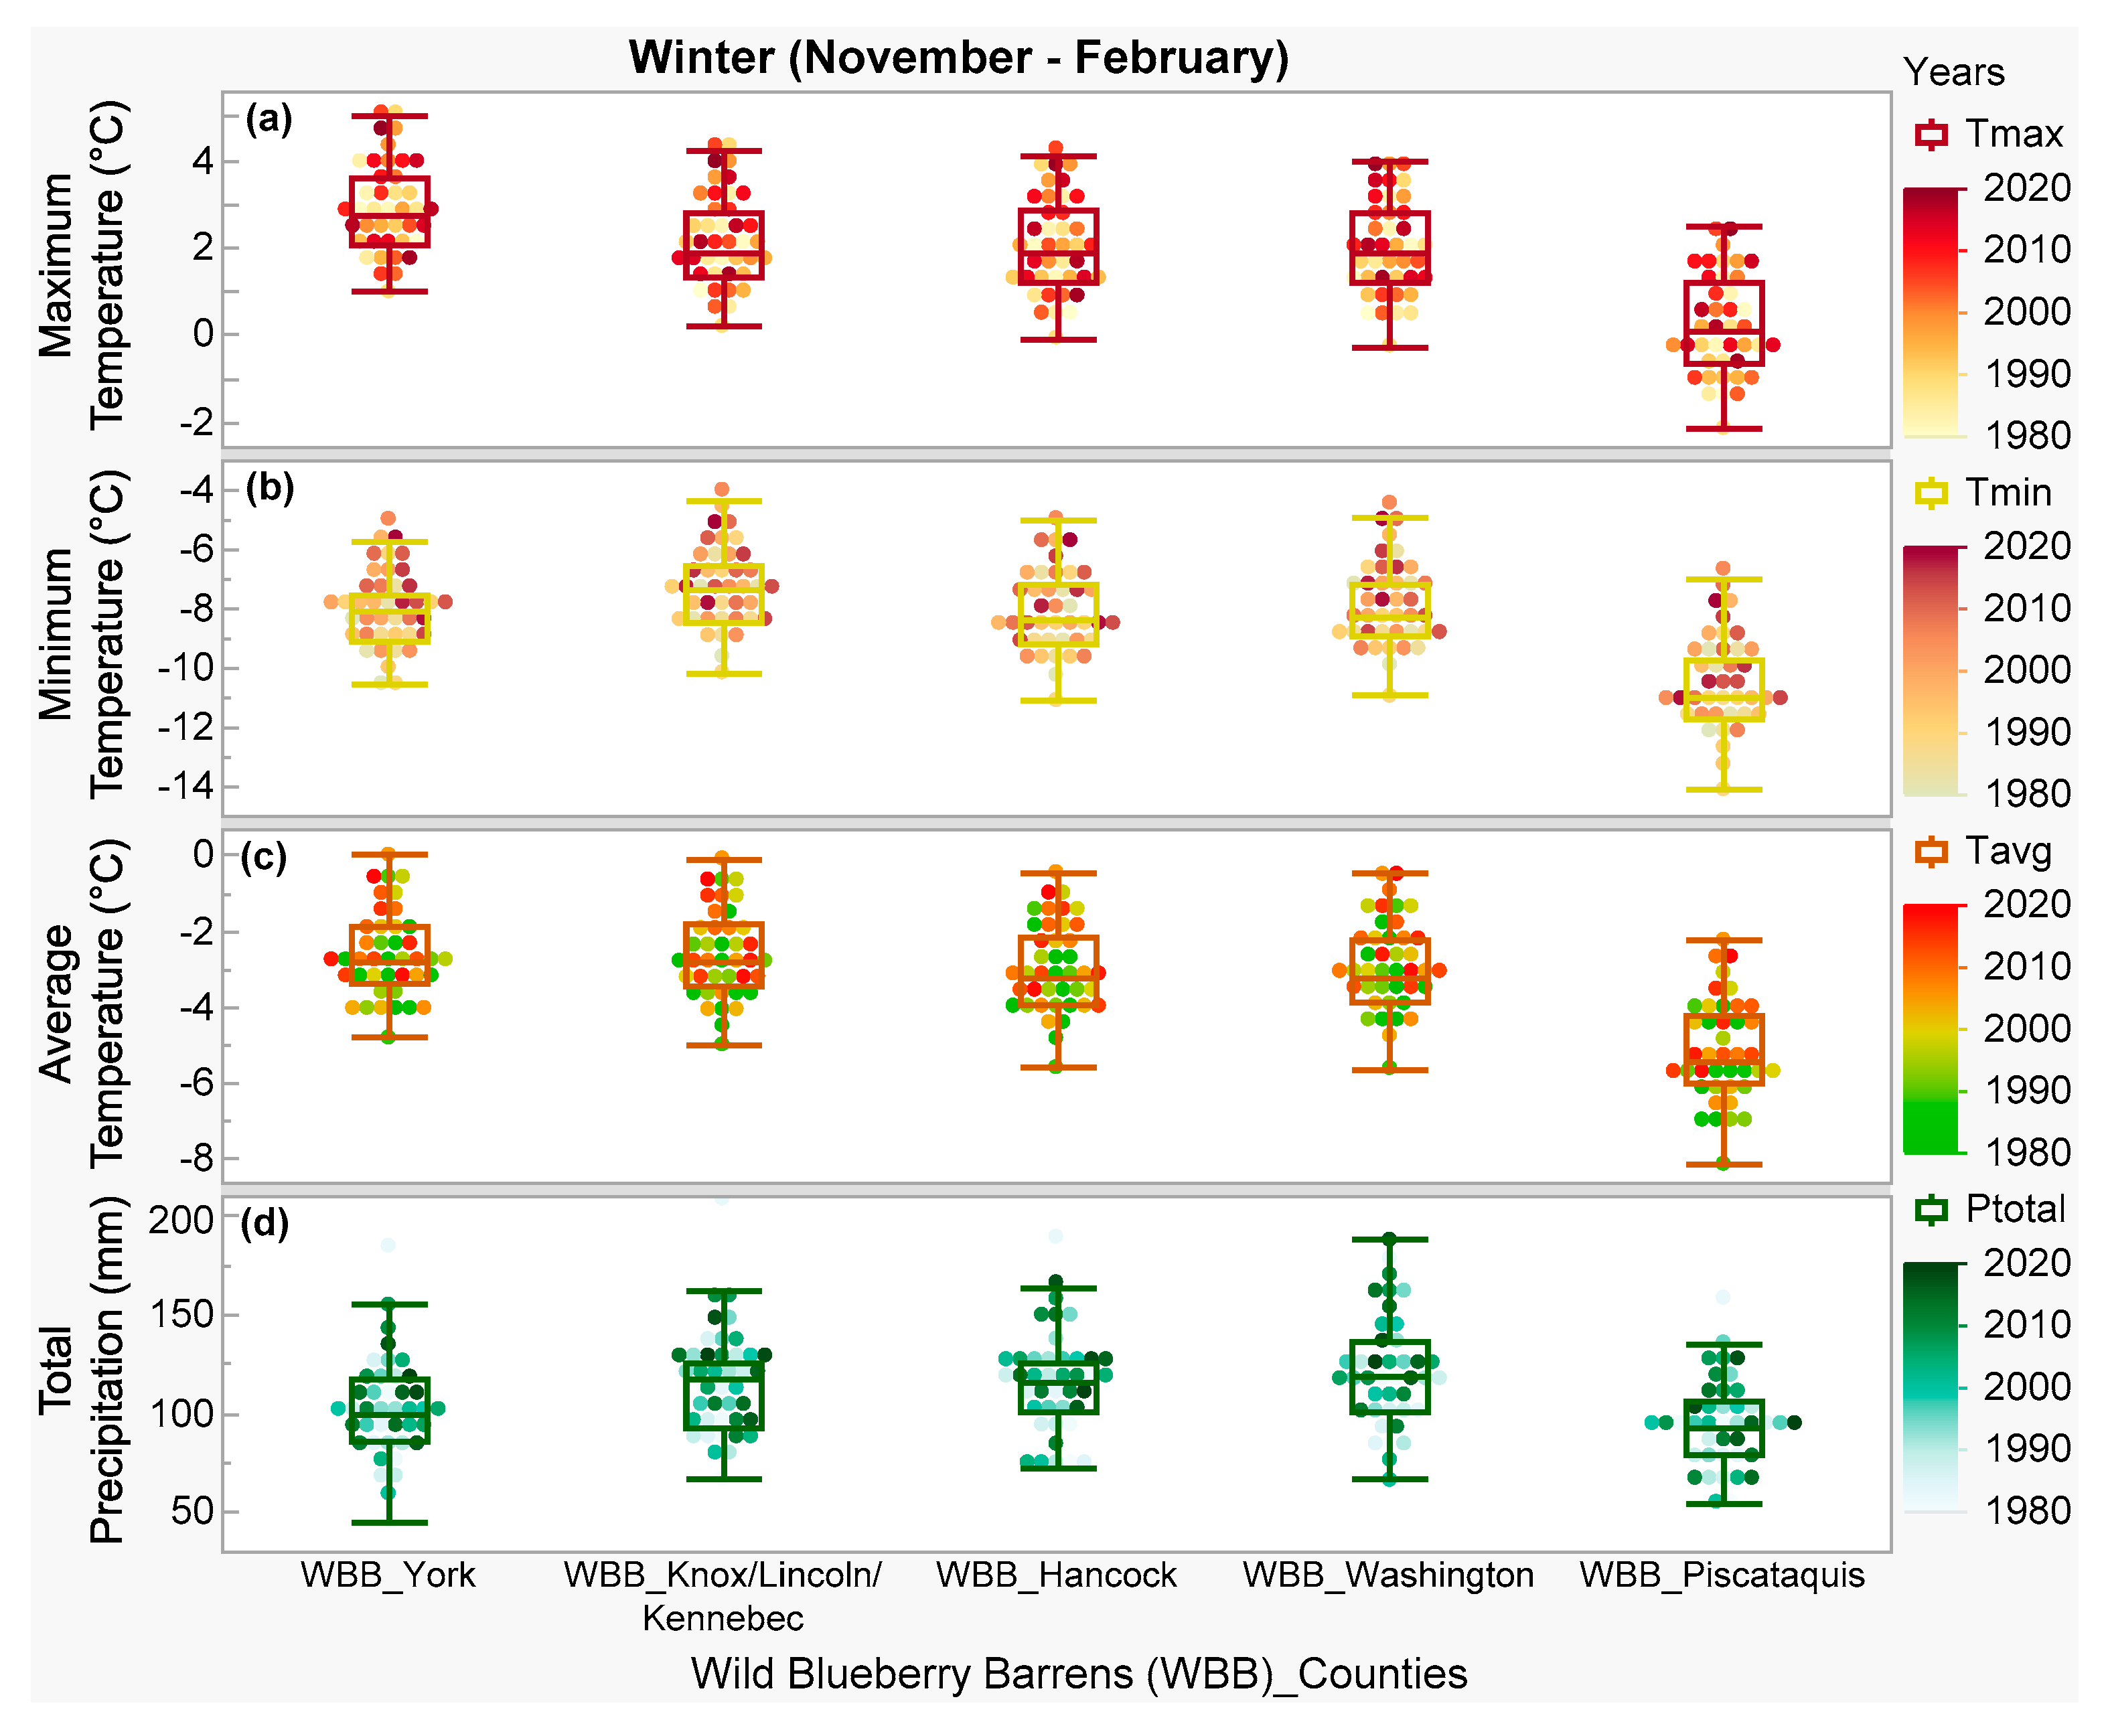
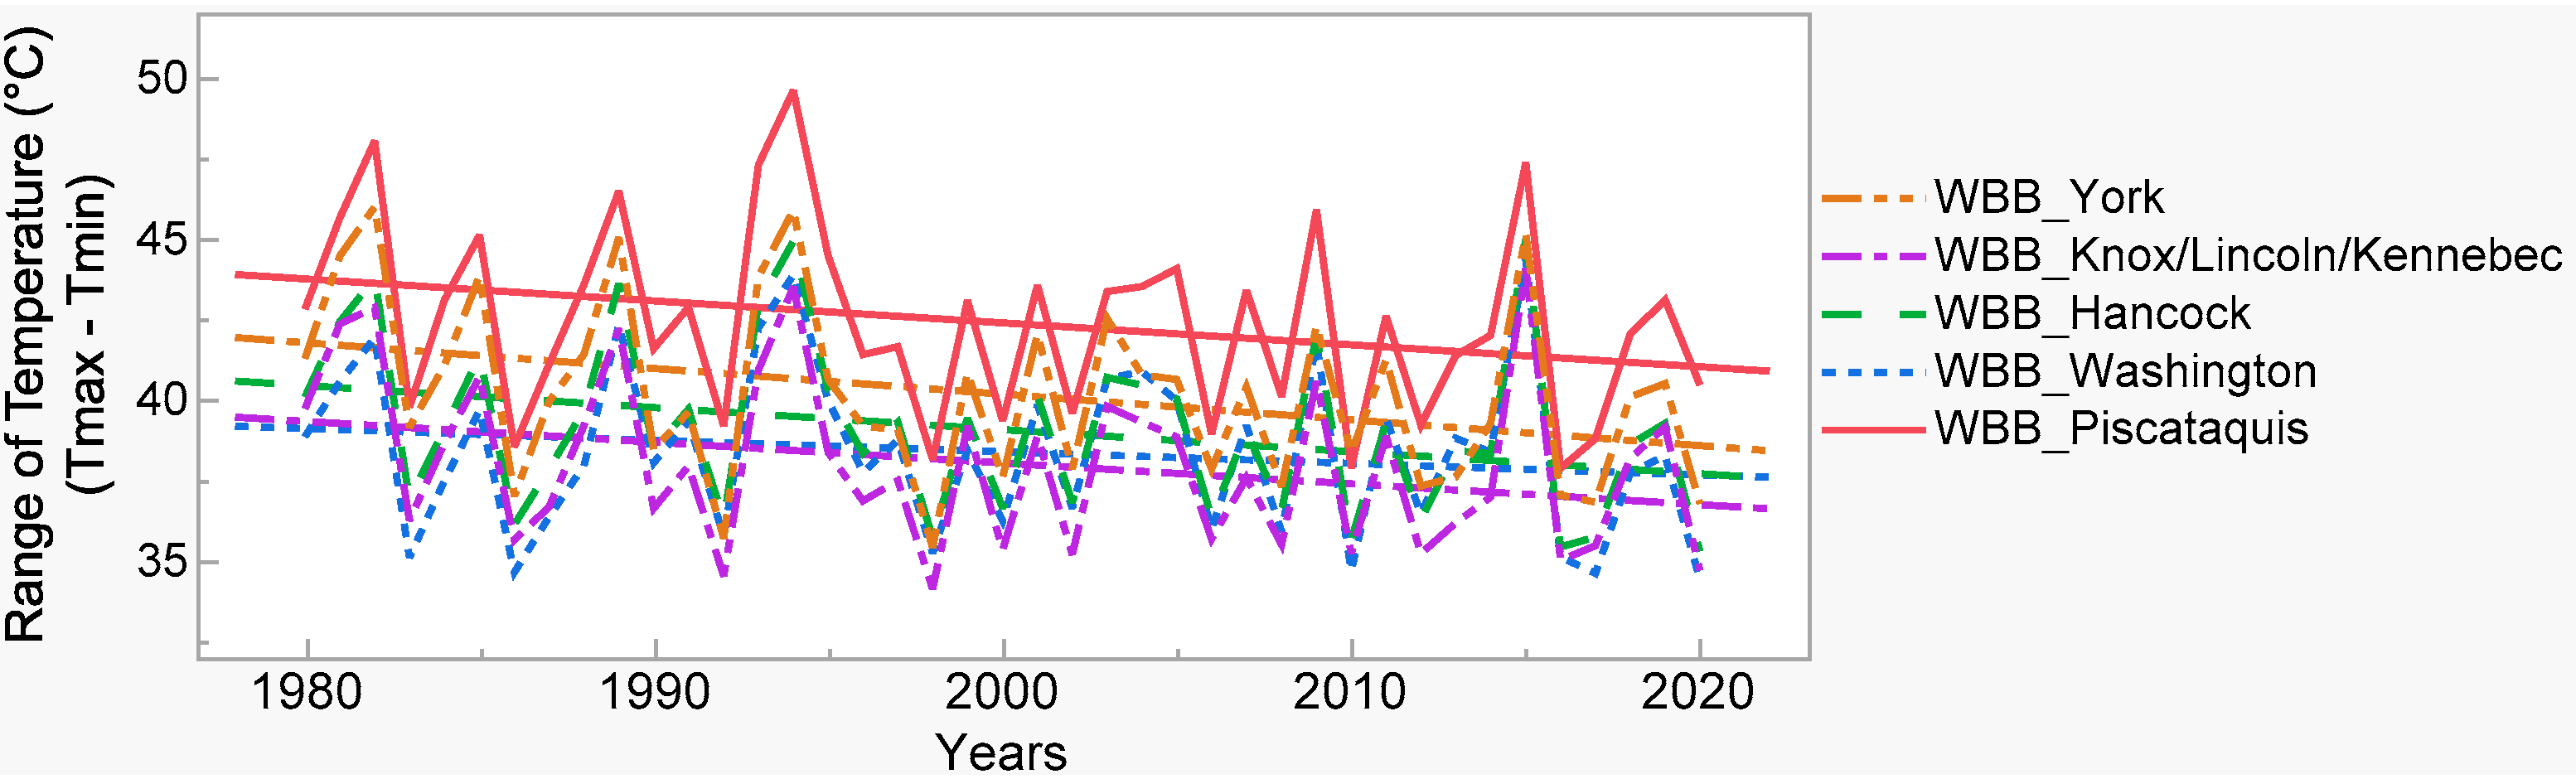
3.2.2. Winter (November–February) Climate in the Barrens

Based on the comparison of temperature box plots (Figure 6a–c), winter temperatures were the lowest in the barrens in Piscataquis County compared to the similar higher temperatures observed in other studied coastal counties farther south-west (starting from Washington to York) (Figure 6a–c). In contrast, the winter precipitation was slightly lower in the barrens in Piscataquis County (range: 50–130 mm) and slightly higher in Washington County (range: 70–190 mm) compared to other studied coastal counties (range: 50–170 mm) farther south-west (Hancock to York) (Figure 6d).
Historical winter temperature changing trends (Figure 7a–c) followed the summer temperature changing trends (Figure 5a–c), whereas temperature increasing rates were higher in the winter than in the summer (Table S1). Winter maximum temperatures increased in the barrens with a marginal significance (p = 0.05) in Piscataquis (1.3 °C) and Washington (1 °C) counties compared to other coastal counties (Hancock to York), where temperature increment rates (0.4–0.9 °C) were not significant (Figure 7a, Table S1). In contrast, winter minimum temperatures of the barrens significantly increased (1.9–2.1 °C) in all counties (Figure 7b, Table S1). Winter average temperatures (Figure 7c, Table S1) of the barrens significantly increased (1.5–1.7 °C) in Piscataquis, Washington, and Hancock counties compared to other coastal counties farther south-west (1.3 °C). Similar to the increasing temperature trends, the historical winter precipitation increased (20–55 mm total per winter) in the barrens of all studied counties, where the increasing trend was only significant for Washington County (Figure 7d, Table S1).
In agreement with the warmer summer and warmest winter trends, the difference between the summer maximum and winter minimum temperatures significantly decreased in the barrens of the studied coastal counties farther south-west (Hancock to York) compared to Washington and Piscataquis Counties (Figure 8, Table 2). The reduction rate in temperature range was the highest in York County (3.6 °C) and lowest in Washington County (1.5 °C), compared to other studied counties (2.9–3 °C) (Figure 8, Table 2).

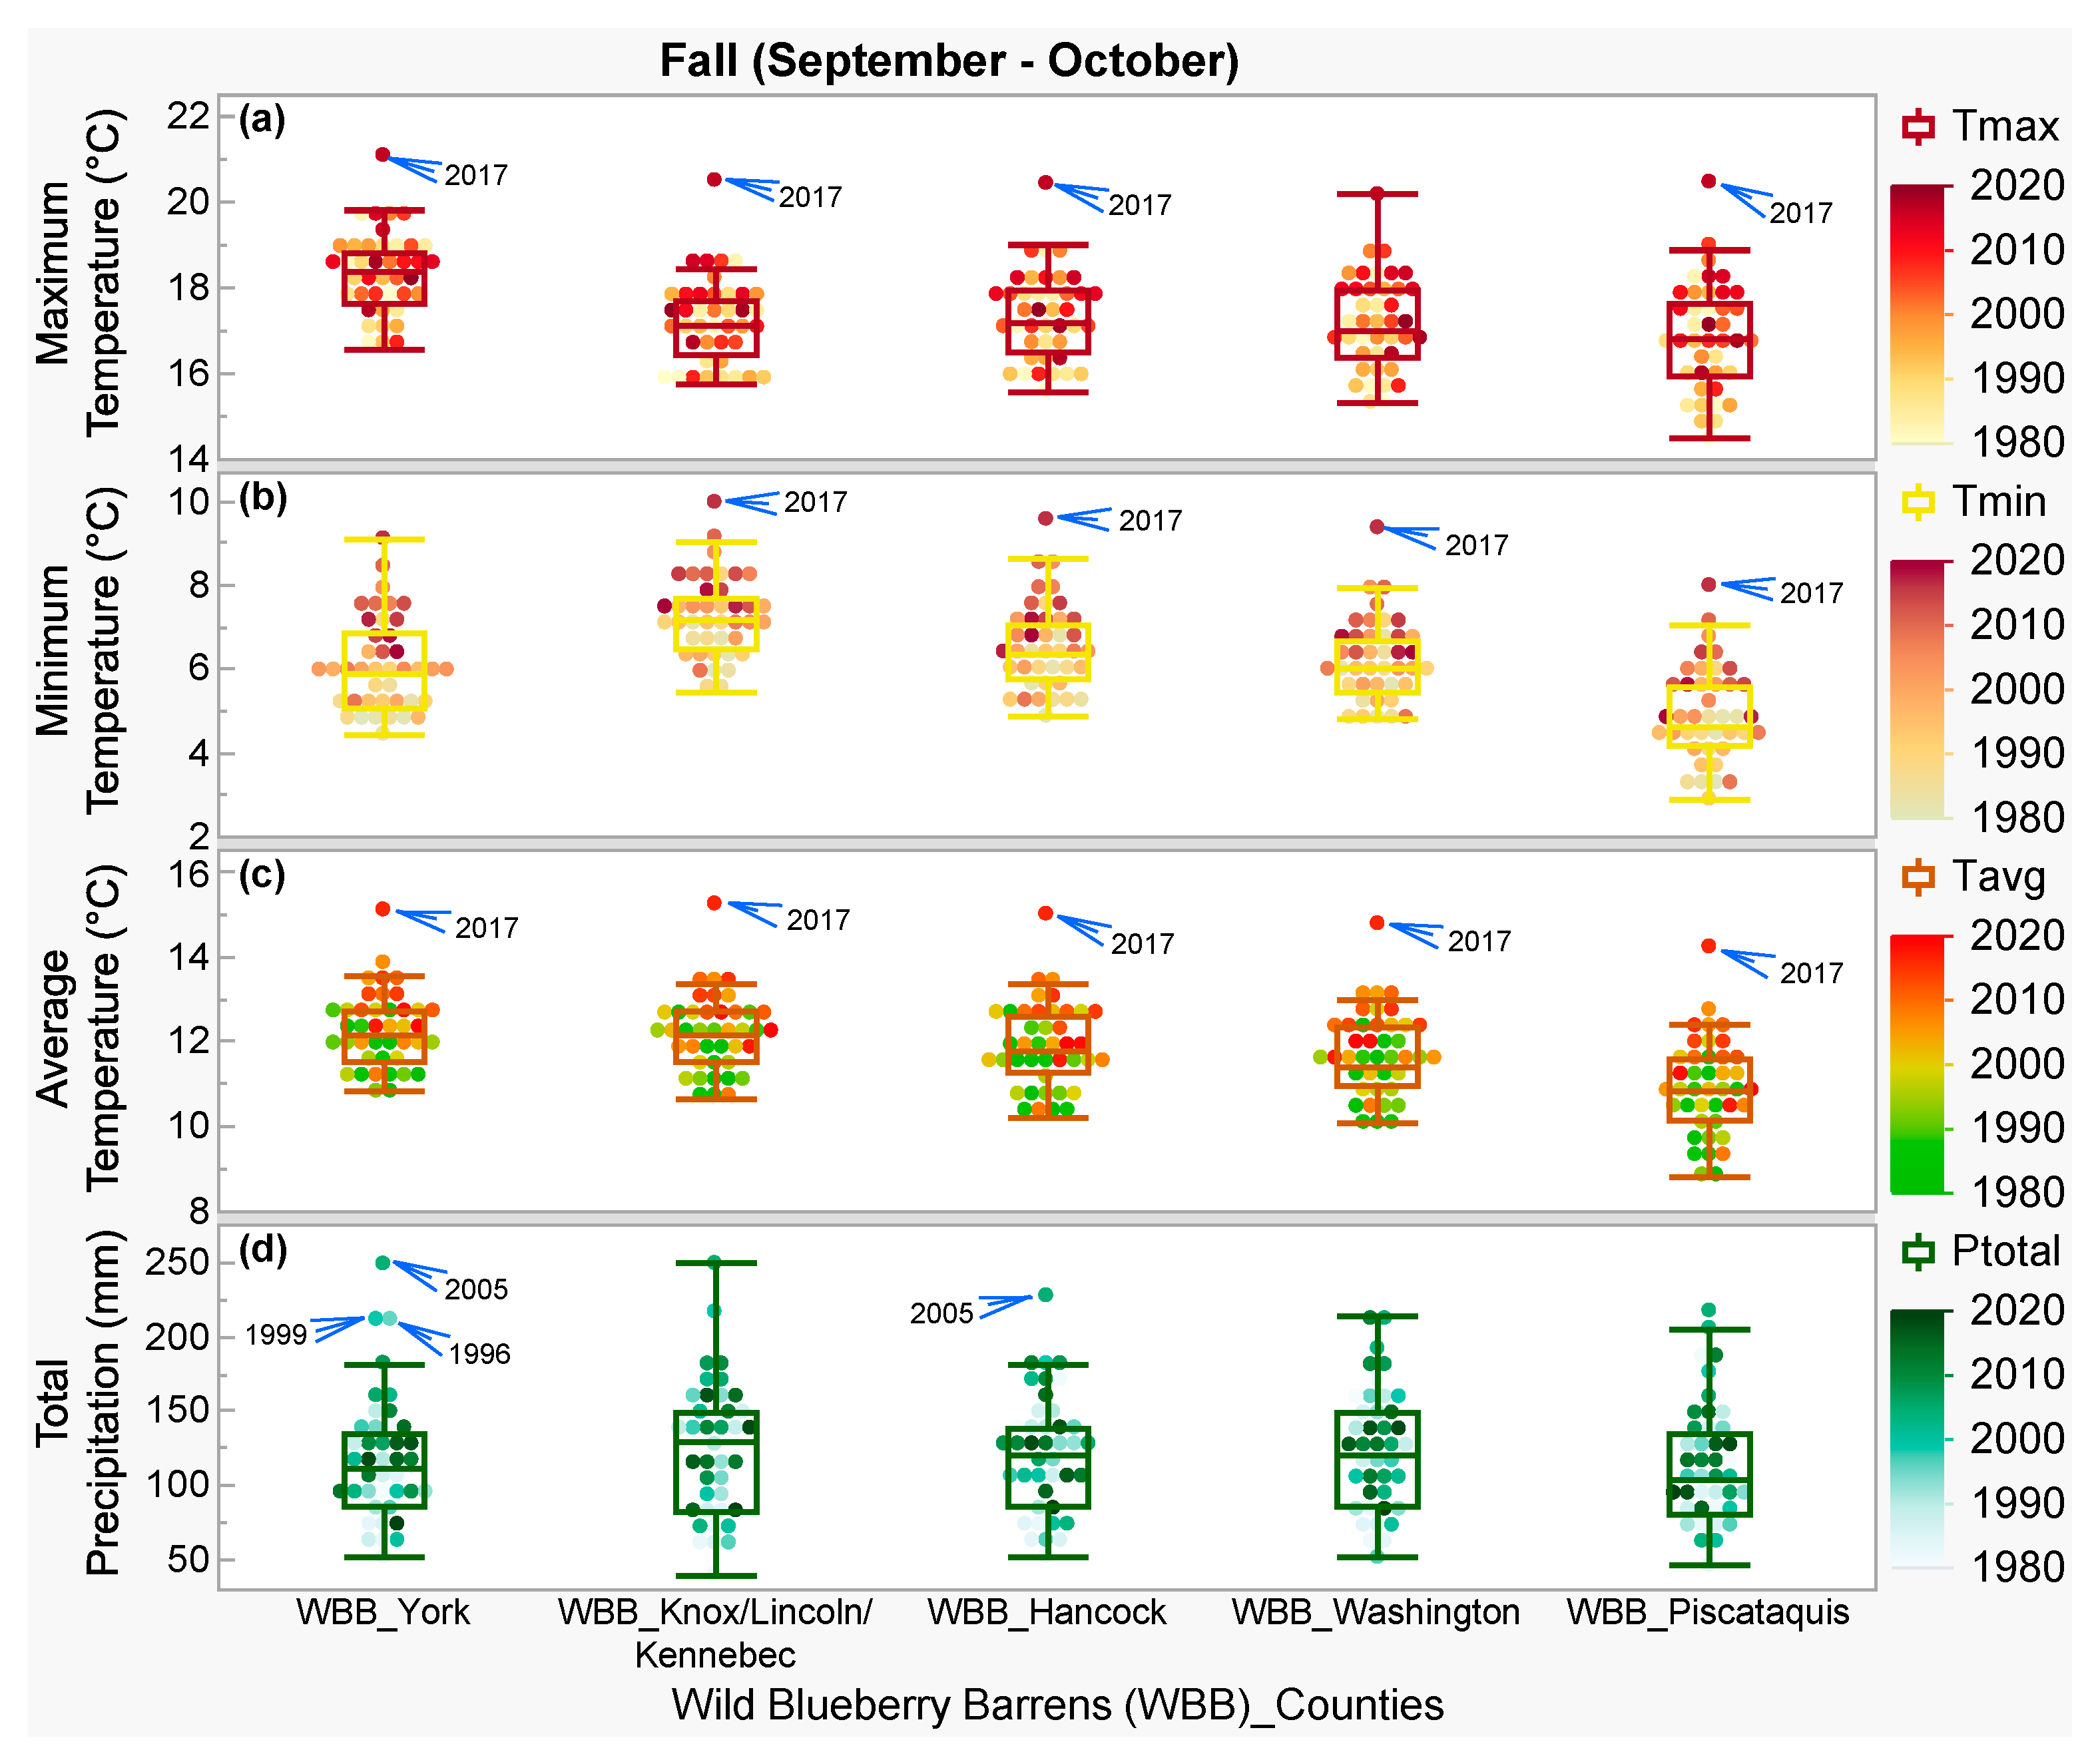
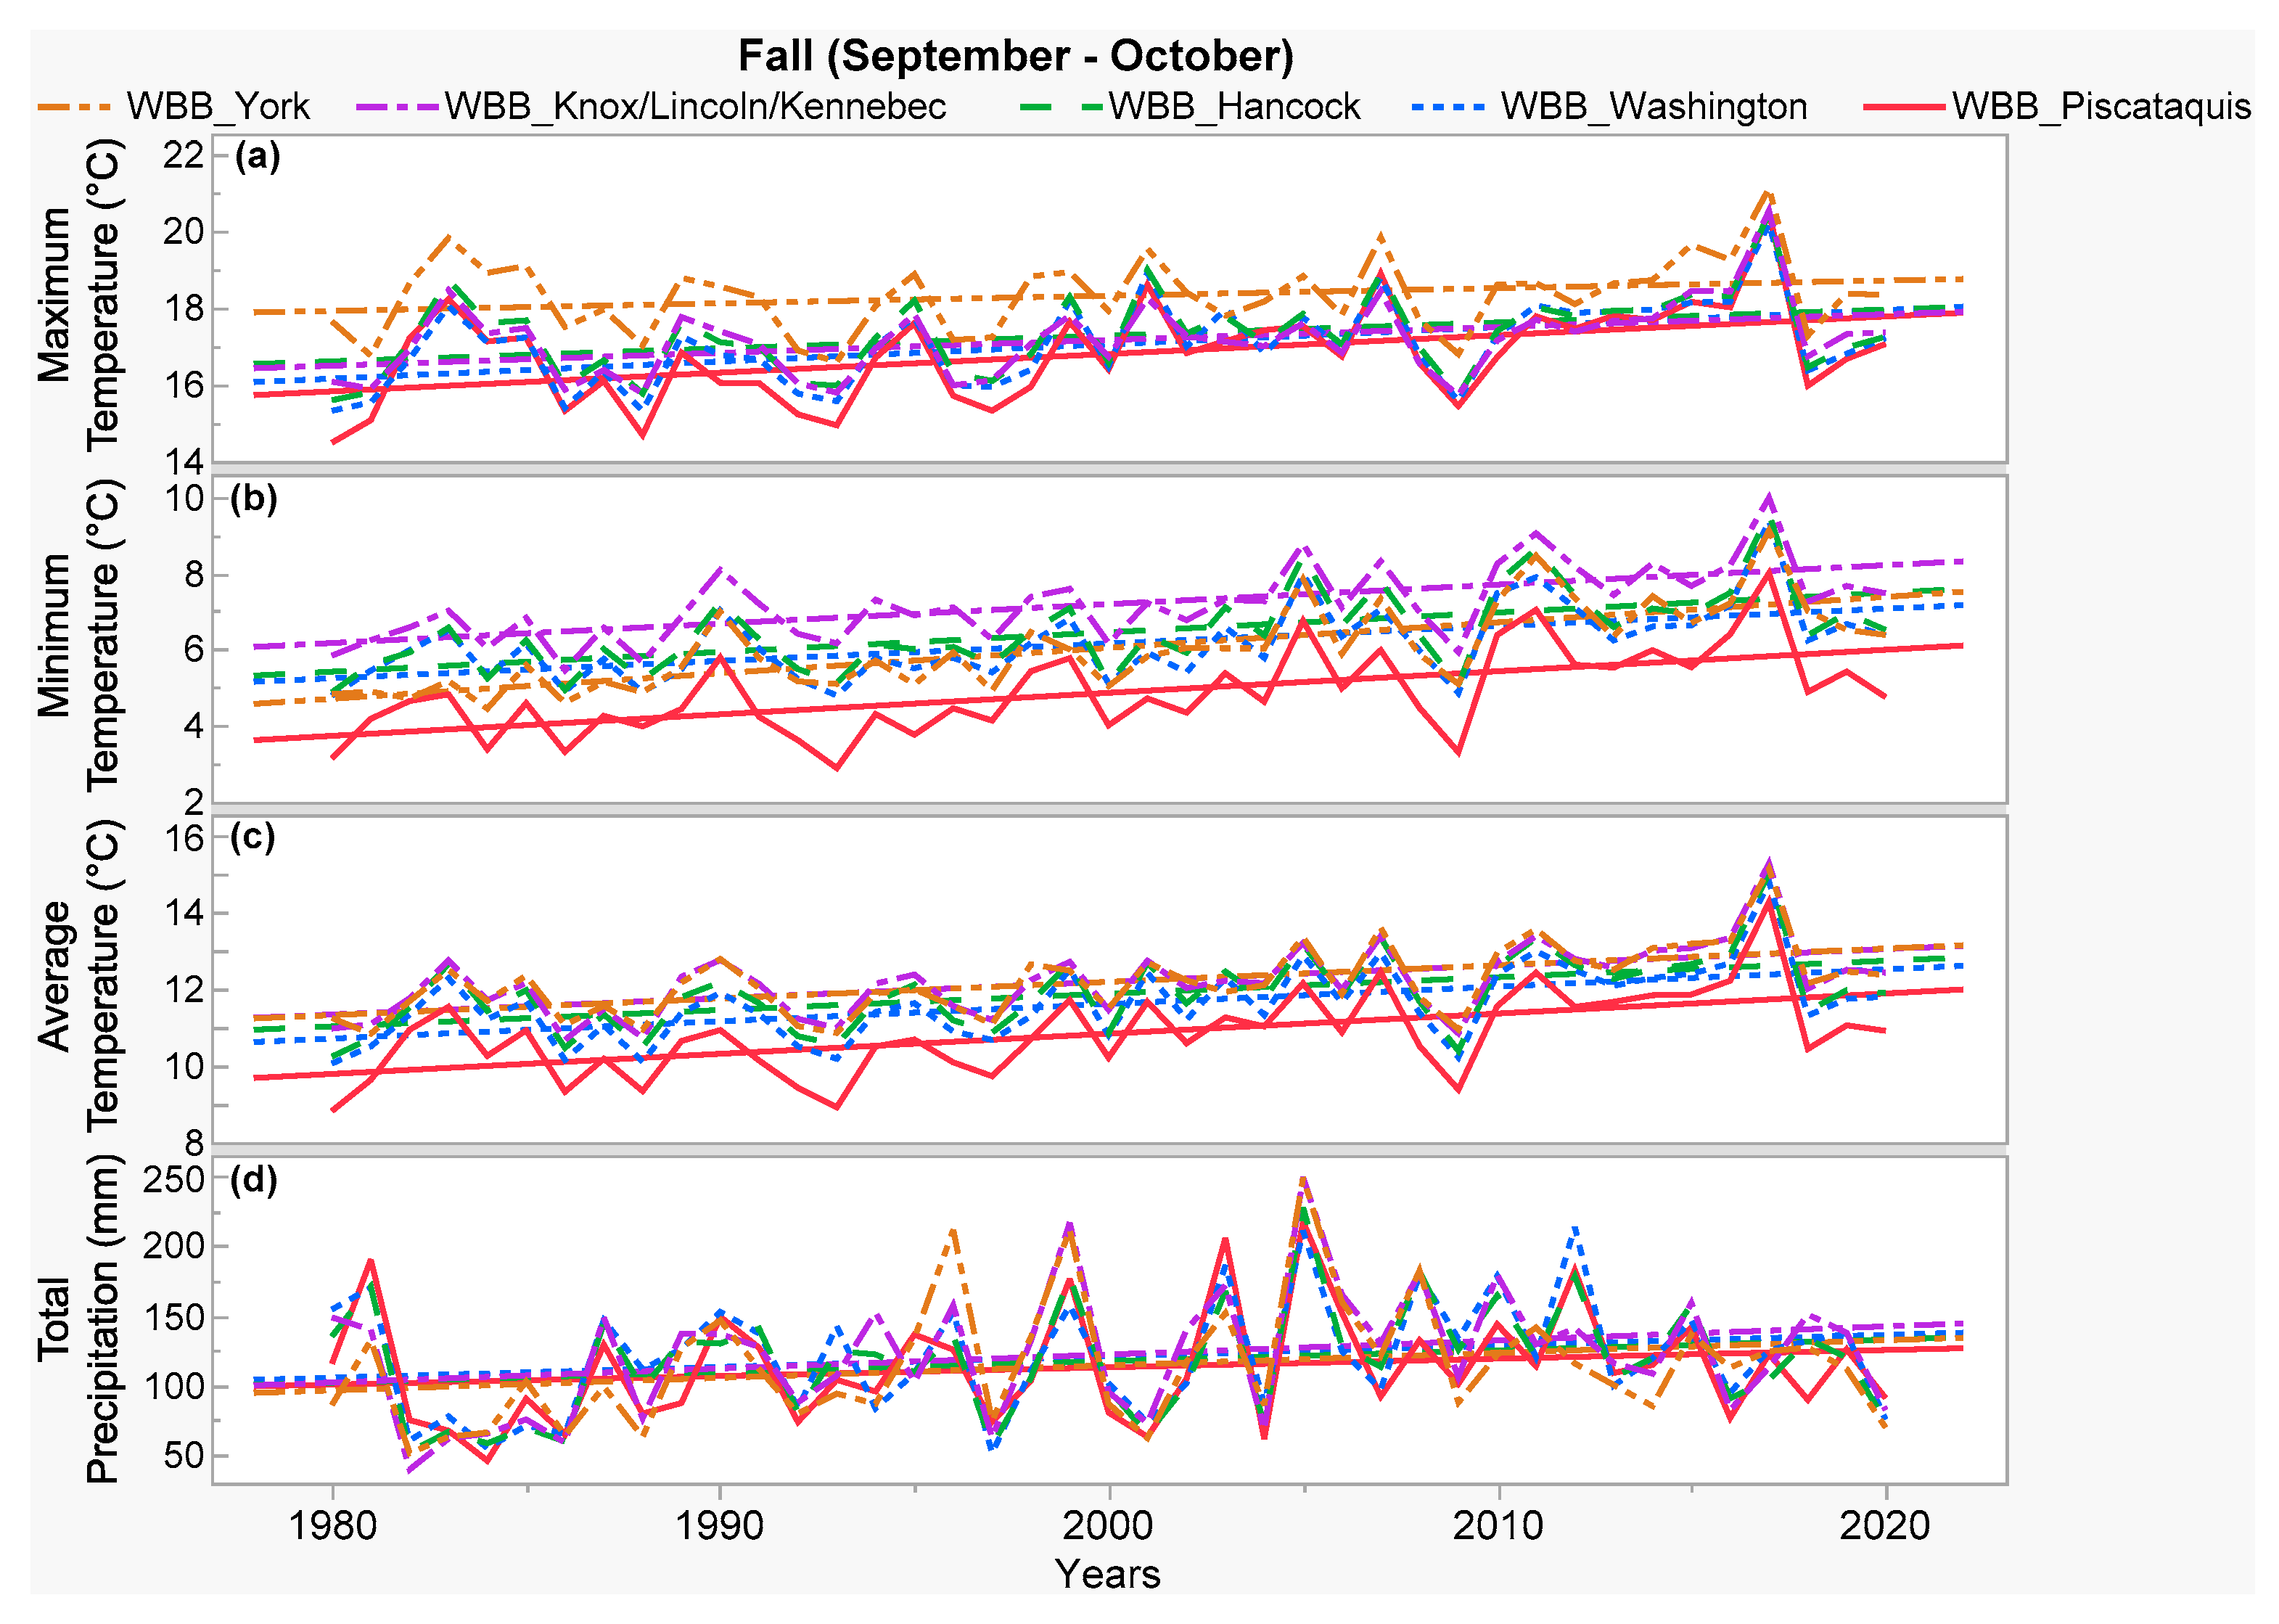
3.2.3. Fall (September–October) Climate in the Barrens

Based on the comparison of temperature box plots (Figure 9a–c), fall temperatures were slightly lower in the barrens in Piscataquis County compared to other studied coastal counties (Washington to York) with almost similar temperatures. However, higher maximum, minimum, and average fall temperatures as outliers in the year 2017 were found in the barrens of all studied counties, which represent an abnormally warmer fall outside of the historical temperature range (Figure 9a–c). In contrast, fall precipitation was similar in the barrens of all studied counties, ranging from ~50 to 250 mm (Figure 9d), which was slightly higher than the summer (~50 to 180 mm) and winter (~50 to 190 mm) precipitation ranges. Interestingly, higher precipitation than the historical precipitation range was observed in the barrens towards the south-west counties (Hancock in 2005 and York in 1995, 1999, 2005) during a few random years (outliers in Figure 9d).
Historical fall temperatures of the wild blueberry barrens (Figure 10a–c) significantly increased in all studied counties, where temperature increase rates were higher than the rates of summer (Figure 5a–c) and winter (Figure 7a–c, Table 2 and Table S1). Fall maximum temperature increase rates were significantly higher in the barrens in Piscataquis (2.2 °C) and Washington (2.1 °C) counties compared to the rates (0.9–1.5 °C) in other studied coastal counties farther south-west (Hancock to York). Fall minimum temperature increase rates were significantly higher in the barrens of all studied counties and even higher (2–2.9 °C) than the fall maximum temperature increase rates (Figure 10b, Table 2 and Table S1). Consequently, fall average temperature significantly increased (1.9–2.35 °C) in the barrens of all studied counties (Figure 10b, Table 2 and Table S1). In contrast, historical fall precipitation increased (20–55 mm total per fall) in the barrens of all studied counties, but the increasing trend was not significant and there was no significant difference among counties (Figure 10d, Table 2 and Table S1).

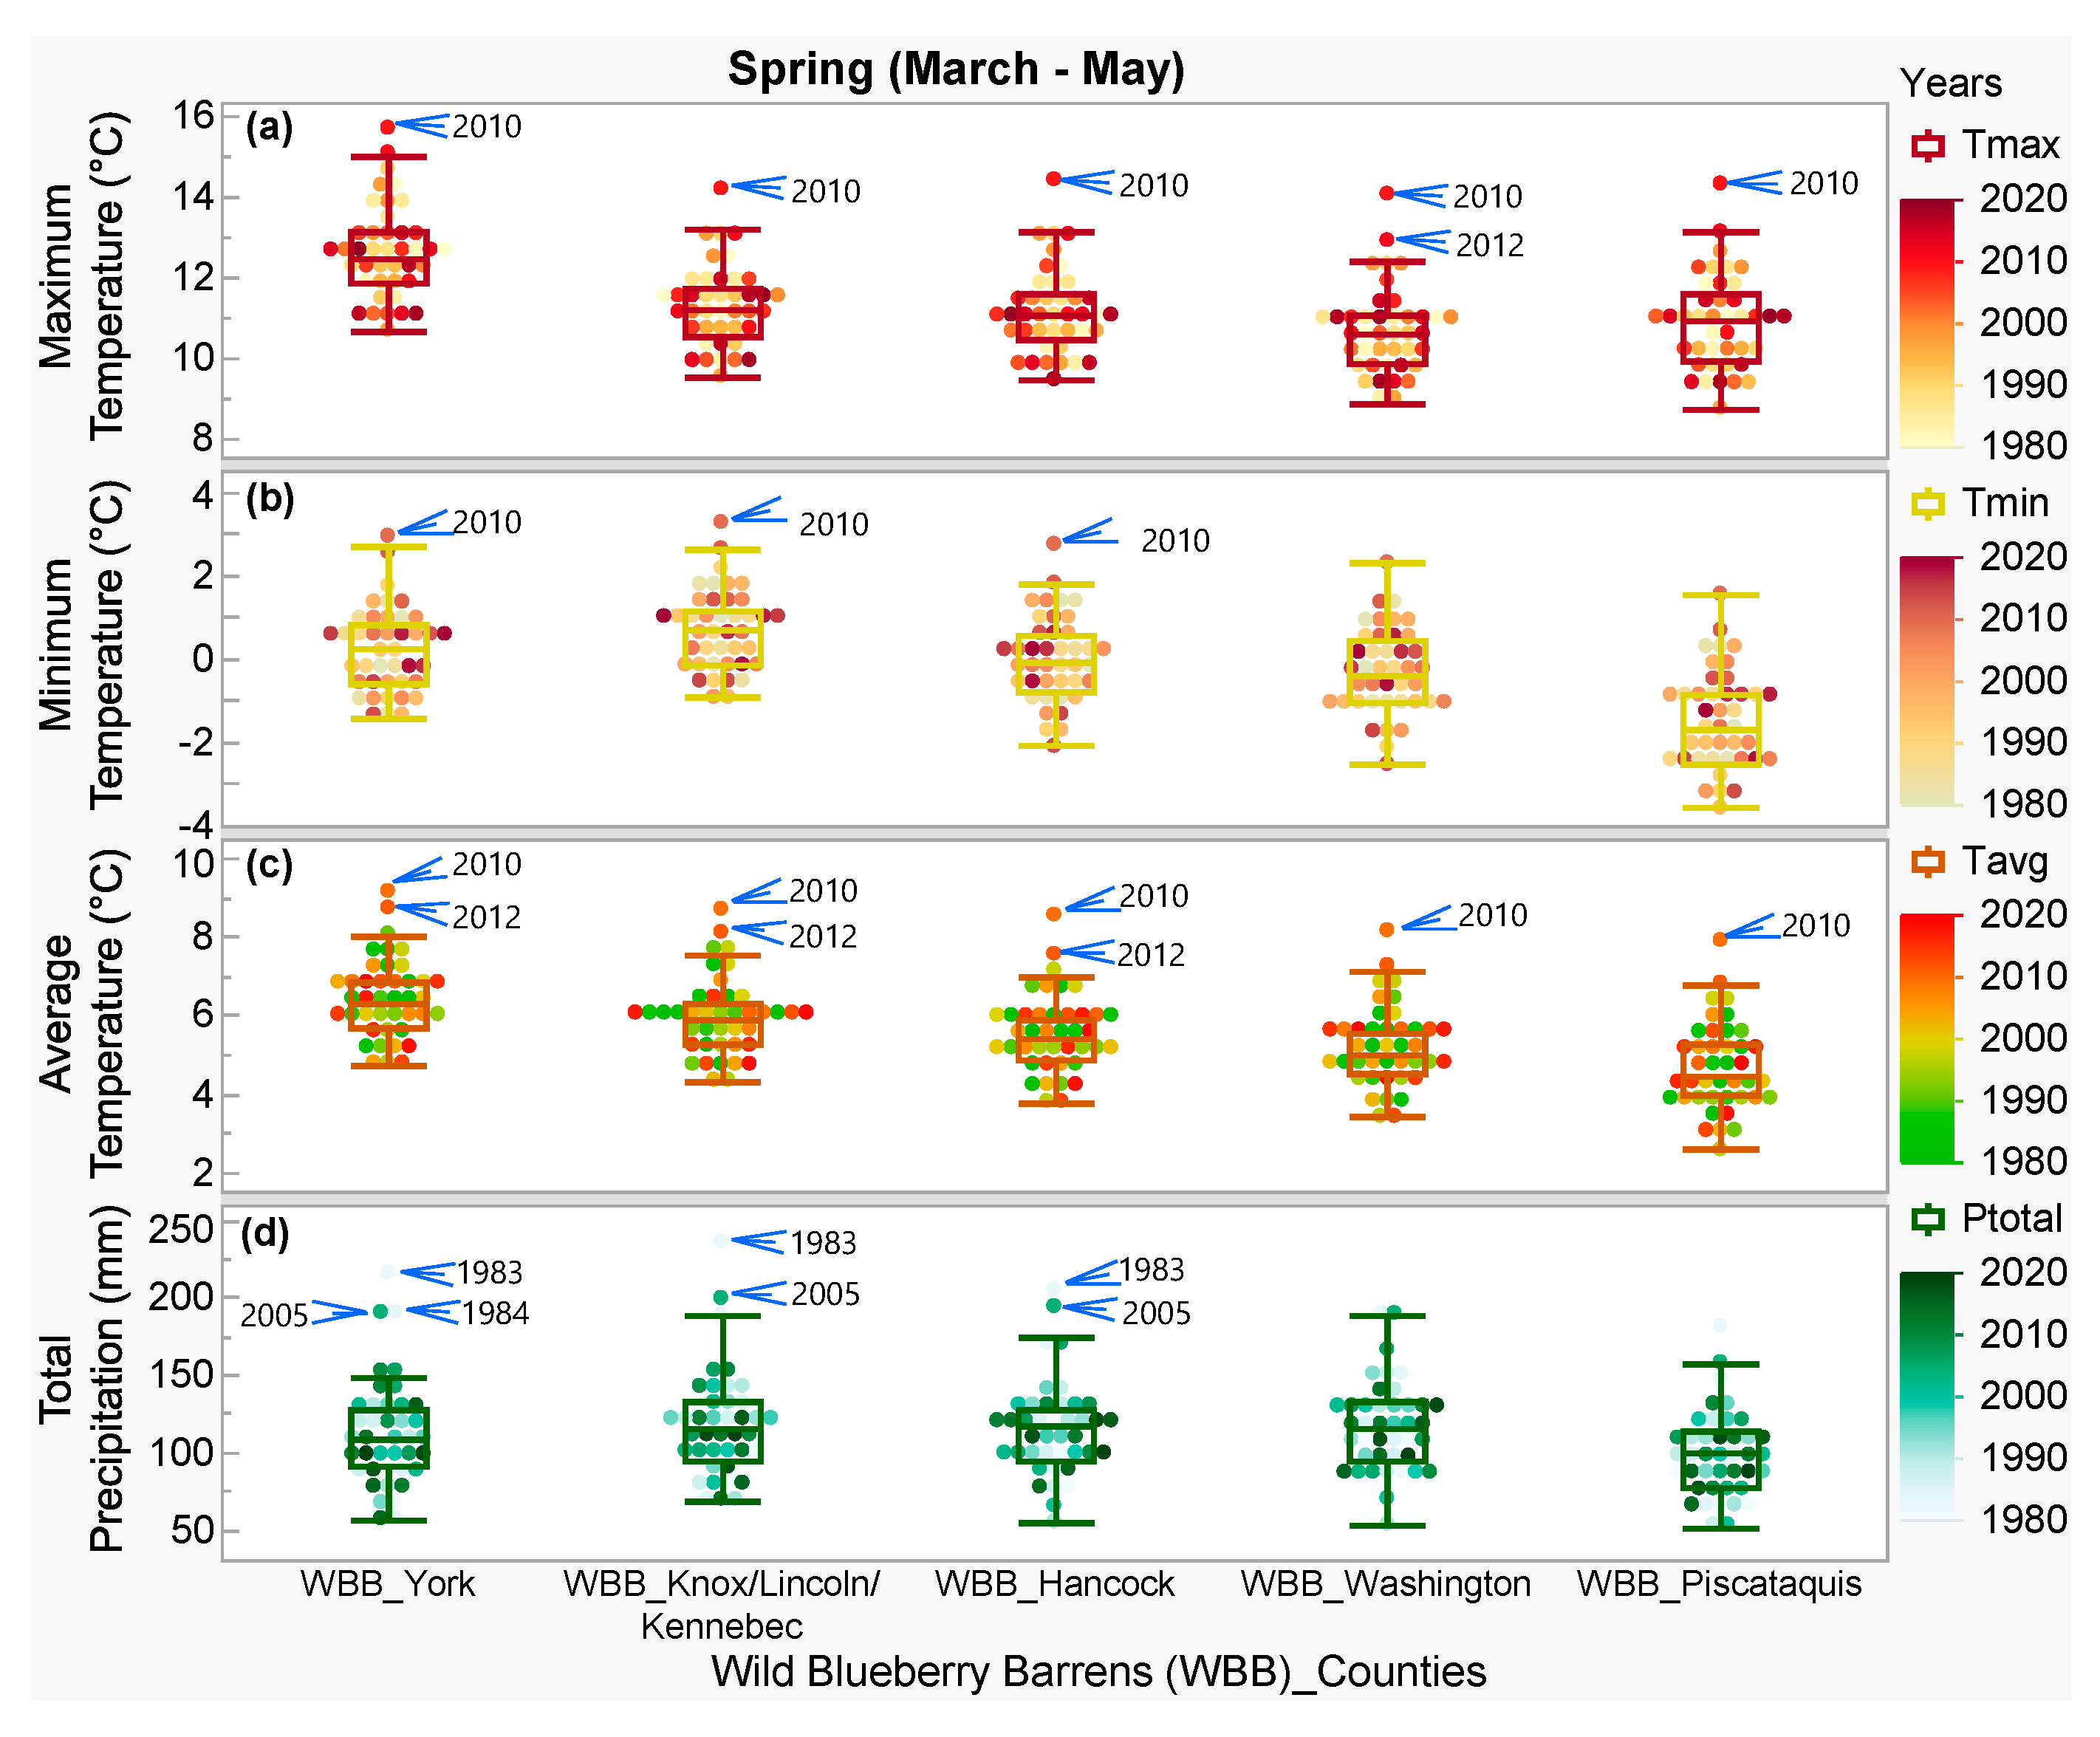
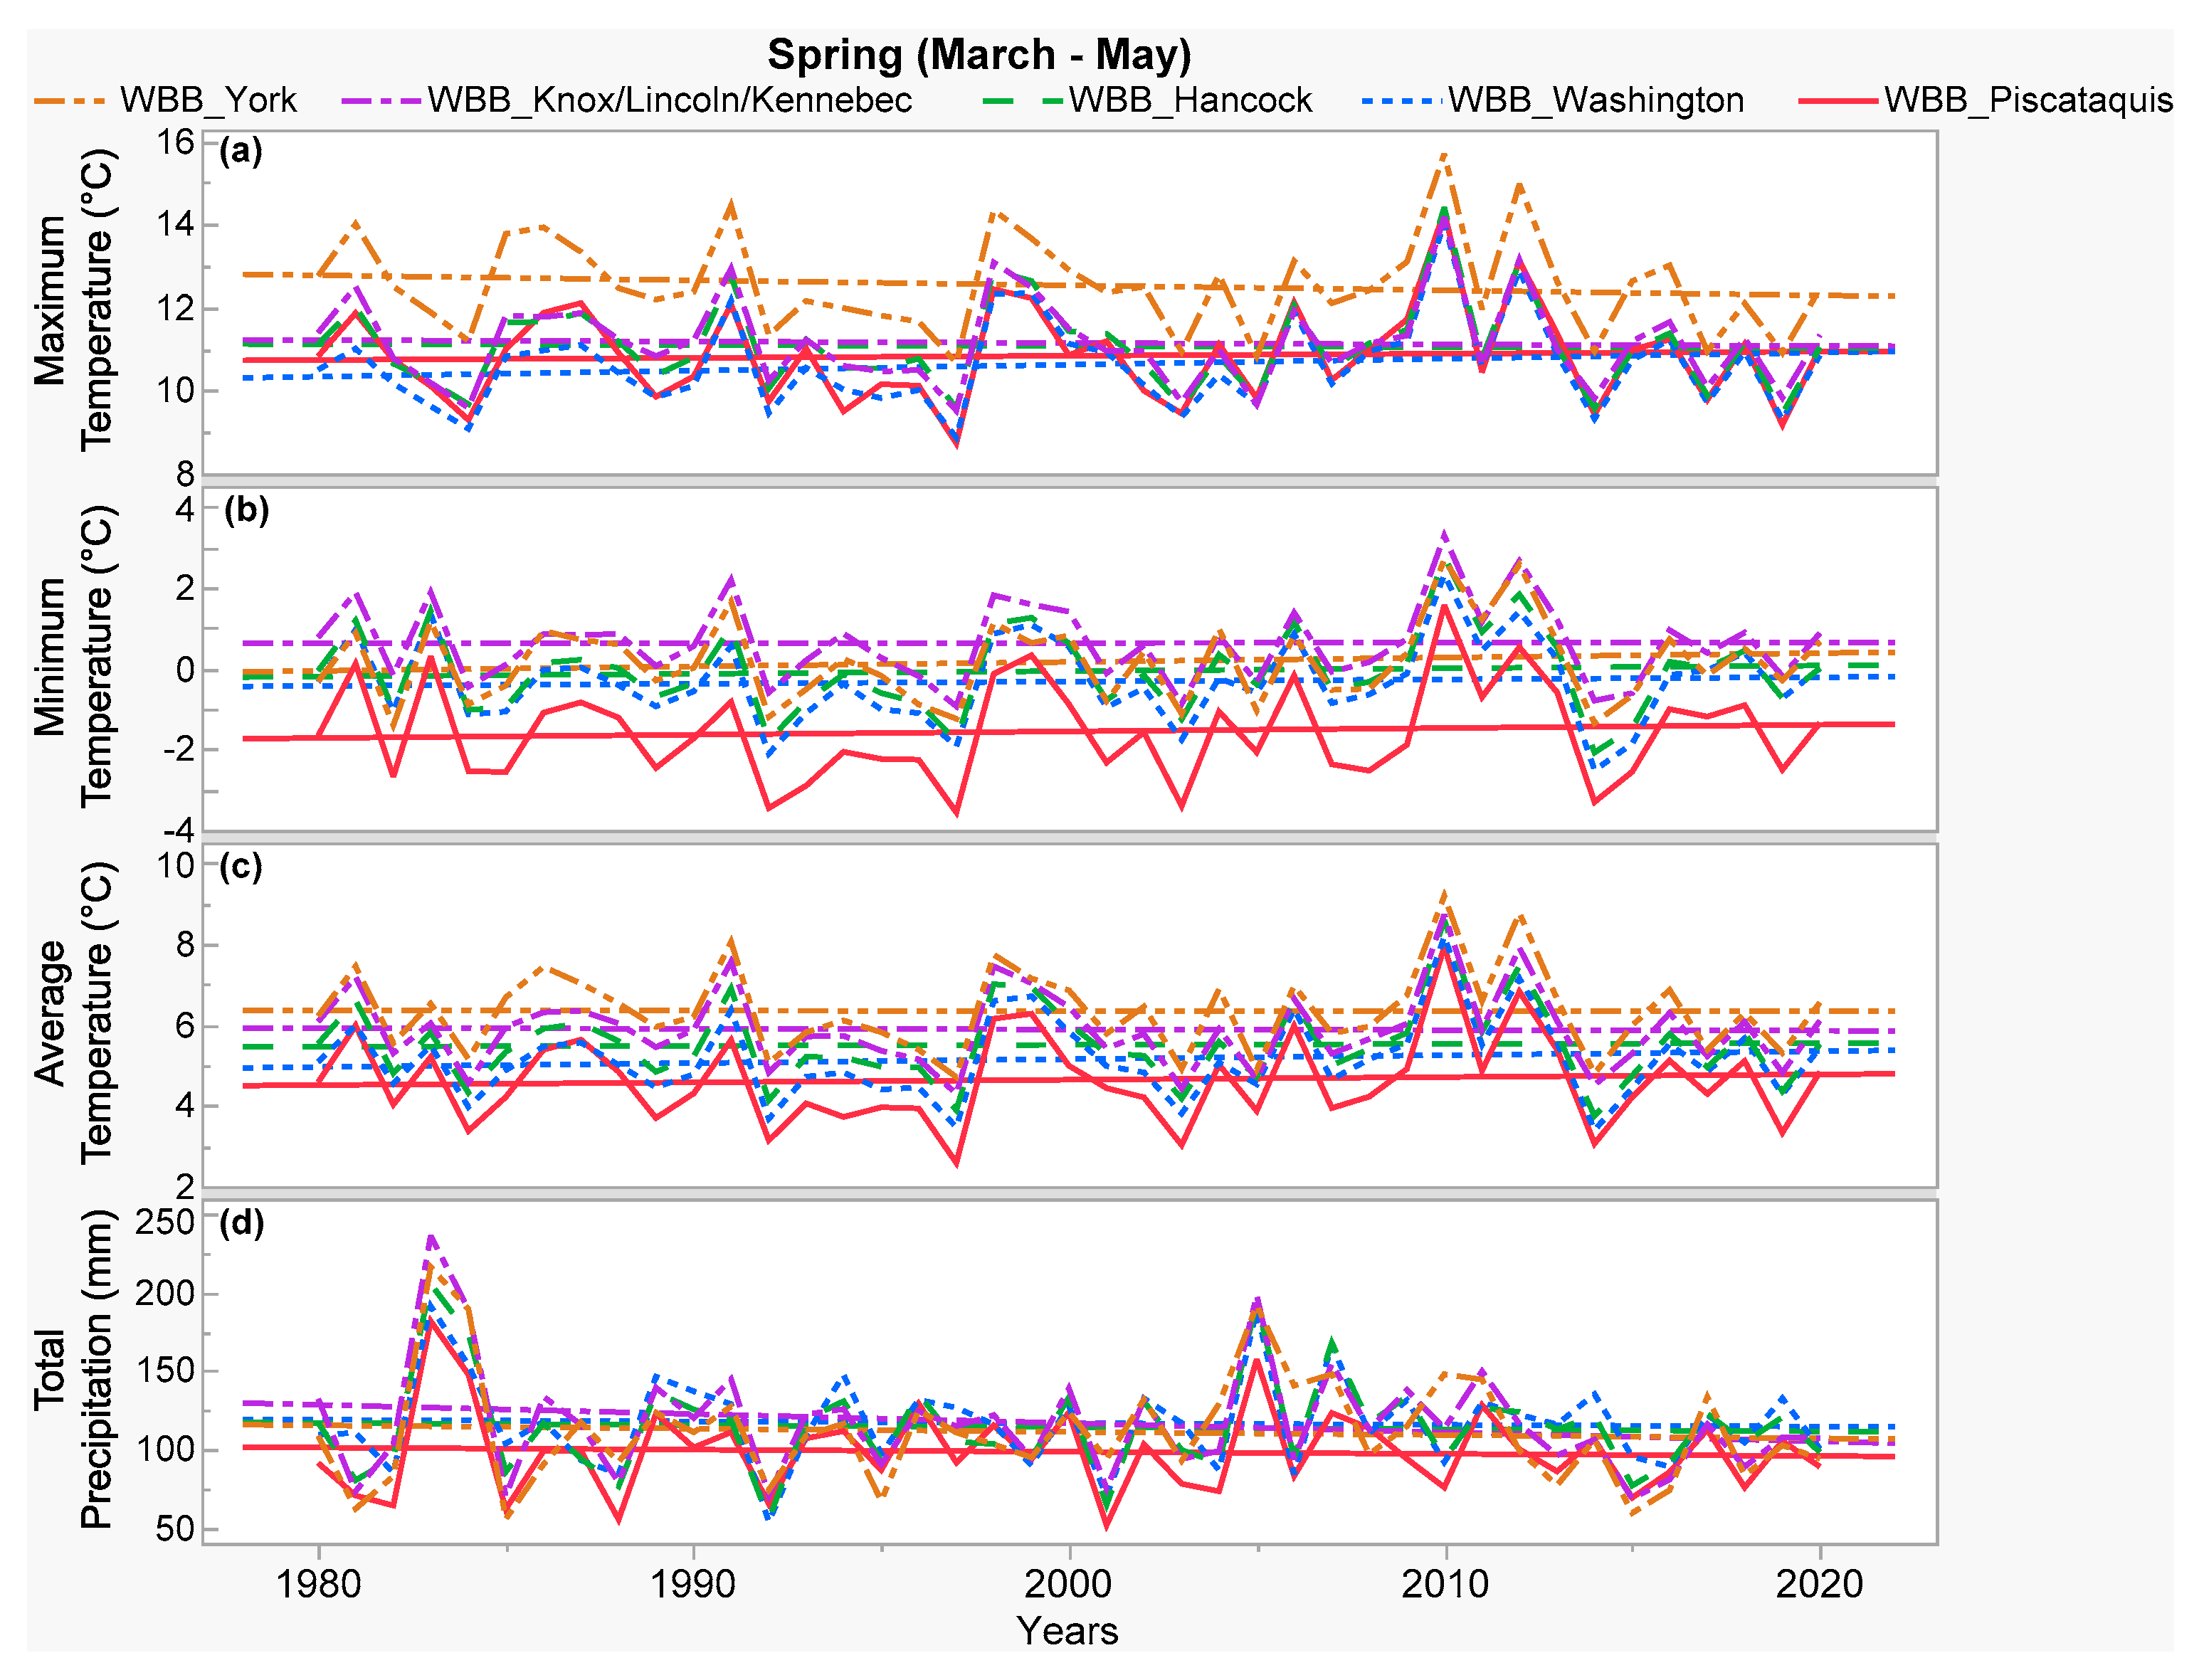
3.2.4. Spring (March–May) Climate in the Barrens

Based on the comparison of temperature box plots (Figure 11a–c), spring maximum temperatures were the highest in the barrens in York County compared to other studied counties with similar maximum temperatures (Figure 11a). Spring minimum and average temperatures were slightly lower in the barrens in Piscataquis County, whereas temperatures were higher in other studied coastal counties farther south-west from Washington to York (Figure 11b,c). Additionally, outliers of higher maximum, minimum, and average fall temperatures in the years 2010 and 2012 were found in the barrens of all studied counties, which represent abnormally warmer springs outside of the historical temperature range (Figure 11a–c). In contrast, spring precipitation was similar (ranging from ~50 to 200 mm) for the barrens in all studied counties (Figure 11d). However, higher precipitation than the historical precipitation range was observed in the barrens towards the south-west counties (Hancock to York in 1983 and 2005) during a few random years (outliers in Figure 11d). In contrast to the historical temperature changes during other seasons, historical spring temperature and precipitation trends did not show any changes in the wild blueberry barrens from any of the studied counties (Figure 12, Table 2 and Table S1).

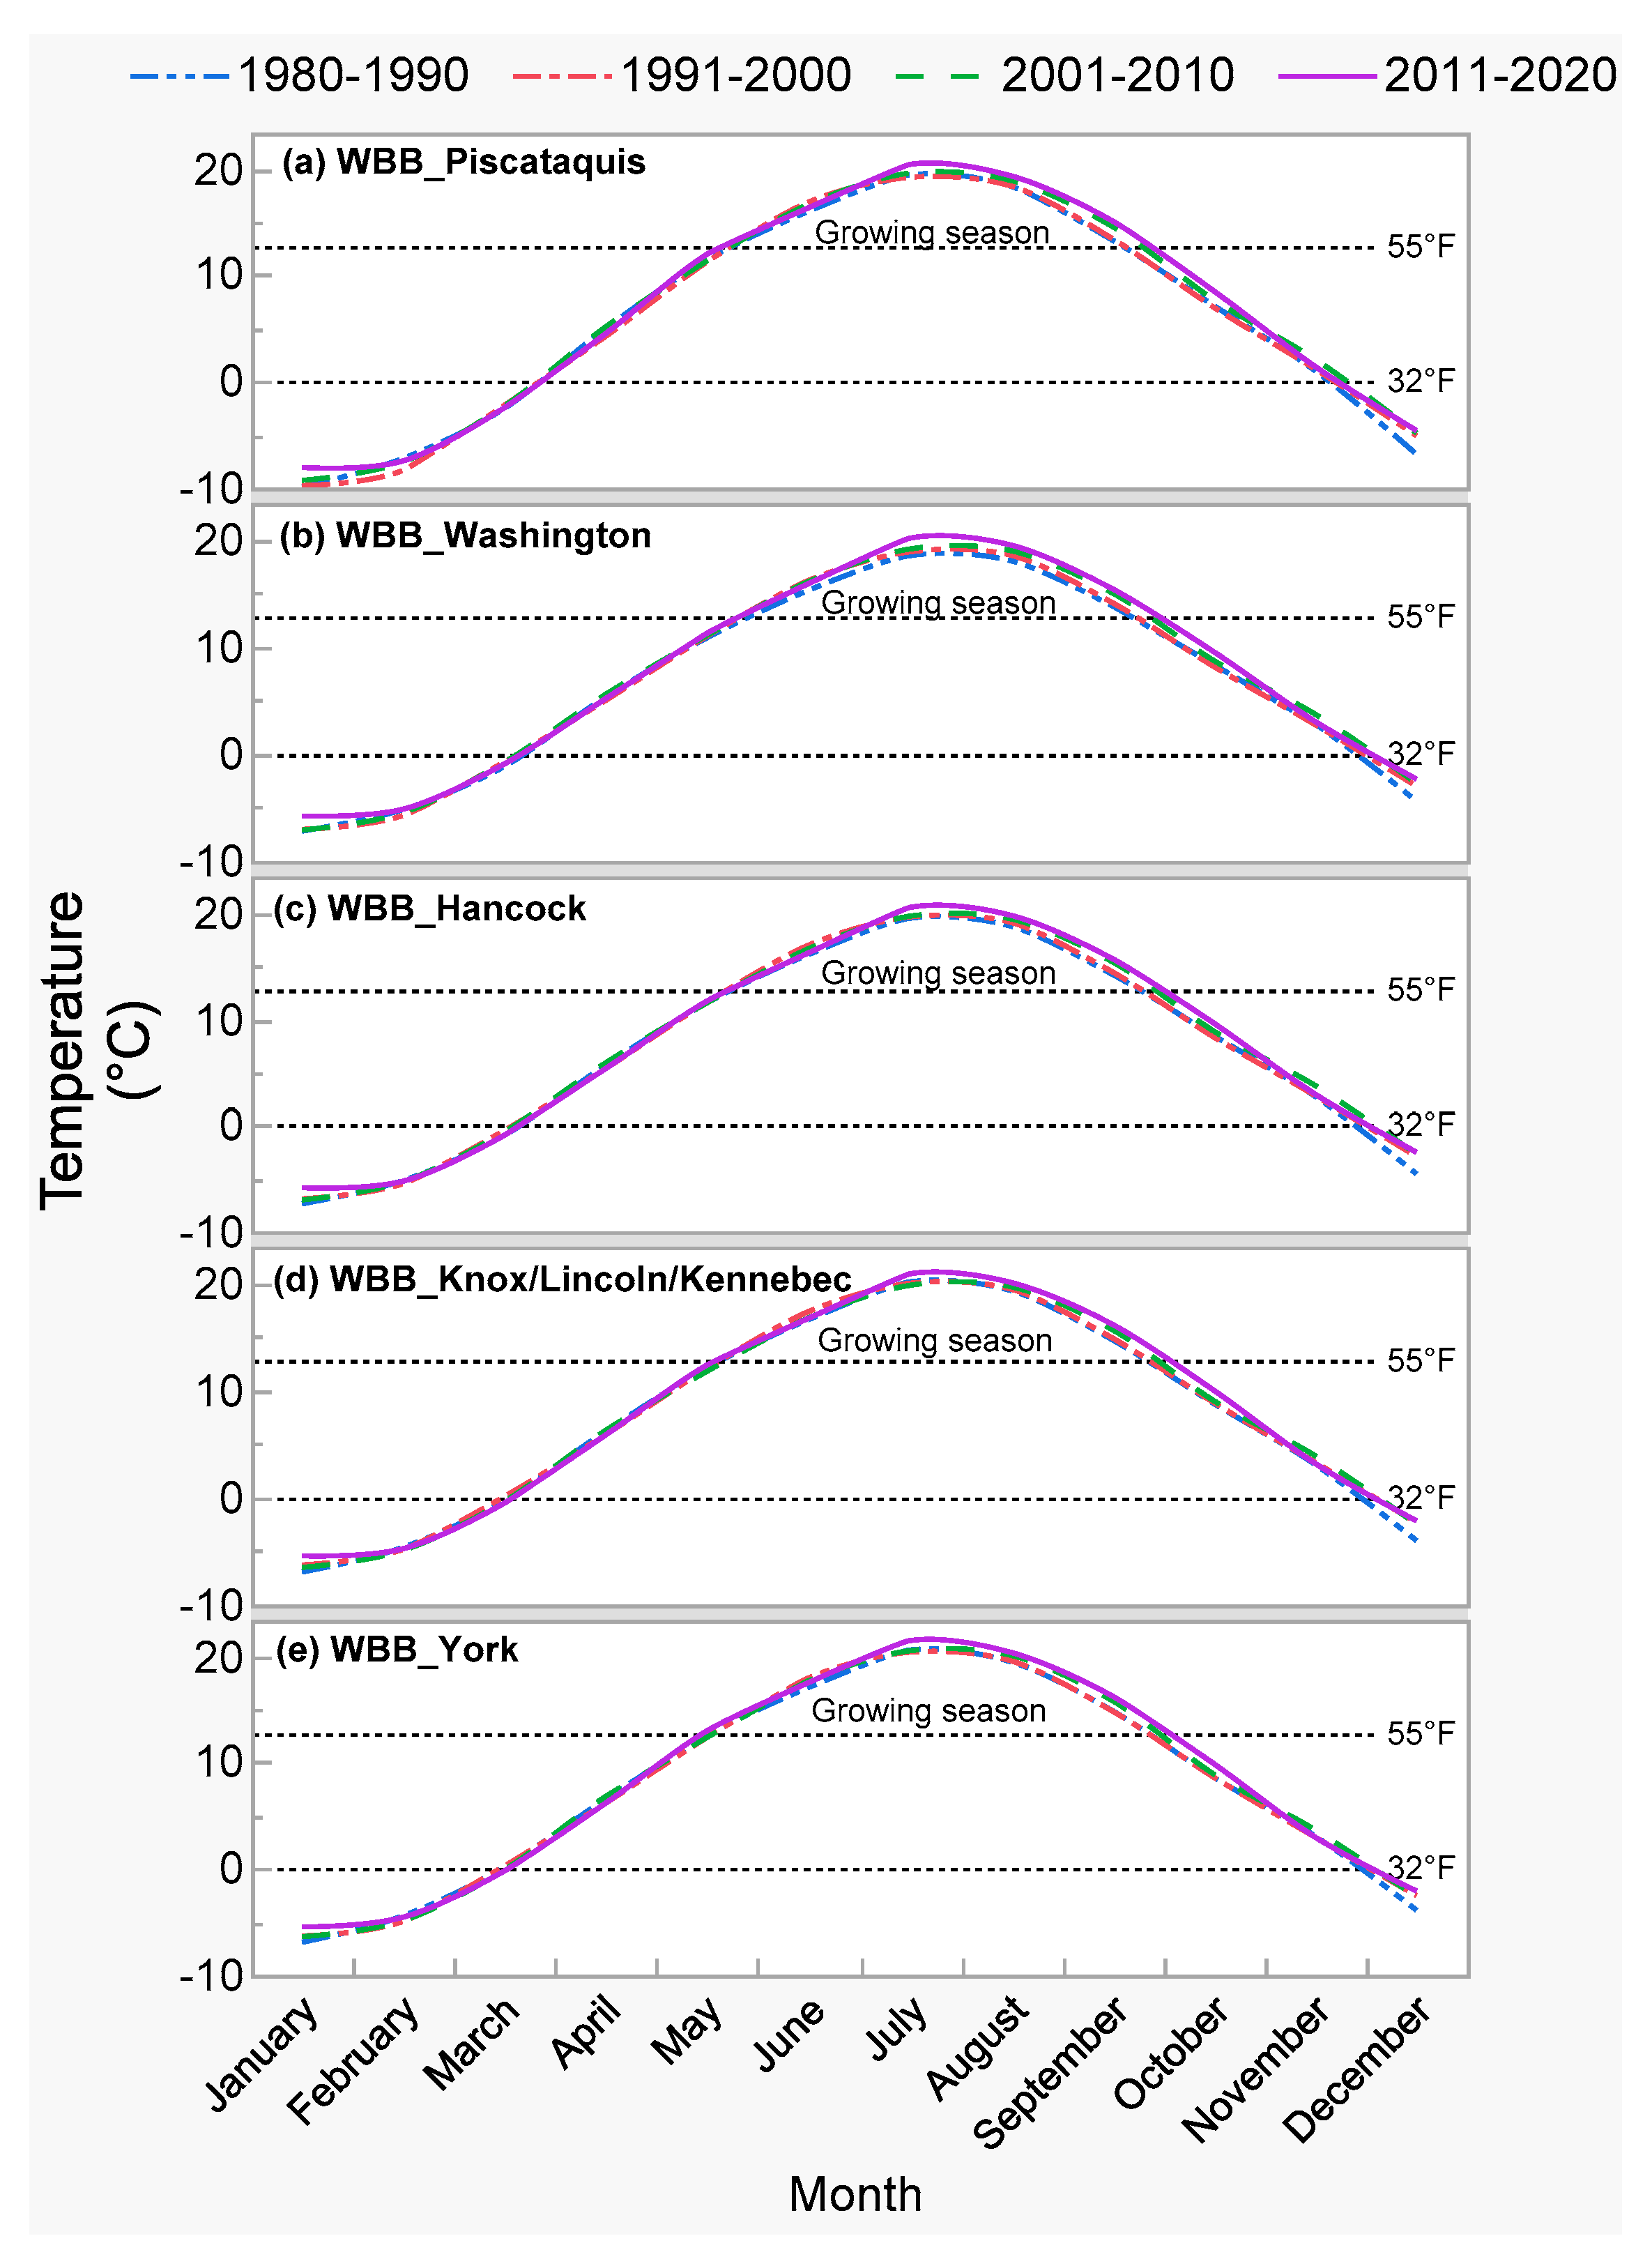
3.2.5. Growing Season in the Barrens

The growing season extended consistently towards the fall as the final dates of the season were delayed from the third week of September to early October after summer (Figure 13, Table 3). In contrast, the growing season extension towards the spring was inconsistent, as the starting dates of the growing season erratically fluctuated from mid-May to late May over the past 41 years (Figure 13, Table 3). In agreement with these trends, first fall frost dates shifted gradually from the third week of November to early December, whereas the last spring frost dates were random from mid-March to late-March over the past 41 years. Moreover, in agreement with the observed higher temperatures in the barrens towards the south-west (Hancock to York), they were also found to have longer growing seasons than in the barrens towards the north-east (Piscataquis and Washington) (Figure 1 and Figure S1, Table 3).

4. Discussion

Our study found that different seasons, day and night times, and different regions showed different climate change patterns over the past 41 years, which has important implications for wild blueberry management. Nighttime is warming faster than daytime in the wild blueberry barrens of Maine, both annually and seasonally. We also found that historical temperatures significantly increased annually driven by the highest rates of warming in the fall and winter seasons followed by summer in the blueberry barrens of Maine. Consequently, our study found that the growing season has been extending towards the fall season, but the extension has been inconsistent towards the spring season. In contrast, precipitation was found to have only increased significantly in Washington County barrens annually, which was driven by the significant precipitation increase in the winter season. In agreement with such rising temperatures and precipitation in the winter season, there have been no significant changes in snow cover on the wild blueberry barrens of Maine. Although temperatures have not increased significantly in the spring, outlier temperatures in some years during spring (2010, 2012) found in all counties indicate that sudden and abnormally warmer springs can happen. Moreover, the range of temperatures (difference between maximum temperature in summer and minimum temperature in winter) significantly decreased, implying that the temperature variations among different seasons declined over time. In terms of variations among the counties, barrens in Piscataquis (north-central) and Washington (north-east) counties experienced lower temperatures than other studied coastal counties farther south-west (Hancock to York). On the contrary, the rates of maximum temperature increase in the barrens of those counties (Hancock to York) with higher temperatures were significantly lower in the summer and winter. Our study is the first to access and report diurnal, seasonal, annual, and spatial climate patterns for the wild lowbush blueberry barrens of Maine, USA. These findings, along with their potential effects discussed below, will better inform the wild blueberry researchers and growers of Maine to be prepared to manage this crop accordingly after it has faced drastic climate change over recent decades.

4.1. Changes in Daytime and Nighttime Temperatures

During the diel cycle, minimum nighttime temperatures increased faster than maximum daytime temperatures in the wild blueberry barrens of Maine in summer, fall, and winter, which is a worldwide pattern [22,23]. This phenomenon may disturb the balance in physiological functions and development of plants, adversely affecting their carbon assimilation, storage, and respiration [23,24,25,26]. This is because photosynthesis (carbon assimilation) in plants happens during the daytime only, which is affected by the maximum daytime temperature, but respiration occurs throughout the day and night, which is affected by both daytime maximum and nighttime minimum temperatures [25,26,27]. Moreover, respiration is more sensitive to temperature compared to photosynthesis [25,26]. Therefore, the increase in respirational loss of carbon may be higher than the increase in photosynthesis under warming. In fact, the respiration of forest and crop systems has been proven to be enhanced by both warmer days and nights [24,25,26,27]. As a result, warmer days and nights may adversely affect the carbon cycle, diminishing the net carbon assimilation of the wild blueberry crop system. In order to verify this, both respiration rates and photosynthetic rates need to be measured and studied under rising temperatures. This adverse effect related to climate change may be crucial for the yield of this important commercial crop in Maine.

4.2. Seasonal Variations in Climate Change and Implications

In terms of rising trends in seasonal temperatures, temperatures were found to increase faster in the fall and winter seasons than in the summer for the wild blueberry barrens of Maine. This pattern agrees with the warming and ice melting in the arctic. A significant amount of ice melting occurred, as a difference of 50% was observed in the sea ice covering the ocean between 1980 and 2016 at the end of the summer [3,28]. This greater warming in the fall season has also led to the extension of the growing season for the wild blueberries towards the fall. Unusually warmer fall seasons have shown delayed leaf senescence [29], early flower initiation, and fall bloom in plants including temperate species [30,31,32,33] such as wild blueberries. First fall frost in the coastal and interior climate regions of Maine was previously shown to be around October–November [9], which has been delayed up to early December since 1980 in the wild blueberry barrens. Such a lengthy growing season has increased the risk of frost damage for the wild blueberry leaves and buds. Warmer winter and spring seasons have been shown to advance the development and maturity of plant stages such as bud break, flowering, and leafing out before the last and late spring frost. This has caused considerable damage to the plants, directly affecting their yield [8,9,10,29,30].
In contrast to the climate observations of coastal Maine and the overall state of Maine [2,3], our study did not show significant increases in historical spring temperatures. However, abnormally higher temperatures observed from the barrens of all studied counties in the last decade (e.g., 2010 and 2012 springs) are rather concerning. This is because such sudden warmer temperatures in the spring can trigger the plants to recover from the winter dormancy and start development (bud breaks and flowering) [10]. Consequently, they may experience damages from late spring frost events, which have been observed to be more frequent within the last decade (2010–2020) and could potentially continue in Maine [2,3,8,9,10,29,30]. Furthermore, temperate species, such as wild blueberries, experiencing sudden warm and wet winters with no increase in snow cover may suffer from winter damage during their hardening and de-hardening processes with insufficient protection from snow-pack [2,3,8,31,34,35,36]. In agreement with all seasons becoming warmer, the temperature difference between the summer maximum temperature and winter minimum temperature has shortened significantly and quickly. Such considerable change places wild blueberries that rely on a two-year cycle and a specific climate at risk due to an imbalance in certain seasonal temperature variations, which is required for a balanced plant life cycle [9,14,29,30,31,34,35,36].

4.3. Spatial Variations in Climate Change and Implications

In terms of spatial variations, barrens in the warmer counties towards the south-west (Hancock to York) experienced a slower rate in temperature increase compared to the counties towards the north-east (Washington and Piscataquis). This phenomenon, in which barrens at higher latitudes and longitudes are warming faster (Table 2), agrees with previous studies undertaken both globally [37] and locally [4]. The reason for this, as explained by Screen [37], is that the wind from the north, having negative temperature anomalies (colder days), is warming up more rapidly than the wind from the south, having positive temperature anomalies (warmer days). This has been a global and historical occurrence as the air temperature is significantly affected by the corresponding wind direction [37].
Overall, wild blueberry barrens everywhere in Maine continue to experience a warmer climate over time with no additional rainfall in summer. Temperate crops such as wild blueberries can potentially thrive in warmer summers but, at the same time, more soil moisture either from natural rainfall or irrigation would be required, which is crucial and necessary for survival [3,6]. However, despite the lack of a clear summer precipitation trend over 1980–2020, we noted the occurrence of a particularly wet decade of 2005–2014, following dryness in the early 2000s, and preceding three dry years of 2016–2018 [3,33]. These phenomena, along with the historically increasing heavy precipitation events in Maine [38], indicate an intensification of the hydrologic cycle. This would potentially result in more total rainfall from heavy precipitation events, interspersed with a period of dryness during the growing season. Such climate trends are particularly unhelpful for the wild blueberry system as the coarse-grained soil would quickly drain the water from heavy rainfall and wild blueberries would not get enough soil moisture to grow during the dry periods. Hence, it is typically recommended to irrigate wild blueberries with a low volume of water more frequently [39]. Irrigation and soil management are particularly crucial because the wild blueberry barrens in Maine have experienced frequent drought events during the growing season [6,38].
Furthermore, warmer winters may potentially hurt wild blueberry production more than warmer summers in a temperate region such as Maine, as a previous study showed adverse effects of winter warming on temperate grasslands rather than summer warming [12]. For instance, soil respiration was higher under winter warming than in summer. Moreover, plant roots and microorganisms suffered from greater frost damage during a few days with a sudden extreme drop in temperature due to less snow cover and thermal insulation under warming [12]. Such winter warming has been shown to be more intense at higher latitudes [12,37]. Therefore, the barrens located in the regions towards the north-east may be more vulnerable to the winter climate changes compared to summer changes. However, our study showed that warming rates are more dependent on the longitudinal directions, and on the distances of the barrens from the coast, than on the latitudinal directions during all seasons (Table 2).
Such spatial climate variations along with their variations and extremes during different seasons imply that the wild blueberry barrens also need attention during seasons in addition to summer. In fact, to avoid adverse seasonal climate effects and adapt to the drastic seasonal variations, management strategies and actions are already being considered for different cultivated crops in Maine [8]. However, it is rather complicated and difficult to apply those precautionary management strategies (i.e., double cropping, crop cover and rotation, etc., detailed in [8]) for the naturally growing wild blueberries, as those strategies are more relevant and suitable for cultivated crops. Therefore, unique strategies need to be developed and tested for this crop, prioritizing seasonal variations and their immediate irreversible effects. For instance, actions need to be planned to protect this crop from irreversible stress due to summer moisture deficits during droughts, erosion from heavy precipitation events, warmer winters, and spring frost damage, which have become more frequent.

5. Conclusions

In conclusion, temperatures in summer, fall, and winter consistently rose in the wild blueberry barrens regardless of location over the past 41 years, whereas precipitation was relatively stable. Moreover, rates of temperature increase were faster during nighttime than daytime, and during the fall and winter seasons than in summer. Moreover, spatial temperature variations were observed as the barrens in the north-east (Piscataquis and Washington) experienced lower temperatures than the barrens towards the south-west (Hancock to York). In contrast, the barrens located towards the south-west (Hancock to York) warmed up at a slower rate than the barrens located towards the north-east (Piscataquis and Washington). Such temporal and spatial temperature change will likely impact wild blueberry barrens positively in some years and negatively in other years. This unpredictable variation calls for further research on the responses of wild blueberry plants to a climate with warmer days and nights, and warmer summer, fall, and winter seasons. Further research is also needed to understand the effect of climate extremes on this crop in recent years. For instance, heatwaves and rainfall anomalies, heavy precipitation events, and decreased snow cover during days with extremely low temperatures may cause larger and irreversible damage to this crop than the changes seen from overall averages. Thus, novel management techniques need to be developed to enhance the capacity of this crop production system in buffering the negative effects of climate extremes.

Supplementary Materials

The following supporting information can be downloaded at: https://www.mdpi.com/article/10.3390/atmos13050690/s1, Figure S1: A map showing different counties and climate regions of Maine. (The map was acquired from NOAA National Weather Service, NOAA Center for Weather and Climate Prediction (website: https://www.cpc.ncep.noaa.gov/products/analysis_monitoring/regional_monitoring/CLIM_DIVS/maine.gif; accessed on 22 March 2022); Figure S2: The relationship between average temperature recorded by different weather stations at 2 ft and 6.5 ft from the ground surface in a wild blueberry field at the Blueberry Hill Farm, Jonesboro, Maine. Here, each point represents monthly average temperature calculated from the recorded daily maximum and minimum temperature by the deployed weather stations. The solid line represents a linear relationship fitted to the data by linear regression analysis (p < 0.0001) and the shaded region represents a 95% confidence interval; Figure S3: (a) Historical (water year: 1980 to 2019) changes with fitted linear regression trendlines for the snow water equivalent (SWE) throughout the studied wild blueberry barrens (WBB) and (b) comparison of historical (water year: 1980 to 2019) snow water equivalent (SWE) among the studied wild blueberry barrens (WBBs) at different counties from north-central (Piscataquis) and north-east (Washington, Hancock) to south-west (Knox, Lincoln, Kennebec, York) of Maine as shown in Figure 1 and Figure S1. Here, 1980 water year indicates October 1980 to September 1981, and 2019 water year indicates October 2019 to September 2020; Table S1: Historical trend analysis of seasonal climate variables using Mann–Kendall test, and comparison of a linear regression fitted slopes using slope t-test among the studied wild blueberry barrens (WBBs) at different counties from north-central (Piscataquis) and north-east (Washington, Hancock) to south-west (Knox, Lincoln, Kennebec, York) of Maine (shown in Figure 1) from 1980 to 2020. Bold parts indicate significant strength in historical climate trends. Different letters associated with the “Slope rate” and “°C/year” indicate significant differences among the counties at a significance level of p < 0.05.

Author Contributions

Conceptualization, R.T. and Y.-J.Z.; methodology, R.T.; software, R.T. and S.R.; validation, R.T.; formal analysis, R.T.; investigation, R.T. and S.R.; resources, R.T. and Y.-J.Z.; data curation, R.T.; writing—original draft preparation, R.T.; writing—review and editing, R.T., Y.-J.Z., S.B. and L.C.; visualization, R.T., Y.-J.Z., S.B. and L.C.; supervision, Y.-J.Z.; project administration, Y.-J.Z.; funding acquisition, Y.-J.Z. All authors have read and agreed to the published version of the manuscript.

Funding

This project was supported by the USDA National Institute of Food and Agriculture, Hatch Project number ME0-22021 through the Maine Agricultural & Forest Experiment Station. This research was also supported by the Wild Blueberry Commission of Maine, and the USDA Specialty Crop Block Grant Program through the Maine Department of Agriculture (CT01A20200918*0996). R.T. was supported by the Ellen Keough Hodosh Fellowship 2022. S.R. was supported by the Center for Undergraduate Research (CUGR) Academic Fellowship 2021-22.

Data Availability Statement

Please See “2.1 Data Source and Acquisition” section in this article for the sources of the publicly archived data products used in this study.

Acknowledgments

We acknowledge David Yarborough, Horticulture and Wild Blueberry Specialist, the University of Maine for providing us with the KMZ file containing the wild blueberry field polygons in Maine to conduct this study.

Conflicts of Interest

The authors declare no conflict of interest.

References

  1. Hanes, S.P.; Waring, T.M. Cultural evolution and US agricultural institutions: A historical case study of Maine’s blueberry industry. Sustain. Sci. 2018, 13, 49–58. [Google Scholar] [CrossRef] [PubMed]
  2. Fernandez, I.; Birkel, S.; Schmitt, C.; Simonson, J.; Lyon, B.; Pershing, A.; Stancioff, E.; Jacobson, G.; Mayewski, P. Maine’s Climate Future 2020 Update; University of Maine: Orono, ME, USA; p. 38. Available online: https://climatechange.umaine.edu/climate-matters/maines-climate-future/ (accessed on 5 February 2022).
  3. Birkel, S.D.; Mayewski, P.A. Coastal Maine Climate Futures; Climate Change Institute, University of Maine: Orono, ME, USA, 2018; 24p. [Google Scholar]
  4. Tasnim, R.; Drummond, F.; Zhang, Y.-J. Climate Change Patterns of Wild Blueberry Fields in Downeast, Maine over the Past 40 Years. Water 2021, 13, 594. [Google Scholar] [CrossRef]
  5. Tasnim, R.; Calderwood, L.; Annis, S.; Drummond, F.; Zhang, Y.-J. The Future of Wild Blueberries: Testing Warming Impacts Using Open-Top Chambers—The Maine Journal of Conservation and Sustainability—University of Maine. The Maine Journal of Conservation and Sustainability. 10 February 2020. Available online: https://umaine.edu/spire/2020/02/10/wildblueberries/ (accessed on 5 February 2022).
  6. Barai, K.; Tasnim, R.; Hall, B.; Rahimzadeh-Bajgiran, P.; Zhang, Y.J. Is Drought Increasing in Maine and Hurting Wild Blueberry Production? Climate 2021, 9, 178. [Google Scholar] [CrossRef]
  7. Maine Wild Blueberry Production Statistics. Available online: https://extension.umaine.edu/blueberries/factsheets/statistics-2/crop-production-statistics-2019/ (accessed on 10 October 2021).
  8. Farm Response to Changing Weather, Maine Climate and Ag Network, University of Maine. Available online: https://umaine.edu/climate-ag/farm-response-changing-weather/ (accessed on 5 February 2022).
  9. Kukal, M.S.; Irmak, S. US agro-climate in 20th century: Growing degree days, first and last frost, growing season length, and impacts on crop yields. Sci. Rep. 2018, 8, 1–14. [Google Scholar] [CrossRef] [PubMed]
  10. Drummond, F.A.; Yarborough, D.E. Growing season effects on wild blueberry (Vaccinium angustifolium) in Maine and implications for management. In Proceedings of the X International Symposium on Vaccinium and Other Superfruits 1017, Maastricht, The Netherlands, 17 June 2012; pp. 101–107. [Google Scholar]
  11. Tasnim, R.; Zhang, Y.J. Are wild blueberries a crop with low photosynthetic capacity? Chamber-size effects in measuring photosynthesis. Agronomy 2021, 11, 1572. [Google Scholar] [CrossRef]
  12. Kreyling, J.; Grant, K.; Hammerl, V.; Arfin-Khan, M.A.; Malyshev, A.V.; Peñuelas, J.; Pritsch, K.; Sardans, J.; Schloter, M.; Schuerings, J.; et al. Winter warming is ecologically more relevant than summer warming in a cool-temperate grassland. Sci. Rep. 2019, 9, 1–9. [Google Scholar] [CrossRef] [Green Version]
  13. Thornton, M.M.; Shrestha, R.; Wei, Y.; Thornton, P.E.; Kao, S.; Wilson, B.E. Daymet: Annual Climate Summaries on a 1-km Grid for North America, Version 4; ORNL DAAC: Oak Ridge, TN, USA, 2020. [CrossRef]
  14. Thornton, M.M.; Shrestha, R.; Wei, Y.; Thornton, P.E.; Kao, S.; Wilson, B.E. Daymet: Monthly Climate Summaries on a 1-km Grid for North America, Version 4; ORNL DAAC: Oak Ridge, TN, USA, 2020. [CrossRef]
  15. Mehdipoor, H.; Zurita-Milla, R.; Izquierdo-Verdiguier, E.; Betancourt, J.L. Influence of source and scale of gridded temperature data on modelled spring onset patterns in the conterminous United States. Int. J. Climatol. 2018, 38, 5430–5440. [Google Scholar] [CrossRef] [Green Version]
  16. Brust, C. An Inter-Model Comparison of Gridded Temperature and Precipitation Products in Montana. University of Montana Conference on Undergraduate Research (UMCUR). 2018. Available online: https://scholarworks.umt.edu/umcur/2018/pmposters/15 (accessed on 5 February 2022).
  17. Esri Inc. ArcGIS Pro (Version 2.4.2). 2019. Available online: https://www.esri.com/en-us/arcgis/products/arcgis-pro/ (accessed on 1 February 2020).
  18. JMP®, Version 16.2; SAS Institute Inc.: Cary, NC, USA, 1989–2021.
  19. Addinsoft. XLSTAT Statistical and Data Analysis Solution. Available online: https://www.xlstat.com (accessed on 26 December 2020).
  20. Hamed, K.H.; Rao, A.R. A modified Mann-Kendall trend test for autocorrelated data. J. Hydrol. 1998, 204, 182–196. [Google Scholar] [CrossRef]
  21. Benjamini, Y.; Hochberg, Y. Controlling the false discovery rate: A practical and powerful approach to multiple testing. J. R. Stat. Soc. Ser. B Methodol. 1995, 57, 289–300. [Google Scholar] [CrossRef]
  22. Davy, R.; Esau, I.; Chernokulsky, A.; Outten, S.; Zilitinkevich, S. Diurnal asymmetry to the observed global warming. Int. J. Climatol. 2017, 37, 79–93. [Google Scholar] [CrossRef] [Green Version]
  23. Cox, D.T.C.; Maclean, I.M.D.; Gardner, A.S.; Gaston, K.J. Global variation in diurnal asymmetry in temperature, cloud cover, specific humidity and precipitation and its association with leaf area index. Glob. Chang. Biol. 2020, 26, 7099–7111. [Google Scholar] [CrossRef] [PubMed]
  24. Peng, S.; Piao, S.; Ciais, P.; Myneni, R.B.; Chen, A.; Chevallier, F.; Dolman, A.J.; Janssens, I.A.; Penuelas, J.; Zhang, G.; et al. Asymmetric effects of daytime and night-time warming on Northern Hemisphere vegetation. Nature 2013, 501, 88–92. [Google Scholar] [CrossRef] [PubMed]
  25. Peraudeau, S.; Roques, S.; Quiñones, C.O.; Fabre, D.; Van Rie, J.; Ouwerkerk, P.B.; Jagadish, K.S.; Dingkuhn, M.; Lafarge, T. Increase in night temperature in rice enhances respiration rate without significant impact on biomass accumulation. Field Crops Res. 2015, 171, 67–78. [Google Scholar] [CrossRef]
  26. Zhang, Y.J.; Cristiano, P.M.; Zhang, Y.F.; Campanello, P.I.; Tan, Z.H.; Zhang, Y.P.; Cao, K.F.; Goldstein, G. Carbon economy of subtropical forests. In Tropical Tree Physiology; Springer: Cham, Switzerland, 2016; pp. 337–355. [Google Scholar]
  27. Atkin, O.K.; Turnbull, M.H.; Zaragoza-Castells, J.; Fyllas, N.M.; Lloyd, J.; Meir, P.; Griffin, K.L. Light inhibition of leaf respiration as soil fertility declines along a post-glacial chronosequence in New Zealand: An analysis using the Kok method. Plant Soil 2013, 367, 163–182. [Google Scholar] [CrossRef]
  28. Francis, J.A. The Arctic matters: Extreme weather responds to diminished Arctic sea ice. Environ. Res. Lett. 2015, 10, 091002. [Google Scholar] [CrossRef]
  29. Stuble, K.L.; Bennion, L.D.; Kuebbing, S.E. Plant phenological responses to experimental warming—A synthesis. Glob. Chang. Biol. 2021, 27, 4110–4124. [Google Scholar] [CrossRef] [PubMed]
  30. Khanduri, V.P.; Sharma, C.M.; Singh, S.P. The effects of climate change on plant phenology. Environmentalist 2008, 28, 143–147. [Google Scholar] [CrossRef]
  31. Rai, R.; Joshi, S.; Roy, S.; Singh, O.; Samir, M.; Chandra, A. Implications of changing climate on productivity of temperate fruit crops with special reference to apple. J. Hortic. 2015, 2, 135–141. [Google Scholar]
  32. Sherry, R.A.; Zhou, X.; Gu, S.; Arnone, J.A.; Schimel, D.S.; Verburg, P.S.; Wallace, L.L.; Luo, Y. Divergence of reproductive phenology under climate warming. Proc. Natl. Acad. Sci. USA 2007, 104, 198–202. [Google Scholar] [CrossRef] [PubMed] [Green Version]
  33. Simonson, J.M.; Birkel, S.D.; Maasch, K.A.; Mayewski, P.A.; Lyon, B.; Carelton, A.M. Association between recent U.S. northeast precipitation trends and Greenland blocking. Int. J. Climatol. 2022, 1–12. [Google Scholar] [CrossRef]
  34. Pearson, K.D. Spring-and fall-flowering species show diverging phenological responses to climate in the Southeast USA. Int. J. Biometeorol. 2019, 63, 481–492. [Google Scholar] [CrossRef] [Green Version]
  35. Vitasse, Y.; Lenz, A.; Körner, C. The interaction between freezing tolerance and phenology in temperate deciduous trees. Front. Plant Sci. 2014, 5, 541. [Google Scholar] [CrossRef] [PubMed] [Green Version]
  36. Wildung, D.K.; Sargent, K. The effect of snow depth on winter survival and productivity of Minnesota blueberries. In Proceedings of the IV International Symposium on Vaccinium Culture, East Lansing, MI, USA, 13–17 August 1988; Volume 241, pp. 232–237. [Google Scholar]
  37. Screen, J.A. Arctic amplification decreases temperature variance in northern mid-to high-latitudes. Nat. Clim. Chang. 2014, 4, 577–582. [Google Scholar] [CrossRef] [Green Version]
  38. MCC STS. Scientific Assessment of Climate Change and Its Effects in Maine. A Report by the Scientific and Technical Subcommittee (STS) of the Maine Climate Council (MCC); MCC STS: Augusta, Maine, 2020; 370p.
  39. 631-Guide to Efficient Irrigation of the Wild Blueberry—Cooperative Extension: Maine Wild Blueberries—University of Maine Cooperative Extension, n.d. Cooperative Extension: Maine Wild Blueberries. Available online: https://extension.umaine.edu/blueberries/factsheets/irrigation/guide-to-efficient-irrigation-of-the-wild-blueberry/ (accessed on 28 November 2021).
Figure 1. Locations of the studied wild blueberry barrens in different counties from north-central (Piscataquis) and north-east (Washington, Hancock) to south-west (Knox, Lincoln, Kennebec, York) at the (a) coastal and interior climate regions of (b) Maine at the north-east of (c) the United States of America. The yellow-colored polygons with pink-colored boundaries indicate the studied wild blueberry barrens (WBBs) (area of each barren ≥ 0.5 km2). Different counties and climate regions of Maine are shown in Figure S1 in the supporting materials of this study.
Atmosphere 13 00690 g001
Figure 2. Comparison of historical (1980 to 2020) annual climate parameters: (a) maximum temperature, (b) minimum temperature, (c) average temperature, (d) total precipitation, and (e) snow water equivalent among the studied wild blueberry barrens (WBBs) in different counties from north-central (Piscataquis) and north-east (Washington, Hancock) to south-west (Knox, Lincoln, Kennebec, York) of Maine as shown in Figure 1.
Atmosphere 13 00690 g002
Figure 3. Historical (1980 to 2020) changes with fitted linear regression trendlines for the annual climate parameters: (a) maximum temperature, (b) minimum temperature, (c) average temperature, (d) total precipitation, and (e) snow water equivalent throughout the studied wild blueberry barrens (WBBs) in different counties from north-central (Piscataquis) and north-east (Washington, Hancock) to south-west (Knox, Lincoln, Kennebec, York) of Maine as shown in Figure 1.
Atmosphere 13 00690 g003
Figure 4. Comparison of historical (1980 to 2020) summer climate parameters: (a) maximum temperature, (b) minimum temperature, (c) average temperature, and (d) total precipitation among the studied wild blueberry barrens (WBBs) in different counties from north-central (Piscataquis) and north-east (Washington, Hancock) to south-west (Knox, Lincoln, Kennebec, York) of Maine as shown in Figure 1.
Atmosphere 13 00690 g004
Figure 5. Historical (1980 to 2020) changes with fitted linear regression trendlines for the summer climate parameters: (a) maximum temperature, (b) minimum temperature, (c) average temperature, and (d) total precipitation, throughout the studied wild blueberry barrens (WBBs) in different counties from north-central (Piscataquis) and north-east (Washington, Hancock) to south-west (Knox, Lincoln, Kennebec, York) of Maine as shown in Figure 1.
Atmosphere 13 00690 g005
Figure 6. Comparison of historical (1980 to 2020) winter climate parameters: (a) maximum temperature, (b) minimum temperature, (c) average temperature, and (d) total precipitation among the studied wild blueberry barrens (WBBs) in different counties from north-central (Piscataquis) and north-east (Washington, Hancock) to south-west (Knox, Lincoln, Kennebec, York) of Maine as shown in Figure 1.
Atmosphere 13 00690 g006
Figure 7. Historical (1980 to 2020) changes with fitted linear regression trendlines for the winter climate parameters: (a) maximum temperature, (b) minimum temperature, (c) average temperature, and (d) total precipitation, throughout the studied wild blueberry barrens (WBBs) in different counties from north-central (Piscataquis) and north-east (Washington, Hancock) to south-west (Knox, Lincoln, Kennebec, York) of Maine as shown in Figure 1.
Atmosphere 13 00690 g007
Figure 8. Historical (1980 to 2020) changes with fitted linear regression trendlines for the temperature range (difference between maximum temperature in summer and minimum temperature in winter throughout the studied wild blueberry barrens (WBBs) in different counties from north-central (Piscataquis) and north-east (Washington, Hancock) to south-west (Knox, Lincoln, Kennebec, York) of Maine as shown in Figure 1.
Atmosphere 13 00690 g008
Figure 9. Comparison of historical (1980 to 2020) fall climate parameters: (a) maximum temperature, (b) minimum temperature, (c) average temperature, and (d) total precipitation among the studied wild blueberry barrens (WBBs) in different counties from north-central (Piscataquis) and north-east (Washington, Hancock) to south-west (Knox, Lincoln, Kennebec, York) of Maine as shown in Figure 1.
Atmosphere 13 00690 g009
Figure 10. Historical (1980 to 2020) changes with fitted linear regression trendlines for the fall climate parameters: (a) maximum temperature, (b) minimum temperature, (c) average temperature, and (d) total precipitation, throughout the studied wild blueberry barrens (WBBs) in different counties from north-central (Piscataquis) and north-east (Washington, Hancock) to south-west (Knox, Lincoln, Kennebec, York) of Maine as shown in Figure 1.
Atmosphere 13 00690 g010
Figure 11. Comparison of historical (1980 to 2020) spring climate parameters: (a) maximum temperature, (b) minimum temperature, (c) average temperature, and (d) total precipitation among the studied wild blueberry barrens (WBBs) in different counties from north-central (Piscataquis) and north-east (Washington, Hancock) to south-west (Knox, Lincoln, Kennebec, York) of Maine as shown in Figure 1.
Atmosphere 13 00690 g011
Figure 12. Historical (1980 to 2020) changes with fitted linear regression trendlines for the spring climate parameters: (a) maximum temperature, (b) minimum temperature, (c) average temperature, and (d) total precipitation, throughout the studied wild blueberry barrens (WBBs) in different counties from north-central (Piscataquis) and north-east (Washington, Hancock) to south-west (Knox, Lincoln, Kennebec, York) of Maine as shown in Figure 1.
Atmosphere 13 00690 g012
Figure 13. Annual average temperature cycle for the periods of 1980–1990, 1991–2000, 2001–2010, and 2011–2020 (represented by 4 lines of different colors and styles) in the studied wild blueberry barrens (WBBs) in (a) Piscataquis, (b) Washington, (c) Hancock, (d) Knox/Lincoln/Kennebec, (e) York counties of Maine as shown in Figure 1. Dotted black lines indicate 32 °F (0 °C) and 55 °F (12.8 °C). Approximate last spring frost and first fall frost dates based on the 32 °F (0 °C) line, and growing season period based on the 55 °F (12.8 °C) line, are further detailed in Table 3.
Atmosphere 13 00690 g013
Table 1. Historical trend analysis of annual climate variables using Mann–Kendall test, and comparison of linear regression fitted slopes using slope t-test among the studied wild blueberry barrens (WBBs) in different counties from north-central (Piscataquis) and north-east (Washington, Hancock) to south-west (Knox, Lincoln, Kennebec, York) of Maine (shown in Figure 1) from 1980 to 2020. Red-colored parts indicate significant strength in historical climate trends. Different letters associated with the “Slope rate” indicate significant differences among the counties at a significance level of p < 0.05. Different letters “a–d” after the numbers indicate significant differences among the studied barrens in different counties.
Climate VariablesMann–Kendall and Slope t-Test Wild Blueberry Barrens (WBB)_Counties
WBB_
Piscataquis
WBB_
Washington
WBB_
Hancock
WBB_Knox/
Lincoln/Kennebec
WBB_
York
Tmax in
Figure 3a
Kendall’s tau0.250.360.180.120.02
p-value 0.020.00090.090.260.84
Trend IncreasingIncreasing
Slope rate, °C1 a1.3 a0.6 b0.4 bc0.2 c
°C/year0.024 a0.032 a0.014 c0.01 c0.005 d
Tmin in Figure 3bKendall’s tau0.310.360.350.310.44
p-value 0.0040.0010.0010.004<0.0001
Trend Increasing
Slope rate, °C1.7 a1.5 ab1.5 ab1.2 b1.7 a
°C/year0.04 a0.036 ab0.036 ab0.03 b0.04 a
Tavg in Figure 3cKendall’s tau0.300.360.280.230.26
p-value 0.0050.00080.0090.030.01
Trend Increasing
Slope rate, °C1.3 ab1.5 a1 bc0.8 c1 bc
°C/year0.032 ab0.036 a0.024 bc0.02 c0.024 bc
Ptotal in Figure 3dKendall’s tau0.150.230.170.190.16
p-value 0.180.040.120.080.13
Trend IncreasingIncreasingIncreasing
Slope rate, mm120 a230 b180 b180 b200 b
mm/year2.93 a5.61 b4.4 b4.4 b4.88 d
SWE in Figure 3eKendall’s tau−0.16−0.00240.020.170.17
p-value 0.130.980.820.120.12
Trend DecreasingNo changeIncreasing
Slope rate, kg15 a015 b15 b
kg/year0.36 a00.36 b0.36 b
Table 2. Correlation analysis of the increases in climate variables (increase in Tmax, Tmin, Tavg, Ptotal, and SWE) with the geographic factors (latitude, longitude, and distance from the coast) for the studied wild blueberry barrens of Maine (shown in Figure 1) during different seasons at the significance level of p < 0.05 *, p < 0.01 **, and p < 0.001 ***.
Time Period/SeasonsClimate VariablesLatitudeLongitudeDistance from Coast
Annual
(January–December)
Increase in Tmax0.150.95 ***−0.63 **
Increase in Tmin0.120.36−0.31
Increase in Tavg0.110.97 ***−0.59 **
Increase in Ptotal−0.82 **0.22−0.74 **
Increase in SWE−0.280.09−0.19
Summer
(May–September)
Increase in Tmax0.190.93 **−0.58 *
Increase in Tmin0.090.33−0.23
Increase in Tavg0.140.88 **−0.51 *
Increase in Ptotal−0.82 **0.32−0.73 **
Winter
(November–February)
Increase in Tmax0.170.91 **−0.54 *
Increase in Tmin0.120.37 *−0.27
Increase in Tavg0.130.90 **−0.53 *
Increase in Ptotal−0.63 *0.54 *−0.64 *
Fall
(September–October)
Increase in Tmax0.34 *0.89 **−0.57 *
Increase in Tmin0.170.39 *−0.26
Increase in Tavg0.31 *0.86 **−0.55 *
Increase in Ptotal−0.59 *0.57 *−0.62 *
Spring
(March–May)
Increase in Tmax0.260.31−0.28
Increase in Tmin0.170.27−0.24
Increase in Tavg0.220.33−0.29
Increase in Ptotal−0.310.34−0.33
Table 3. Approximate last spring frost dates, first fall frost dates, and growing season period during the periods of 1980–1990, 1991–2000, 2001–2010, and 2011–2020.
Wild Blueberry Barrens (WBB)_CountiesPeriod (Year)Last Spring FrostFirst Fall FrostGrowing Season Length and Period
WBB_Piscataquis
in Figure 13a
1980–199025 March17 November116 days [23 May–17 September]
1991–200026 March19 November116 days [23 May–17 September]
2001–201023 March23 November124 days [23 May–25 September]
2011–202026 March21 November131 days [19 May–28 September]
WBB_Washington
in Figure 13b
1980–199020 March24 November114 days [28 May–20 September]
1991–200018 March29 November119 days [25 May–22 September]
2001–201017 March04 December124 days [25 May–27 September]
2011–202019 March04 December126 days [25 May–29 September]
WBB_Hancock
in Figure 13c
1980–199020 March25 November121 days [24 May–23 September]
1991–200015 March30 November120 days [26 May–24 September]
2001–201016 March04 December121 days [25 May–27 September]
2011–202020 March05 December124 days [25 May–30 September]
WBB_Knox/Lincoln/
Kennebec in Figure 13d
1980–199016 March27 November127 days [18 May–23 September]
1991–200014 March04 December128 days [18 May–24 September]
2001–201016 March04 December129 days [20 May–27 September]
2011–202019 March04 December136 days [16 May–02 October]
WBB_York
in Figure 13e
1980–199014 March28 November131 days [15 May–24 September]
1991–200014 March03 December130 days [16 May–24 September]
2001–201015 March04 December134 days [16 May–28 September]
2011–202017 March04 December141 days [13 May–02 October]
Publisher’s Note: MDPI stays neutral with regard to jurisdictional claims in published maps and institutional affiliations.

