Abstract
The Tibetan Plateau (TP) vortex (TPV), one of the crucial weather systems triggering rainfall, plays a key role in modulating precipitation over TP and downstream regions. The role of atmospheric heat source in TPV development is explored by a case study in June 2016, using high-resolution ERA5 reanalysis, black-body temperature (TBB) obtained from the Fengyun-2E (FY-2E) satellite, and precipitation amount from the Tropical Rainfall Measurement Mission (TRMM). The evolutions of TPV can be split into three stages, i.e., generation, development, and pre-moving-off stage. The intensity of TPV increases with fluctuations, with weaker and shallower TPV in the generation stage, strongest in the development stage and deepest in the pre-moving-off stage. Importantly, the genesis of TPV is related to the surface warming center driven by surface sensible heating while its development is primarily dependent on the latent heat of condensation. The main contributor of the latent heat of condensation is further analyzed as a vertical transport of the water vapor that promotes TPV development.
1. Introduction
The Tibetan Plateau (TP) Vortex (TPV), an essential weather system over the TP that triggers rainfall, can create severe synoptic disasters in local and downstream areas [1,2]. Generally, the TPV is evident at 500 hPa isobaric surface with a horizontal scale of 400–800 km and a vertical scale of 2–3 km [3,4]; moreover, previous studies [5,6] have suggested that the TPVs are mostly born in the central and western part of the TP and die out on the lower slopes of the eastern TP.
Heat sources have been reported to play a key role in TPV formation and development [7]. Liu et al. [8] noted that TPVs genesis are favored in the lower troposphere with a strong atmospheric apparent heat source over the TP, and vice versa. In summer, the TP directly heats the middle troposphere through combined diabatic heating consisting of sensible, latent, and radiative heating [9,10]. A positive correlation was found in the frequency of TPV generation with surface sensible heating, while a negative correlation with surface latent heating [11]. By employing the original equation, sensible heating acts as an intensifier for TPV in middle TP but even inhibited the development of TPV in southern TP [12]. However, a different result was found in simulations where surface sensible heating weakens the development of TPV [13]. Using the WRF model, Zhang et al. [14] discovered that daytime surface diabatic heating works on the development of both daytime convection and nighttime TPV. Similar results for advection with positive relative vorticity at 500 hPa, in conjunction with the effect of surface sensible heating inducing TPV genesis, while the latent heat released by condensation leading to TPV extinction was found in Wu et al. [15]. Nevertheless, in Tian et al. [16], the association of the latent heat released by condensation from precipitation in convective systems with the intensification of the eastward TPV was highlighted. Overall, the specific effects of surface sensible heating and latent heat of condensation on TPV are controversial, and an in-depth understanding of the relevant contributions of surface sensible heating and condensation latent heat to TPV remains notably absent.
Heat sources vary in different growth stages of the TPV. Li et al. [17] suggested that the atmospheric heat source is the dominant factor for the eastward movement and development of the TPVs in development stage, but its effect on TPVs become weaker in decaying stages. The results of Dong et al. [18] showed that latent heat of condensation primarily occurred before the downhill stage and later after the downhill stage. Therefore, it is necessary to discuss the roles of atmospheric heat source in the TPV during its different stages and further reveal the relative contribution of surface sensible heating and the latent heat of condensation in the atmosphere.
A TPV formed in southern Bayingol, Xinjiang on 28 June 2016, with a long span and moderate rain over the TP, and triggers strong rainstorms in the middle and lower reaches of Yangtze River after moving out of the TP [19]. In this study, this typical case was selected to determine the impact of the atmospheric heat source on the evolution of the TPV in different stages, based on multi-source datasets, including the possible mechanisms.
This paper is organized as follows: Section 2 presents the data and methodology; Section 3 describes the evolution of the TPV in the different stages before moving off the TP; and Section 4 investigates the impact of the atmospheric heat source on the TPV in different stages and the related physical fields. A summary and discussion are provided in Section 5.
2. Data and Methods
2.1. Dataset
The following datasets are employed in this study:
- (1)
- The fifth-generation reanalysis dataset ERA 5 (https://cds.climate.copernicus.eu/#!/search?text=ERA5&type=dataset, accessed on 5 March 2022), provided by the European Centre for Medium-Range Weather Forecasts (ECMWF) [20], with a spatial resolution of 0.25° × 0.25° and a temporal resolution of 1 h;
- (2)
- The black-body temperature (TBB) data derived from FY-2E meteorological satellite provided by the National Satellite Meteorological Center of the China Meteorological Administration (http://satellite.nsmc.org.cn/portalsite/default.aspx, accessed on 5 March 2022), with a spatial resolution of 5 km and a temporal resolution of 1 h;
- (3)
- Daily precipitation data from 2791 stations of the National Meteorological Information Center of the China Meteorological Administration;
- (4)
- Precipitation data provided by the Tropical Rainfall Measurement Mission (TRMM) [21], with a spatial resolution of 0.25° × 0.25° and a temporal resolution of 3 h (https://disc.gsfc.nasa.gov, accessed on 5 March 2022); and
- (5)
- A dataset of TPVs based on ERA 5 reanalysis data was obtained using the objective identification method [22,23], with a time interval of 1 h. The TPV center is defined as the lowest point of the closed contour line of geopotential height at 500 hPa, and the TPV radius is the average radius of the outermost closed contour line.
2.2. Methods
2.2.1. Potential Vorticity Tendency Equation
The potential vorticity (PV) tendency equation [24] without the friction effect can be given as:
where PVe is the potential vorticity, and Q = dθ/dt is for diabatic heating. and represent the contribution of the uneven distribution of diabatic heating in the vertical direction (PV1) and horizontal direction (PV2) to the variation of potential vorticity, respectively.
2.2.2. Atmospheric Apparent Heat Source and Apparent Moisture Sink
The calculation of the atmospheric apparent heat source Q1 and the apparent moisture sink Q2 adopts the inverse algorithm, proposed by Yanai et al. [25]:
where cp is the specific heat at constant pressure, p0 = 1000 hPa; κ is the Poisson coefficient; T is the temperature; θ is the potential temperature; ω is the vertical velocity; V is the horizontal wind vector; L is a constant of the latent heat condensation; and q is the specific humidity.
3. Characteristics of the TPV Evolution
At 16:00 on 28 June 2016 (Beijing standard time, BST, the same as below), a TPV is generated in the south of Bayingol, Xinjiang, and Figure 1 shows the path of this TPV case. Obviously, it moves southeastward out of the TP at 08:00 on 30 June, further shifts eastward crossing Sichuan, Chongqing, and the middle reaches of the Yangtze River, and finally arrives at Xiangyang, Hubei on 1 July. The lifespan of the TPV is up to 58 h with an average moving speed of 14.1 m s−1, which is relatively faster compared to the climatological moving speed of TPVs [26]. This TPV case keeps active on the TP for about 40 h, generating little-to-moderate precipitation. More precipitation occurs in Sichuan, Chongqing, and the middle reaches of the Yangtze River when TPV moves off the TP.
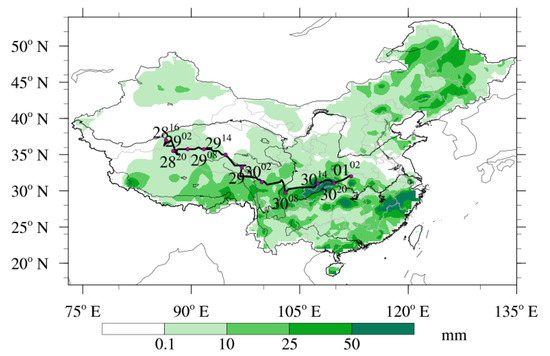
Figure 1.
Track of the Tibetan Plateau Vortex (TPV) and distribution of precipitation at 2791 stations from 20:00 on 28 to 20:00 on 30 June 2016 in China.
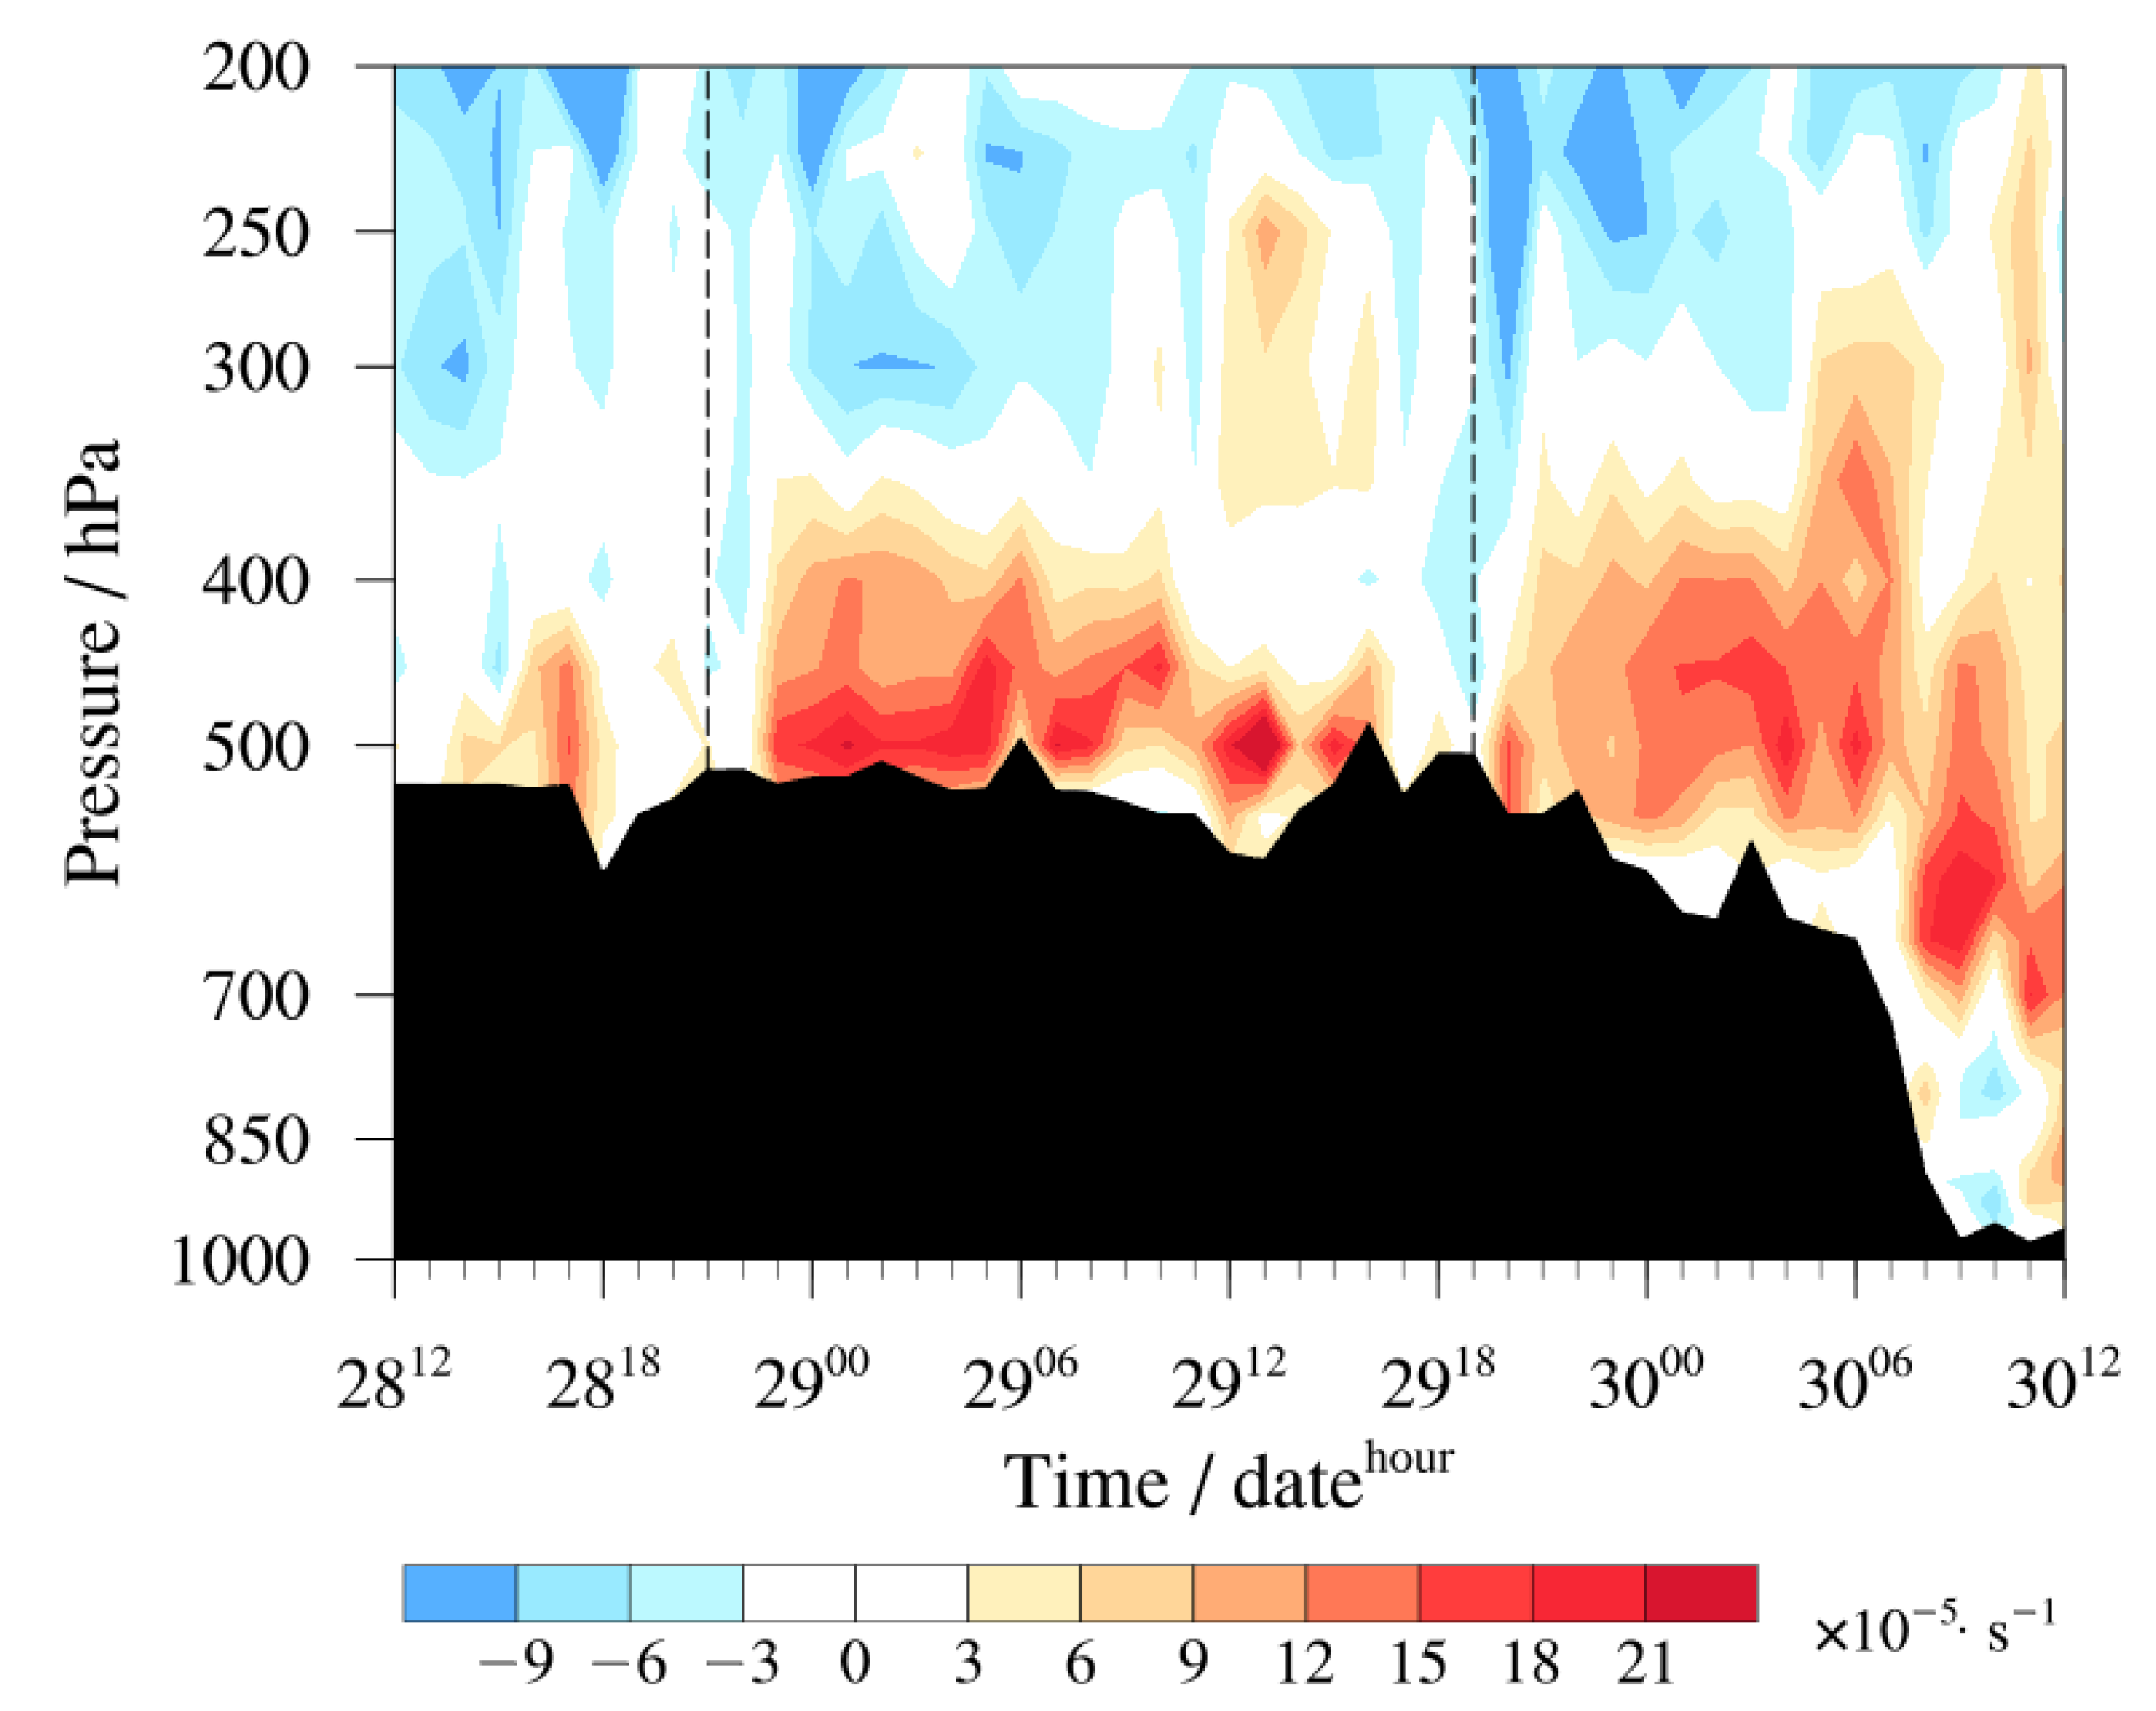
To get insight into the vertical structure of the TPV, the time-height section of the relative vorticity along the center of the TPV is given in Figure 2. It clearly shows that the intensity of the vorticity varies considerably with time, and can easily be divided into three stages. The first stage is from 12:00 on 28 to 23:00 on 28 June, when the TPV is located in western TP with a weak vorticity center near the source region of the TPV. The TPV then moves eastward to the central part of the TP and rapidly becomes much stronger in the second stage, from 23:00 on 28 to 20:00 on 29 June. The positive vorticity region extends upward to 350 hPa, with big value center (more than 18 × 10−5 s−1) at 400–500 hPa, indicating that TPV becomes deeper in this stage. In fact, the intensity of the TPV fluctuates, and is relatively weak in the late of this stage. During the third stage (20:00 on 29 to 08:00 on 30 June), TPV becomes strengthened again, with positive vorticity extending to 250 hPa before moving off the TP. Therefore, it can be seen that the evolutions of the TPV over the TP have distinct stages, with a fluctuating intensity of the TPV, including the generation stage, development stage and pre-moving-off stage. Additionally, the peaks of the TPV vorticity occur at night, which may be related to the daily variation in thermal conditions over the TP [27].

Figure 2.
Vertical-time section of relative vorticity (shading, unit: 10−5 s−1) near the Tibetan Plateau Vortex (TPV) center from 12:00 on 28 to 12:00 on 30 June 2016 (the black dashed lines are the boundary of the three stages).
To facilitate this work, one epoch of TPV is selected from each stage to study the TPV variations across the three stages. The characteristic quantities (vorticity, vertical velocity and the TBB) are listed in Table 1. In the generation stage, the TPV is weak but has a robust vertical velocity of 1.23 Pa·s−1. The development stage has the largest vorticity, radius and lowest TBB, indicating that TPV strongly develops when moving eastward, with a larger radius of vorticity and lower vertical velocity. For the third stage, the vorticity and the radius rapidly become smaller before TPV moving off the TP.

Table 1.
The characteristics of the Tibetan Plateau Vortex (TPV) at different stages. The vorticity, vertical velocity and the TBB are all averaged over the 2° × 2° grid near the TPV center.
To further explore the evolution of TPV at the different stages, Figure 3 displays the distributions of the atmospheric circulation at 500 hPa isobaric surface and the TBB at six epochs (every two epochs per stage). From Figure 3, we can see that in the generation stage, the TP is controlled by an anticyclonic circulation of 500 hPa at 16:00 on 28 June (Figure 3a,b). Then, the anticyclonic circulation retreats to the southeastern TP at 00:00 on 29 June. In parallel, a cyclonic circulation appears in the western TP. Then a TPV is formed, with a convective cloud appearing on its southeast edge. Both the intensity and horizontal scale of the TPV are relatively weak at the first stage. For the second stage (Figure 3c,d), the TPV moves eastward to the central TP at 08:00 on 29 June, with the cyclonic circulation intensifying and convective cloud weakening. At 20:00 on 29 June (Figure 3d), the TPV continues to move eastward and gradually becomes strengthened, especially with a stronger convective cloud to the south of the TPV, which appears to be the peak of TPV’s development over the TP. From Figure 3e (pre-moving-off stage), we can see that TPV now is located in the eastern TP. The cyclone circulation is weakened, and the large value center of the convective cloud has moved away from the TP, indicating that the activity of the TPV over the TP is coming to an end. Until 12:00 on 30 June, the TPV completely moves out of the TP (Figure 3f).
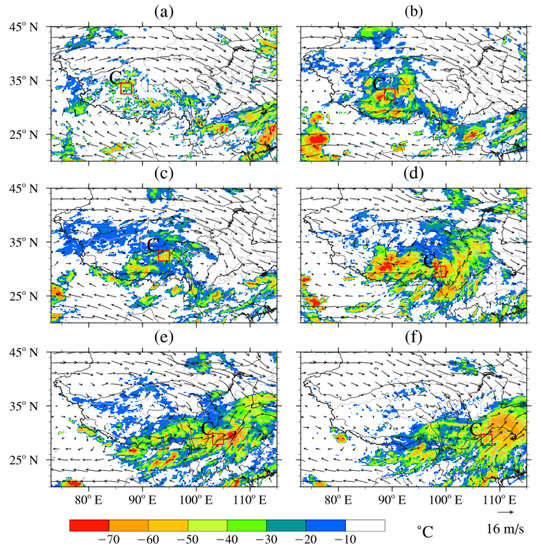
Figure 3.
Distributions of the 500 hPa wind field (vector, unit: m s−1) and black-body temperature (shadow, unit: °C; “C” represents the TPV center; the red box represents the key area of the TPV cloud, which is located 1° east of TPV and 1° south of TPV) at 16:00 on 28 (a), 00:00 on 29 (b), 08:00 on 29 (c), 20:00 on 29 (d), 06:00 on 30 (e), and 12:00 on 30 (f) June 2016.
To sum up, the cloud system of the TPV evolves from the initial convective cloud cluster to a spiral cloud system in the strong period, and finally weakens to a banded cloud system. Throughout this process, the strong convections are mainly concentrated to the southeast part of the TPV. From the variations of TPV moving velocities, the average moving speed of TPV in three stages are found to be 7.6 m·s−1, 10.0 m·s−1 and 10.9 m·s−1, suggesting that the TPV moving speed accelerates with development, with the maximum speed appearing at the downhill terrain in the eastern part of the TP.
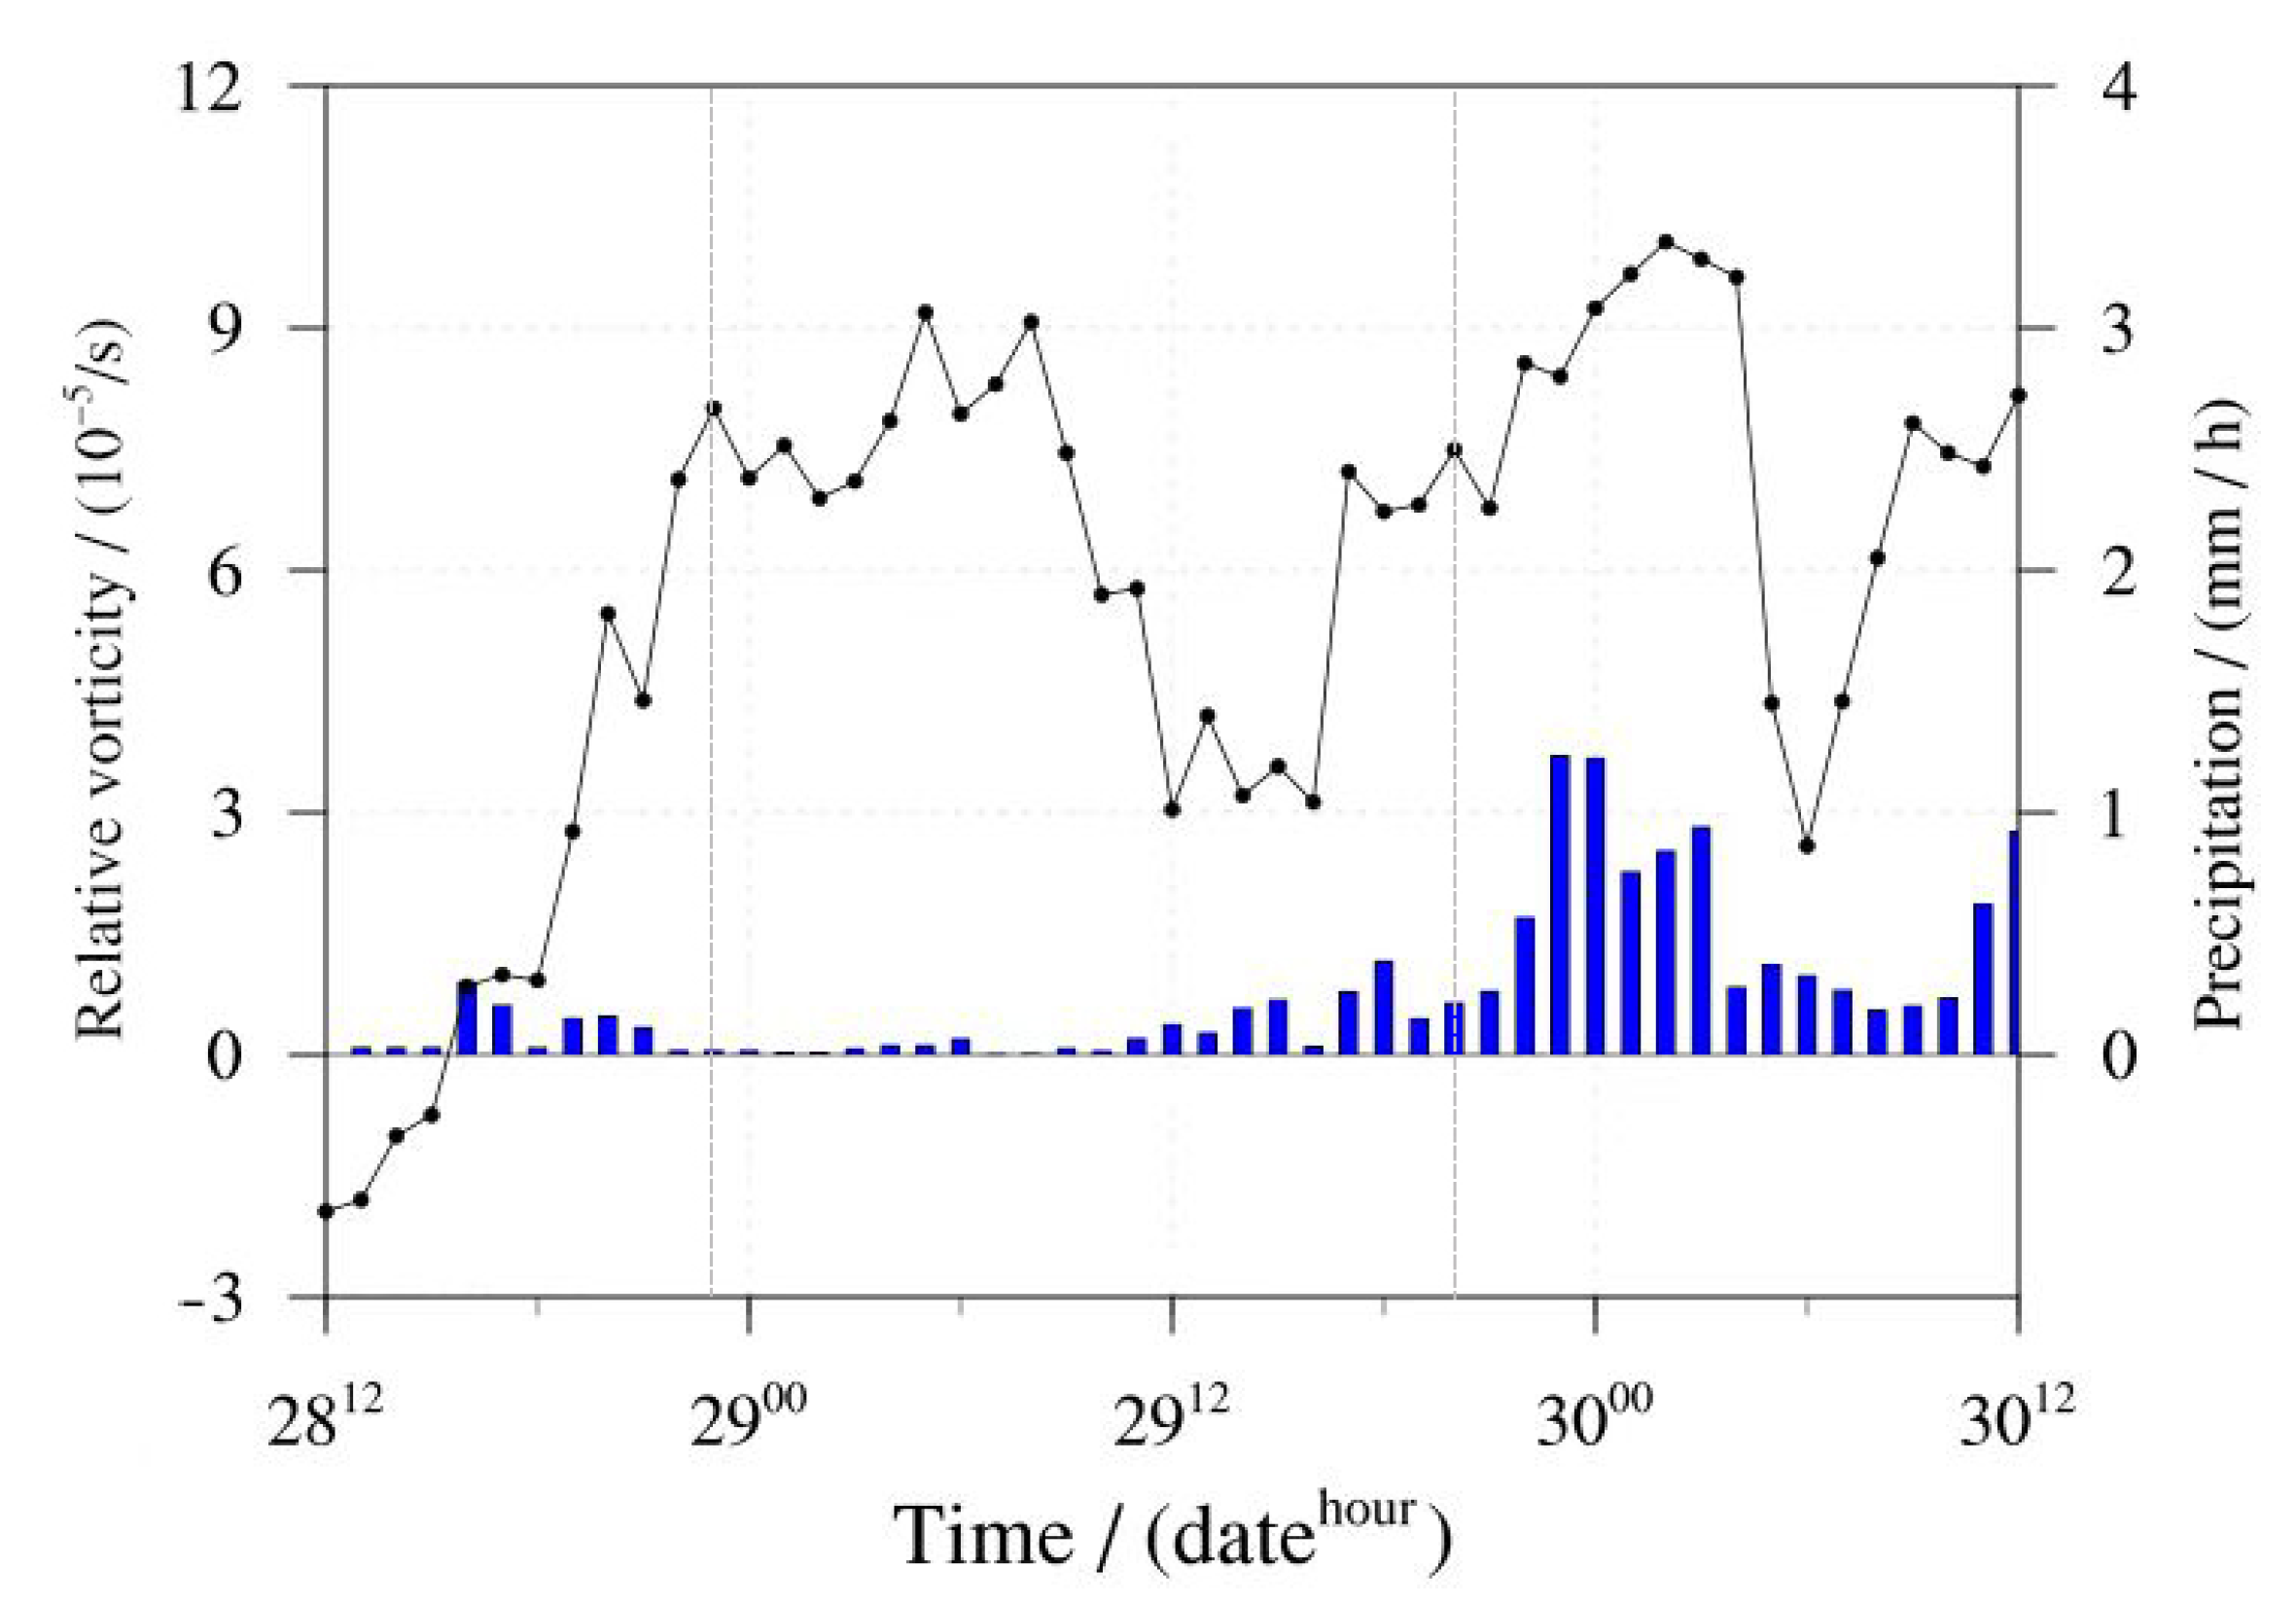
Considering that precipitation occurs mainly to the southeast of the TPV, Figure 4 shows the temporal evolution of precipitation (bars) averaged in the red-boxed in Figure 3, also the vorticity (lines) averaged within a 2° × 2° grid near the TPV center in 500 hPa. In the generation stage, weak rainfall is produced near the TPV, accompanied by a rapid increase in relative vorticity. Then, during the development stage (23:00 on 28 June), the vorticity achieves its maximum strength and sustains until 08:00 on 29 June, but less rainfall is generated. Subsequently, the precipitation gradually increases, accompanied by further strengthening in the vorticity. In the pre-moving-off stage (23:00 on 29 June), the rainfall and vorticity peak in sequence. From 04:00 to 06:00 on 30 June, the vorticity rapidly weakens as the TPV moves out of the TP. In general, three rapid growth stages are in the development of vorticity, and the first two may be involved with the latent heat of condensation released by precipitation.

Figure 4.
Time series of the 500 hPa relative vorticity averaged over the 2° × 2° grid surrounding the TPV center (lines, unit: 10−5 s−1), and precipitation averaged over the area shown in the red box in Figure 3 (bars, unit: mm·h−1) from 12:00 on 28 to 12:00 on 30 June 2016 (the gray dashed line is the boundary of the three stages).
4. Effects of Diabatic Heating on TPV in Different Stages
The generation and development of the TPV are closely related to the thermal forcing over the TP. This section will focus on the role of the atmospheric heat source in the TPV during the three different stages.
4.1. Potential Vorticity Tendency Equation Diagnosis
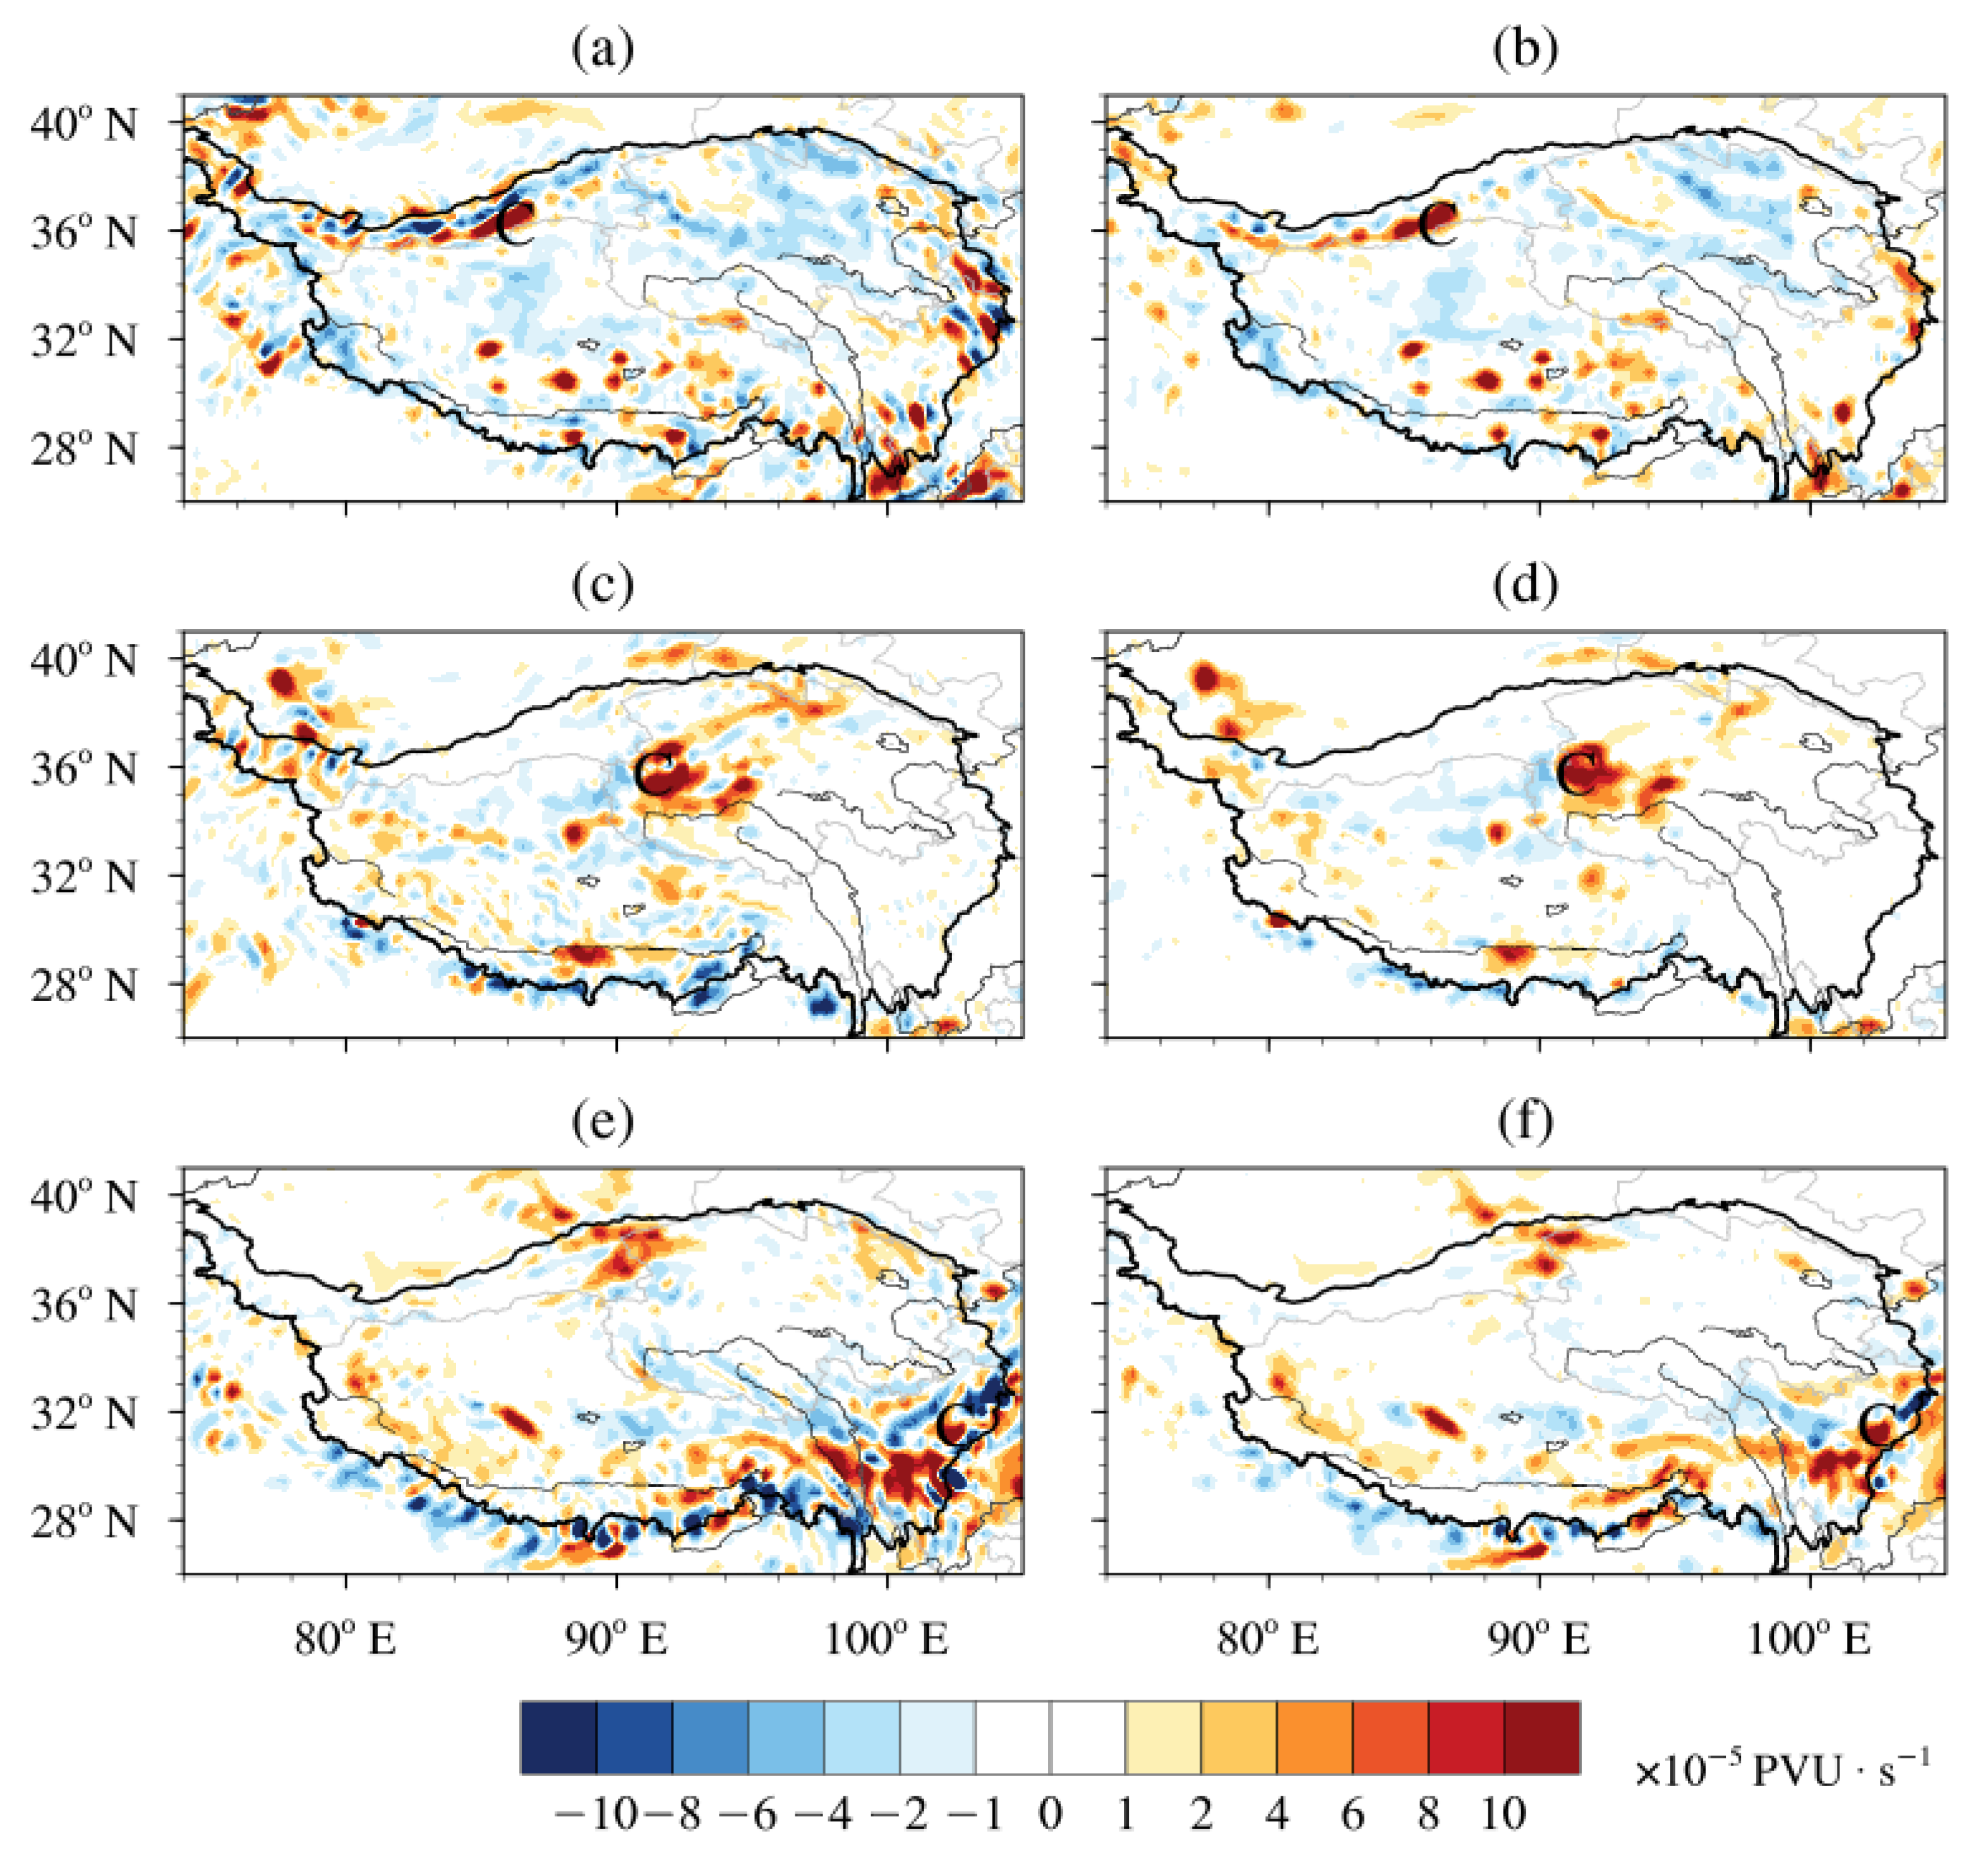
PV reflects the thermodynamic and dynamic properties of the atmosphere, which can more comprehensively describe the occurrence and development of the TPV. The change of PV is mainly caused by diabatic heating (Equation (1)). Figure 5 shows the spatial distribution of the total PV change and PV change induced by the vertical gradient of diabatic heating (PV1) at 500 hPa in the three stages of the TPV.
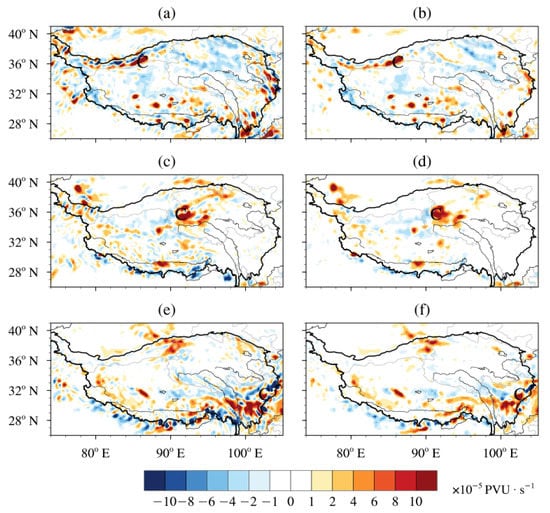
Figure 5.
Distribution of the 500 hPa PV change (a,c,e) and PV change caused by the vertical gradient of diabatic heating (PV1) (b,d,f) in the generation stage ((a,b): 16:00 on 28 June), development stage ((c,d): 08:00 on 29 June) and pre-moving-off stage ((e,f): 06:00 on 30 June) of the TPV (unit: 10−5 PVU·s−1; “C” represents the TPV center).
It can be seen that positive changes in PV exist near the TPV during the three stages. And the peaks of the PV occur in the development stage (Figure 5c), while it is relatively scattered in the pre-moving-off stage (Figure 5e). The magnitude and horizontal distribution characteristics of PV1 (Figure 5b,d,f) show that the distribution of PV1 is very similar to the total PV changes in three different stages, indicating that PV1 is the main contributor to the PV variation, while the contribution of PV2 is not apparent (figure omitted).
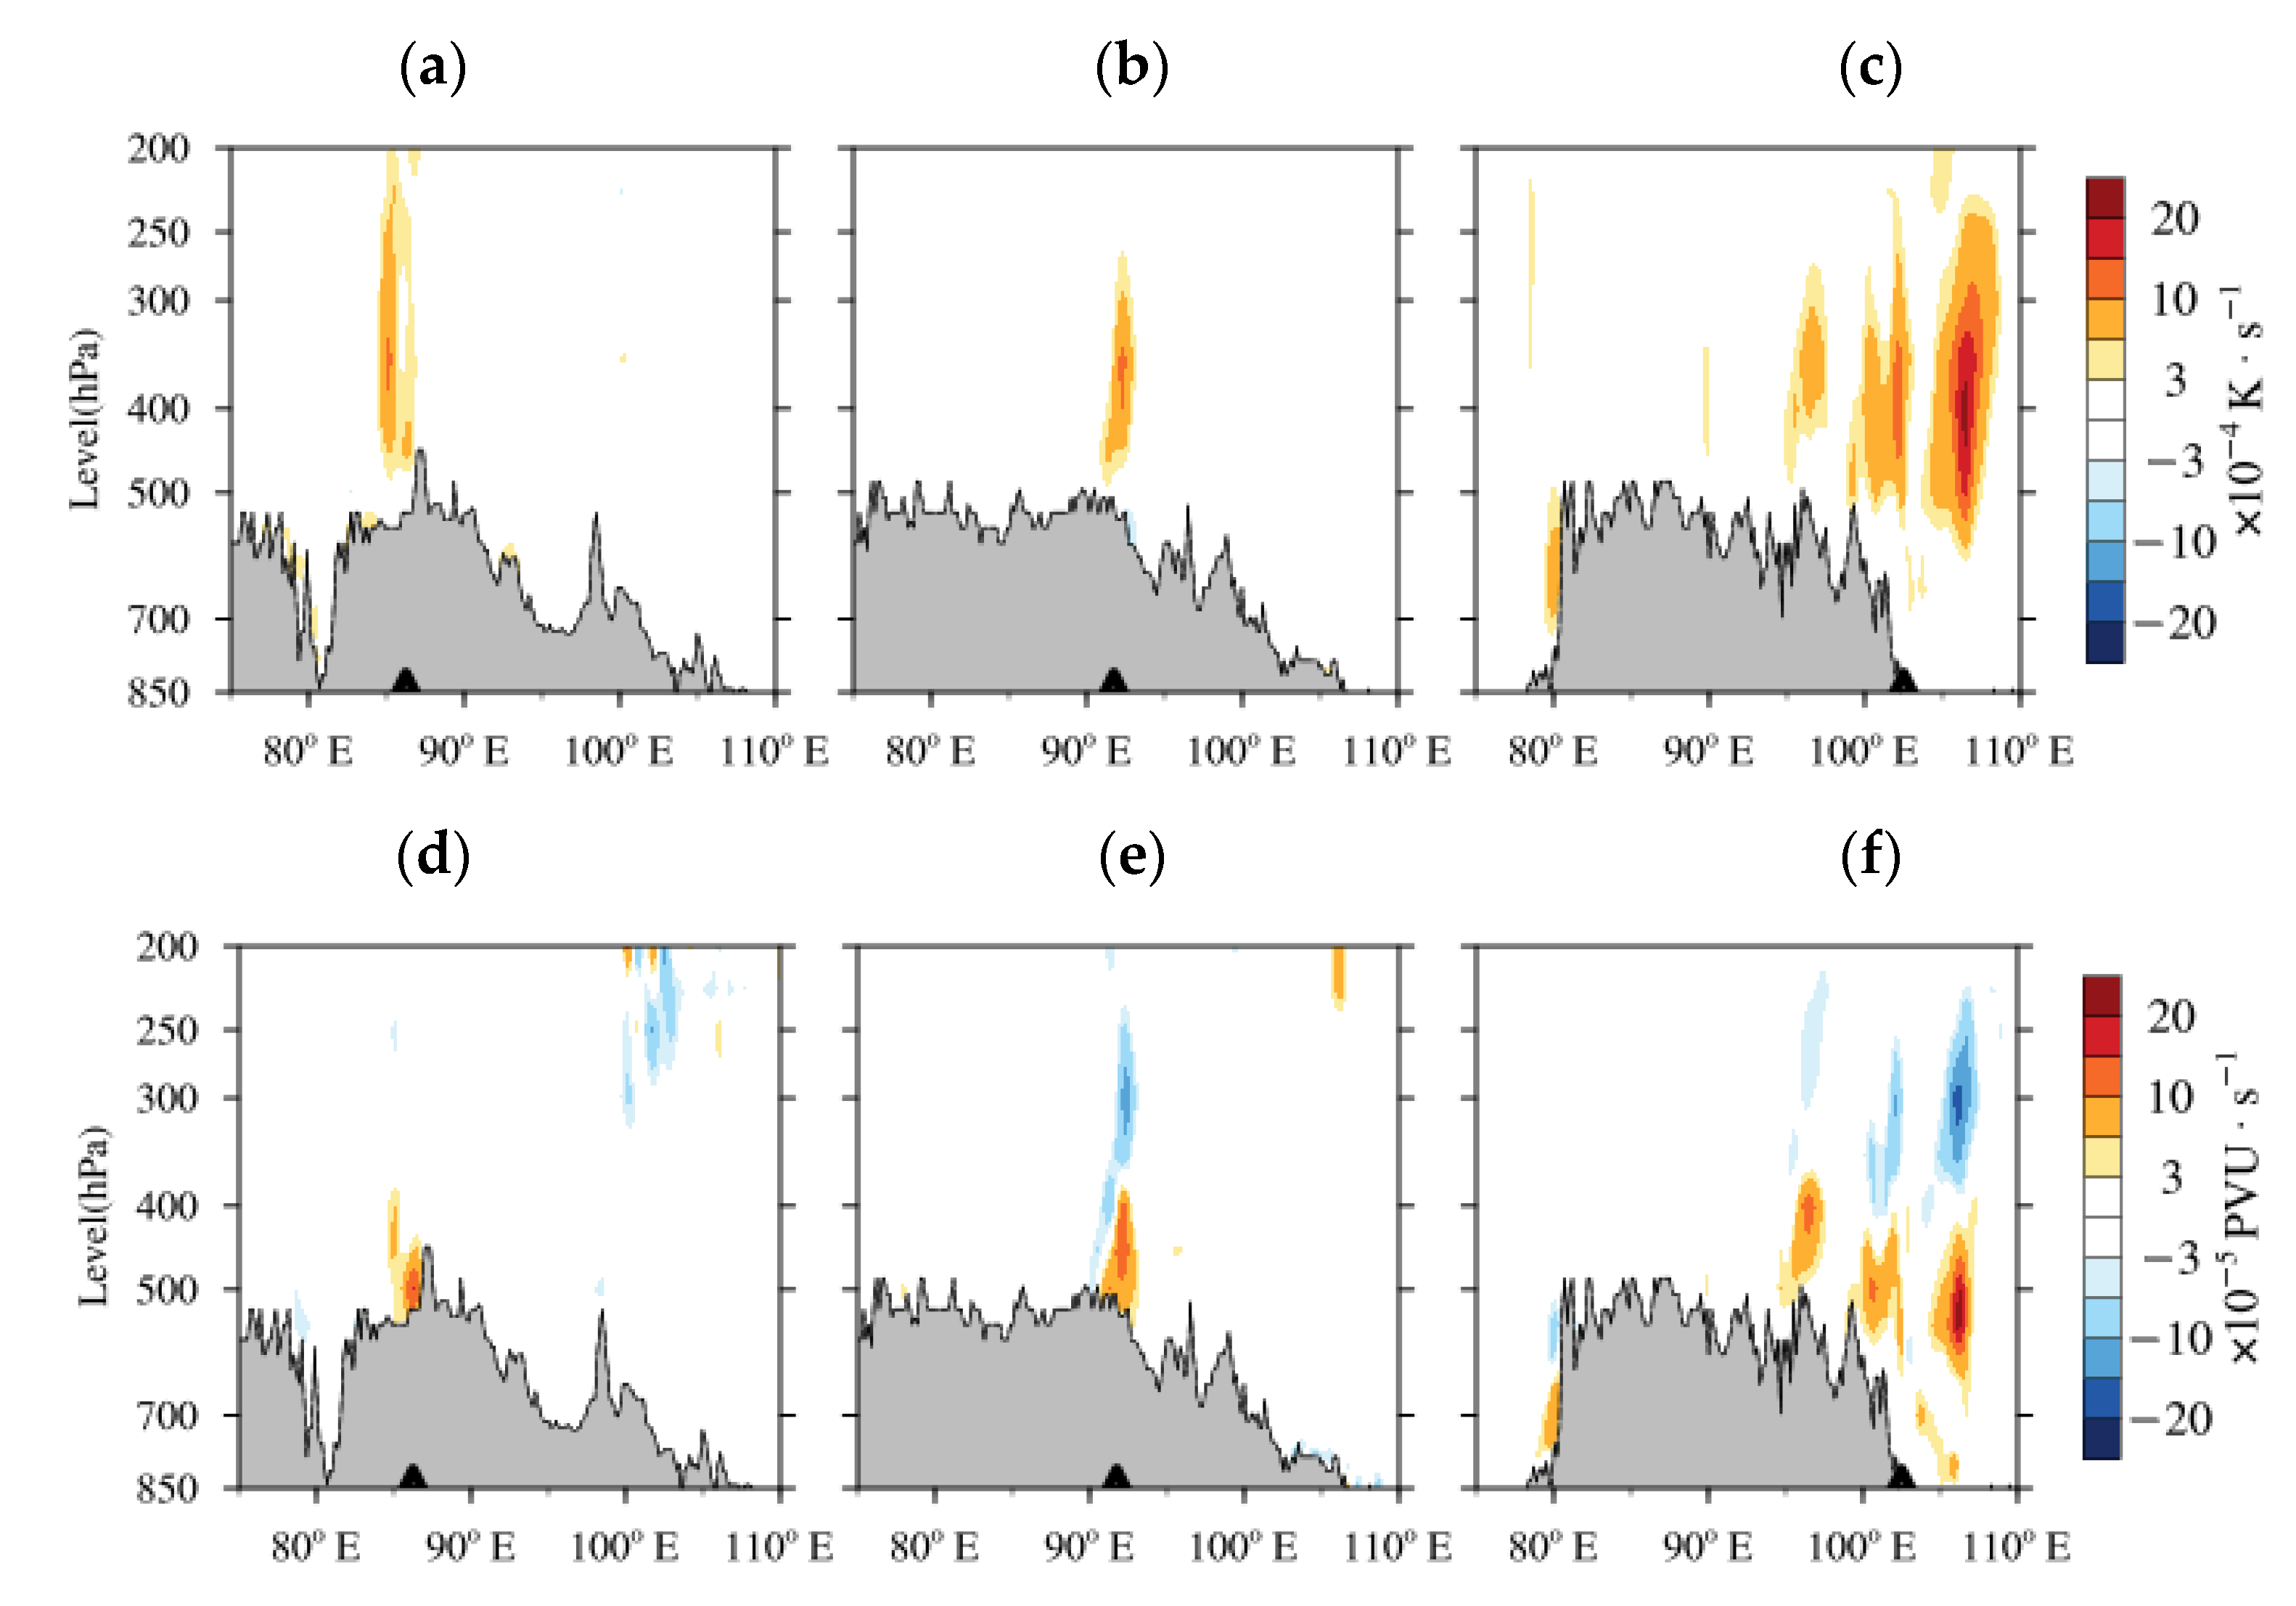
Figure 6 presents the longitude–altitude profile of the diabatic heating and PV1 along the TPV center. In the generation stage, positive diabatic heating exists around the TPV center with a maximum near 350 hPa (Figure 6a), but the PV is weak at this stage (Figure 6d). In the development stage, diabatic heating mainly appears below 300 hPa with no marked changes in value and a maximum center; resulting in a large vertical gradient and further forming a positive PV1 area below 350 hPa, and a negative PV1 area above 350 hPa (Figure 6e), according to Equation (1). And this favors to the development of low-level cyclonic circulation and high-level anticyclonic circulation, favoring the development and enhancement of the TPV to some extent. In the pre-moving-off stage (Figure 6c,f), the diabatic heating over the TP obviously enhanced, corresponding to the stronger PV1 at a lower and higher level. At this stage, the maximum of diabatic heating is mainly located at the eastern part of the TP (105° E–110° E). Therefore, the diabatic heating has a great influence on the intensity and moving direction of the PV [28], which is also favorable for the TPV developing and moving eastward out of the TP.
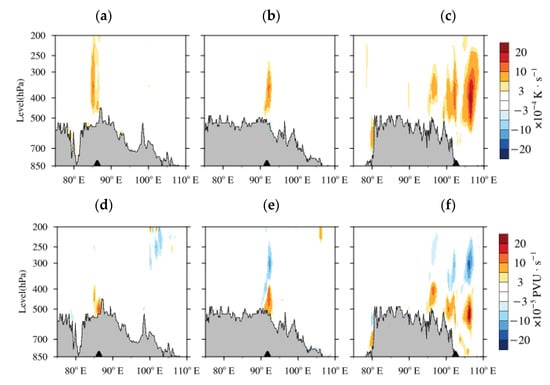
Figure 6.
Vertical cross-sections of diabatic heating (Q) ((a–c), unit: 10−4 K·s−1) and PV1 ((d–f), unit: 10−5 PVU·s−1) along the TPV center in the generation stage ((a,d): 16:00 on 28 June), development stage ((b,e): 08:00 on 29 June) and pre-moving-off stage ((c,f): 06:00 on 30 June) of the TPV (the triangle represents the position of the TPV center).
4.2. Effects of Q1 and Q2 on the TPV
Atmospheric diabatic heating, including apparent heat source and apparent water vapor sink, has important influences on the development and movement of the TPV. Here we further examine the specific effects of these two components of the diabatic heating on the evolution of the TPV, and compare their relative contributions.
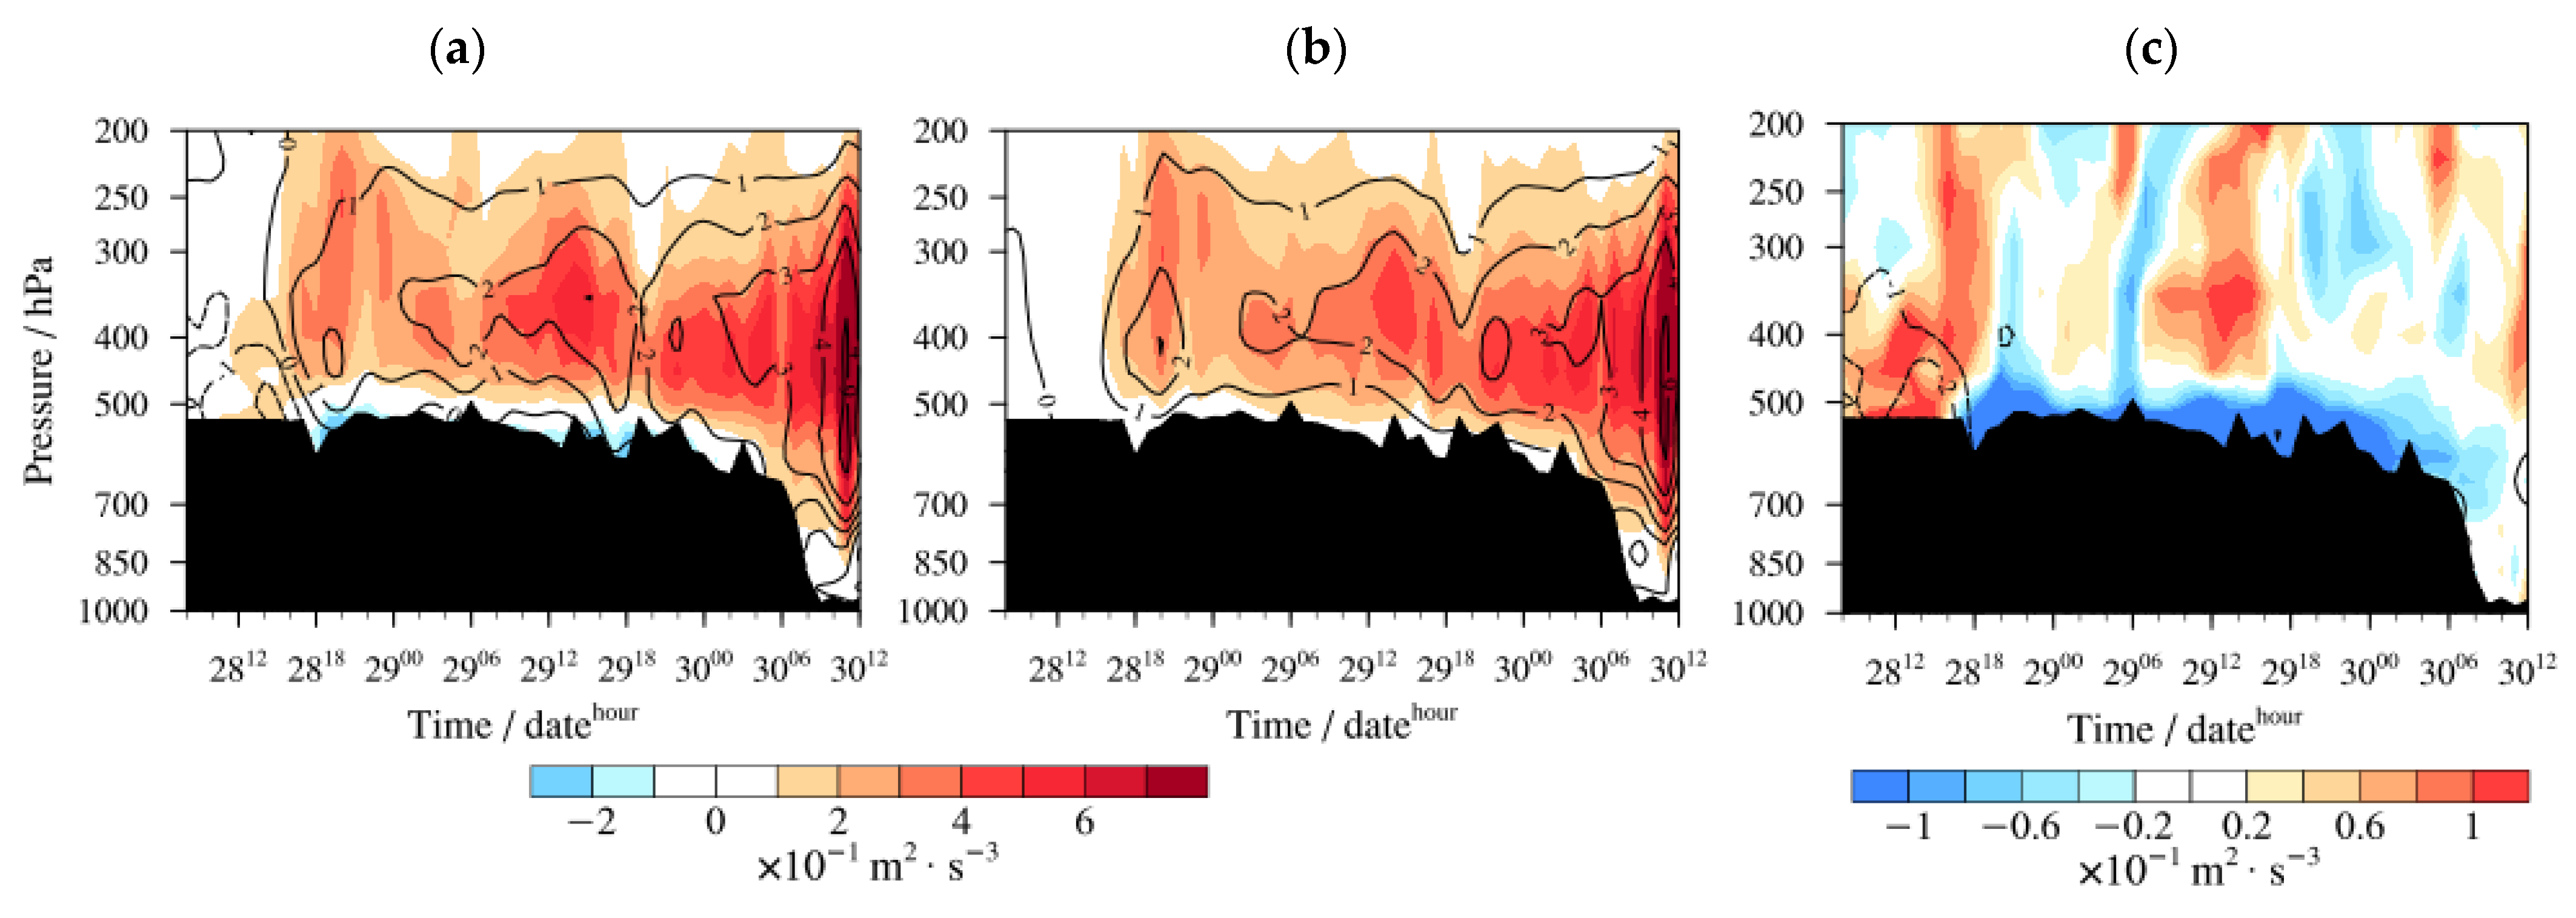
In Figure 7, it can be seen that both Q1 and Q2 are relatively weak in the generation stage. After that, Q1 and Q2 gradually increase with two maximum centers around 350 hPa, respectively (Figure 7a), which provide a favorable thermal condition for the rapid development of the TPV. Clearly, the distribution of the vertical transport terms of temperature () for Q1, and humidity () for Q2, is very similar to Q1 and Q2, respectively (Figure 7b). Meanwhile, the magnitude of the advection terms () is much smaller (figure omitted), indicating that the vertical transport term is the dominant contributor of Q1 and Q2.
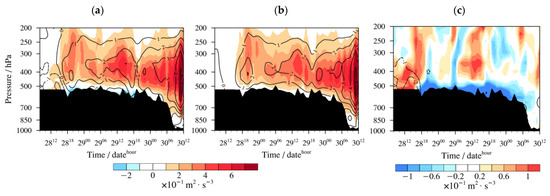
Figure 7.
Vertical time sections of apparent heat source (Q1, shadings, unit: 10−1 m2·s−3), apparent moisture sink (Q2, contours, unit: 10−1 m2·s−3) (a), the corresponding vertical transport term (b) and local variation term (c), averaged over the 2° × 2° grid surrounding the TPV center from 08:00 on 28 to 12:00 on 30 June 2016.
There is a large positive value of temperature local variation term (Figure 7c) at 400–500 hPa in generation stage comparing with that in the development stage and pre-moving-off stage. Importantly, this local positive temperature center occurs 1–3 h earlier than the generation of the TPV (16:00 on 28 June). Meanwhile, the local variation term of water vapor is negative, indicating that the evaporation is greater than the condensation at this time. Thus, the increase in local temperature is probably due to surface sensible heating instead of the latent heat of condensation. Additionally, the local variation of near-surface temperature is negative after 00:00 on 29 June (Figure 7c), while the lower atmosphere is relatively cold (Figure 8). This may be due to precipitation and development of the convective cloud system [29,30], which leads to the decrease in net radiation and the reduction in surface temperature.
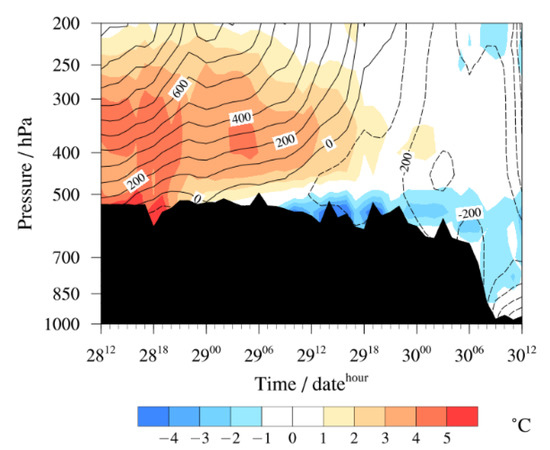
Figure 8.
Vertical time sections of zonal deviation of temperature (shading, unit: K) and geopotential height (contours, unit: gpm) in the TPV center from 12:00 on 28 to 12:00 on 30 June 2016.
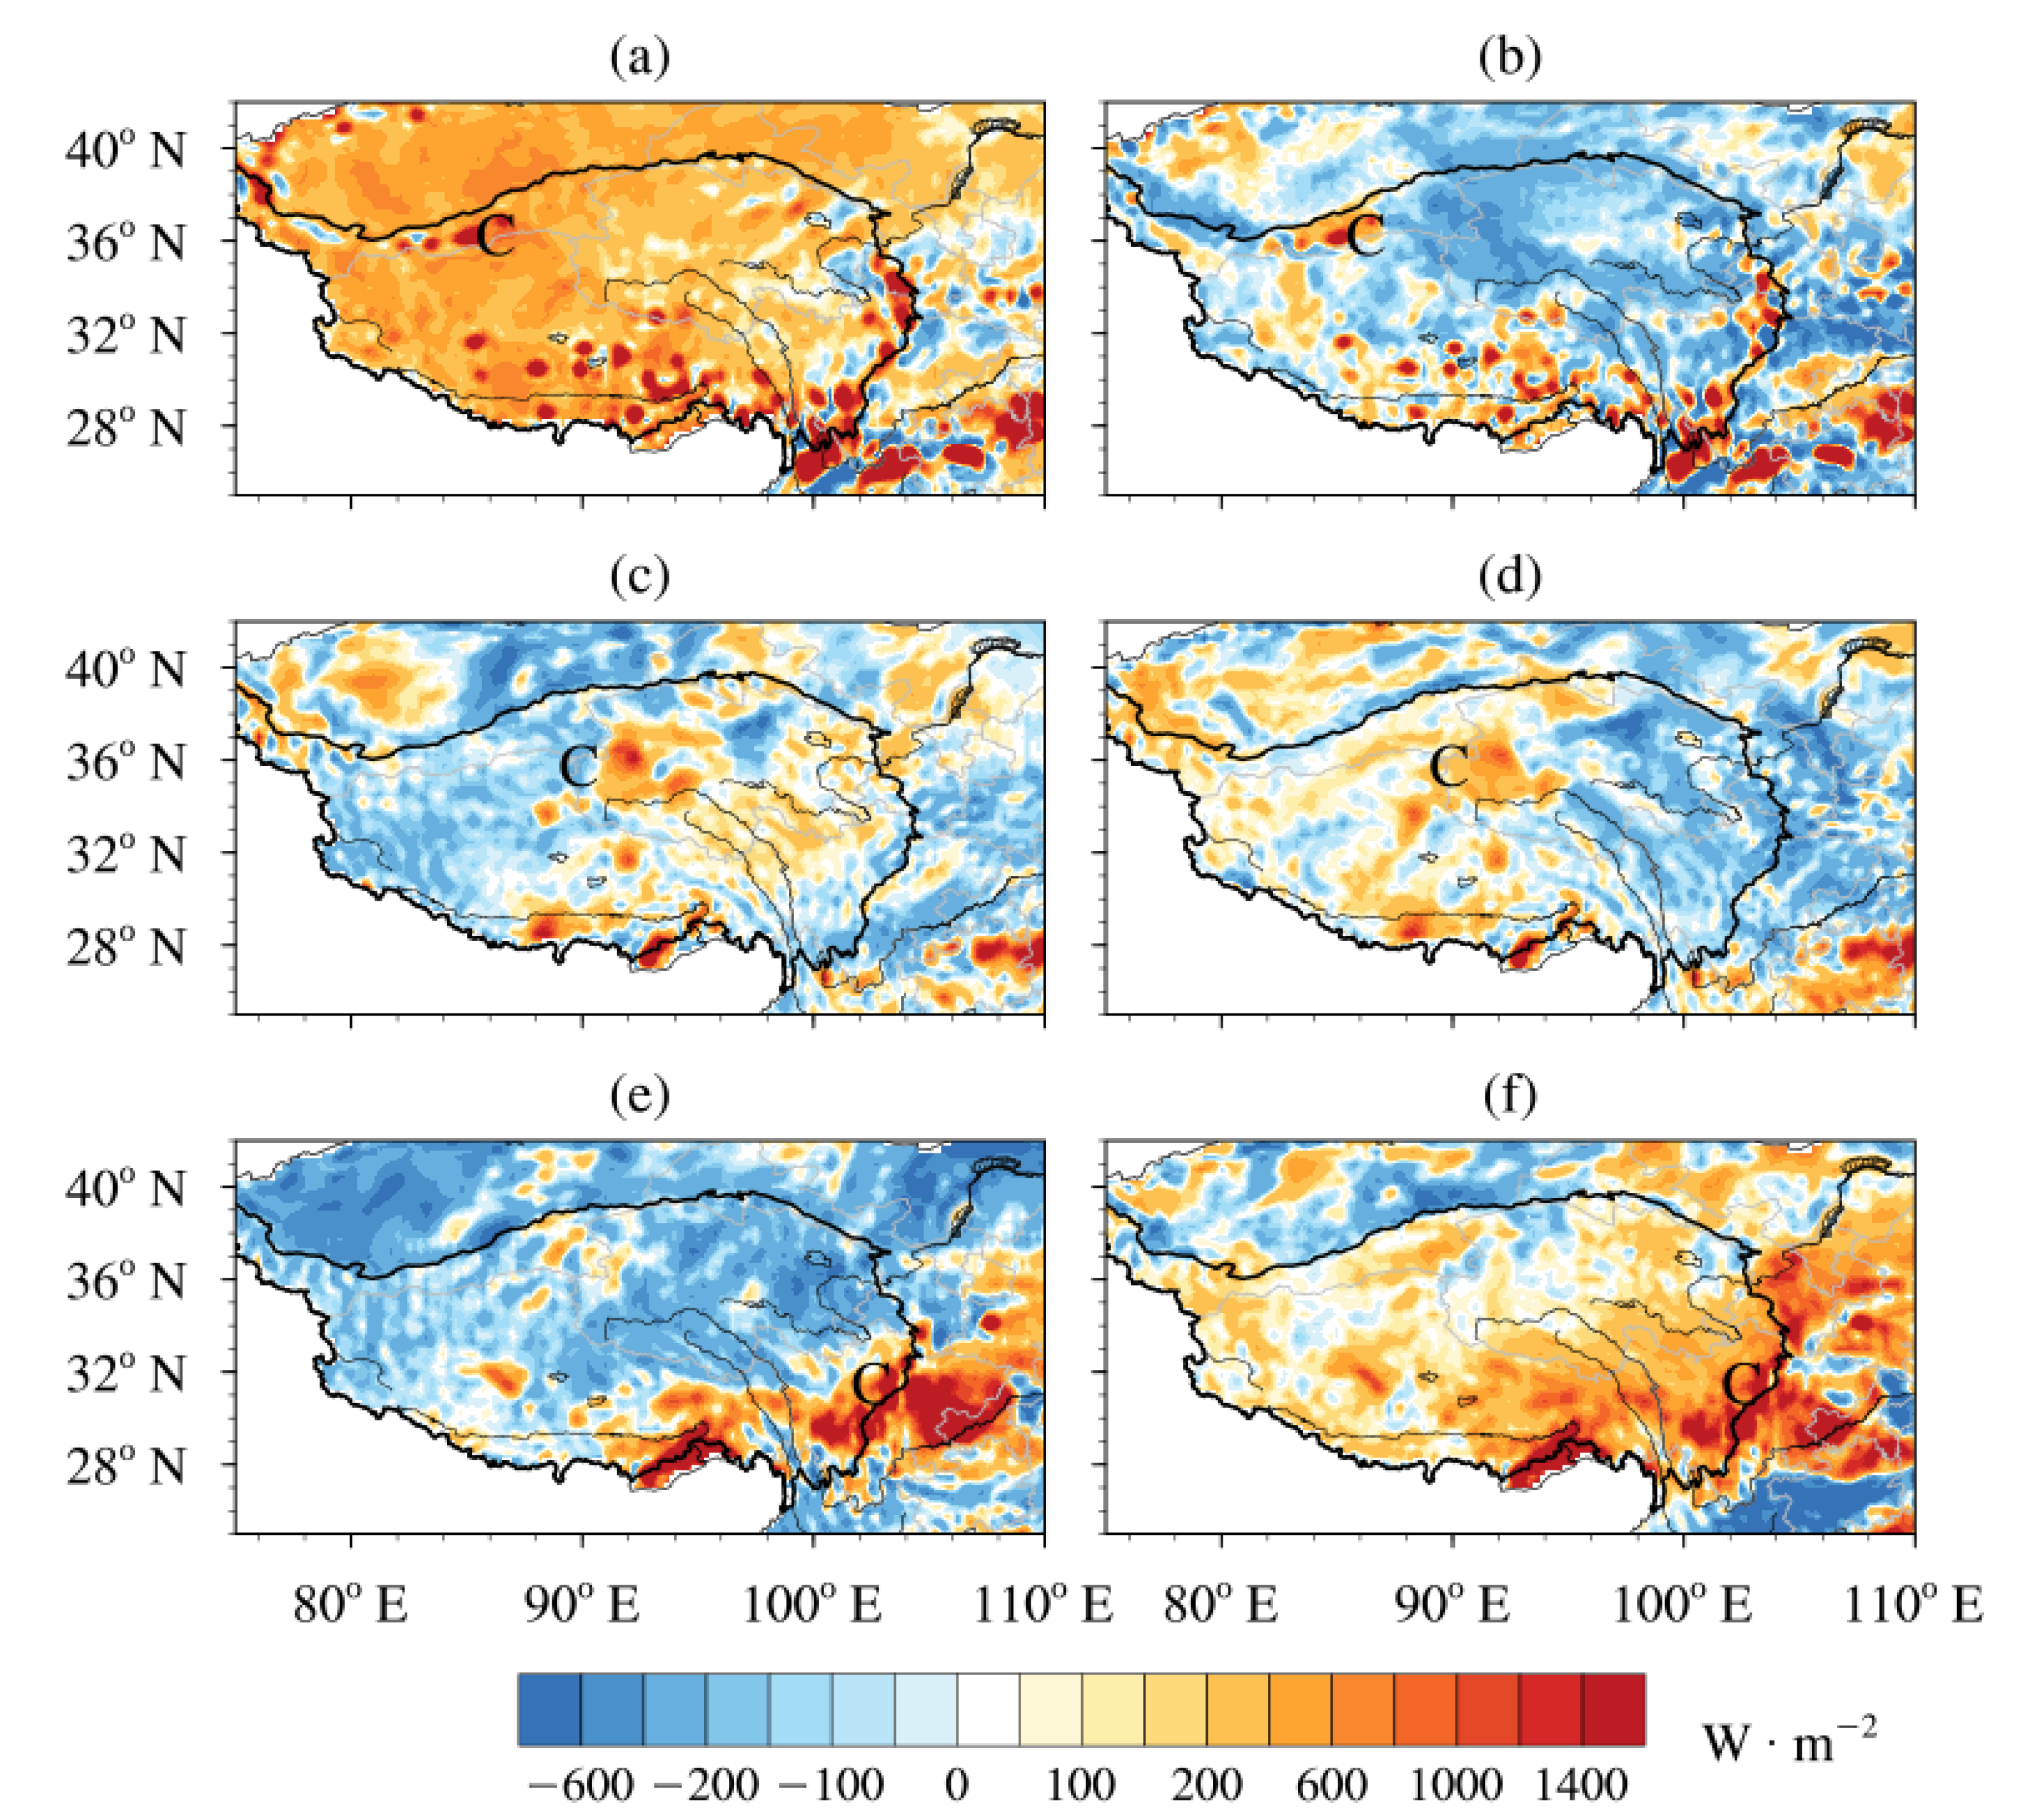
Figure 9 shows the distributions of the vertically integrated atmospheric apparent heat source <Q1> and apparent moisture sink <Q2> during these three stages. In the generation stage, <Q1> is positive on the whole TP (Figure 9a), while <Q2> is negative in most areas of the TP, except the region near the TPV (Figure 9b). In general, <Q1> is composed of surface sensible heating, latent heat of condensation and radiation heating, of which radiation heating is of little importance. At the same time, <Q2> mainly reflects the role of latent heat of condensation. Therefore, the surface sensible heating is the main contribution term of <Q1> at this first stage. In the development stage and pre-moving-off stage, the center of <Q1> is located to the east of the TPV center and is significantly enhanced (Figure 9c,e). The distribution of <Q2> is similar to <Q1>, but with bigger positive area expands significantly, indicating that the latent heating term is the main contribution of the atmospheric heat source after the TPV being formed and becoming stronger.
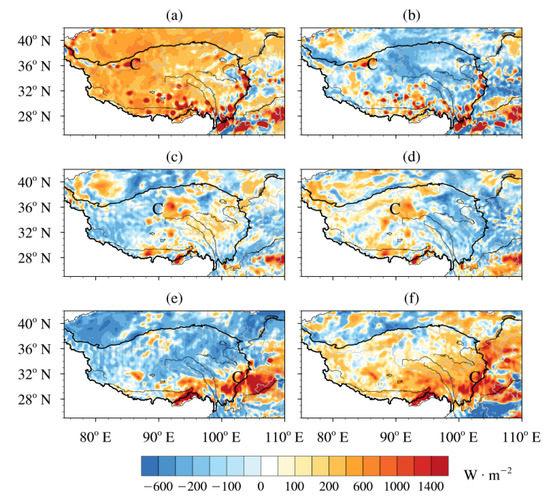
Figure 9.
Distribution of apparent heat source <Q1> (a,c,e) and apparent moisture sink <Q2> (b,d,f) in the generation stage ((a,b): 16:00 on 28 June), development stage ((c,d): 08:00 on 29 June) and pre-moving-off stage ((e,f): 06:00 on 30 June) (unit: W·m−2; “C” represents the TPV center).
The regional averaged <Q1>, <Q2> and quantitative comparisons of their contributions to TPV in the three stages are shown in Table 2. In the generation stage, <Q1> is three times larger than <Q2>. As the TPV moves eastward, a marked increase in <Q2> is noted. In the next two stages, <Q2> is comparable to <Q1>, both reaching more than 1200 W m−2 in the pre-moving-off stage. It is worth noting that the surface sensible heating is primarily accountable for the high value of the <Q1> in the first stage, favoring the TPV genesis. However, in the latter two stages, the latent heat of condensation becomes the dominant heating term as it gradually strengthened, playing a key role in the development and enhancement of the TPV.
Table 2.
The intensity of atmosphere apparent heat source <Q1> and apparent moisture sink <Q2> averaged over the 2° × 2° grid surrounding the TPV center at different stages (unit: W·m−2).
In summary, <Q1> is noticeably greater than <Q2> in the generation stage of the TPV. And the effect of surface sensible heating is the strongest in this stage, which weakens the stability of the atmosphere, and accumulates energy to trigger the generation of the TPV. In the development and pre-moving-off stages, latent heat of condensation gradually intensifies, becomes the dominant heating term, acting as a prime role in the development and enhancement of the TPV.
5. Conclusions and Discussion
A case study in June 2016 is conducted to investigate the characteristics of the TPV evolution during different growth stages and the impacts of atmospheric heat source in TPV development, using hourly ERA5 reanalysis, black body temperature (TBB) obtained from the Fengyun-2E (FY-2E) satellite, and precipitation amount from the Tropical Rainfall Measurement Mission (TRMM). The main conclusions can be summarized as follows:
- (1)
- The evolution of TPV can be divided into three stages, including the generation, development and pre-moving-off stages. The TPV intensity fluctuates throughout its evolution, with vorticity intensification during the nights of 28 and 29 June, respectively. The TPV is weak and shallow in the generation stage, strongest in the development stage, and deepest in the pre-moving-off stage. The moving speed of the TPV gets enhanced gradually with its development, while the highest speed appearing at the downhill terrain in the eastern part of the TP.
- (2)
- The vertical gradient of diabatic heating is the main factor causing the development of the TPV, i.e., a positive (negative) potential vorticity is produced below (above) the height where the maximum center of diabatic heating is situated; strengthening the low-level cyclonic circulation and high-level anticyclonic circulation, further favoring the development of the TPV.
- (3)
- The generation of the TPV is related to the surface warming center driven by surface sensible heating. After TPV generation, the development and enhancement of the TPV is primarily dependent on the latent heat of condensation, and further analysis suggests that the vertical transport of the water vapor is the main contributor to latent heat of condensation, thus promoting the development of the TPV.
In this study, the evolution of the TPV over the TP is divided into three stages by using high-resolution data, deepening the understanding of TPV evolution processes and characteristics. Also, the critical roles of vertical structures and atmospheric heat source in different stages are examined, as well as the relative contribution of surface sensible heating and the latent heat of condensation to the TPV at different stages. Evidently, the present work is different from Wu et al. [15], which is mainly focus on the investigation of different TPV cases and different stages.
One should note that the results in this work are obtained from an individual case study. More cases are still needed to enrich the mechanistic theory of TPV formation and development. Here we selected the period when TPV was targeted on TP for discussion. The evolutionary features of TPV moving out of TP and its relationship with the atmospheric heat source remain to be explored.
Author Contributions
Methodology, S.Z. (Shu Zhou) and S.Z. (Shunwu Zhou); data curation, S.Z. (Shu Zhou), F.S. and Y.Q.; writing—original draft preparation, S.Z. (Shu Zhou); writing—review and editing, M.W. All authors have read and agreed to the published version of the manuscript.
Funding
This research was funded by the National Key R&D Program of China (Grant No. 2018YFC1505705) and the National Natural Science Foundation of China (Key Program) (Grant No. 42030611; 42165005; 41605039).
Institutional Review Board Statement
Not applicable.
Informed Consent Statement
Not applicable.
Data Availability Statement
Data sources are mentioned in the text, and the database that was built during this work is available from the authors.
Conflicts of Interest
The authors declare no conflict of interest.
References
- Li, L.; Zhang, R.H.; Wen, M. Genesis of southwest vortices and its relation to Tibetan Plateau vortices. Q. J. R. Meteorol. Soc. 2017, 143, 2556–2566. [Google Scholar] [CrossRef]
- Ye, D.Z. Some Characteristics of the Summer Circulation over the Qinghai-Xizang (Tibet) Plateau and Its Neighborhood. Bull. Amer. Meteor. Soc. 1981, 62, 14–19. [Google Scholar] [CrossRef]
- Yu, S.H.; Gao, W.L. Characteristics of surface land heating in the Qinghai-Tibetan Plateau vortex source regions along with the departure Plateau Vortex and non-departure Plateau Vortex. Plateau Meteor. 2019, 38, 299–313. (In Chinese) [Google Scholar] [CrossRef]
- He, G.B.; Gao, W.L.; Tu, N.N. The dynamic diagnosis on eastwards moving characteristics and developing mechanism of two Tibetan Plateau vortex processes. Acta. Meteor. Sin. 2009, 67, 599–612. (In Chinese) [Google Scholar] [CrossRef]
- Luo, S.W.; He, M.L.; Liu, X.D. Study on the Vortex of the Qinghai-Xizang (Tibet) Plateau in Summe. Sci. China Ser. B 1994, 37, 601–612. [Google Scholar] [CrossRef]
- Curio, J.; Schiemannm, R.; Hodges, K.I.; Turner, A.G. Climatology of Tibetan Plateau Vortices in Reanalysis Data and a High-Resolution Global Climate Model. J. Clim. 2019, 32, 1933–1950. [Google Scholar] [CrossRef]
- In Collaboration Group for Low Pressure Systems in Tibetan Plateau. A Preliminary study on the occurrence and development of the Tibetan Plateau vortex in midsummer. Sci. Sinica 1978, 8, 341–350. (In Chinese) [Google Scholar] [CrossRef]
- Liu, Y.F.; Li, G.P. Climatic characteristics of atmospheric heat source over the Tibetan Plateau and its possible relationship with generation of the Tibetan Plateau vortex in the summer. Chin. J. Atmos. Sci. 2016, 40, 864–876. (In Chinese) [Google Scholar] [CrossRef]
- Luo, H.B.; Yanai, M. The large-scale circulation and heat sources over the Tibetan Plateau and surrounding areas during the early summer of 1979. Part II: Heat and moisture budgets. Mon. Weather Rev. 1984, 112, 966–989. [Google Scholar] [CrossRef]
- Ueda, H.; Kamahori, H.; Yamazaki, N. Seasonal contrasting features of heat and moisture budgets between the eastern and western Tibetan Plateau during the GAME IOP. J. Clim. 2003, 16, 2309–2324. [Google Scholar] [CrossRef]
- Li, G.P.; Lu, H.G.; Huang, C.H.; Fan, Y.; Zhang, B. A Climatology of the Surface Heat Source on the Tibetan Plateau in Summer and Its Impacts on the Formation of the Tibetan Plateau Vortex. Chin. J. Atmos. Sci. 2016, 40, 131–141. (In Chinese) [Google Scholar] [CrossRef]
- Shen, R.J.; Reiter, E.R.; Bresch, J.F. Some Aspects of the Effects of Sensible Heating on the Development of Summer Weather Systems over the Tibetan Plateau. J. Atmos. Sci. 1986, 43, 2241–2260. [Google Scholar] [CrossRef]
- Dell’osso, L.D.; Chen, S.J. Numerical experiments on the genesis of vortices over the Qinghai-Tibet plateau. Tellus A 1986, 38, 236–250. [Google Scholar] [CrossRef]
- Zhang, F.; Wang, C.; Pu, Z. Genesis of Tibetan Plateau Vortex: Roles of Surface Diabatic and Atmospheric Condensational Latent Heating. J. Appl. Meteor. Climatol. 2019, 58, 2633–2651. [Google Scholar] [CrossRef]
- Wu, D.; Zhang, F.M.; Wang, C.H. Impacts of diabatic heating on the genesis and development of an inner Tibetan Plateau vortex. J. Geophys. Res. 2018, 123, 11691–11704. [Google Scholar] [CrossRef]
- Tian, S.R.; Duan, A.M.; Wang, Z.Q.; Gong, Y.F. Interaction of Surface Heating, the Tibetan Plateau Vortex, and a Convective System: A Case Study. Chin. J. Atmos. Sci. 2015, 39, 125–136. (In Chinese) [Google Scholar] [CrossRef]
- Li, L.; Zhang, R.H.; Wen, M.; Liu, L.K. Effect of the atmospheric heat source on the development and eastward movement of the Tibetan Plateau vortices. Tellus Ser. A Dyn. Meteor. Oceanogr. 2014, 66, 24451. [Google Scholar] [CrossRef] [Green Version]
- Dong, Y.C.; Li, G.P. A Preliminary Study on the Role Played by Latent Heating During the Different Periods of the Tibetan Plateau Vortex’s Eastward Movement and Development. J. Chengdu Univ. Inf. Technol. 2014, 29, 400–407. [Google Scholar] [CrossRef]
- Ma, T.; Liu, Y.M.; Wu, G.X.; Mao, J.Y.; Zhang, G.S. Effect of Potential Vorticity on the Formation, Development, and Eastward Movement of a Tibetan Plateau Vortex and Its Influence on Downstream Precipitatiion. Chin. J. Atmos. Sci. 2020, 44, 472–486. (In Chinese) [Google Scholar] [CrossRef]
- Hersbach, H.; Bell, B.; Berrisford, P.; Hirahara, S. The ERA5 global reanalysis. Quart. J. Roy. Meteor. Soc. 2020, 146, 1999–2048. [Google Scholar] [CrossRef]
- Huffman, G.J.; Bolvin, D.T.; Nelkin, E.J.; Wolff, D.B.; Adler, R.F.; Gu, G.J.; Hong, Y.; Bowman, K.P.; Stocker, E.F. The TRMM multisatellite precipitation analysis (TMPA): Quasi-global, multiyear, combined-sensor precipitation estimates at fine scales. J. Hydrometeorl. 2007, 8, 38–55. [Google Scholar] [CrossRef]
- Lin, Z.Q.; Guo, W.D.; Jia, L.; Yao, X.P.; Zhou, Z.B. Climatology of Tibetan Plateau vortices derived from multiple reanalysis datasets. Clim. Dyn. 2020, 55, 2237–2252. [Google Scholar] [CrossRef]
- Lin, Z.Q. An objective analysis if the Tibetan Plateau vortexes based on the ERA-interim reanalysis data: 1979-2013. Acta. Meteor. Sin. 2015, 73, 925–939. (In Chinese) [Google Scholar] [CrossRef]
- Ertel, H. Ein neuer hydrodynamischer Wirbelsatz. Meteor. Z. 1942, 59, 271–281. [Google Scholar]
- Yanai, M.; Esbensen, S.; Chu, J.H. Determination of bulk properties of tropical cloud clusters from large-scale heat and moisture budgets. J. Atmos. Sci. 1973, 30, 611–627. [Google Scholar] [CrossRef]
- Feng, X.Y.; Liu, C.H.; Rasmussen, R.; Fan, G.Z. A 10-yr climatology of Tibetan Plateau vortices with NCEP Climate Forecast System reanalysis. J. Appl. Meteor. Climatol. 2014, 53, 34–46. [Google Scholar] [CrossRef]
- Li, L.; Zhang, R.H.; Wen, M. Diurnal variation in the occurrence frequency of the Tibetan Plateau vortices. Meteor. Atmos. Phys. 2014, 125, 135–144. [Google Scholar] [CrossRef]
- Li, L.; Zhang, R.H.; Wen, M. Diagnostic analysis of the evolution mechanism for a vortex over the Tibetan Plateau in June 2008. Adv. Atmos. Sci. 2011, 28, 797–808. [Google Scholar] [CrossRef]
- Shou, Y.X.; Lu, F.; Liu, H.; Cui, P.; Shou, S.W.; Liu, J. Satellite-based Observational Study of the Tibetan Plateau Vortex: Features of Deep Convective Cloud Tops. Adv. Atmos. Sci. 2019, 36, 189–205. [Google Scholar] [CrossRef]
- Li, L.; Zhang, R.H.; Wu, P.L.; Wen, M.; Li, B. Characteristics of convections associated with the Tibetan Plateau vortices based on geostationary satellite data. Int. J. Climatol. 2020, 40, 4876–4887. [Google Scholar] [CrossRef]


Publisher’s Note: MDPI stays neutral with regard to jurisdictional claims in published maps and institutional affiliations. |
© 2022 by the authors. Licensee MDPI, Basel, Switzerland. This article is an open access article distributed under the terms and conditions of the Creative Commons Attribution (CC BY) license (https://creativecommons.org/licenses/by/4.0/).