Abstract
In August-September 2021, the western Pacific subtropical high (WPSH) showed significant anomalies, with some areas between the Yangtze and Yellow River basins in China suffering from heavy rainfall and flooding, while extreme heat occurred in Southern China. Using the 6 h reanalysis data of NCEP/NCAR and the daily precipitation observation data, this paper studied the abnormal characteristics and the thermal mechanism of the three-dimensional ridge of the WPSH during the seasonal transition from late summer to early autumn in August-September 2021, and explored its connection with the precipitation in the areas between the Yangtze and Yellow River basins in China during the same period. The results showed that, in August-September 2021, the three-dimensional ridge of the WPSH appeared to be southward at the lower troposphere and tilted northward with height. According to the diagnosis of the atmospheric heat source, it was found that the center of atmospheric cold source in the low latitudes at 850 hPa enhanced the surface high pressure, corresponding to the WPSH ridge shifting southward at the lower troposphere, which led to more water vapor convergence and more precipitation between the Yangtze and Yellow River basins. The latent heat of condensation released by the increased precipitation between the Yangtze and Yellow River basins in China heated the middle and upper troposphere, increasing the intensity of the high pressure in the upper troposphere, corresponding to the WPSH ridge northward at the upper troposphere. This anomalous tilt of the WPSH ridge in August-September 2021 and the intense precipitation processes between the Yangtze and Yellow River basins in China during the same period established a reciprocal feedback mechanism through diabatic heating. Further studies also showed that the anomalous tilt of the WPSH ridge is one of the important modes of its three-dimensional structural anomalies, and that, in years when the ridge tilts from south to north with height anomalously in August-September, the areas between the Yangtze and Yellow River basins are characterized by high precipitation.
1. Introduction
The western Pacific subtropical high (WPSH) is one of the key components of the East Asian monsoon system [1,2,3,4], and its variations in intensity, location, and spatial pattern have important effects on the East Asian summer climate [5,6,7]. Therefore, the study of changes in the intensity and location of the WPSH is still of great importance for China’s adaptation to climate change and disaster warning.
The WPSH is located in the middle and lower troposphere. The area bounded by the 588 dagpm contour at 500 hPa is the main area of the WPSH’s activities, and the 152 or 148 dagpm contour at 850 hPa is the characteristic contour of the WPSH at the lower troposphere [8]. A strong high-pressure system is formed at the upper troposphere and lower stratosphere in the Asia Pacific region during the summer months due to the thermal actions of the Tibetan and Iranian plateaus, with the center of the high pressure located mainly over South Asia, known as the South Asian high (SAH). The area bounded by the 1248 dagpm contour at 200 hPa is the main area of the SAH’s activities [9,10,11].
IPCC AR6 indicates that human activity signals are becoming clearer in global warming, and extreme events brought by climate change are becoming more frequent and more severe [12]. In the context of global warming, many studies have found that, since the end of the 1970s, the intensity of the WPSH has increased, and its western ridge point has shifted westward [13,14,15]. However, in recent years, some researchers have proposed a completely new view that the intensity of the WPSH has a weakening trend after removing the influence of the increase in geopotential height caused by climate change [16,17,18]. This stems from several physical facts. For the height field, the potential of the WPSH rises slowly compared with other regions [16]. For the vorticity field, there is a significant increase in positive relative vorticity in the lower troposphere of the region controlled by WPSH [17], which conflicts with the conclusion that the WPSH is strengthening. In order to eliminate the false signals caused by global warming, Jia et al. [19] took the horizontal circulation flow function R [20,21] decomposed from the three modes of global atmospheric circulation as an objective index to describe the interdecadal variations of the WPSH under global warming. It was found that the western ridge point of the WPSH moved westward slightly after the end of the 1970s, and there were no obvious interdecadal variations. Nie et al. [22] pointed out that the WPSH ridge basically oscillates around 25° N.
The formation and activities of the WPSH are associated with the diabatic heating around it. The horizontal and vertical nonuniform distribution of the diabatic heating affects the location and vertical structure of the WPSH ridge. The diabatic heating consists mainly of latent, sensible, and radiative heating. In particular, the heating from the latent heat of condensation released by precipitation is a key factor in determining the intensity and location of the WPSH during summer [23,24,25,26,27]. In turn, the intensity and location of the WPSH affect the summer precipitation in Eastern China. Tao [28] noted that the WPSH has two northward jumps from winter to summer, accompanied by the advance of the Chinese rainband from south to north [29,30]. After the 21st century, Gao et al. [31] pointed out through sliding correlation analysis that the correlation between the intensity of the WPSH and the intensity of the precipitation in the Yangtze River basin rapidly weakened, while the correlation with the precipitation in northern China changed from negative to positive. Nie et al. [22] showed that, when the WPSH is northward, water vapor is transported northward in large quantities, resulting in more rain in northern China and drought in the Yangtze River basin, whereas, when it is southward, the rainband shifts to Southern China.
At present, the studies on the circulation pattern of the WPSH and the mechanisms of its influence on the surrounding areas have been gradually improved, but its three-dimensional structure characteristics need to be paid more attention. Liu et al. [32] analyzed and compared the meridional deviation of the WPSH ridge, which indicated that the movement of the WPSH ridge shows a certain jumping. Subsequently, Song et al. [33] defined the east-west wind interface as a dynamic parameter representing the location of the WPSH ridge. It was found that the WPSH ridge in the northern hemisphere tends to tilt from north to south with increasing height in winter, while it tends to tilt from south to north in summer to the west of 180° E. Mao et al. [34] studied the changes in the shape and nature of the WPSH during the seasonal transition from late spring to early summer in the northern hemisphere, and they pointed out that not only does the position of the east-west wind interface, i.e., the ridge surface, shift significantly north-south, but the tilt direction of the WPSH ridge also changes with time. When the meridional temperature gradient near the WPSH ridge in the troposphere is less than zero, the pattern of the WPSH is the winter type. On the contrary, when the meridional temperature gradient is greater than zero, the structure is the summer type.
In August-September 2021, the WPSH showed significant anomalies, with some areas between the Yangtze and Yellow River basins in China suffering from heavy rainfall and flooding, while extreme heat occurred in Southern China. However, most of the existing studies about the WPSH anomalies focused on a single season such as winter or summer. Therefore, it is necessary to make a detailed analysis of the WPSH anomalies and its three-dimensional structure in the late summer and early autumn of 2021. In this study, statistical methods were used to study the intensity and location of the WPSH and the abnormal tilt characteristics of the WPSH ridge. Additionally, a diagnostic calculation based on the inversion algorithm of the atmospheric diabatic heating was also carried out to investigate the preliminary thermal causes of the anomalous three-dimensional structure of the WPSH ridge in August-September 2021, as well as the link between the WPSH ridge’s anomalous activities and the precipitation among the Yangtze and Yellow River basins in China during the same period.
2. Materials and Methods
2.1. Data
The following datasets were used in this study: (1) NCEP/NCAR 6 h reanalysis data Ⅱ, including geopotential height, air temperature, horizontal wind field, and vertical velocity, performed at 2.5° × 2.5° resolution and covering the period from 1 January 1991 to 31 December 2021, obtained from the National Centers for Environmental Prediction and National Centers for Atmospheric Research (NCEP/NCAR) reanalysis data [35]. The vertical levels range from 1000 hPa to 10 hPa, within 17 vertical levels; (2) daily mean precipitation data of 2437 stations in China from 1991 to 2021, obtained from China Meteorological Data Service Center [36]; (3) monthly mean area, intensity, ridge line position, and western ridge point index data of the WPSH at 500 hPa, obtained from China Meteorological Data Service Center [37].
2.2. Methods
In this paper, the latest 31 years (August-September from 1991 to 2021) were taken as the climatological state to study the anomalies and deviations for August–September 2021.
2.2.1. Diabatic Inverse Algorithm
The diabatic heating rate is calculated according to the following equation [38]:
where Q1 indicates the heating rate per unit mass of air per unit time, T is the temperature, θ is the potential temperature, V is the horizontal wind vector, ω = dp/dt is the vertical velocity in the P coordinate system, κ = R/Cp (R and Cp are the dry air gas constant and constant pressure specific heat, respectively), and P is the air pressure (P0 = 1000 hPa).
The three items in brackets at the right end of the equal sign in Equation (1) indicate the local variation term of temperature, the horizontal advection term, and the vertical transport term, respectively.
2.2.2. Four Characteristic Indices of the WPSH at 500 hPa
In this paper, the four indices of the WPSH proposed by Liu et al. [39] were used to analyze the anomalies of the WPSH in August-September 2021.
- (1)
- Area index: On a 500 hPa geopotential height map with 2.5° × 2.5° grids, the number of grid points which the geopotential heights greater than 588 dagpm within the area of 110° E to 180° E and north of 10° N is called the area index of the WPSH.
- (2)
- Intensity index: The difference between the geopotential height of each point of the WPSH and the 587 dagpm is accumulated (e.g., one for 588, two for 589, three for 590, and so on). This accumulated value is defined as the intensity index of the WPSH.
- (3)
- Ridge position: This is the latitude corresponding to the WPSH ridge averaged from 110° E to 150° E.
- (4)
- Westward ridge point position: The longitude of the westernmost position of the 588 dagpm contour in the range 90° E to 180° E is defined as the westward ridge point position of the WPSH.
2.2.3. Identification of the WPSH Ridge
In this study, we refer to the approach of Song et al. [33] for the definition of the WPSH ridge: the interface between easterly and westerly winds in the subtropics is used as a ridge, satisfying u = 0, .
3. Results
3.1. Anomalous Characteristics of the WPSH in August-September 2021
Figure 1 gives the time series evolution of the four characteristic indices of the 500 hPa WPSH averaged over August-September from 1991 to 2021. The area and intensity index of the 500 hPa WPSH have shown an increasing trend over the last 31 years, especially since 2006, reaching a maximum in 2021 (blue lines in Figure 1a,b). The position of the 500 hPa WPSH ridge has been increasingly fluctuating since 2006, with extreme southward or northward deviations, and its position in 2021 was about 27.5° N (blue line in Figure 1c). In addition, the position of the WPSH western ridge point at 500 hPa has been trending westward since 2001, corresponding to a westward strengthening event of the WPSH (blue line in Figure 1d). In 2021, the location of the WPSH western ridge point was westward, about 100° E. After detrending, the 500 hPa WPSH in August-September 2021 can still be seen to be characterized by a larger area and intensity, with the western ridge point located to the west (red lines in Figure 1a–d).
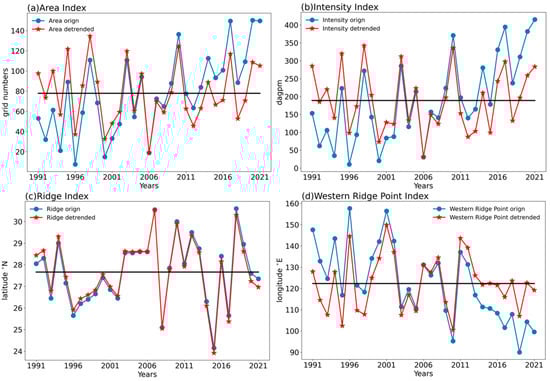
Figure 1.
Time series of the four 500 hPa WPSH indices for August-September 1991–2021. The blue lines represent the original field, the red lines are the results after detrending, and the black lines represent the mean values of the results after detrending. (a) Area index; (b) intensity index; (c) ridge position index; (d) western ridge point position index.
Figure 2 shows the geopotential heights and their anomalies of 850 hPa, 500 hPa, and 200 hPa from August to September 2021, and the dotted areas indicate that the anomalies were greater than one standard deviation. In the upper troposphere (Figure 2a), there were significant positive anomalies in the geopotential height of the area controlled by the SAH (1248 dagpm line), and the SAH ridge was located near 30° N, extending from the Tibetan plateau to near the dateline. At the middle troposphere (Figure 2b), there were also clear positive anomalies in the geopotential height of the WPSH, represented by the 588 dagpm characteristic line, with the WPSH ridge slightly more southerly than the SAH’s eastern ridge. It is noteworthy that the positive geopotential height anomalies of the WPSH at 850 hPa were mainly located south of the WPSH ridge at the lower troposphere in 2021 (Figure 2c), and the positive geopotential height anomalies of the WPSH at 500 hPa almost overlapped with the WPSH ridge in the middle troposphere (Figure 2b), while the area of the positive geopotential height anomalies of the 200 hPa SAH were slightly to the north of the SAH ridge (Figure 2a). These findings indicate that the main body of the WPSH in August-September 2021 was southerly in the lower troposphere, while, in the middle troposphere, there was no significant anomaly compared to its climatological state during the same period. In the upper troposphere, the SAH was northerly, reflecting the anomalous vertical tilt of the WPSH.
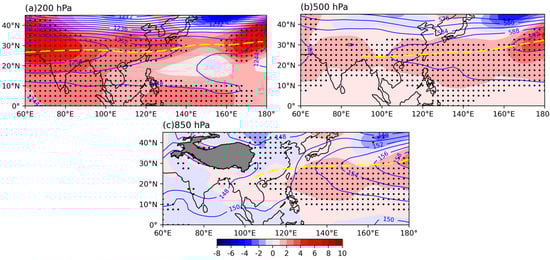
Figure 2.
Geopotential height (blue contour) in August-September 2021 and its anomalies (shaded). The dotted areas are the districts where anomalies are greater than one standard deviation. The yellow dashed line is the SAH ridge or the WPSH ridge, and the gray shaded topography is the Tibetan plateau. (a) 200 hPa; (b) 500 hPa; (c) 850 hPa (unit: dagpm).
From Figure 3, it can be seen that the latitudinal positions of the WPSH ridge in August-September 2021 at 105° E, 110° E, 120° E, 130° E, and 140° E in the lower troposphere (900 hPa) were about 21.5° N, 23.8° N, 21° N, 27° N, and 28.8° N, respectively (Figure 3a), while the climatological state in the lower troposphere during the same period was about 41° N, 38.4° N, 37° N, 34° N, and 31.5° N, respectively (Figure 3b). Therefore, the latitudinal position of the WPSH ridge showed a significant southward deviation in the lower troposphere compared with the climatological state of the same period, with the latitudinal positions of the WPSH ridge at 105° E, 110° E, and 120° E showing more significant southward deviations. Additionally, in the upper troposphere, the latitudinal position of the WPSH ridge is more northerly than the climatological state, and there are no obvious anomalies in the position of the WPSH ridge at the middle troposphere. Combining Figure 2 and Figure 3, the three-dimensional structural anomalies of the WPSH ridge in August-September 2021 showed an extremely southward shift at the lower troposphere and a northward shift in the upper troposphere. In summary, the WPSH ridge showed a vertical distribution with height tilting from south to north in August-September 2021.
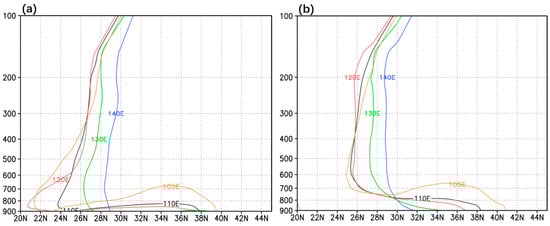
Figure 3.
Vertical distribution of the WPSH ridges at 105° E, 110° E, 120° E, 130° E, and 140° E. (a) August-September 2021; (b) climatological state.
Since the southward deviations of the latitudinal positions of the WPSH ridge in the lower troposphere at 105° E, 110° E, and 120° E were more significant in August-September 2021, these three longitude positions were taken to further analyze the characteristics of the geopotential height anomalies and the zonal winds (Figure 4). Comparing the zonal winds along 105° E, 110° E, and 120° E in August-September 2021 (Figure 4a–c) with the climatological states at each longitude position (Figure 4d–f), it was found that the 200 hPa subtropical upper westerly jets over East Asia at different longitudes were all located near 40° N in August-September 2021. However, the intensity of the upper westerly jet was significantly stronger and more extensive in 2021. At the same time, it can be seen from Figure 4a that the WPSH had positive geopotential anomalies in the lower troposphere from 20° N to 26° N, while the lower troposphere north of 26° N had negative anomalies and the upper troposphere had positive anomalies. The largest positive anomaly was centered at 200 hPa around 32° N. In addition, the information presented in Figure 4b,c is similar to that in Figure 4a. These findings further suggest that the anomalous south-to-north tilt of the WPSH ridge with height is related to the pressurization of the lower latitudes at the lower troposphere and the pressurization of the upper troposphere in the subtropics and mid-latitudes.
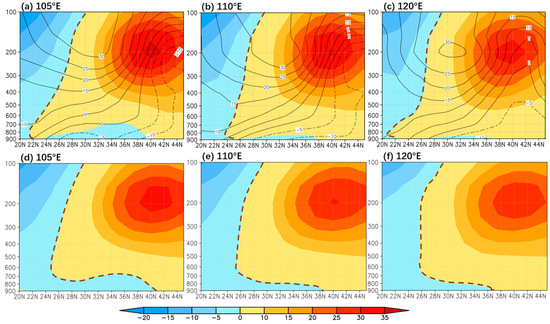
Figure 4.
The latitude-altitude profiles of the zonal winds at 105° E, 110° E, and 120° E in August-September 2021 (shaded; unit: m/s) and the corresponding climatological states. The black contours in (a–c) indicate geopotential height anomalies (unit: gpm). The brown dashed lines represent the WPSH ridge. (a) 105° E, 2021; (b) 110° E, 2021; (c) 120° E, 2021; (d) 105° E, climatological state; (e) 110° E, climatological state; (f) 120° E, climatological state.
3.2. Thermal Causes of the Anomalies of the WPSH Ridge in August-September 2021
Considering the possible effects of the diabatic heating on the geopotential height anomalies, the atmospheric heat source and its anomalies distribution were calculated using Equation (1) to explain the possible causes of the geopotential height anomalies at different latitudes and altitudes for August-September 2021. In the upper troposphere at 200 hPa (Figure 5a), the diabatic heating in East Asia showed positive anomalies, with strong anomalies near 30° N. In the middle troposphere at 500 hPa (Figure 5b), the diabatic heating near 30° N also showed positive anomalies, slightly weaker than 200 hPa. In the lower troposphere at 850 hPa (Figure 5c), the diabatic heating south of 25° N showed negative anomalies. Therefore, in August-September 2021, the diabatic heating anomalies in East Asia were unevenly distributed in the horizontal direction and showed different characteristics at different pressure levels.
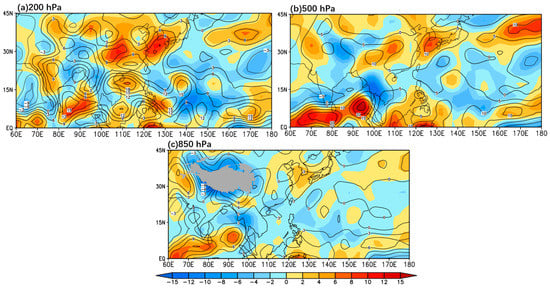
Figure 5.
The diabatic heating rate in August-September 2021 (black contour) and its anomalies (shaded) at different pressure levels. The gray shaded topography is the Tibetan plateau. (a) 200 hPa; (b) 500 hPa; (c) 850 hPa (unit: 10−4 K/s).
Figure 5 illustrates the nonuniform distribution of the diabatic heating in the horizontal direction, and a further analysis of the distribution characteristics of the diabatic heating in the vertical direction is presented in Figure 6. Then, the two were combined to quantitatively explore the mechanism of the direct influence of the nonuniform distribution of the diabatic heating in three-dimensional space on the intensity and location of the WPSH in August-September 2021, thus identifying the causes of the WPSH ridge’s anomalous activities.
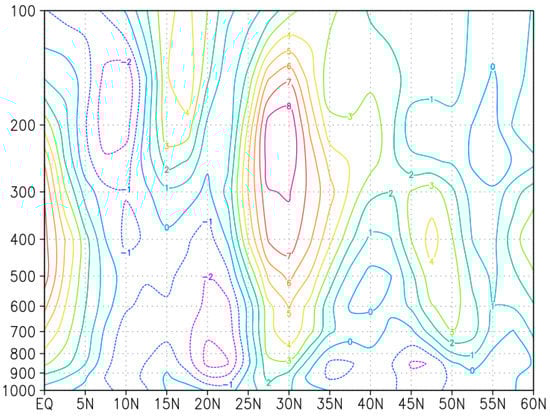
Figure 6.
The latitude-altitude profile of the diabatic heating anomaly averaged over 105° E–120° E in August and September 2021 (contour) (unit: 10−4K/s).
Judging from the vertical distribution of the diabatic heating anomaly field averaged over 105° E–120° E in August-September 2021 (Figure 6), the anomalous cooling in Southern China (20° N–25° N) extended from the bottom of the troposphere up to about 400 hPa, and its center was at about 850 hPa, whereas, around 30° N, the anomalous heating extended from the middle troposphere up to around 150 hPa, and its center was located between 300 hPa and 200 hPa. These correspond well to the horizontal inhomogeneous distribution of the diabatic heating in Figure 5.
The spatial distribution of the diabatic heating can directly influence the intensity, location, and vertical structure of the WPSH. The cold sources usually intensify the low-level high pressure, while the heating sources intensify the upper-level high pressure; therefore, the ridge usually tilts toward the warm region with height [40]. The anomalous cold source from the South China Sea to Southern China at 850 hPa in Figure 6 corresponds to the enhancement of the low-level high pressure, resulting in the southward shift of the WPSH ridge at the lower troposphere, while the anomalous heat source at about 200 hPa located near 30° N and its northern part corresponds to the increase in the geopotential height at the upper troposphere (Figure 4a–c). Therefore, it can be considered that the nonuniform distribution of the diabatic heating in three-dimensional space is an important factor for the abnormal vertical structure of the WPSH ridge from August to September 2021.
3.3. Relationship between the WPSH Ridge Anomalies and the Precipitation in China from August to September 2021
The WPSH is one of the key systems controlling the advance and retreat of the rainbands in China. Therefore, the responses of the precipitation in China to the anomalous structure of the WPSH from August to September 2021 were further analyzed. Figure 7 gives the precipitation in China for August-September 2021 and its anomaly field compared with its climatological state. Since the precipitation in the region 105° E–120° E, 30° N–35° N was the area of large positive anomalies, it was selected as the key precipitation district (red box in Figure 7). It can be seen that the center of the largest positive anomaly appeared in the area between the Yangtze River and the Yellow River east of 105° E, and the maximum positive anomaly reached 8 mm/day. Moreover, the precipitation in Northwest China was relatively lower, and the precipitation anomalies in other regions were not significant.
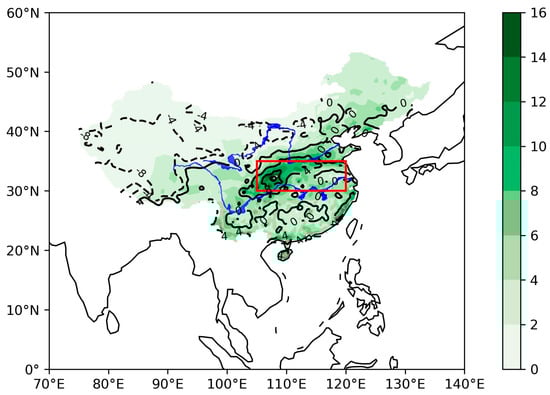
Figure 7.
The August-September averaged precipitation in China (shaded) in 2021 and its anomalies compared with its climatological state (black contour). The black solid lines represent positive anomalies, while the black dotted lines represent negative anomalies. The northern blue line is the Yellow River in China, the southern blue line is the Yangtze River in China, and the red box is the key precipitation district (unit: mm/day).
Precipitation requires an abundant supply of water vapor. The anomalous specific humidity field and anomalous wind field in the lower troposphere (850 hPa) for August-September 2021 are given in Figure 8. A strong water vapor transport channel from southwest to northern China along the edge of the WPSH existed in the anomalous wind field, with water vapor from the Indian Ocean and South China Sea transported northward by the southwest monsoon to the areas north of the Yangtze River. Moreover, there were positive specific humidity anomalies at the southeastern foothills of the Tibetan plateau (105° E–110° E, 30–35° N), and slight moisture convergence in the key precipitation district (red box in Figure 8), which were favorable precipitation conditions for the excessive precipitation between the Yangtze and Yellow River basins in August-September 2021. Thus, the stable maintenance of the position of the WPSH ridge and the intensified westward extension activity of the WPSH in August-September 2021 provided good large-scale circulation background conditions for the anomalous precipitation between the Yangtze and Yellow River basins (red boxes in Figure 7 and Figure 8).
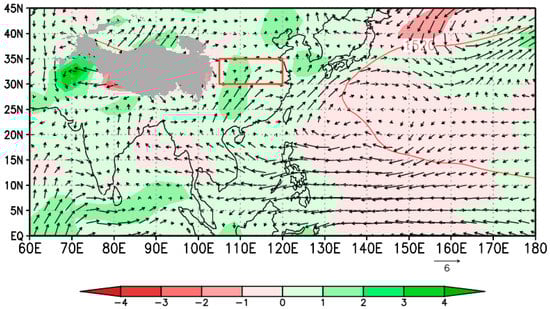
Figure 8.
The anomalous specific humidity field (shaded; unit: g/kg) and the anomalous wind field (vector arrow; unit: m/s) at 850 hPa for August-September 2021. The gray shaded topography is the Tibetan plateau, the red line is the 1520 gpm contour of the WPSH, and the red box is the key precipitation district, as in Figure 7.
Precipitation anomalies were also closely related to upward movements. Figure 9 shows the latitude-altitude profile of the vertical velocity anomaly field averaged over 105° E–120° E in August-September 2021. As shown in Figure 9, the lower and middle troposphere from the tropics to the subtropics (10° N–25° N) in August-September 2021 were characterized by anomalous subsidence compared to its climatological state. While combined with Figure 3, this indicates that this region was under the control of the WPSH ridge in the low troposphere and, therefore, mainly dominated by the dynamic subsidence effect of the WPSH ridge. This subsidence played a role in moisture redistribution. Nevertheless, in the region of 25° N and north of it, including part of the mid-troposphere of the WPSH, strong upward movement existed from the middle troposphere to the top of the troposphere. This upward motion provided good dynamical conditions for the anomalous precipitation between the Yangtze and Yellow River basins in China.
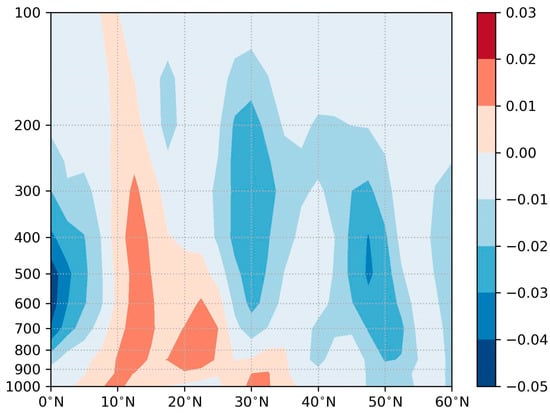
Figure 9.
The latitude-altitude profile of the vertical velocity anomaly averaged over 105° E–120° E in August-September 2021 (shaded; unit: Pa/s).
A combined analysis of the atmosphere heat source anomalies (Figure 6), precipitation anomalies (Figure 7), and vertical velocity anomalies (Figure 9) led to the conclusion thar, in August-September 2021, the high precipitation between the Yangtze and Yellow River basins in China led to the release of latent heat of condensation in the middle and upper troposphere, reinforcing the anomalous heating in the upper troposphere (Figure 6), which made it easier to generate an anomalous low pressure at the bottom layer, further promoting the southward shift of the WPSH ridge at the lower troposphere. However, the anomalous southward and westward shift of the WPSH in the lower troposphere transported more water vapor from the South China Sea and Indian Ocean to 30° N and northward. The abundant water vapor in conjunction with the upward movements (Figure 9) promoted the further intensification of the precipitation between the Yangtze and Yellow River basins in China (Figure 7).
To verify the relationship between the anomalously tilted structure of the WPSH ridge mentioned above and the precipitation in China, the spatial and temporal evolution characteristics of the vertical structure of the WPSH ridge from August to September 1991–2021 were further analyzed. The first two modes of the zonal wind EOF analysis averaged over 105° E–120° E are given in Figure 10, with a cumulative variance contribution of about 61%, and the first mode variance contribution reaching 33.67%. The interface between the zonal easterly and zonal westerly in the first spatial mode presented an obvious characteristic of south-to-north tilt with height, which is similar to the anomalous south-to-north tilt of the WPSH ridge in August and September 2021 (brown dotted line in Figure 10a). When the time coefficient was positive, the lower troposphere (850 hPa–1000 hPa) in southern China (20° N–26° N) was anomalous westerly, and the upper troposphere was anomalous easterly. In contrast, in the region north of 30° N, the entire troposphere was consistent with westerly anomalies, which were stronger in the upper troposphere. The second mode of EOF showed consistent westerly anomalies from the lower to upper over Southern China (Figure 10b). Combined with the temporal coefficients in the first mode, therefore, the inclined structure of the WPSH ridge showed significant interannual differences (Figure 10c), and the temporal coefficient in 2021 was positive. In contrast, the temporal coefficients in the second mode showed no significant anomalies in 2021 (Figure 10d).
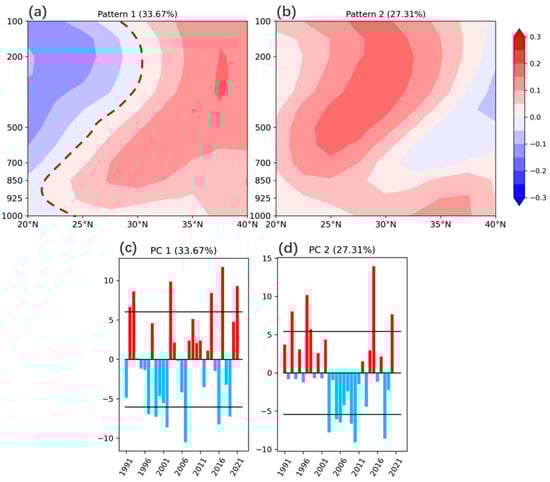
Figure 10.
The first two modes of the zonal wind EOF analysis averaged over 105° E–120° E in August-September 2021. The brown dashed line in the first spatial mode is the WPSH ridge and the black lines in the two temporal modes represent one positive and negative doubling of the standard deviation of the respective temporal coefficient. (a) The first spatial mode; (b) the second spatial mode; (c) the time coefficients of the first mode; (d): the time coefficients of the second mode (unit: m/s).
Years with temporal coefficients greater than one positive standard deviation in the first EOF mode were selected to represent the WPSH ridge tilting northward with height anomalously, and years with temporal coefficients less than one negative standard deviation represented the WPSH ridge tilting southward with height anomalously. The selected years are shown in Table 1. Figure 11 shows the response of the precipitation in China in years of the anomalous WPSH ridges. In the years when the WPSH ridge tilted northward, there were significant positive precipitation anomalies between the Yangtze and Yellow River basins, passing the 95% significance test (red box in Figure 11), which is consistent with the distribution of the precipitation district with large values in August-September 2021 (red box in Figure 7). This further verifies the influence of the anomalous south-to-north tilting feature of the WPSH ridge on the rainband distribution in China.

Table 1.
Typical years with the WPSH ridge tilting northward and southward with height.
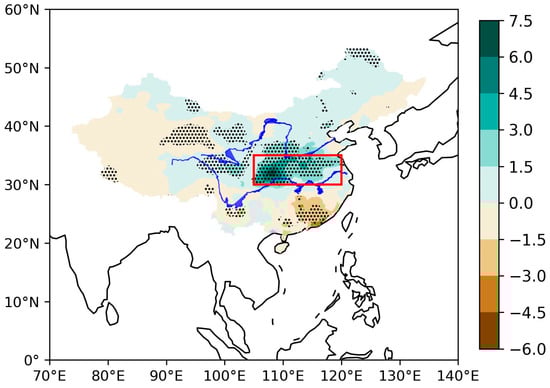
Figure 11.
The difference in precipitation in China between the years when the WPSH ridge inclined northward and southward. The dotted areas passed a 95% confidence test. The red box is the key precipitation district, as in Figure 7 (unit: mm/day).
4. Discussion
The WPSH ridge has different tilt characteristics in winter and summer [33], with height tilting northward in the summer and southward in the winter. Since the WPSH ridge maintained its northward tilt characteristics in late summer and early autumn in 2021, the seasonal transition of the WPSH ridge in August-September 2021 was delayed. At the same time, this study broke the traditional theory that the ridge area of the WPSH in the middle troposphere is controlled by clear sky and sinking motion, instead proposing that the WPSH is affected by three-dimensional heat source anomalies, which lead to the abnormal three-dimensional structure of the WPSH ridge. Furthermore, this study also highlighted the importance influence of the vertical distribution of the WPSH ridge on the rainbands in China and the existence of a positive feedback relationship between the ridge precipitation anomalies.
On the other hand, this study only explained the causes of the intensity, location, and ridge’s three-dimensional structural anomalies of the WPSH in August-September 2021 from the thermal aspect, whereas it neither researched the anomalous activities of the WPSH from the perspective of the dynamics of the downward transmission of the eastward-strengthening SAH through the vorticity [41] nor investigated the influence of external forcing. Furthermore, our current study found a strong strengthening trend of the WPSH in terms of area and intensity, but did not address the WPSH changes in future under global warming accurately and the corresponding changes in precipitation in China under the event of the anomalous activities in the WPSH. These limitations may be the focus of our future work.
5. Conclusions
This study used statistical methods to analyze the intensity, location, and ridge’s three-dimensional structural anomalies of the WPSH in late summer and early autumn 2021, as well as explored the thermal mechanism of its anomalies and the link between the WPSH ridge’s three-dimensional structural anomalies and the precipitation in China from August to September. The conclusions are as follows:
- (1)
- In the past 31 years, under global warming, the most significant changes in the spatial pattern of the WPSH were manifested in the expansion of its area, the strengthening of its intensity, the westward extension of its westward ridge point, and an increasing trend of the interannual variabilities of its 500 hPa ridge.
- (2)
- The anomalous activities of the WPSH ridge in August-September 2021 were the main result of an uneven distribution of diabatic heating. In the region south of 25° N, the lower and middle troposphere showed abnormal cooling, thus making the near-ground layer pressure anomalously high. In the region near and north of 30° N, the middle and upper troposphere showed abnormal heating, leading the upper troposphere to be controlled by anomalously high pressure.
- (3)
- There was a positive feedback mechanism between the anomalous activities of the WPSH ridge in August-September 2021 and the Chinese precipitation anomalies during the same period. The southward and westward extension of the WPSH at the lower troposphere directed more warm and humid air northward and generated more upward motion, resulting in heavy precipitation between the Yangtze and Yellow River basins. Meanwhile, the latent heat of condensation released by precipitation in that region caused positive anomalies in the geopotential heights at the middle and upper troposphere, allowing the WPSH ridge to be maintained tilting from south to north (Figure 12). This delayed the seasonal transition of the WPSH ridge in August-September 2021, which intensified the precipitation between the Yangtze and Yellow River basins in turn.
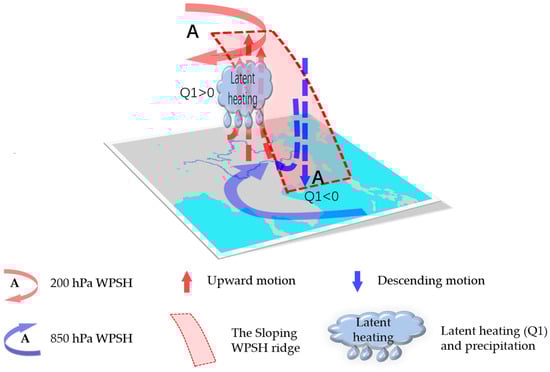 Figure 12. Feedback mechanism between the south-to-north tilt characteristic of the WPSH ridge in August-September and the precipitation in China.
 - (4)
- The south-to-north tilt structure of the WPSH ridge in August-September was one of the main modes of the WPSH anomalies. In years when it tilted from south to north with height, the precipitation in Southern China was lower, and the rainband was mainly located between the Yangtze and Yellow River basins. In years when it sloped from north to south with height, the rainband was mainly located in Southern China.
Author Contributions
Conceptualization, F.Z. and S.Y.; methodology, F.Z.; data curation, F.Z. and Q.G.; writing—original draft preparation, F.Z.; writing—review and editing, S.Y.; project administration, S.Y., X.Y. and Q.S.; funding acquisition, S.Y., X.Y. and Q.S. All authors have read and agreed to the published version of the manuscript.
Funding
This research was funded by the State Key Program of the National Natural Science Foundation (grant number 41930969-3), the National Key Research and Development Program of China (grant number 2019YFC0214604), the Plateau Atmosphere and Environment Key Laboratory opening project (PAEKL-2020-C1), and the College Student Innovation and Entrepreneurship Training Program (grant number 202210300076Y).
Institutional Review Board Statement
Not applicable.
Informed Consent Statement
Not applicable.
Data Availability Statement
The data presented in this study are available upon request from the corresponding author.
Acknowledgments
We are very grateful to the three reviewers whose kind and valuable comments greatly improved the quality of the paper. We thank Huang Qian for his patient guidance. We also thank the China Meteorological Data Service Center for providing observational data and the National Centers for Environmental Prediction and National Centers for Atmospheric Research (NCEP/NCAR) for providing the reanalysis data.
Conflicts of Interest
The authors declare no conflict of interest.
References
- Tao, S.Y.; Chen, L.X. A review of recent research on the east Asian summer monsoon in China. In Monsoon Meteorology; Oxford University Press: Oxford, UK, 1987; pp. 60–92. [Google Scholar]
- Ding, Y.H. The summer monsoon in East Asia. In Monsoons over China Kluwer; Springer Science & Business Media: Dordrecht, The Netherlands, 1994; pp. 1–9. [Google Scholar]
- Rodwell, M.J.; Hoskins, B.J. Subtropical anticyclones and summer monsoons. J. Clim. 2001, 14, 3192–3211. [Google Scholar] [CrossRef] [Green Version]
- Wang, H.; Chen, H. Climate control for southeastern China moisture and precipitation: Indian or East Asian monsoon? J. Geophys. Res. Atmos. 2012, 117, 1–9. [Google Scholar] [CrossRef]
- Wang, B.; Wu, R.G.; Fu, X.H. Pacific-East Asian teleconnection: How does ENSO affect East Asian climate? J. Clim. 2000, 13, 1517–1536. [Google Scholar] [CrossRef]
- Li, T.; Wang, B.; Wu, B.; Zhou, T.; Chang, C.; Zhang, R. Theories on formation of an anomalous anticyclone in western North Pacific during El Niño: A review. J. Meteorol. Res. 2017, 31, 987–1006. [Google Scholar] [CrossRef]
- Li, X.Y.; Lu, R.Y. Decadal change in the influence of the Western North Pacific Subtropical High on summer rainfall over the Yangtze River basin in the late 1970s. Adv. Atmos. Sci. 2021, 38, 1823–1834. [Google Scholar] [CrossRef]
- Zhang, Q.Y.; Tao, S.Y. The study of the sudden northward jump of the Subtropical high over the western Pacific. Acta Meteorol. Sin. 1999, 57, 539–548. [Google Scholar]
- Hu, J.G.; Zhou, B.; Tao, L. Comparative Analysis of the Relation Between Characteristic Parameters of South Asia High and Summer Precipitation of China. Meteorol. Mon. 2010, 36, 51–56. [Google Scholar]
- Cen, S.X.; Chen, W.; Hu, P. Progresses in Understanding the Seasonal Evolution of the South Asian High and the Mechanisms of Its Variations. Plateau Meteorol. 2021, 40, 1304–1317. [Google Scholar]
- Lei, X.H.; Song, M.H.; Zhang, S.B. Association between Summer Activity Characteristic Indices of the South Asia High and the West Pacific Subtropical High and Precipitation Distribution in Eastern China. Plateau Meteorol. 2022, 41, 489–501. [Google Scholar]
- Climate Change 2021: The Physical Science Basis. Available online: https://www.ipcc.ch/report/ar6/wg1/ (accessed on 21 April 2022).
- Xue, Z.; Gong, D.Y. Interdecadal change in western Pacific Subtropical High and climatic effects. J. Geogr. Sci. 2002, 12, 202–209. [Google Scholar]
- Zhou, T.J.; Yu, R.C.; Zhang, J.; Drange, H.; Cassou, C.; Deser, C.; Hodsonf, D.L.R.; Sanchez-Gomez, E.; Lia, J.; Keenlyside, N.; et al. Why the western Pacific subtropical high has extended westward since the late 1970s. J. Clim. 2009, 22, 2199–2215. [Google Scholar] [CrossRef] [Green Version]
- Sun, S.J.; Li, D.L. Morphological variation of the Western Pacific subtropical high and its possible thermodynamic causes Under the background of climate warming. Acta Meteorol. Sin. 2019, 77, 100–110. [Google Scholar]
- Wu, L.G.; Wang, C. Has the western Pacific subtropical high extended westward since the late 1970s? J. Clim. 2015, 28, 5406–5413. [Google Scholar] [CrossRef]
- Huang, Y.Y.; Li, X.F. The interdecadal variation of the western Pacific subtropical high as measured by 500 hPa eddy geopotential height. Atmos. Ocean. Sci. Lett. 2015, 8, 371–375. [Google Scholar]
- He, C.; Lin, A.L.; Gu, D.J.; Li, C.; Zheng, B.; Wu, B.; Zhou, T. Using eddy geopotential Height to measure the western North Pacific subtropical high in a warming climate. Theor. Appl. Clim. 2018, 131, 681–691. [Google Scholar] [CrossRef] [Green Version]
- Jia, B.; Peng, J.J.; Hu, S.J.; Feng, G.L. Novel dynamical indices for the variations of the western Pacific subtropical high based on three-pattern decomposition of global atmospheric circulation in a warming climate. Clim. Dyn. 2021, 56, 3473–3487. [Google Scholar] [CrossRef]
- Shaw, T.A.; Voigt, A. Tug of war on summertime circulation between radiative forcing and sea surface warming. Nat. Geo. Sci. 2015, 8, 560–566. [Google Scholar] [CrossRef]
- Liu, Q.; Zhou, T.; Mao, H.; Fu, C. Decadal variations in the relationship between the western Pacific subtropical high and summer heat waves in east China. J. Clim. 2019, 32, 1627–1640. [Google Scholar] [CrossRef]
- Nie, J.; Liu, P.; Zhao, C. Research on Relationship between Various indexes of the Western North Pacific Subtropical High and Summer Precipitation in Eastern China. J. Atmos. Sci. 2021, 45, 833–850. (In Chinese) [Google Scholar]
- Wu, G.X.; Liu, Y.M.; Liu, P. The effects of spatially nonuniform Heating on the formation and variation of Subtropical High part I: Scale analysis. Acta Meteorol. Sin. 1999, 57, 257–263. [Google Scholar]
- Liu, Y.M.; Liu, H.; Liu, P.; Wu, G. The effects of spatially nonuniform Heating on the formation and variation of Subtropical High part II: Land surface sensible heating and East Pacific Subtropical High. Acta Meteorol. Sin. 1999, 57, 385–396. [Google Scholar]
- Wang, L.J.; Guan, Z.Y.; He, J.H. The position variation of the West Pacific subtropical high and its possible mechanism. J. Trop. Meteorol. 2006, 12, 113–120. [Google Scholar]
- Li, J.P.; Zhu, J.L. Climatological features of the western Pacific subtropical high southward retreat process in late spring and early summer. Acta Meteorol. Sin. 2010, 24, 397–412. [Google Scholar]
- Wang, L.J.; Gao, H.; Guan, Z.Y.; He, J. Relationship between the western Pacific subtropical high and the subtropical East Asian diabatic heating during South China heavy rains in June 2005. Acta Meteorol. Sin. 2011, 25, 203–210. [Google Scholar] [CrossRef]
- Tao, S.Y. Some Studies on Subtropical Synoptic Systems over China in Summer; Science Press: Beijing, China, 1963; pp. 1–146. (In Chinese) [Google Scholar]
- Tao, S.Y.; Wei, J. The westward, northward advance of the subtropical high over the West Pacific in summer. J. App. Meteorol. Sci. 2006, 17, 513–525. (In Chinese) [Google Scholar]
- Su, T.H.; Xue, F. The intraseasonal variation of summer monsoon circulation and rainfall in East Asia. J. Atmos. Sci. 2010, 34, 611–628. (In Chinese) [Google Scholar]
- Gao, H.; Jiang, W.; Li, W. Changed relationships between the East Asian summer monsoon circulations and the summer rainfall in eastern China. J. Meteorol. Res. 2014, 28, 1075–1084. [Google Scholar] [CrossRef]
- Liu, P.; Wu, G.X.; Li, W.P.; Liu, Y.M. The Three-Dimensional Structure of Subtropical High Belt. J. Atmos. Sci. 2000, 24, 577–584. [Google Scholar]
- Song, Z.X.; Zhang, P.Q.; Chou, J.F.; Xv, M. Three-Dimensional Structural Characteristics of the Movement of Subtropical Ridge Line. Acta Meteorol. Sin. 2001, 59, 472–479. [Google Scholar]
- Mao, J.Y.; Wu, G.X.; Liu, Y.M. Study on the Variation in the configuration of Subtropical Anticyclone and Its Mechanism during Seasonal Transition Part Ⅰ: Climatological Features of Subtropical High Structure. Acta Meteorol. Sin. 2003, 17, 274–286. [Google Scholar]
- Kalnay, E.; Kanamitsu, M.; Kistler, R.; Collins, W.; Deaven, D.; Gandin, L.; Iredell, M.; Saha, S.; White, G.; Woollen, J.; et al. The NCEP/NCAR 40-Year Reanalysis Project. Bull. Am. Meteorol. Soc. 1996, 77, 437–471. [Google Scholar] [CrossRef] [Green Version]
- Ren, Z.H.; Zou, F.L.; Yu, Y.; Wang, G.A. Daily Value Dataset of China’s Surface Climate Data. Available online: http://data.cma.cn (accessed on 26 March 2022).
- Characteristic Index Data of Western Pacific Subtropical High. Available online: http://cmdp.ncc-cma.net/download/precipitation/diagnosis/NWP_high/wpsh_idx.txt (accessed on 30 March 2022).
- Yanai, M.; Esbensen, S.; ChuJ, H. Determination of bulk properties of tropical cloud clusters from large-scale heat and mois-turebudgets. J. Atmos. Sci. 1973, 30, 611–627. [Google Scholar] [CrossRef]
- Liu, Y.Y.; Li, W.J.; Ai, W.X. Reconstruction and application of the monthly western Pacific subtropical high indices. J. Appl. Meteorol. Sci. 2012, 23, 414–423. (In Chinese) [Google Scholar]
- Wu, G.X.; Chou, J.F.; Liu, Y.M. Formation and Variation of Subtropical High Dynamic Problem; Science Press: Beijing, China, 2002; pp. 30–35. [Google Scholar]
- Ren, R.C.; Liu, Y.M.; Wu, G.X. Impact of South Asia High on the short-term variation of the Subtropical anticyclone over Western Pacific in July 1998. Acta Meteorol. Sin. 2007, 65, 183–197. [Google Scholar]
Publisher’s Note: MDPI stays neutral with regard to jurisdictional claims in published maps and institutional affiliations. |
© 2022 by the authors. Licensee MDPI, Basel, Switzerland. This article is an open access article distributed under the terms and conditions of the Creative Commons Attribution (CC BY) license (https://creativecommons.org/licenses/by/4.0/).