Abstract
Atmospheric peroxides, especially hydrogen peroxide (H2O2), are essential oxidants. The peroxide concentration is closely related to the extent of OH radicals and the O3 cycle in the tropospheric atmospheric chemistry. However, only a few studies have investigated their atmospheric concentrations in China because of inadequacies in the measurement techniques or higher costs of analytical instruments. Therefore, it is essential to design a suitable analysis method of peroxides with higher sensitivity, lower detection limit, and low cost. In view of that, this study investigated the optimum analysis conditions of two H2O2 analytical techniques: the high-performance liquid chromatography (HPLC) with fluorescence detection using two-enzyme catalysis of horseradishperoxidase (HRP method) and Hemin (Hemin method). Furthermore, these two analysis methods were systematically compared in terms of detection limit, calibration curve, precision, accuracy, and applicability for the first time. The findings showed that the HRP method had a lower detection limit, higher sensitivity, and better applicability for detecting H2O2 and methyl hydroperoxide (MHP) than the Hemin method. Moreover, the HRP method is better suitable for H2O2 and MHP detection, which requires low detection limits and high sensitivity. Besides this, the Hemin method is inexpensive and is more suitable for detecting hydroxyl alkyl peroxides (C ≥ 3). The atmospheric concentrations (average) of H2O2 and MHP were 0.60 ± 0.37 ppb and 0.081 ± 0.039 ppb, respectively, as determined by the HRP method. Importantly, atmospheric peroxide concentrations were higher on sunny days than on cloudy days in Beijing in September 2016. H2O2 concentrations showed a diurnal variation with the lowest value in the morning and two peaks at 13:00–17:00. In contrast, MHP concentrations were lowest in the morning and highest after 17:00. Photochemical reactions were responsible for the production of H2O2 and MHP. The reactions of O3 and olefins emitted by motor vehicles also caused H2O2 concentration to increase during the evening rush hour.
1. Introduction
In recent years, many cities have witnessed tremendous growth in motor vehicle numbers in China. This growth, in turn, has led to a substantial increase in the emissions of pollutants, such as nitrogen oxides (NOx) and volatile organic compounds (VOCs), further resulting in higher concentrations of secondary pollutants, such as ozone (O3) and peroxide. Peroxides play a crucial role in tropospheric atmospheric chemistry and negatively affect human health and plant growth [1,2,3,4,5].
Atmospheric peroxides mainly include hydrogen peroxide (H2O2) and organic peroxides, such as methyl hydroperoxide (MHP) and hydroxymethyl peroxide (HMHP). They are generated by photochemical reactions with no artificial and natural emission sources. H2O2 is most prevalent, followed by MHP. Peroxides, particularly H2O2, are not only primary oxidants for the oxidization of SO2 to SO42− in the aqueous phase when the pH is less than 4.5 [6]. The concentration of peroxides is closely related to the extent of OH radicals present and the O3 cycle in the tropospheric atmospheric chemistry [7,8]. Therefore, researchers have focussed on peroxides and have conducted extensive measurements in the atmosphere since 1985. However, the database is still limited, especially in China, because of the inadequacies in the measurement techniques and higher costs of analytical instruments. Hence, more cost-effective analytical methods with lower detection limits and higher sensitivity are needed to determine peroxide concentration in the atmosphere.
Since the 1980s, the concentrations of atmospheric peroxides have been mainly measured by enzyme catalyzation–fluorescence detection technology, which has a lower detection limit [9,10]. This method is based on the oxidation of a non-fluorescent substrate into a potent fluorescence substance and using an enzyme as the catalyst. Horseradish peroxidase (HRP) is often used as an enzyme to catalyze the peroxide oxidation of p-hydroxyphenylacetic acid (POPHA) into a dimer of POPHA with strong fluorescence properties. This provides more stability and a lower detection limit to the fluorescence method [11]. Hellpointner and Gab [12] successfully separated and quantitatively analyzed H2O2 and partial organic peroxides in atmospheric samples by combining enzyme catalyzation–fluorescence detection technology and high-performance liquid chromatography (HPLC), followed by a post-column derivation reaction. However, this method can only quantify H2O2 and alkyl peroxides of C ≤ 2 because the pH value restricts the specificity of HRP enzyme catalysis. Hence, peroxide with C ≥ 3 cannot be well quantified [13,14]. Furthermore, an additional pump is required to provide a solution that adjusts the pH of the detected solution because the optimum pH of HRP-catalysed reaction and fluorescence detection is different [13,15,16]. Therefore, Zhang and Dasgupta [13] used an inexpensive hematin method, instead of expensive HRP methods, to measure H2O2 and other organic peroxides. They discovered that the catalytic activity of hematin was similar to that of HRP for H2O2 and was 1/10th of HRP for MHP. The hydroxyl alkyl peroxides (C ≥ 3) can be detected using the H2O2 standard curve [12] because the optimum pH in this reaction system was 10.5. Some hydroxyl alkyl peroxides, such as HOCH2OOCH2OH (BMHP), can rapidly decompose into H2O2. A pump-delivered pH-adjusting solution was not needed because the pH of the post-column derivatization reaction (using hematin as an enzyme) was consistent with that of fluorescence detection. Hence, the experimental facility was simplified and economical. Qi et al. [14] devised a method of using cheaper Hemin instead of expensive HRP as a catalyst for analyzing H2O2 and some water-soluble organic peroxides because Hemin can be quickly converted to hematin in an alkaline solution. Xu and Chen [17] investigated the optimal analysis conditions of Qi’s method. However, no attempts have been made to systematically compare these two methods regarding the detection limit, precision and other factors.
This study investigated the optimum analysis conditions of two analytical methods of peroxides using the HRP (HRP method) and Hemin (Hemin method) as catalysts and compared the two methods. After that, this study measured the concentrations of atmospheric peroxides using the more sensitive and accurate method.
2. Materials and Methods
2.1. Experimental Methods
An HPLC post-column derivatization system with a fluorescence detector (LC-20A, Shimadzu, Kyoto, Japan) was used to analyze the concentrations of H2O2 and MHP. Peroxides were separated by the ODS-II column (5 um, 4.6 × 250 mm, GL Science, Tokyo, Japan) and then reacted with p-hydroxyphenyl acetic acid (POPHA, Sigma-Aldrich, St. Louis, MO, USA) to produce the fluorescent dimer of POPHA in the presence of an enzyme. The fluorescence detector was used to determine the fluorescence intensity of the dimer, which shared a linear relationship with the concentration of peroxides. The reaction tube and chromatographic column were placed in the column oven (GL Science, Tokyo, Japan) at 1–2 °C to maintain the stability of enzyme activity [18] and reduce the decomposition of peroxides. The chromatographic column, pipes, and joints made of Peek material were used in the HPLC system to reduce peroxides’ decomposition and adsorption. The quantity of injected sample was 20 μL.
Figure 1 is the schematic diagram of the HPLC system. The system using HRP as an enzyme included three high-pressure pumps to deliver the mobile phase (pH: 3.5 H3PO4, Fuchen Chemical Reagent, Tianjin, China), the HRP enzyme reagent (6.25 U/mL HRP, Sigma-Aldrich, St. Louis, MO, USA; 6.57 × 10⁻⁵ mol/L POPHA, Sigma-Aldrich, St. Louis, MO, USA; 0.01 mol/L KH2PO4, Fuchen Chemical Reagent, Tianjin, China), and the alkali solution (pH 10.5 NH4Cl/NH3·H2O, Fuchen Chemical Reagent, Tianjin, China). The system using Hemin as the enzyme system included two high-pressure pumps to deliver the mobile phase (pH: 3.5 H3PO4) and the hemin enzyme reagent (8 × 10⁻⁶ mol/L Hemin, Sigma-Aldrich, St. Louis, MO, USA; 8 × 10⁻⁵ mol/L POPHA; and pH: 10.5 NH4Cl/NH3·H2O, Fuchen Chemical Reagent, Tianjin, China). Every day, all reagents were prepared afresh using deionized distilled water (DDW) obtained from a DDW apparatus (RFD240NA, Advantec, Tokyo, Japan). The calibration curves of H2O2 and MHP were built using their diluted standard solutions. Moreover, 1 mL of DDW as the blank sample was injected into the HPLC system and analyzed daily. Notably, single-point calibration checks were performed every two hours. The H2O2 standard solution was prepared by diluting the commercially available H2O2 solution (35%, Sigma-Aldrich, St. Louis, MO, USA). Its concentration was calibrated once every two months [18,19]. MHP standard solutions were synthesized and calibrated according to the relevant literature [15,20]. Similarly, H2O2 and MHP were identified according to the retention times of their respective standards.

Figure 1.
Schematic diagram of HPLC system.
2.2. Field Observation
The atmospheric concentrations of peroxides were measured on the top of Building No. 3 of the Chinese Research Academy of Environmental Sciences (40°04′ N, 116°42′ E) in September 2016 (Figure 2). A nebulization-reflux concentration technique [21,22], which turns the trapped solution into mist, was used to sample H2O2 and MHP at a velocity of 2.5 L/min for 30 min at 1-h intervals from 7:00 to 19:00 daily. The sampling system was constructed by connecting the sampler, pump, and mass flowmeter. The sampler was made by installing the mist chamber (Figure 3) comprising 8 mL of trapping solution–DDW–on a filter holder with a 0.45-µm filter to prevent DDW from entering the flowmeter. The air was circulated through the mist chamber once the sample system was energized. The peroxide in the chamber was immediately dissolved in the DDW mist and then collected. Blank samples were collected via the same method as the peroxide samples, except that the air pump was not turned on. MHP concentrations obtained during the measurement period were corrected for their low sampling efficiency (73%, the results of the lab’s research). Once the sampling was finished, the samples were immediately analyzed in the HRP method by the HPLC system at wavelengths of λex = 315 nm (excitation) and λem = 405 nm (emission). The flow rates of the mobile phase, enzyme reagent, and alkali solution were set at 0.5, 0.2, and 0.1 mL/min, respectively. Notably, the column oven’s temperature was set at 4 °C.
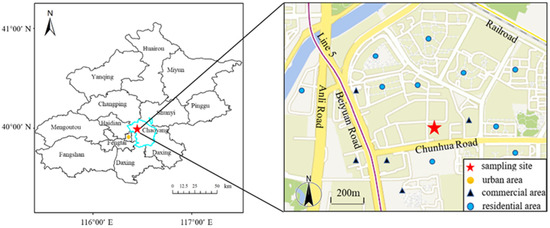
Figure 2.
The location of the sampling site.
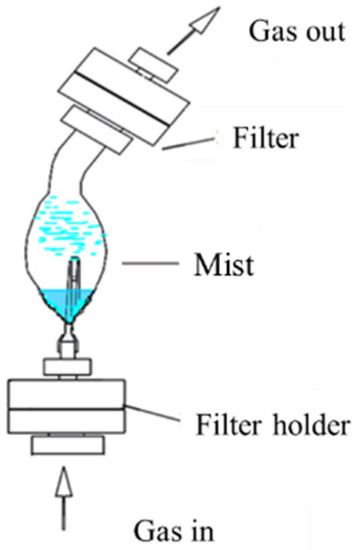
Figure 3.
Sampling device diagram.
2.3. Data Analysis
Except for precision, all experiments, such as the experiment of optimum analysis conditions and accuracy, were performed thrice to ensure precision and accuracy. The relative standard deviations (RSD) were calculated from three replicate measurements. The precision experiments were performed six times sequentially. The RSD was calculated using six parallel measurement results. The results of peroxide concentrations in field observations were the average concentrations of 30-min sampling.
3. Results and Discussion
3.1. Optimum Analysis Conditions of Two Methods
H2O2 (400 μg/L) was selected to examine the optimum analysis conditions of two methods, including the flow rate of reagents, reaction temperature, and others because H2O2 is the most prevalent and essential peroxide in the atmosphere. The results were expressed by the signal-to-noise (SNR) ratio (peak area).
The optimum excitation wavelength (λex) and emission wavelength (λem) were investigated when the flow rates of mobile phase, enzyme reagent, and alkali solution were set at 0.5 mL/min, 0.2 mL/min, and 0.2 mL/min, respectively, and the reaction temperature was set at 25 °C. The HRP and Hemin methods were used to analyze H2O2 solution at λex of 310 nm, 315 nm, 320 nm, and 325 nm, respectively, and λem of 400 nm, 415 nm, 420 nm, and 425 nm, respectively. The results demonstrated that the SNR of H2O2 was highest at λex = 315 nm and λem = 405 nm for both the HRP and Hemin methods (Figure 4).
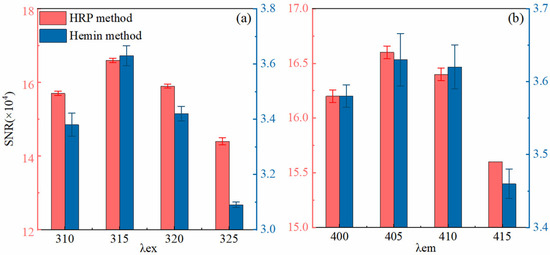
Figure 4.
The results of two methods under different (a) λex and (b) λem.
The optimal flow rates of the mobile phase, enzyme reagent, and alkali solution were investigated at optimal wavelengths and reaction temperature of 25 °C. The sample solution was transported by the mobile phase through the column to the detector in the HPLC system (Figure 1). The amount of the mobile phase can affect the shape of the chromatographic peak, the detection limit, and the analysis time. If the flow rate of the mobile phase is low, the separation of H2O2 by a column is slower, resulting in a longer retention time of H2O2 and a broader chromatographic peak. In contrast, high flow rates can decrease the concentration of enzyme reagent and fluorescence signals. Therefore, this study aimed to determine an optimum flow rate that could achieve the lowest detection limit and shorter analysis time on the premise of a sharp peak shape. H2O2 solution was analyzed at the flow rate (set) of both the enzyme reagent and the alkali solution (0.2 mL/min), and the mobile phase rates were set at 0.3, 0.4, 0.5, and 0.6 mL/min. The results showed that the mobile phase’s flow rates of 0.5 mL/min and 0.3 mL/min were best suitable for the HRP and Hemin methods, respectively (Figure 5a). The enzyme reagent was crucial in this reaction system. Notably, the amount of enzyme could affect the rate of fluorescent reaction. The findings showed that the optimal flow rate of enzyme reagent for both methods was 0.2 mL/min (Figure 5b). The optimum pH of fluorescent detection for the dimer of PHPAA was about 10.5 [14]. The H2O2 solution was analyzed at flow rates of 0.1, 0.2, and 0.3 mL/min of the alkali solution to achieve the optimum pH of the detection solution. The results showed that the SNR of H2O2 reached the highest value when the flow rate of alkali solution was set at 0.1 mL/min for the HRP method (Figure 5c).
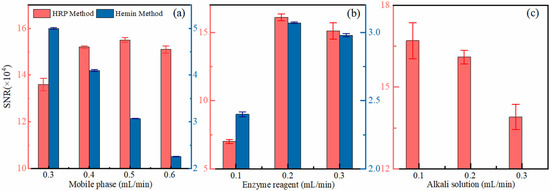
Figure 5.
The results of two methods under different flow rates of (a) mobile phase, (b) enzyme reagent, and (c) alkali solution.
The temperature is an essential factor in chemical reactions. In general, the speed of enzymatic fluorescence reaction increases with an increase in temperature [11], whereas the quantum yield and fluorescence intensity of the fluorescent substance decrease with the rise in temperature [23]. Furthermore, peroxides are also unstable at high temperatures, and their decomposition rates will increase with increasing temperature [24]. Therefore, a suitable temperature is crucial for fluorescent reactions. H2O2 solution was analyzed at the fluorescent reaction temperatures of 20, 25, 30, 35, and 40 °C. The findings showed that the SNRs at different temperatures were almost the same with 1% of RSD, implying that the reaction was unaffected by temperature within 20–40 °C in the HRP method (Figure 6). However, the SNR increased with an increase in temperature in the Hemin method, as expected, because high temperature can enhance the activity of Hemin (Figure 6).
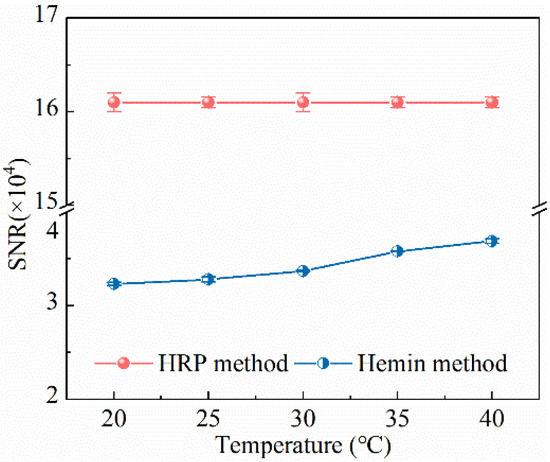
Figure 6.
The results of two methods under different reaction temperatures.
3.2. Comparison of Two Methods
Two analytical methods were compared for detection limits, calibration curves, precision, accuracy, and applicability.
3.2.1. Detection Limit
The detection limit in this study is defined as the concentration of H2O2 solution that corresponds to three times the mean value of 20 noises detected under the optimum analysis conditions. The detection limits of H2O2 and MHP in the liquid phase were 0.04 μg/L and 0.64 μg/L, respectively, in the HRP method, and were 0.61 μg/L and 61 μg/L, respectively, in the Hemin method (Table 1). At the sampling flow of about 180 L, the detection limits of H2O2 and MHP in the gaseous phase were 0.4 ppt and 4.5 ppt, respectively, in the HRP method, and 4 ppt and 282 ppt, respectively, in the Hemin method (Table 1). These results indicated that the detection limits of gaseous H2O2 and MHP in the HRP method were 10 and 62 times, respectively, lower than that in the Hemin method. This study’s results are different from Qi’s [14]. This result means that low levels of H2O2 and MHP can be analyzed more accurately using the HRP method than the Hemin method.

Table 1.
Detection limits of H2O2 and MHP in liquid and gaseous phases obtained by two methods.
3.2.2. Calibration Curve and Sensitivity
The value of five times the detection limit of H2O2 in the liquid phase was taken as the lowest point of calibration curves, which is 0.2 μg/L in the HRP method and 3 μg/L in the Hemin method respectively. The lowest calibration curve points of MHP were 3 μg/L and 300 μg/L in the HRP method and Hemin method, respectively. The calibration curves of H2O2 and MHP in the two methods were created under their optimum analysis conditions. The results demonstrated that the calibration curves for H2O2 were linear between 0.2 μg/L and 1000 μg/L in the HRP method and between 3 μg/L and 4000 μg/L in the Hemin method (Table 2, Figure 7). The calibration curves for MHP were linear between 3 μg/L and 3000 μg/L in the HRP method and between 300 μg/L and 4000 μg/L in the Hemin method. The correlation coefficient of the calibration curve for H2O2 and MHP in the HRP method (>0.999) was higher than using the Hemin method (between 0.99 and 0.999). The slope of the calibration curve of H2O2 for the HRP method (152,324) was 4.6 times higher than that of the Hemin method (27,129). The slope of MHP for the HRP method (46,232) was 171 times higher than that of the Hemin method (268). These results indicate that the HRP method was more sensitive in detecting H2O2 and MHP than the Hemin method.

Table 2.
The linear range, equation of linear regression, and correlation coefficients of calibration curves of H2O2 obtained from two methods.
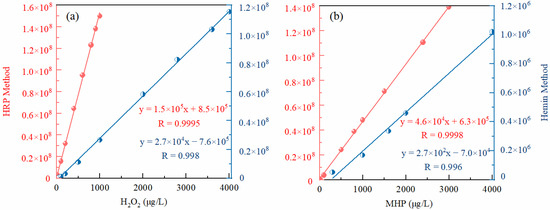
Figure 7.
The calibration curves of (a) H2O2 and (b) MHP by two methods.
Table 3 shows the slopes of eight standard curves of H2O2 and eight results of H2O2 standard solutions of 100 ppb and 600 ppb measured in the HRP method on different days within a 16-day period. The RSD of the slope was 0.77%, and the RSDs of H2O2 standard solutions of 100 ppb and 600 ppb were 2.2% and 1.3%, respectively. These results indicate high repeatability on peroxide calibrations.

Table 3.
Slopes of standard curves and the signal value of H2O2 standard solution measured in HRP method on different days.
Standard solutions mixed with the same concentration of H2O2 (150 μg/L), HMHP (400 μg/L), and different concentrations of MHP were analyzed by two methods. MHP concentration in the mixed solution of the Hemin method (4000 μg/L) was four times higher than that of the HRP method (1000 μg/L). Figure 8 is the chromatogram obtained by two methods. H2O2, HMHP, and MHP were detected at the retention times of 6, 7.7, and 12 min. The signal values of H2O2, HMHP, and especially, MHP in the HRP method were significantly higher than those in the Hemin method (Figure 8). This result indicates that the sensitivity of the HRP method in detecting H2O2, HMHP, and MHP was higher than that of the Hemin method. Zhang and Dasgupta [13] studied the kinetic profiles of HRP and hemin catalytic systems for analyzing H2O2. Their results indicated that the fluorescence development rate of HRP and Hemin was 80% and 55% of the highest catalytic activity of hematin after 30-s reactions. The initial rate of fluorescence development with HRP was higher than that with hematin. The reaction time was about 15 s in this study, meaning that the HRP method showe d more sensitivity to H2O2 and HMHP than the hemin method. The above results indicate that the relative sensitivities of the HRP and Hemin methods in detecting H2O2 in this study were different from the data of Zhang and Dasgupta [13] and Qi [14]. Zhang and Dasgupta [13] mainly studied the fluorescence kinetics of HRP and hematin. They did not examine the analysis method of peroxides. They gave HRP and hematin calibration data but did not explain any analysis conditions. While analyzing peroxides, many factors, such as enzyme activity and pH value of the reaction system, can affect the fluorescence reaction that determines the magnitude of signal value. Therefore, the difference mentioned above between this study and Zhang and Dasgupta [13] was not fully understood. Qi [14] investigated the analysis method of peroxides using Hemin instead of HRP. However, the concentration (Table 4), manufacturer, date of manufacture of HRP, and the filling material and manufacturing process of the chromatographic column used in this study are different from Qi [14]. These factors may cause differences in the relative sensitivities of the HRP and Hemin methods in detecting H2O2 between the two methods. As for MHP, the HRP method exhibited much higher sensitivity than the Hemin method [13].
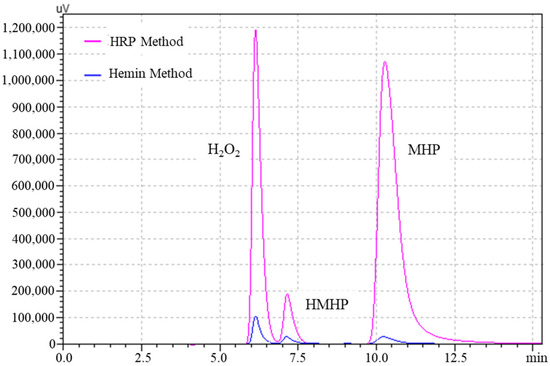
Figure 8.
Chromatogram of peroxides analysed by two methods.

Table 4.
The concentration and flow rate of HRP in the reaction system used in this study and ref. [14].
3.2.3. Precision
The low concentration (20 μg/L), medium concentration (400 μg/L), and high concentration (800 μg/L) of the H2O2 standard curve were analyzed six times to evaluate the precision of the two methods (Table 5). The RSD of the six results measured H2O2 solution at low, medium, and high concentrations of 0.44%, 0.49%, and 0.35% for the HRP method, respectively. Similarly, these low, medium, and high concentrations were 0.97%, 0.49%, and 0.47% for the Hemin method, displaying that the repeatability of the two methods was excellent.

Table 5.
Average value and RSD of six analysis results of H2O2 standard solution with different concentrations.
3.2.4. Accuracy
The accuracy of the two methods was assessed by adding a given amount of H2O2 standard solution to the actual sample and calculating the H2O2 recovery rate. The results demonstrated that the recovery rates were 97.8% and 101.6% in the HRP and Hemin methods, respectively, indicating that both methods were highly accurate (Table 6).

Table 6.
Recovery rates of H2O2 by two methods.
3.2.5. Applicability of Methods
The results presented in Figure 6 demonstrated that the catalytic reaction rate using the HRP method was free from temperature effects within 15–40 °C. In contrast, the Hemin method’s rate increased with increased temperature (Figure 6). This result suggests that the HRP method has broader applicability than the Hemin method.
The above results show that the HRP method had a lower detection limit, higher sensitivity, and better applicability for analyzing atmospheric H2O2 and MHP than the Hemin method. The Hemin method is more economical than the HRP method.
3.3. Measurement of Atmospheric Peroxides Concentrations
Atmospheric peroxide concentrations were measured using the HRP method from 07:00 to 19:00 for eight days in September 2016. A total of 96 data sets were obtained. During the period, the measurements of blank samples, parallel samples, and spiked recovery rates in the whole monitoring process were conducted twice a day to ensure the precision and accuracy of the measurements. The relative errors of the two parallel samples ranged from 2.5% to 6.3%, and the recovery rates ranged from 96% to 105%. These results indicated that the measurement of atmospheric H2O2 and MHP by the HRP methods had good repeatability and high accuracy.
During the measurement period, only H2O2 and MHP were quantitatively detected. The concentrations of H2O2 ranged from 0.13 ppb to 1.6 ppb, with an average value of 0.60 ± 0.37 ppb. Similarly, the MHP concentrations ranged from 0.020 ppb to 0.21 ppb with an average value of 0.081 ± 0.039 ppb, respectively (Table 7). Their concentrations were significantly higher on sunny days than cloudy days (Table 8, Figure 9) because H2O2 and MHP were secondary products of photochemical reactions. Moreover, stronger solar radiation and higher temperature on sunny days promoted the production of H2O2 and MHP.

Table 7.
Concentrations of H2O2 and MHP in Beijing, September 2016 (ppb).

Table 8.
Concentrations of H2O2 and MHP were observed on sunny days and cloudy days in September 2016, Beijing (ppb).
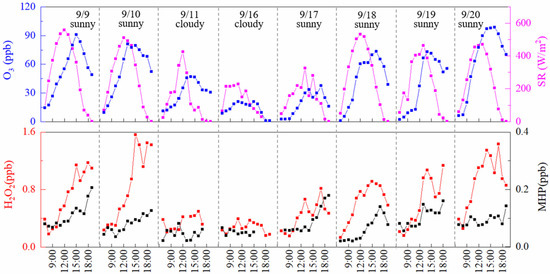
Figure 9.
The diurnal variation of the concentrations of O3, H2O2, and MHP in September 2016, Beijing.
The concentrations of O3 and H2O2 generally showed diurnal variations similar to those of solar radiation. On most days, their concentrations started to increase with the increase of solar radiation from 9:00 and peaked at 14:00 or 15:00 when the solar radiation was high. This is primarily induced by photolysis and O3 and the photolysis and photooxidation of VOCs emitted from anthropogenic and natural sources. In addition, H2O2 concentration showed a second peak at 17:00–18:00 when the solar radiation decreased to a lower level on most days, whereas O3 did not show a second peak. This may be caused by the reaction of O3 and a large amount of olefins emitted from motor vehicles during the evening rush hour [25]. The photolysis of NO2 generates O3, and the reduction of solar radiation leads to a decrease in O3 generation. MHP concentration showed a different diurnal variation from that of H2O2. MHP concentration increased from around noon with fluctuations on most sunny days, and the highest value occurred after 17:00. This result indicates that MHP, like H2O2, was also generated by photochemical reactions; however, it also has different production and reduction pathways from H2O2 [26].
4. Conclusions
The optimum analytical conditions for determining peroxides using the HRP and Hemin methods were investigated in this study. The results indicated that the optimum excitation and emission wavelengths are 315 nm and 405 nm, respectively, for the two methods. The optimum flow rates of the mobile phase, enzyme reagent, and alkali solution for the HRP method are 0.5, 0.2, and 0.1 mL/min, respectively. Those of the mobile phase and enzyme reagent for the Hemin method are 0.3 and 0.2 mL/min, respectively. Compared with the Hemin method, the HRP method has a lower detection limit, higher sensitivity, and better applicability for analyzing atmospheric H2O2 and MHP. The HRP method is more suitable for H2O2 and MHP detection, which requires low detection limits and high sensitivity. In contrast, the Hemin method was better for detecting hydroxyl alkyl peroxides (C ≥ 3) and had lower analysis costs.
The maximum H2O2 and MHP levels were 1.6 and 0.21 ppb, and the average concentrations of H2O2 and MHP were 0.60 ± 0.37 ppb and 0.081 ± 0.039 ppb in Beijing in September 2016, respectively. The concentrations of H2O2 and MHP were higher on sunny days than on cloudy days. They were the lowest in the morning on most sunny days and gradually increased. Two peaks of H2O2 concentrations were observed at 13:00–17:00 on most sunny days, whereas the MHP concentration reached the peak value after 17:00. H2O2 and MHP were mainly generated from photochemical reactions. The reaction of O3 and olefins emitted by motor vehicles during the evening rush hours also increased H2O2 concentrations.
Author Contributions
Conceptualization, J.S. and X.C.; methodology, X.C.; software, J.S.; validation, B.L. and Y.R.; formal analysis, Y.N.; investigation, X.Z.; resources, Y.N. and X.Z.; data curation, J.S.; writing—original draft preparation, J.S.; writing—review and editing, J.S., B.L. and X.C.; visualization, J.S. and Y.N.; supervision, B.L. and Y.R.; project administration, Y.R.; funding acquisition, Y.R. All authors have read and agreed to the published version of the manuscript.
Funding
This research was funded by the National Natural Science Foundation of China (NSFC) (Grant No. 42075182) and the Key Project of Heavy Air Pollution Cause and Control (No. DQGG202111).
Institutional Review Board Statement
Not applicable.
Informed Consent Statement
Not applicable.
Data Availability Statement
Not applicable.
Acknowledgments
This study was supported by the National Natural Science Foundation of China (NSFC) (Grant No. 42075182) and the Key Project of Heavy Air Pollution Cause and Control (No. DQGG202111). We thank the participants in our measurements for their help and support throughout this research.
Conflicts of Interest
The authors declare no conflict of interest.
References
- Gunz, D.W.; Hoffmann, M.R. Atmospheric chemistry of peroxides: A review. Atmos. Environ. Part A Gen. Top. 1990, 7, 1601–1633. [Google Scholar] [CrossRef]
- Chen, X.; Aoki, M.; Takami, A.; Chai, F.; Hatakeyama, S. Effect of ambient-level gas-phase peroxides on foliar injury, growth, and net photosynthesis in Japanese radish (Raphanus sativus). Environ. Pollut. 2010, 158, 1675–1679. [Google Scholar] [CrossRef] [PubMed]
- Xu, S.F.; Zheng, Z.W.; Xu, S. Measuring Method for Hydrogen Peroxide in Liquid Phase and Its Progress at Home and Abroad. China Saf. Sci. J. 2007, 3, 166–170. [Google Scholar]
- Jackson, A.V.; Hewitt, C.N. Hydrogen peroxide and organic hydroperoxide concentrations in air in a eucalyptus forest in central Portugal. Atmos. Environ. 1996, 6, 819–830. [Google Scholar] [CrossRef]
- Chen, X.; Aoki, M.; Zhang, S.; Zhang, J.; Nozoe, S.; Komori, D.; Takami, A.; Hatakeyama, S. Observation of hydrogen peroxide concentrations in a Japanese red pine forest. J. Atmos. Chem. 2008, 60, 37–49. [Google Scholar] [CrossRef]
- Hua, W.; Chen, Z.; Jie, C.; Kondo, Y.; Hofzumahaus, A.; Takegawa, N.; Chang, C.; Lu, K., III; Miyazaki, Y.; Kita, K.; et al. Atmospheric hydrogen peroxide and organic hydroperoxides during PRIDE-PRD’06, China: Their concentration, formation mechanism and contribution to secondary aerosols. Atmos. Chem. Phys. 2008, 8, 6755–6773. [Google Scholar] [CrossRef]
- Takami, A.; Shiratori, N.; Yonekura, H.; Hatakeyama, S. Measurement of hydroperoxides and ozone in Oku-Nikko area. Atmos. Environ. 2003, 37, 3861–3872. [Google Scholar] [CrossRef]
- Sakugawa, H.; Kaplan, I.R. Observation of the Diurnal Variation of Gaseous H2O2 in Los Angeles Air Using a Cryogenic Collection Method. Aerosol Sci. Technol. 1990, 12, 77–85. [Google Scholar] [CrossRef]
- Zika, R.G.; Saltzman, E.S. Interaction of ozone and hydrogen peroxide in water: Implications for analysis of H2O2in air. Geophys. Res. Lett. 1982, 9, 231–234. [Google Scholar] [CrossRef]
- Lazrus, A.L.; Kok, G.L.; Gitlin, S.N.; Lind, J.A.; McLaren, S.E. Automated fluorimetric method for hydrogen peroxide in atmospheric precipitation. Anal. Chem. 1985, 57, 917–922. [Google Scholar] [CrossRef]
- Guilbault, G.G.; Kramer, D.N.; Hackley, E.B. New substrate for fluorometric determination of oxidative enzymes. Anal. Chem. 1967, 39, 271. [Google Scholar] [CrossRef]
- Hellpointner, E.; Gäb, S. Detection of methyl, hydroxymethyl and hydroxyethyl hydroperoxides in air and precipitation. Nature 1989, 337, 631–634. [Google Scholar] [CrossRef]
- Zhang, G.; Dasgupta, P.K. Hematin as a peroxidase substitute in hydrogen peroxide determinations. Anal. Chem. 1992, 64, 517–522. [Google Scholar] [CrossRef] [PubMed]
- Qi, B.; Tang, X.Y.; Zhang, Y.H.; Shao, K.H.; Hu, M.; Chen, Z.M. Determination of Hydrogen Peroxide and Hydrophilic Organic Peroxides by High-Performance Liquid Chromatography with Hemin as a Peroxidase Substitute. Chin. J. Anal. Chem. 1998, 26, 1041–1046. [Google Scholar]
- Kok, G.L.; McLaren, S.E.; Stafflbach, T.A. HPLC Determination of Atmospheric Organic Hydroperoxides. J. Atmos. Ocean. Technol. 1995, 12, 282–289. [Google Scholar] [CrossRef][Green Version]
- Lee, M.; Noone, B.C.; O’Sullivan, D.; Heikes, B.G. Method for the collection and HPLC analysis on hydrogen peroxide and C1 and C2 hydroperoxides in the atmosphere. J. Atmos. Ocean. Technol. 1995, 12, 1060–1070. [Google Scholar] [CrossRef]
- Xu, J.R.; Chen, Z.M. Determination of Peroxides in Environmental Samples by High Performance Liquid Chromatography with Fluorescence Detection. Chin. J. Chromatogr. 2005, 23, 366–369. [Google Scholar]
- Kurth, H.H.; Gaeb, S.; Turner, W.V.; Kettrup, A. A high-performance liquid chromatography system with an immobilized enzyme reactor for detection of hydrophilic organic peroxides. Anal. Chem. 1991, 63, 2586–2589. [Google Scholar] [CrossRef]
- Staffelbach, T.A.; Kok, G.L. Henry’s Law Constants for Aqueous Solutions of Hydrogen Peroxide and Hydroxymethyl Hydroperoxide. J. Geophys. Res. Atmos. 1993, 98, 12713–12717. [Google Scholar] [CrossRef]
- Vaghjiani, G.L.; Ravishankara, A.R. Absorption Cross Sections of CH3OOH, H2O2, and D2O2Vapors between 210 and 365 nm at 297 K. J. Geophys. Res. Atmos. 1989, 94, 3487–3492. [Google Scholar] [CrossRef]
- Cofer, W.R.; Collins, V.G.; Talbot, R.W. Improved aqueous scrubber for collection of soluble atmospheric trace gases. Environ. Sci. Technol. 1985, 19, 557–560. [Google Scholar] [CrossRef] [PubMed]
- Sauer, F.; Limbach, S.; Moortgat, G.K. Measurement of hydrogen peroxide and individual organic peroxides in the marine troposphere. Atmos. Environ. 1997, 31, 1173–1184. [Google Scholar] [CrossRef]
- Li, W.; Su, W.H. Determination of hydrogen peroxide in air and precipitation by automatic fluorescence method. Environ. Chem. 1987, 6, 23–29. [Google Scholar]
- Liu, X.Z.; Xie, C.X.; Shi, N.; Xu, W. Research on decomposition behavior of hydrogen peroxide solution. Qilu Petrochem. Technol. 2009, 37, 99–102. [Google Scholar]
- Zhang, Q.; Liu, J.; He, Y.; Yang, J.; Gao, J.; Liu, H.; Tang, W.; Chen, Y.; Fan, W.; Chen, X. Measurement of hydrogen peroxide and organic hydroperoxide concentrations during autumn in Beijing, China. J. Environ. Sci. 2018, 64, 72–81. [Google Scholar] [CrossRef]
- Sauer, F.; Beck, J.; Schuster, G.; Moortgat, G.K. Hydrogen peroxide, organic peroxides and organic acids in a forested area during FIELDVOC’94. Chemosphere-Glob. Chang. Sci. 2001, 3, 309–326. [Google Scholar] [CrossRef]
Publisher’s Note: MDPI stays neutral with regard to jurisdictional claims in published maps and institutional affiliations. |
© 2022 by the authors. Licensee MDPI, Basel, Switzerland. This article is an open access article distributed under the terms and conditions of the Creative Commons Attribution (CC BY) license (https://creativecommons.org/licenses/by/4.0/).