1. Introduction
The significance of deep stratospheric dry intrusions into the troposphere is high for a variety of aspects, including the interaction with convection, extratropical cyclones and fronts, adverse surface weather and variability in low-level ozone concentrations. Geostationary satellite observations provide a means to study atmospheric dynamical processes. The images in water vapor absorption channels are frequently used in synoptic scale analysis of upper-level flow and vertical motions (especially for jet-stream analysis), identifying dry air emanating from the lower stratosphere, and permitting the diagnosis of its intrusion and subsidence in the troposphere [
1,
2,
3]. Such intrusions can also modulate the planetary boundary layer and affect the ignition and spread of wildfires [
4]. Satellite observations are broadly used in studies related to biomass burning, including active fire location and energy release, in addition to trace gas concentrations [
5,
6]. High temporal frequency observations by the Spinning Enhanced Visible and Infra-Red Imager (SEVIRI) instrument onboard the Meteosat series of geostationary meteorological satellites are used in this area of research and operational applications. These applications cover a wide range of topics, from developing of early warning systems [
7] to characterizing climate-forest interactions towards understanding the vulnerability of land systems to fire on a regional scale [
8].
The present study was organized around two key issues: (i) the influence of deep stratospheric dry intrusions on wildfire activity; and (ii) the influence of stratospheric intrusions and wildfire emissions on low-level ozone concentration.
Several studies of large fires in Australia, Tasmania and USA have shown a link between fire activity and dry air intrusions in the lower troposphere [
9,
10,
11,
12,
13]. For instance, the study by Fox-Hughes [
12] of Tasmania wildfire events showed that for 63% of the investigated cases the rapid increase in fire activity was accompanied by a dry band in satellite water vapor (WV) imagery, which is indicative of a pronounced descent of upper-tropospheric or stratospheric air. These air masses are normally much drier than the lower tropospheric masses and have much higher potential vorticity (PV). When these descending upper-tropospheric or stratospheric air parcels reach the Earth’s surface, they affect the surface moisture and wind speed, which could generate a spike in fire activity.
Using data from observations and numerical model simulations, Kaplan et al. [
14] identified deep tropospheric circulations as one of the physical mechanisms responsible for forming a favorable environment for extreme surface drying in the case of a wildfire in south-central New Jersey, USA. They argued that the process is strongly forced by mass and momentum adjustments under the right exit region of a polar jet streak, overtaking and modifying a weak surface cold front. Studies on the relationships between the synoptic-scale atmospheric circulation conditions and local-scale surface environment of wildfires are also reported by Ghavidel et al. [
15]. Synoptic-scale processes responsible for producing severe winds that resulted in an extensive high-intensity fire in the Gilan and Mazandaran forests in northern Iran are discussed by Mofidi et al. [
16].
The present work provides observational evidence for the role of dry tropospheric intrusions, as seen from satellite observations, in the rapid surface or near-surface drying and/or the increasing wind speed processes that influence the wildfire evolution. The WV imagery clearly shows the existence of a dry intrusion at the upper troposphere, but it cannot provide further information on the penetration of this dry stratospheric air within mid–low-level tropospheric layers. Additional data on the detailed vertical distribution of moisture is needed to provide clear evidence that the strengthening of the wildfires is the result of the upper tropospheric low humidity air advection to the Earth’s surface. Although radiosondes may be used to infer this information, such measurements are only available with limited temporal and spatial resolution, which reduces their potential for use in the analysis of rapidly evolving events such as wildfires. Consequently, there is a demand for alternative observational data to confirm the exchange of the dry stratospheric with lower tropospheric air masses. Following these considerations, advanced aims were established for our study: to investigate the potential of products derived from the Infrared Atmospheric Sounding Interferometer (IASI) onboard Metop satellites and the Cross-track Infrared Sounder (CrIS) onboard Suomi NPP and JPSS satellites; to consolidate the upper-level dry intrusions and the dynamic dark features seen in the SEVIRI WV imagery; and to highlight their usefulness on fire weather conditions analyses (see also Georgiev and Tjemkes [
17]).
An essential result of stratospheric dry intrusions is the deep vertical transport of ozone-rich air masses. Applying cluster analysis to the vertical component of the isentropic trajectories, Moody et al. [
18] showed that the most extreme concentrations of ozone occurred with rapidly descending air from mid-tropospheric levels. Zhao et al. [
19] performing simulation experiments and concluded that stratospheric intrusions are of great importance in the transport of ozone-enriched air from the stratosphere to the middle and lower troposphere. At the same time, the role of wildfires in the increase in low-level ozone concentrations in nearby areas has been broadly studied and discussed in the literature [
20,
21,
22,
23]. Fire plumes originating in forest fires are rich in primary pollutants such as particles, carbon monoxide, non-methane volatile organic compounds and nitrogen oxides. Photochemical transformations of these pollutants can produce secondary ones, including ozone. The studies of Chan et al. [
24] and Bertschi and Jaffe [
25] showed well-defined layers of increased ozone up to 6 km from the ground surface that were considered to be highly correlated with long-distance wildfire plumes. Although the role of wildfires in the increase in low-level ozone concentrations in nearby urban areas has been studied from measurements of sampling stations, aircraft measurements and/or by using chemical models, the evaluation of this effect is particularly complex due to the mixing of local emissions with the fire-derived pollution plumes (Crounse et al. [
26]). More recently, Zhang et al. [
27] concluded that the stratospheric intrusions resulted in significant drying and the ozone increase of the troposphere, and long-range transport of smoke inside wildfire plumes also increased the ozone concentrations over the Tibetan Plateau. Some authors, e.g., Singh et al. [
28], have used, where possible, a number of chemical filters to remove or minimize stratospheric influences on the increase in low-level ozone as a confounding factor in the studies of ozone emissions related to wildfires. About 20% of their dataset was removed as being predominantly stratospheric.
In our study, we use ozone profiles retrieved from measurements of meteorological satellites to investigate their potential to contribute to the identification of localized ozone increase in complex cases, thus enabling us to understand the sources and mechanisms of this enhancement. Ozone retrievals from the IASI and CrIS instruments were analyzed in order to investigate their potential to distinguish the effect of low-level ozone enhancement due to strong subsidence of ozone-rich mid-tropospheric air, in association with the stratospheric dry intrusion, from the ozone produced from the fire-emission sources within the local boundary layer.
2. Materials and Methods: Satellite Imagery and Hyperspectral Infrared Observations
The current work used three methods to explore spaceborne observations. The first method directly explored the observations by the SEVIRI instrument onboard the Meteosat Second Generation (MSG) geostationary satellites. SEVIRI observes outgoing radiation in a number of spectral bands. Because of the high refresh rate of its imagery (5 to 15 min), SEVIRI data are ideal for following and analyzing rapidly evolving atmospheric circulation systems and processes. Here we consider the radiation of the 6.2 µm SEVIRI channel (referred to as the WV-band), which is sensitive to the water vapor content in the middle and upper troposphere (400–600 hPa). Considering water vapor as a tracer, the imagery in the WV-band offers an observation of the air motion. Ascending moist air tends to moisten, whereas subsidence of air masses tends to dry the upper troposphere. At the same time, the vertical moving air parcels are displaced horizontally by atmospheric dynamics. Thus, most of the significant structures seen in Meteosat WV imagery are linked to large-scale dynamical processes, which are responsible for vertical motion and deformation of the flow over deep atmospheric layers [
2]. By the same token, Meteosat WV imagery can help to infer information of extreme surface drying and/or strong wind gusting that may result in the intensification of fire activity. This is discussed in
Section 3.1 and
Section 4 of the present paper.
The second method was used to analyze hyperspectral infrared observations derived by the IASI and CrIS instruments, including the application of retrieval procedures that convert the IASI and CrIS radiances to vertical profiles of humidity and atmospheric gasses. These retrievals were used to study the effects of the upper-level dynamics in a deep tropospheric layer alongside the possible biomass burning effects in the environment of wildfires. The atmospheric profiles presented in
Section 4 and
Section 5 are generated by a processor developed in support of the future geostationary infrared sounder (IRS) onboard Meteosat Third Generation (MTG). The retrieval code was adapted to derive information on the vertical distribution of temperature, ozone, specific humidity, surface skin temperature and surface emissivity from hyperspectral infrared observations of spaceborne instruments such as IASI and CrIS. The implementation rigorously followed the optimal estimation theory presented by Rodgers [
29]. Application of the retrieval process to the indirect satellite measurements requires knowledge of the atmospheric state during the data collection (so-called prior or background). Then, the atmospheric state, which is consistent with the actual state and the prior, is determined by applying an iterative search method. Using the notation of Rodgers [
29], a single satellite measurement is considered as the outcome from a trial that has sampled an infinite set of possible measurements. In order to minimize the uncertainty (due to instrument noise, calibration errors, etc.) the following iterative set of equations is solved:
where
,
, I represents the identity matrix and α is the Marquardt–Levenberg control variable, which determines the relative contribution between the steepest decent and the Gauss–Newton search method in the minimalization routine (e.g., Rodgers [
29]).
In these equations, the target state (vertical profiles of temperature, specific humidity, ozone, surface temperature and surface emissivity) is indicated by , and the observations (measured radiance) by . The uncertainty on the satellite measurements is represented by , the a priori information of the state by , and the associated uncertainty by . A radiative transfer code (indicated by ) maps the state into radiance at the top of the atmosphere, to facilitate a meaningful comparison between the state and the observations , through the term: . Finally, the gradient of the radiative transfer at the top of the atmosphere with respect to the state () is indicated by the symbol . The superscript T indicates transpose.
We adopted the Optimal Spectral Sampling (OSS, Moncet et al. [
30]) as the radiative transfer code. OSS is a very efficient and accurate radiative transfer code. As it solves the radiative transfer equation at selected wavenumbers, it can be used to accurately calculate the radiance for any hyperspectral infrared instrument without any assumptions or simplifications, provided that the instrument characteristics are known. Since data from direct observations at the time of retrieved state were not available as background, the nearest ECMWF deterministic forecast and ensemble forecast information was used. The deterministic forecast was used to provide the state for the start of the iterative search (the first guess
). The ensemble forecast was used to provide the a priori information on the atmosphere and the associated uncertainty (
and
), which is refined with the assimilation of satellite data to obtain the profile.
A comparison of retrievals derived from IASI indirect observations, with accurate independent direct observations provided by the Integrated Global Radiosonde Archive [
31], indicate that the retrieved temperature has an almost zero bias (<0.1 K) up to the 100 hPa level, and a standard deviation of about 1 K. The retrieved specific humidity (expressed as dew point temperature) has a bias < 0.5 K for layers below 600 hPa, which then increases to 4 K at 200 hPa, and a nearly constant standard deviation of 5 K.
The third and final method for the utilization of satellite observations considers the use of advanced products, which are generated by using combinations of measured satellite radiances converted to brightness temperatures (BTs). In this study, the development and intensity of the wildfires were examined by the fire radiative power (FRP) product, operationally derived by EUMETSAT’s Satellite Application Facility on Land Surface Analysis (LSA SAF). The pixels containing active fires burning at the time of satellite scans are detected using the so-called geostationary Fire Thermal Anomaly (FTA) algorithm, which is fully described in Wooster et al. [
32] and Roberts et al. [
33]. The FRP computation relies on the Middle Infrared (MIR) method, which uses a combination of the observed fire pixel radiances in the NIR channel (3.9 µm) and a window channel (10.8 µm) of the SEVIRI instrument onboard the Meteosat satellite. The FRP product provides a way to estimate not only the location of vegetation fires, but also the amount of certain greenhouse gasses and thermal energy released. Finally, the interaction between synoptic-scale dynamic systems is illustrated by Air Mass RGB composite imagery (
Section 4) generated using data from SEVIRI infrared, water vapor and ozone absorption channels [
34]. The RGB product provides information about the stratosphere–troposphere air mass exchange, and also facilitates the analysis of the air mass origin and the monitoring of jet streams, cyclogenesis, PV maxima etc.
Three eastern Mediterranean case studies (
Table 1) are presented to demonstrate signatures of related atmospheric dynamical patterns seen in the satellite water vapor channel imagery. The corresponding conceptual models used to complement the observations are also briefly discussed.
4. Dry Intrusion Associated with Bent-Back front Development and the Effect of the Related Wind Gusts on Wildfire Intensification
On 23 July 2018, during the implementation of the Drought and fIre ObServatory and eArly waRning system (DISARM) Project [
7], wildfires broke out near Kineta and Mati at the west and east of Athens. The analyses of Lagouvardos et al. [
37] show an upper-level circulation pattern between 0000 and 1200 UTC on 23 July 2018 characterized by a positively tilted trough over the central Mediterranean, moving eastward and interacting with an intensifying subtropical ridge downstream. The net result of this convergence was a subtropical jet stream extending from southern Italy toward Greece, with a 25–35 m s
−1 jet streak at 500 hPa.
At the time of Kineta fire ignition (around 0900 UTC), the air temperature in the region of Athens reached around 38 °C and the air humidity was extremely low. However, these conditions are not entirely unusual for this time of year, because the summer months are most often hot and dry in Greece. What was specific for the development of this significant fire was the strength and fluctuation in the wind.
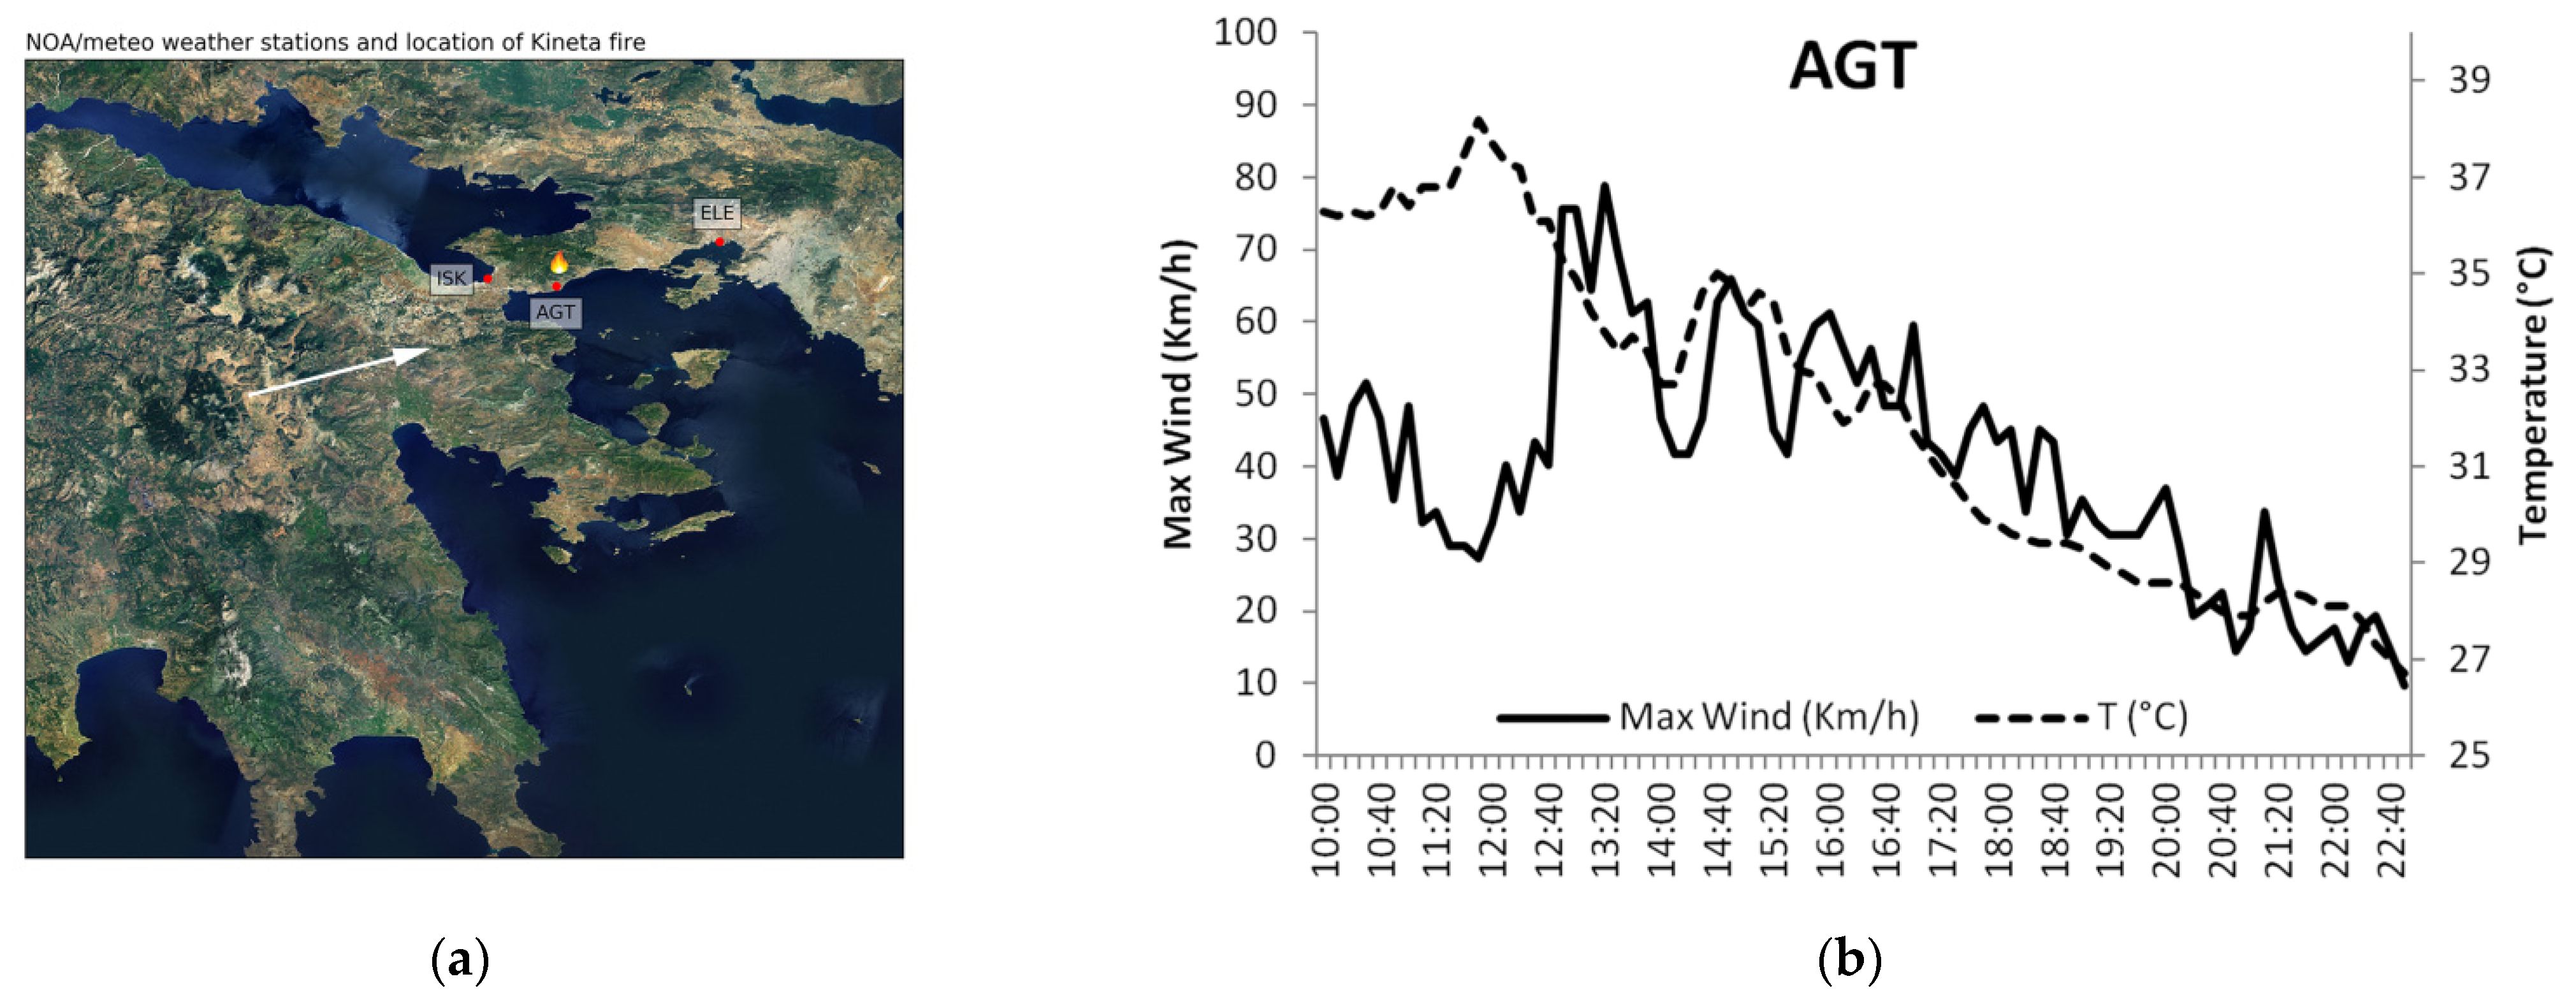
Figure 5a shows a map of the fire surroundings and the locations of three automatic meteorological stations (AMSs) of the National Observatory of Athens network [
38] operated by the National Observatory of Athens (NOA). The 10 min wind maxima and average air temperature measured at Agioi Theodoroi (AGT), which is the nearest to fire location AMS, are shown in
Figure 5b. During the fire development, a cold front passed (sharp decreasing of temperature after 1200 UTC to 1400 UTC) and wind gusts reached 80 km/h. The air temperature at AGT dropped from 38 °C at 1200 UTC to below 30 °C in the evening (
Figure 5b) but the winds gusting (30–40 km/h from 1700 to 1900 UTC) contributed very much to the development of this severe fire event during the night.
As in the case of
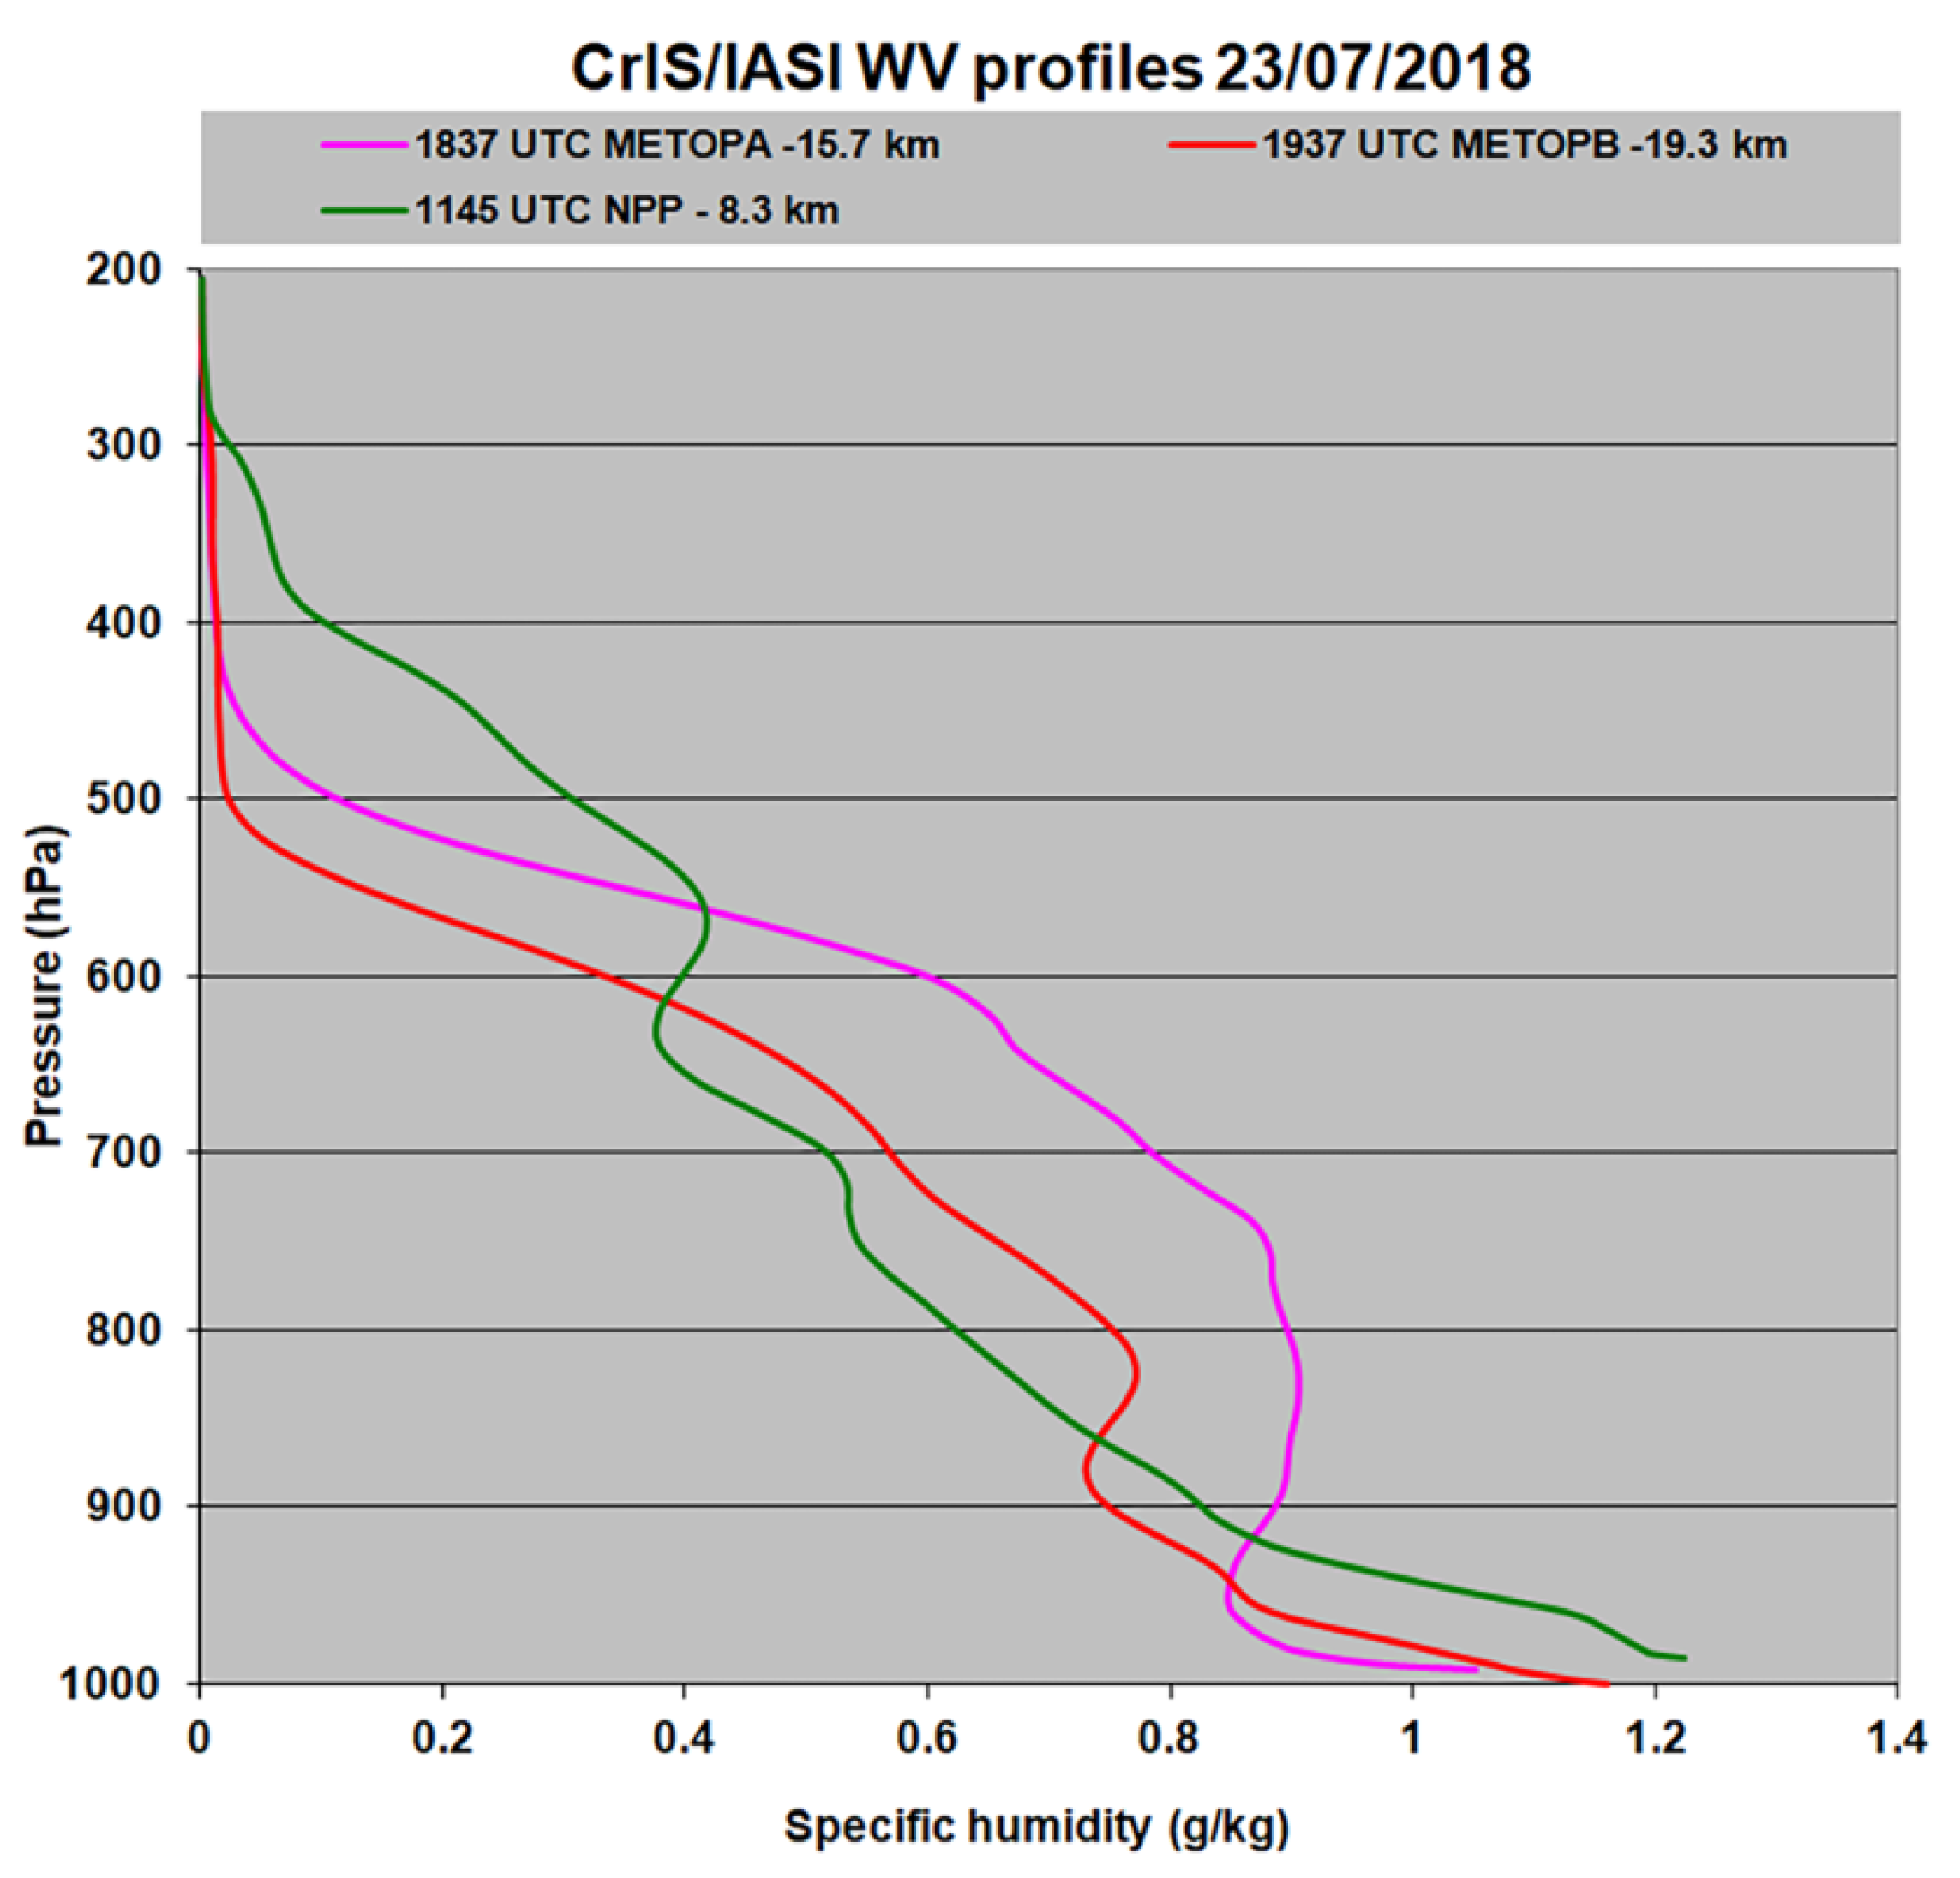
Section 3, on 23 July 2018, an upper-level dry intrusion affected the area of Kineta where the wildfire developed. The related tropopause folding is confirmed by the low values of specific humidity above the 600 hPa level depicted by the magenta and red curves derived from CrIS instrument measurement at 1837 UTC and 1937 UTC respectively (
Figure 6).
The FRP product shows strengthening of the released fire radiative power from 593 MW, in one SEVIRI pixel at 1145 UTC, to 1778 MW in three SEVIRI pixels at 1845 UTC, and then to 3059 MW in four SEVIRI pixels at 2045 UTC. However, unlike the case of
Section 3, the specific humidity in the layer of 600–900 hPa tends to increase from the time of fire ignition (green curve in
Figure 6) to the time of fire intensification in the evening (magenta and red curves). These humidity profiles do not provide evidence that the upper-level dry air has reached the low levels, affecting thus the surface air moisture and fire activity.
The synoptic analysis of Kartsios et al. [
39] revealed the presence of a positively tilted trough over the central Mediterranean and Balkans, propagating eastwards and interacting with the subtropical jet, resulting in a strong westerly flow over Greece. In terms of the PV concept, there is an interaction of the upper-level PV anomaly with the subtropical jet and related underlying baroclinic zone, which is a key difference in comparison to the case in
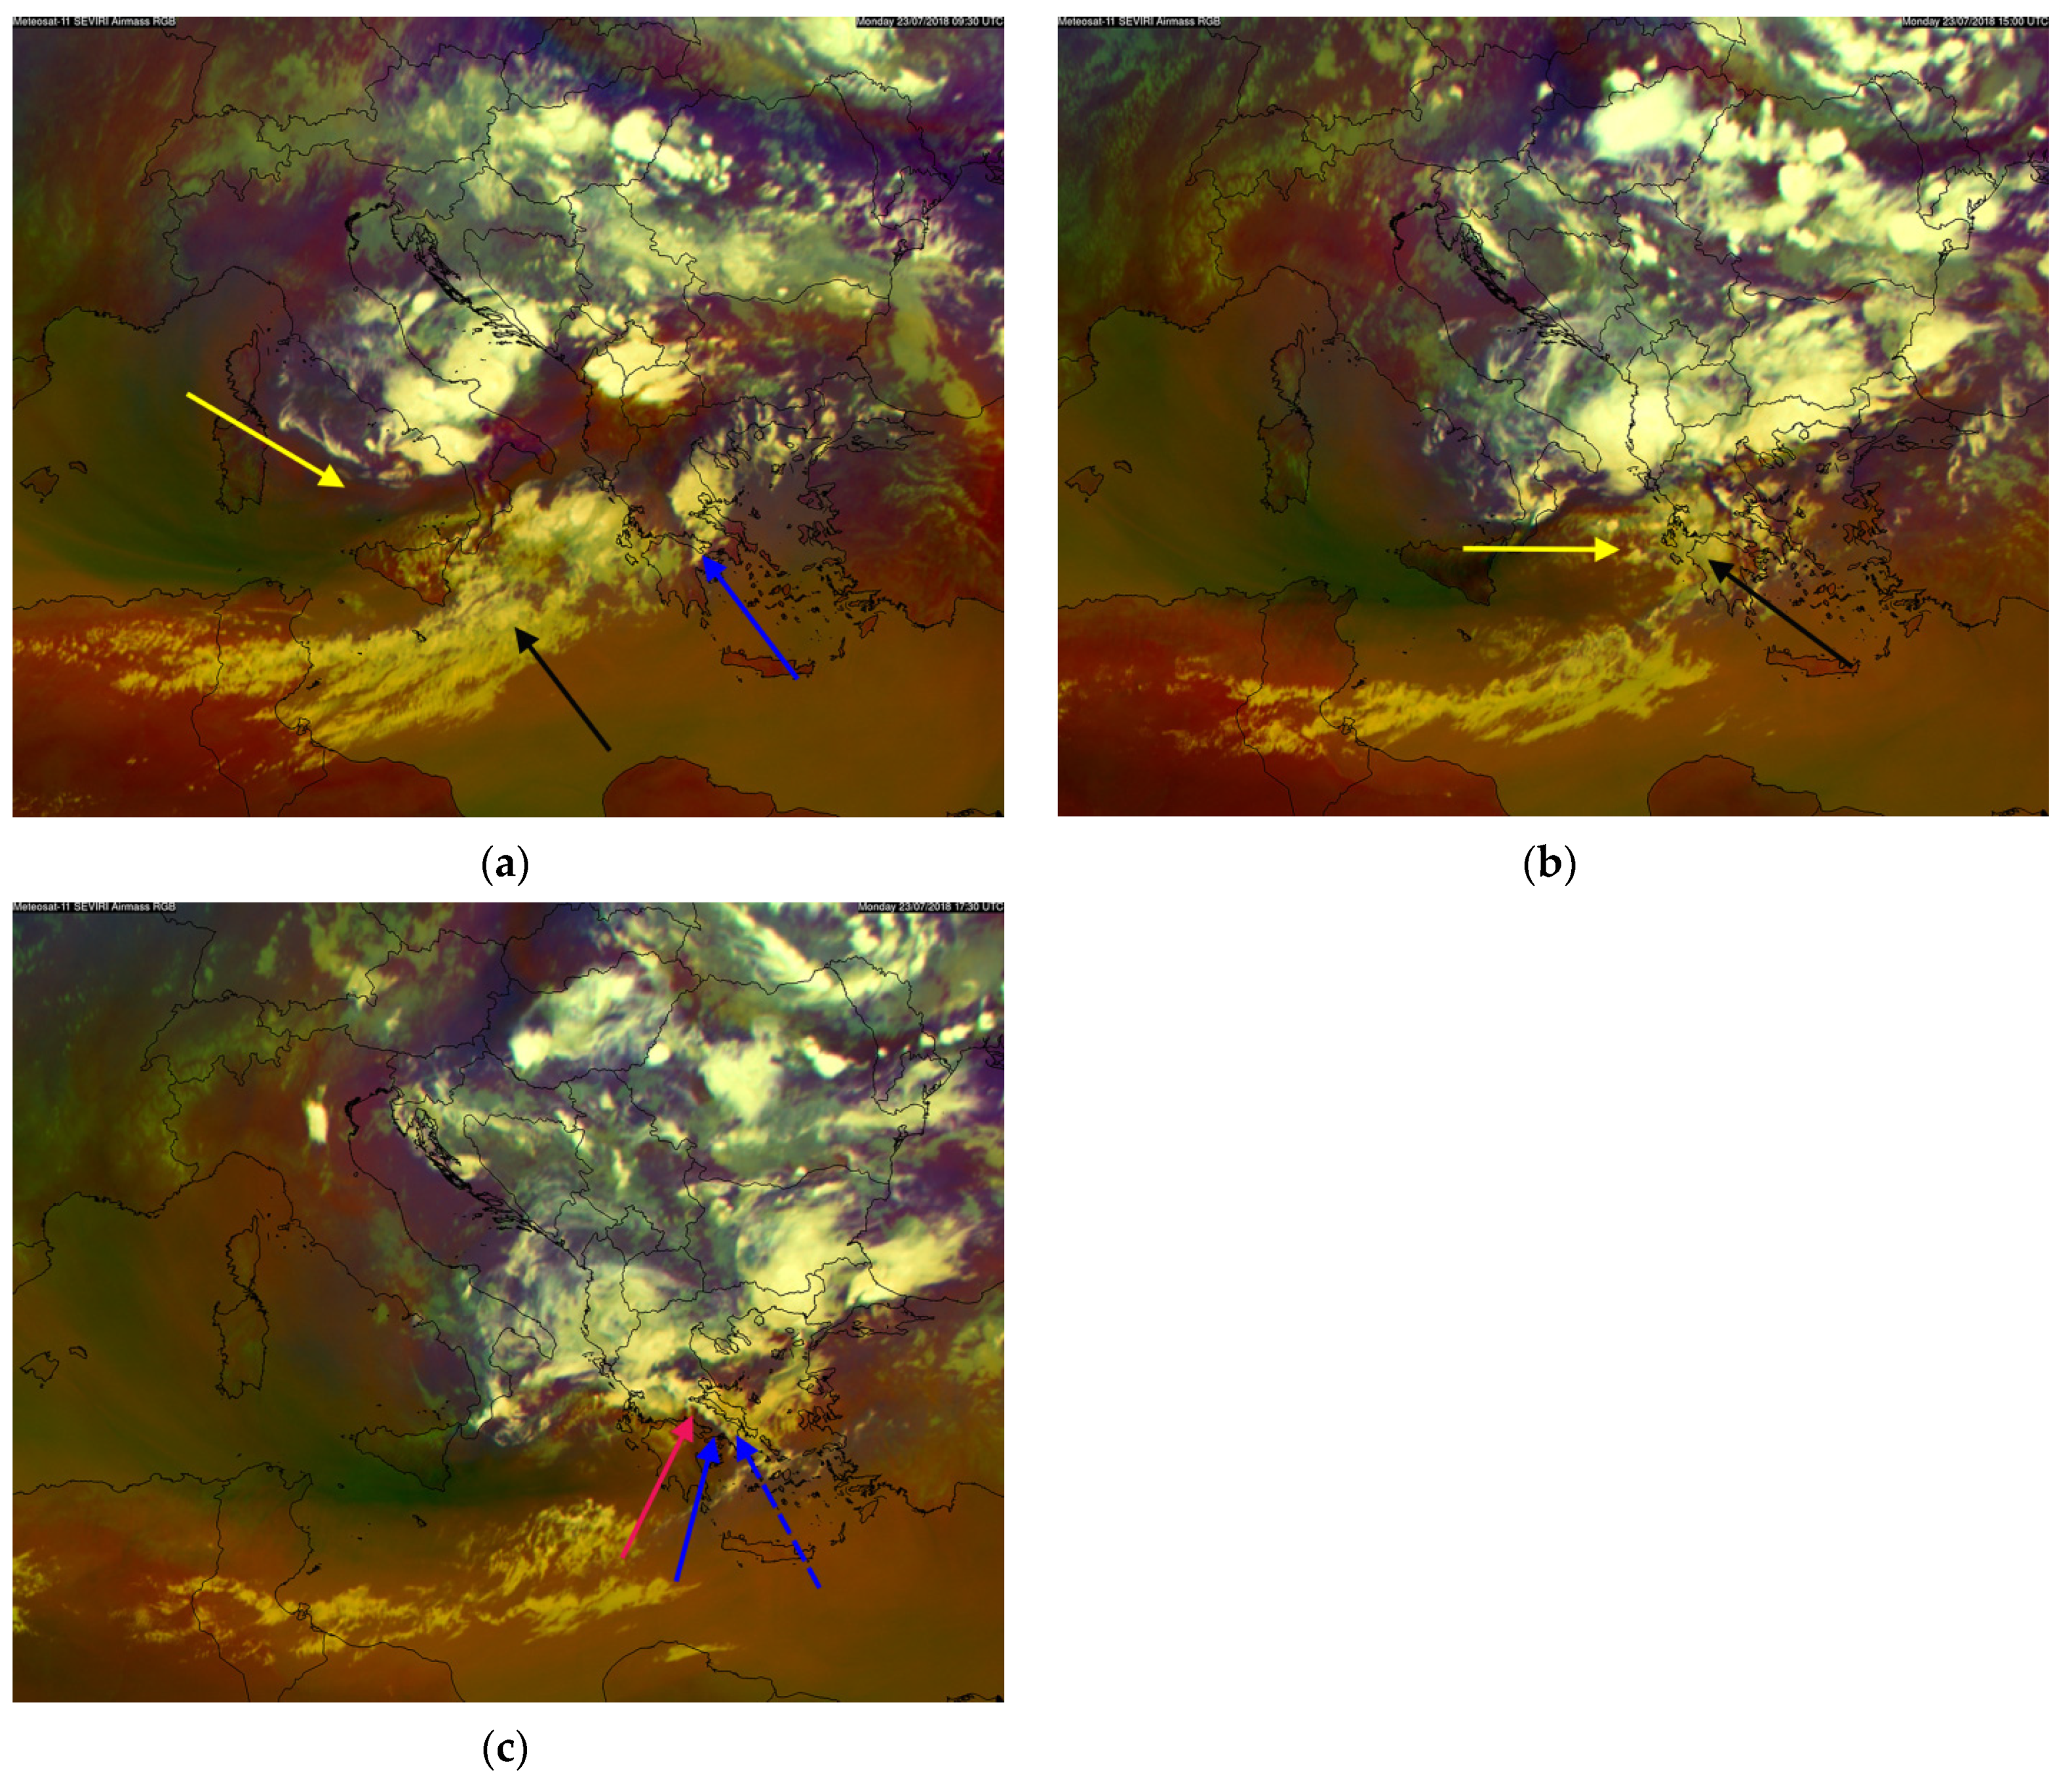
Section 3. The process can be seen in the Air Mass RGB composite shown in
Figure 7, where the tropopause folding and associated PV anomaly is colored reddish (indicated by the yellow arrow).
As a result of this mutual interaction, strong wind gusts of 80 km/h at AGT (
Figure 5b) were generated between 1300 and 1700 UTC, as reported by several other surface stations in the wider area [
39]. During this time, the satellite observations failed to detect the Kineta fire due to cloudy conditions. The middle- and low-level troposphere moisture content in the vicinity of the fire increased at 1837 UTC (magenta profile in
Figure 6) and at 1937 UTC (red profile in
Figure 6) but decreased slightly near the surface. After the PV anomaly advection overran the underlying baroclinic zone, an instant occlusion process occurred, as seen in
Figure 7b,c (for conceptual model see EUMeTrain/EUMETSAT [
40]). The occluded front is indicated by the magenta arrow in the satellite Air Mass RGB composite of
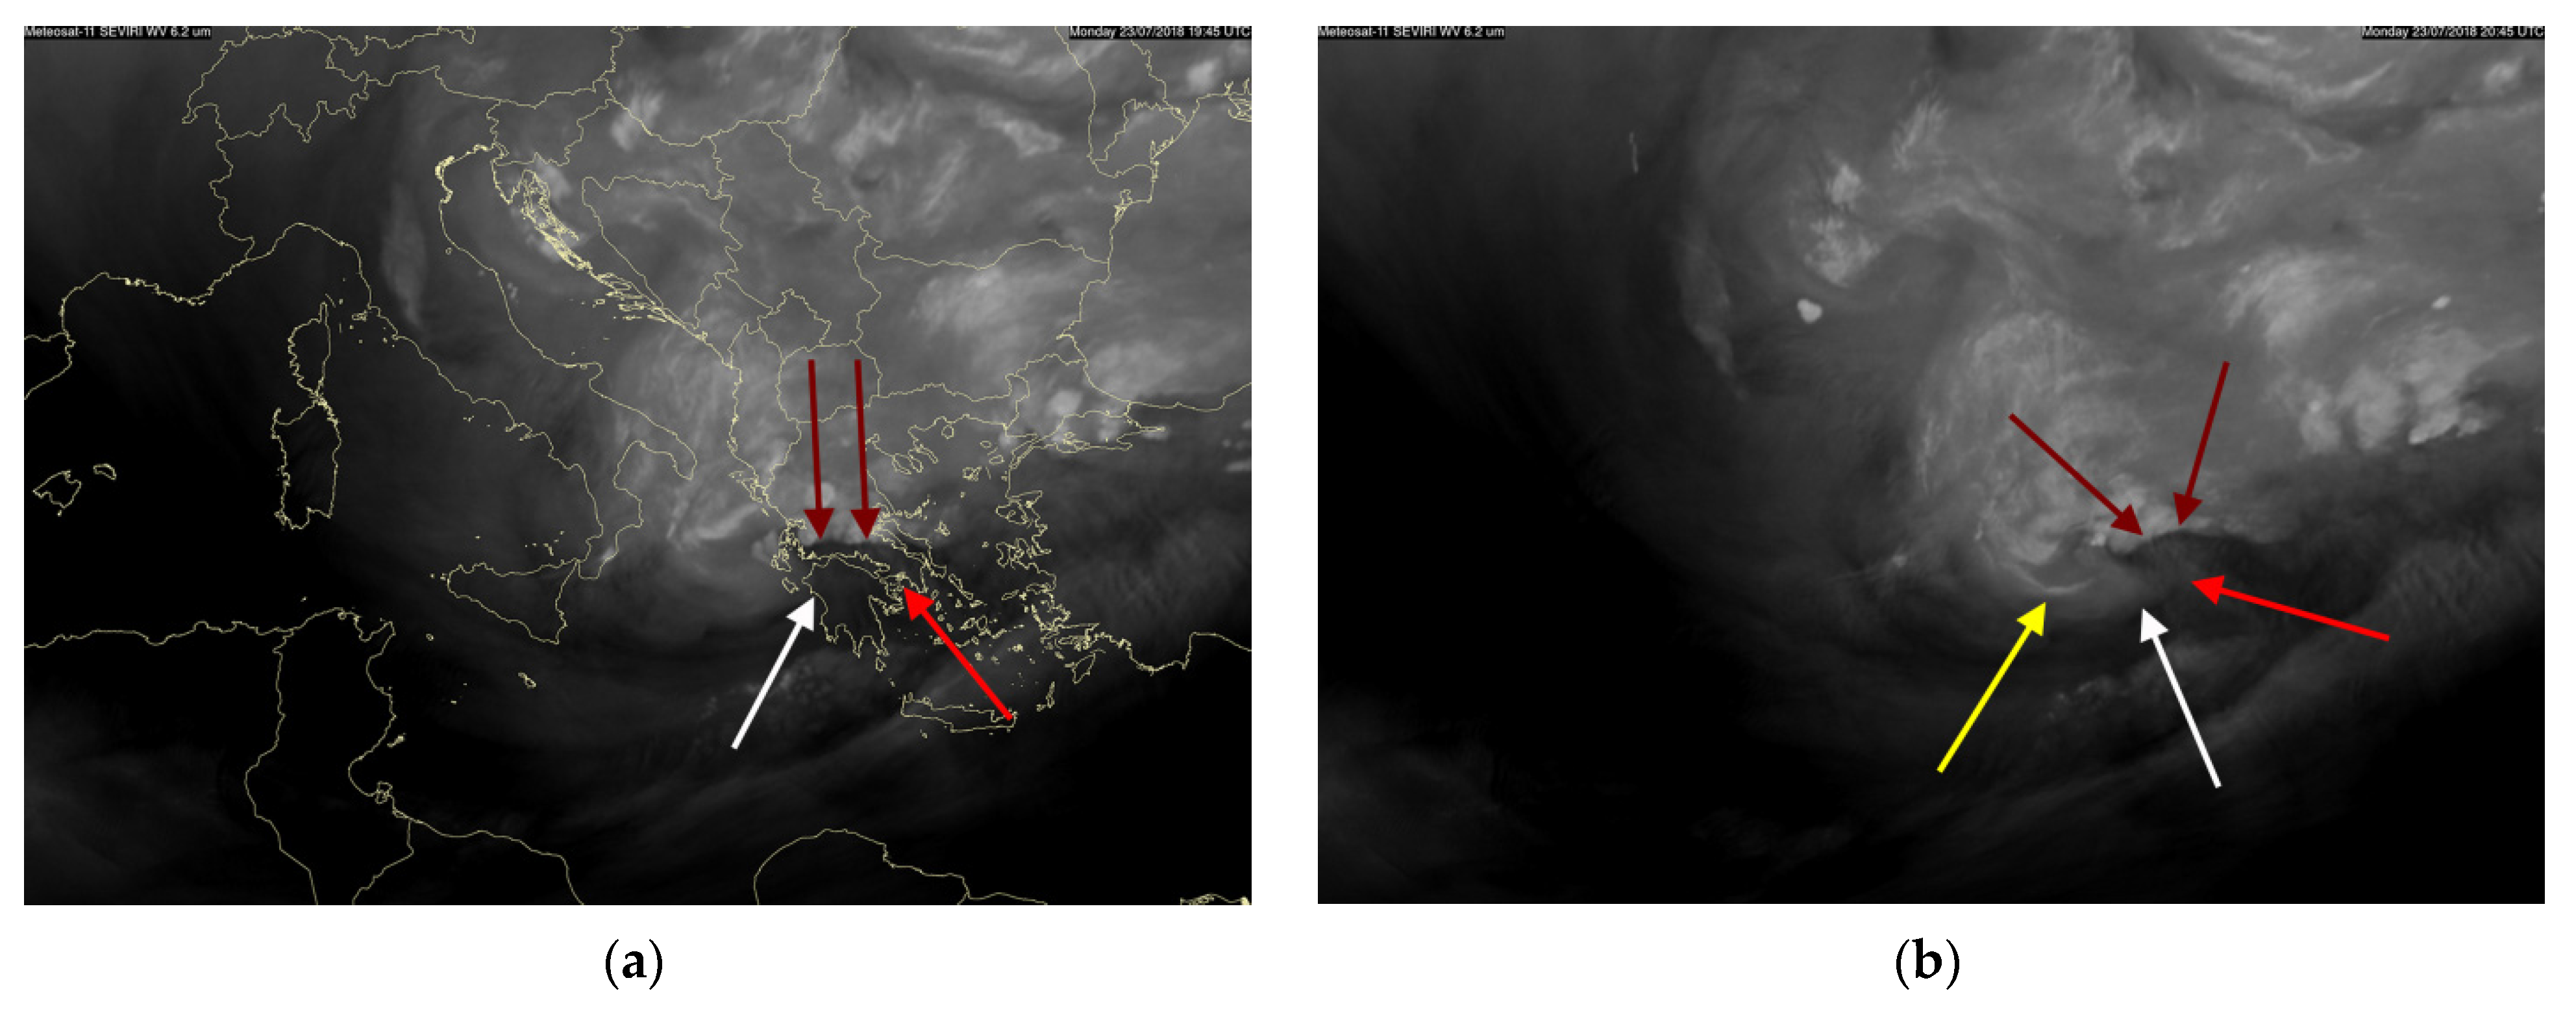
Figure 7c and distinctly seen in the WV images (brown arrows in
Figure 8a,b).
A critical factor for the further intensification of the fire during the night of 23 July (after 1800 UTC) was the wind speed fluctuations. The satellite imagery analysis suggests that these wind gusts near Kineta fire were related to the bent-back cold front evolution. As shown in Smart and Browning [
41], there are two kinds of jet-like features that give rise to the strong surface winds associated with the bent-back front. One is associated with the cold conveyor belt, situated on the cold side of, and close to, the sharp surface front of the bent-back front. This jet is referred to as the cold conveyor-belt jet. The other potential source of strong surface winds is the sting jet. The sting-jet effect is a result of descending air and related evaporative cooling which causes the air to become denser. This leads to a further acceleration of the downward flow towards the tip of the frontal cloud system when it begins to hook around the cyclone center, seen in the WV imagery as a “sting”-like feature. Processes leading to the formation of strong surface wind gusts within an idealized sting-jet extratropical cyclone are investigated by Rivière et al. [
42] using a high-resolution mesoscale model.
On 23 July 2018 a sting-jet-like feature associated with a PV anomaly appears in the WV imagery of
Figure 8a,b at the position of the white arrow, just ahead of the tip of the hook-shaped cloud head that accompanies the bent-back front. This is not a typical case of the sting-jet phenomenon, which is usually associated with rapidly deepening mid-latitude cyclones [
2]. The humidity profile (red profile of
Figure 6) near the time of the sting-jet appearance provides evidence for a sharp decrease in moisture content only in a thin layer near the 850 hPa level that may be due to evaporation of descending air. In this case, evaporation seems of minor importance compared to the larger-scale dynamical processes in generating the rapid increase in wind during the descent of the sting-jet air, as considered in Smart and Browning [
41] (see also [
42]). The simulations using the online coupled atmosphere-fire model WRF-SFIRE performed by Kartsios et al. [
39] confirm the downward transport of energy and momentum during the maximum wind speed occurrences in the case of the Kineta fire development.
To further assess the factors contributing to the increased fire risk, a mesoscale analysis was performed using data from the following three AMSs indicated as AGT, ISK and ELE on
Figure 5a respectively:
AGT, located approximately 3 km south of the fire location, and 15 km from the sting-jet feature (white arrow in
Figure 5a) on 23 July 2018 around 2030–2130 UTC;
ISK, located approximately 15 km west of the fire location. ISK was around 50 km behind the leading edge of the dry intrusion in the rear side of the occluded front around 1700–1900 UTC, and around 2030–2130 UTC it was very close to the sting-jet feature. This station, being situated to the west of the fire, was not influenced by the fire environment on 23 July due to the domination of north-westerly and westerly winds;
ELE, not influenced by the fire environment, was located at the leading edge of the dry intrusion in the rear side of the occluded front around 1700–1900 UTC, and around 2030–2130 UTC it was approximately 50 km from the sting-jet feature.
Figure 9 shows plots of 10 min maximum wind speed (continuous curves) and dew point depression (dashed curves) at the three stations. As seen in
Figure 9b, the near-surface humidity at the station closest to the fire (AGT) increased during the day, as indicated by the decrease in dew point depression (T-Td) from around 23 °C from 1200 to 1500 UTC to below 15 °C after 1900 UTC. However, the fire grew rapidly during the evening and the night of 23 July.
As seen in
Figure 9a,b, the wind reached its maximum values between 1200 UTC and 1400 UTC, when the baroclinic zone and associated cold front passed over Kineta (temperature curve in
Figure 5b). With the propagation of the dry air at 1500 UTC, the wind gusts at AGT and especially at ISK are closely related to the dry air intrusion, inferred by the maximization of the T-T
d difference. These wind fluctuations are associated with the upper-level vorticity maximum, which can be seen in
Figure 8b as a comma cloud shape, which is characteristic of the interaction between the upper-level PV anomaly and the low-level baroclinic zone.
After 1600 UTC, the wind gusts are associated with the dynamic effects in the cloud-free area near the occluded front. Later they relate to the sting-jet feature seen in the WV imagery.
Figure 9b shows that the correspondence between wind maxima and T-T
d minima is perfect at ISK because this was the station with the best location regarding this effect (closest to the sting-jet feature and far from the fire environment). AGT was nearest to the fire, and the dew point depression can be influenced by the fire temperature (in the existence of north-westerly winds) and the increasing moisture content (possibly due to evaporation of water used in the fire suppression operations).
There were several strong wind fluctuations from 1900 UTC to 2130 UTC that can be considered as an indication of favorable fire conditions and are associated with the upper-level dynamic features in the WV imagery. The wind gusts at ELE and ISK around 170–1900 UTC are associated with the leading edge of the dry intrusion in the rear side of the occluded front. However, ELE was located too far from the mesoscale sting-jet feature. This is the reason why the correspondence between wind gusts and low air humidity was not so well pronounced as in ISK and wind maxima were about 21 km/h between 1900-2130 UTC, half of those of ISK.
These wind gusts were not as strong as those associated with the larger-scale dynamical processes related to the cold front between 1200 UTC and 1400 UTC (
Figure 5). However, the surface winds associated with dynamical processes near the bent-back front usually change direction rapidly, making the prediction of fire spread difficult.
5. Satellite Observations of Ozone Production from Wildfire Emissions by IASI/CrIS Instruments
The summertime eastern Mediterranean experiences among the highest worldwide near-surface ozone values. Dafka et al. [
43] show that this is due to transport of pollutant-enriched air masses that react under the increased solar radiation, leading to ozone photochemical production and stratospheric intrusions of ozone-rich stratospheric air into the troposphere as a result of tropopause folds. The participation of all these factors in the formulation of ozone concentrations supports the notion of the high complexity of the problem (see also Verma et al. [
44]).
Several studies that deal with the ozone production in the areas of wildfires set considerations about the mechanisms of possible enhancement of the ozone concentrations in the lower troposphere due to the stratospheric intrusions as a result of PV anomalies [
18,
25,
45,
46]. In many other studies on the impact of large wildfires on ground level ozone concentrations, the deep stratospheric intrusions are not explicitly considered as a possible additional source of ozone [
20,
23,
24,
26]. The satellite data used for observational analyses in our study enable us to diagnose stratospheric intrusions and help to distinguish between the effect of increased ozone from low-level sources and the effect of vertical transport of ozone via subsidence.
5.1. Enhanced Ozone Concentrations Downwind of Wildfire Regions
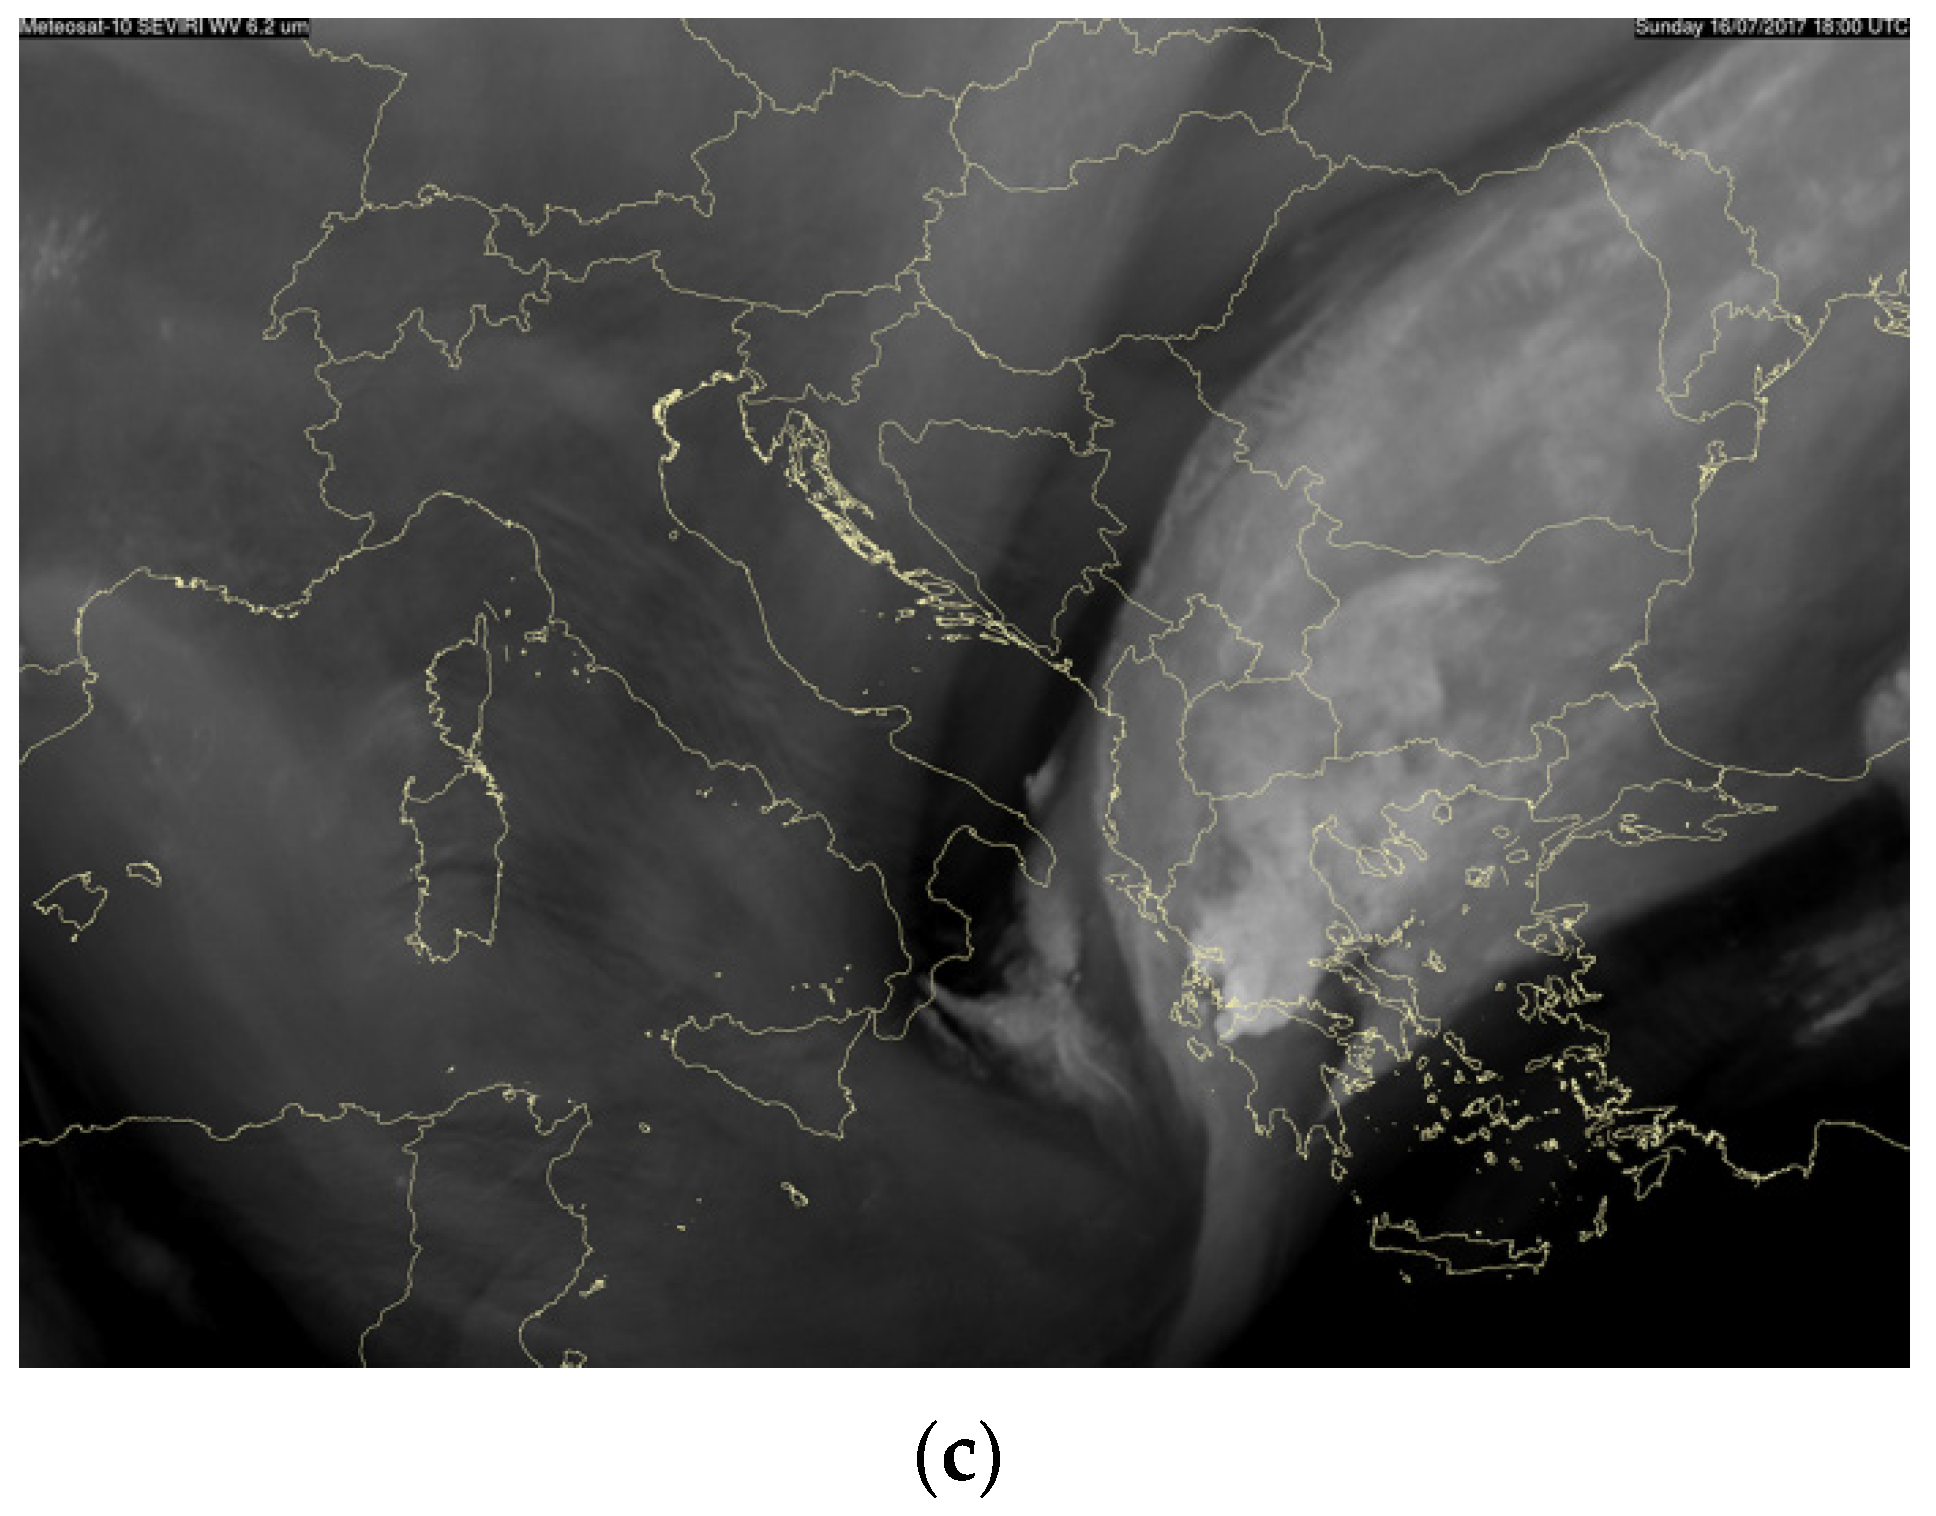
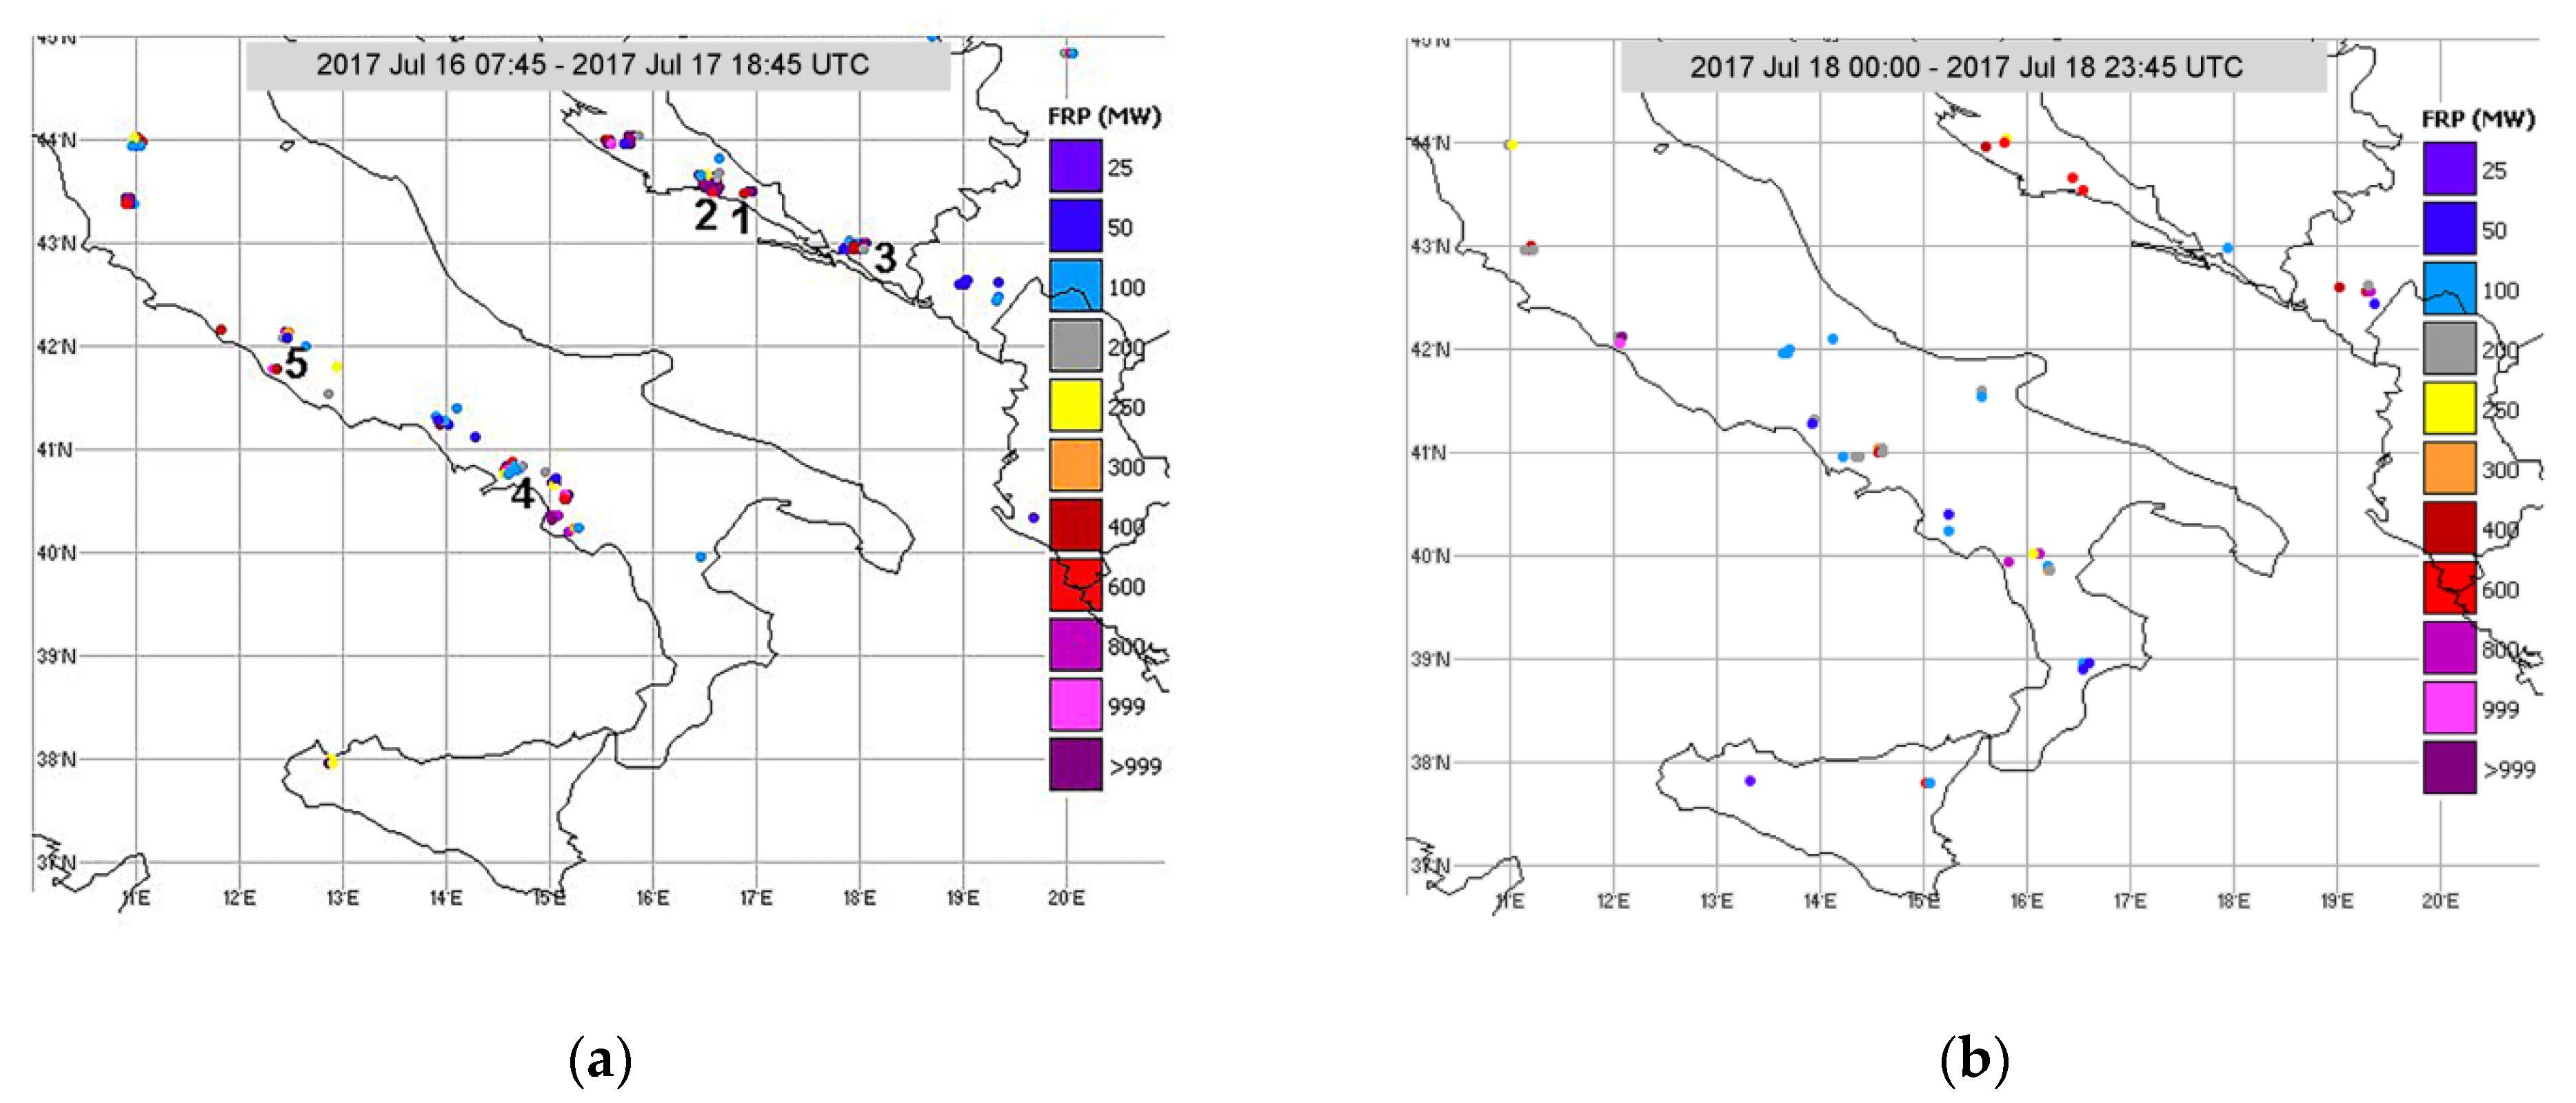
Three fires near the Adriatic coast of Croatia and Herzegovina are considered, as indicated in the plot of FRP detections in
Figure 10a.
Fire 1: Around 43.51° N 16.94° E (about 40 km East of Split, Croatia) detected by the FRP product on 16 July 2017 from 0745 to 1700 UTC, and a release of 10,687.0 MW energy estimated by all of the 48 FRP detections;
Fire 2: Around 43.54° N 16.60° E (about 13 km East of Split, Croatia) detected by the FRP product on 17 July 2017 from 0000 to 1845 UTC. After the initial detections at 0015 UTC and 0300 UTC, this fire intensified only at 0830 UTC when it was detected by the FRP at location 43.59 N, 16.61° E with 405.30 MW energy release, and at 43.54° N 16.60° E, with 967.10 MW of energy release. The estimations based on all of the 105 FRP detections on 17 July 2017 show 66,504.4 MW energy released;
Fire 3: Around 42.97° N 17.97° E (south-east Herzegovina) detected by the FRP product on 16 July 2017 at 0000 UTC, 0315 UTC later from 0415 to 0915 UTC, and then detected only in the late afternoon after 1515 UTC.
Since ozone can be a secondary pollutant of the fire emissions, it peaks only downwind of the fire location [
21]. The spatial resolution of the IASI soundings in this case provides clear observational evidence to confirm this conclusion.
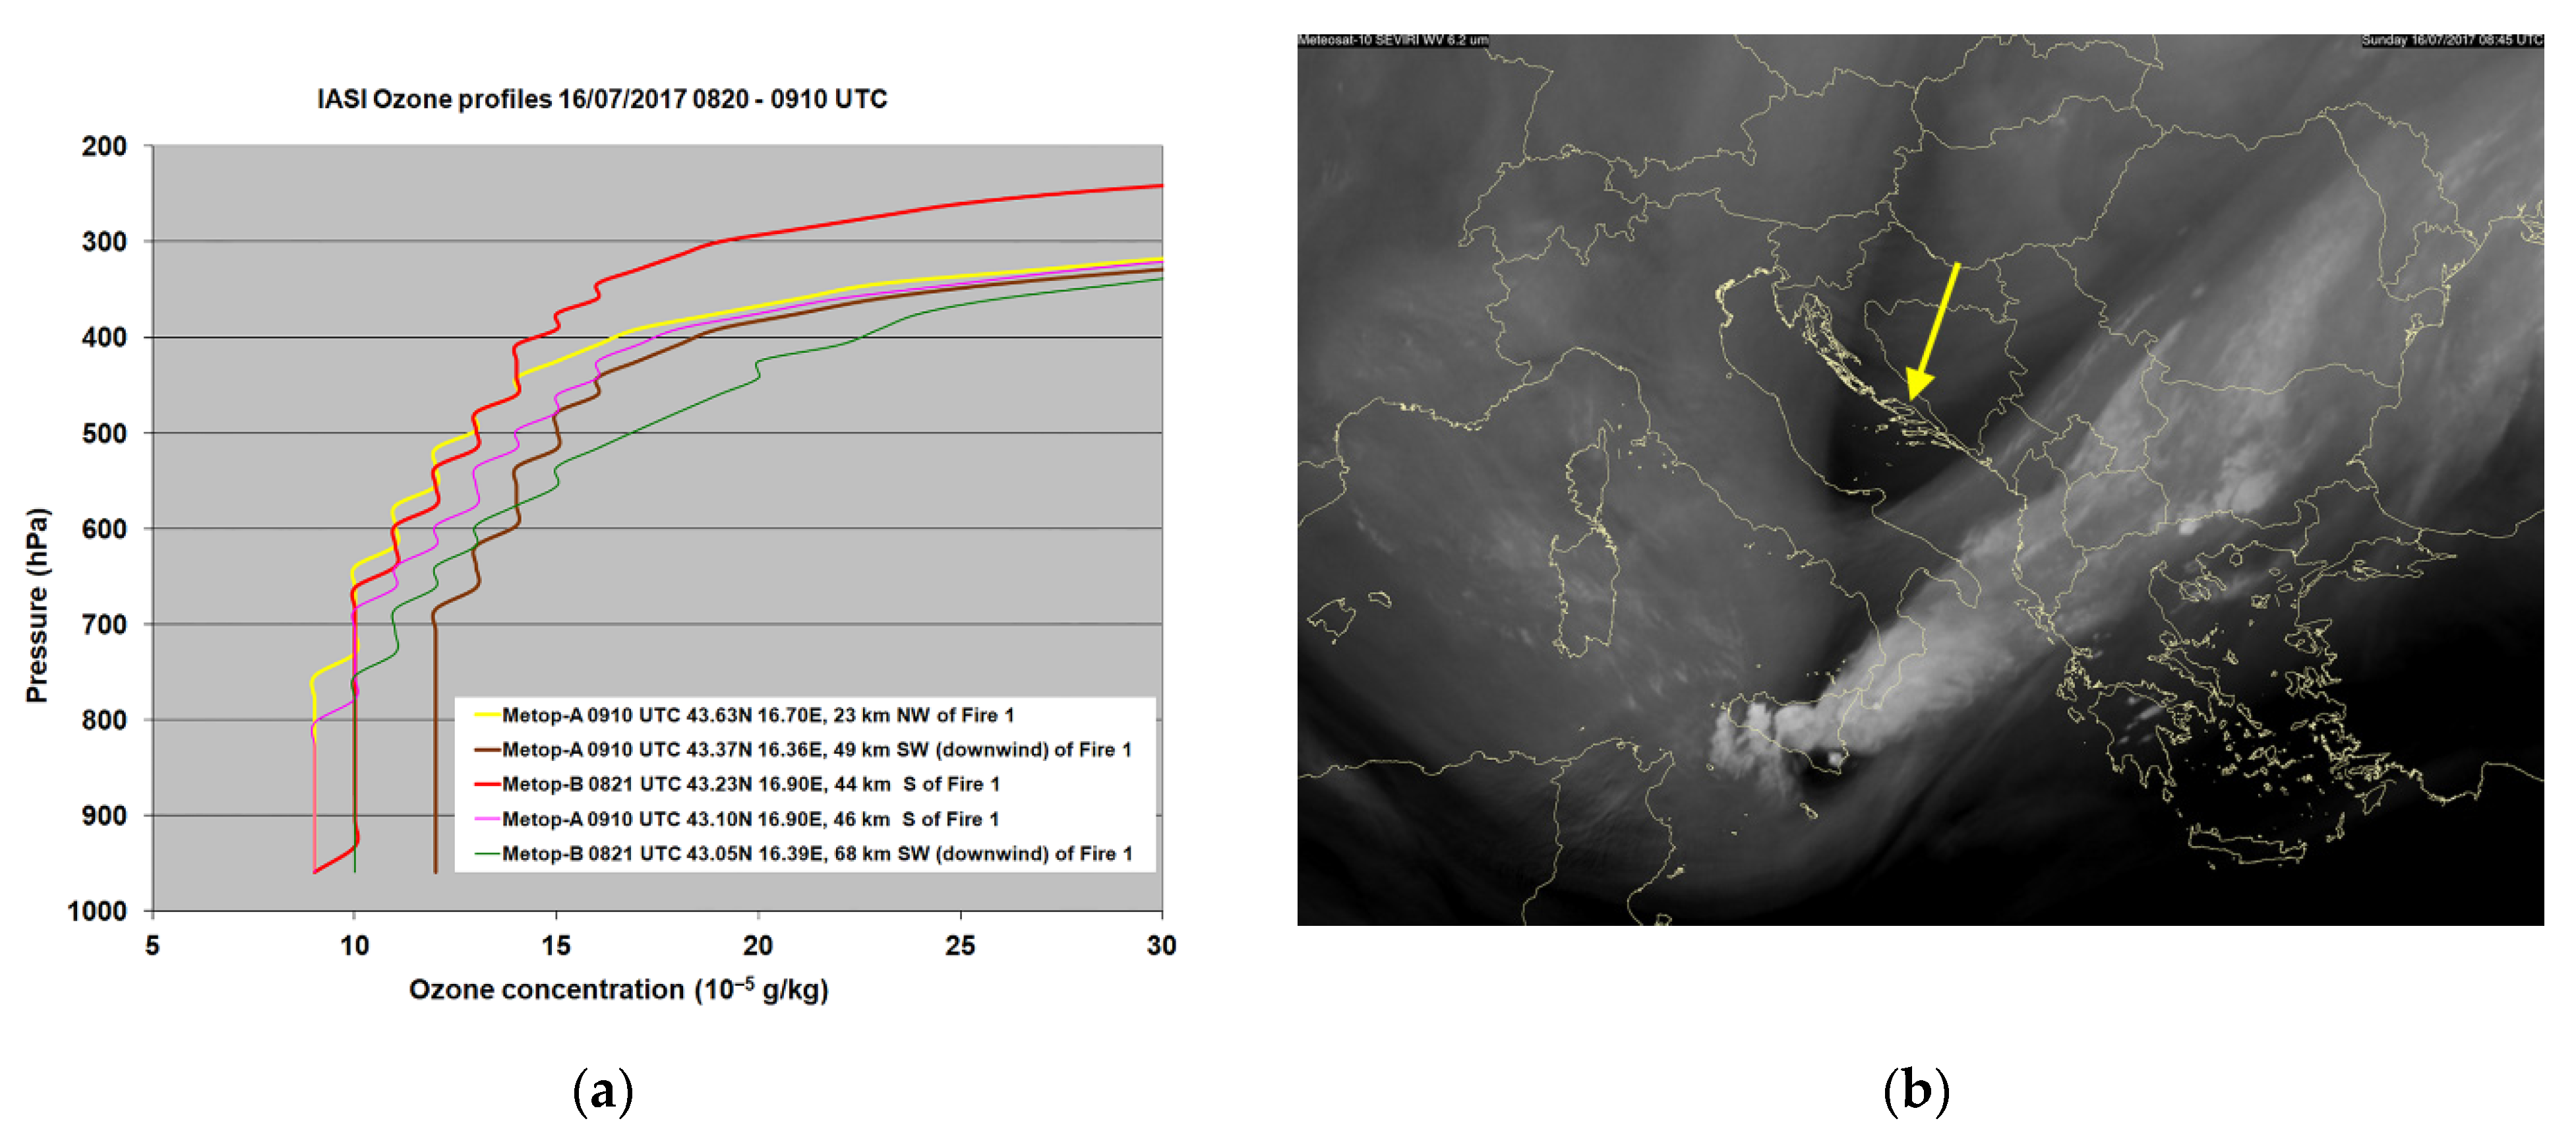
Figure 11a shows 5 IASI sounding profiles of ozone in the area around Fire 1, where north-easterly winds varying from 37 km/h at 0730 UTC to 31 km/h at 0930 UTC of 16 July 2017 were measured at the nearest ASOS Network [
47] station at Split, which is located at 16.30° E 43.54° N about 52 km west of Fire 1.
Yellow profile: Metop-A, 0910 UTC at 43.63° N 16.70° E, 23 km north-west of Fire 1 location;
Brown profile: Metop-A, 0910 UTC at 43.37° N 16.36° E, 49 km south-west (downwind) of Fire 1 location;
Red profile: Metop-B, 0821 UTC at 43.23° N 16.90° E, 44 km south of Fire 1 location;
Magenta profile: Metop-A, 0910 UTC at 43.10° N 16.90° E, 46 km south of Fire 1 location;
Green profile: Metop-B, 0821 UTC at 43.05° N 16.39° E, 68 km south-west (downwind) of Fire 1 location.
At 0910 UTC (yellow, brown and magenta profiles) the lowest ozone concentrations are found upwind of Fire 1, because the fire plume, where ozone production may occur, travels only downwind of the fire location. At this time, the highest enhancement of low- and mid-level ozone up to 12 × 10−5 g/kg, which is about 750 ppb, was present 49 km south-west (downwind) and was most likely the result of two factors:
Deep dry intrusion and related subsidence of ozone-rich stratospheric air in the central Mediterranean as shown in
Section 3;
Ozone production in the wildfire plume, which traveled this distance—at least for 1.5 h (after the first satellite detection of Fire 1 at 0745 UTC, 0945 local time accordingly under strong enough solar radiation).
At a distance of 68 km (green profile), the low-level ozone is not much enhanced, although the upper-level ozone exhibits higher concentrations and the existence of subsidence is confirmed by WV imagery analysis. The most likely explanation for the moderate concentrations of low-level ozone is the fact that traveling with the existing winds (31–37 km/h) only for 1.5 h, the fire plume and associated ozone production had not yet reached this location. By analyzing the other profiles in
Figure 11 (red and magenta curves), two other important features become apparent.
Significant variations in mid/upper-level ozone concentrations are observed in rather short distances around the area of strong upper-level dynamics;
The two profiles southward of Fire 1 (red and magenta profiles at 44 and 46 km from Fire 1, respectively), which were also temporarily quite close to each other (less than an hour), present vertical ozone distributions with profound differences regarding the low- and middle-level concentrations.
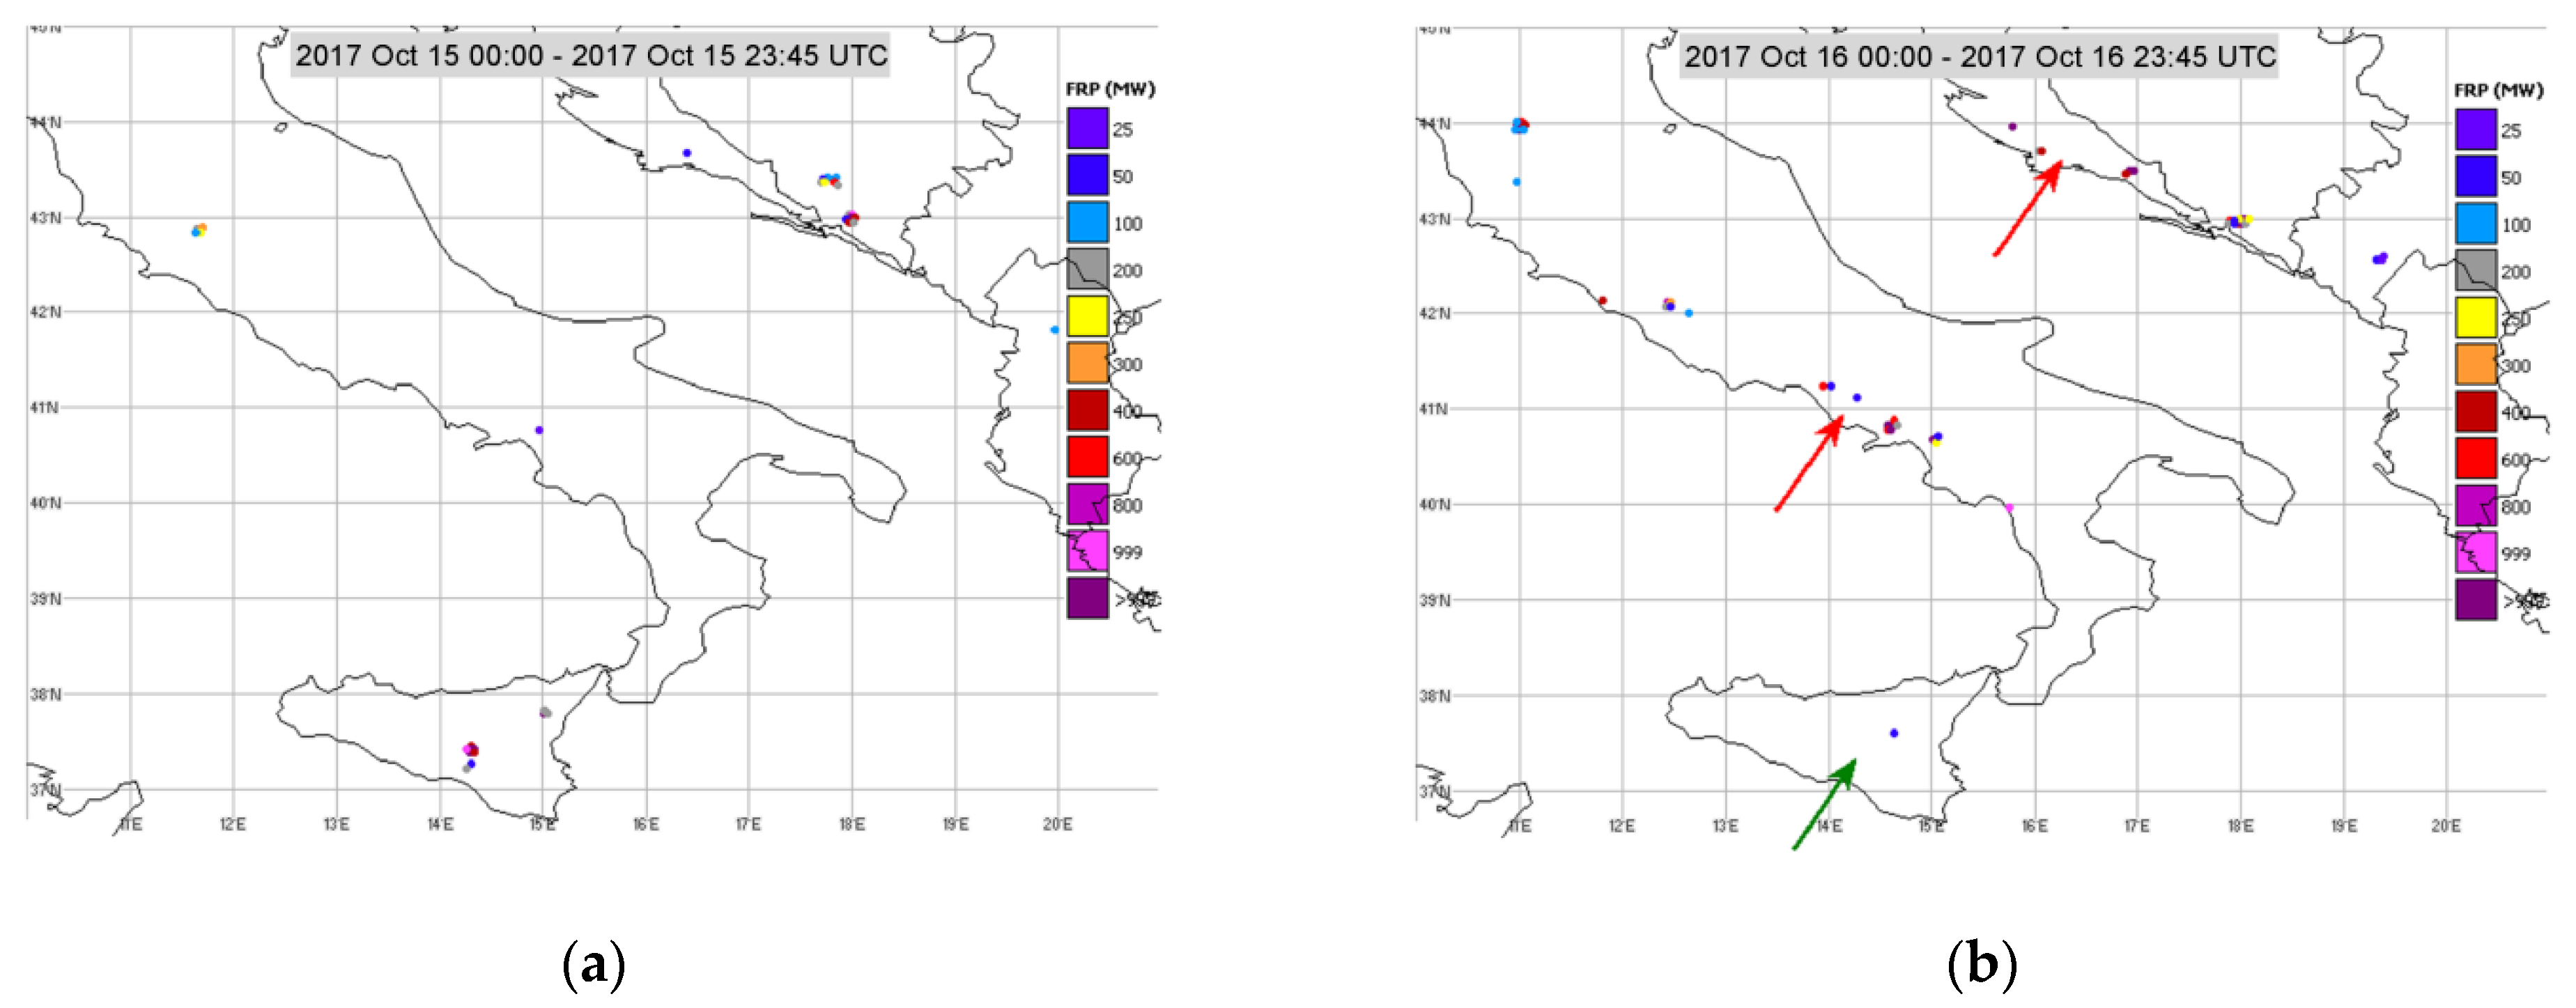
The analysis of the WV image at 0845 UTC of July 16 (
Figure 11b) shows that this kind of complexity is due to the position of the study area, which is located close to the upper-level dynamic moisture boundary in the rear and downwind side of the dry intrusion. The point here is that one of the IASI footprints (red profile) is located in an area of ascending motions at the upper level (light grey shades of
Figure 11b), whereas others (green and brown profiles) retrieved at the south-west, well inside the area of dry intrusion, show enhanced ozone concentrations at upper levels through subsidence of ozone-rich stratospheric air (dark grey shades of
Figure 11b).
5.2. Upper-Level Dynamics as a Factor of Complexity
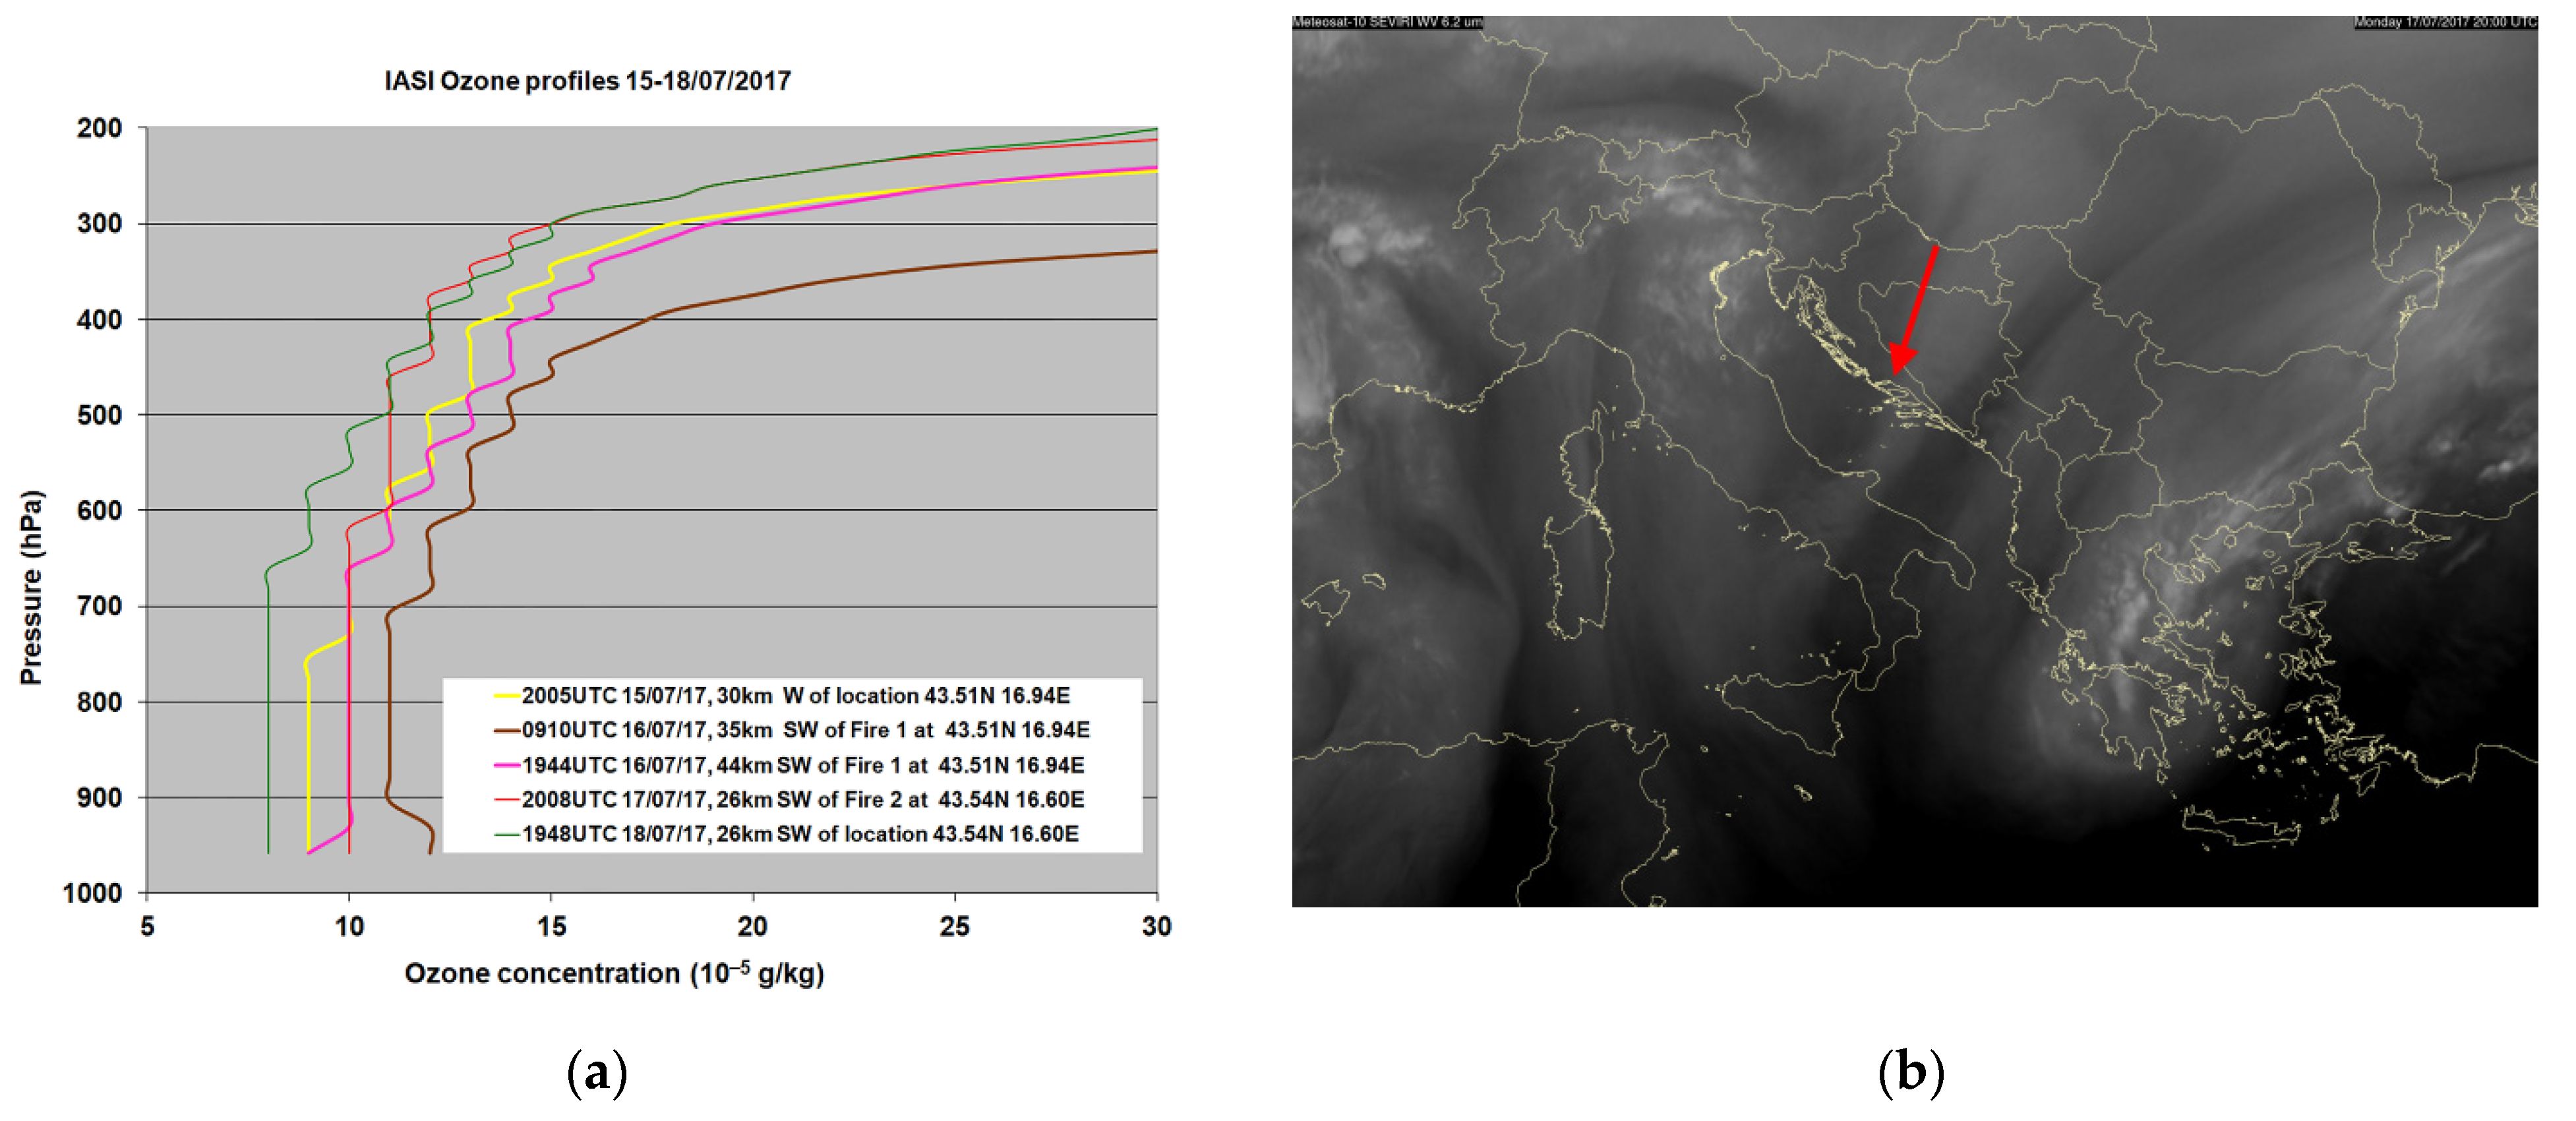
For a better understanding of these complexities, the satellite sounding data were analyzed in order to show evidence of enhanced ozone due to stratospheric intrusion and biomass burning. Ozone profiles downwind of the locations of Fire 1 and Fire 2 (
Figure 10a) on 16–17 July are shown in
Figure 12. Persistent strong north-easterly winds were measured near the surface by the ASOS Network station in Split (at about 52 km and 24 km west of Fire 1 and Fire 2 locations, respectively): from 35.2 km/h at 2005 UTC on 15 July 2017 to 13.0 km/h at 2008 UTC on 17 July 2017. For the profiles in
Figure 12 the following are valid:
Yellow profile: 2005 UTC of 15 July 2017 at 43.53° N 16.55° E, 30 km downwind (west) of Fire 1 location, wind speed in the last 1 h 24–35 km/h;
Brown profile: 0910 UTC of 16 July 2017 at 43.33° N 16.58° E, 35 km downwind (south-west) of Fire 1 location, wind speed in the last 1 h 30–31 km/h;
Magenta profile: 1944 UTC of 16 July 2017 at 43.37° N 16.41° E, 44 km downwind (south-west) of Fire 1 location, wind speed in the last 1 h 17–31 km/h;
Red profile: 2008 UTC of 17 July 2017 at 43.31° N 16.52° E, 29 km downwind (south-west) of Fire 2 location, wind speed in the last 2 h 13–19 km/h.;
Green profile: 1948 UTC of 18 July 2017 at 43.38° N 16.36° E, 29 km downwind (south-west) of Fire 2 location, wind speed in the last 2 h 4–10 km/h.
On 16 July (brown profile), the concentration of ozone sharply increased in the whole troposphere due to the deep stratospheric intrusion and strong subsidence, as shown in
Section 4. Additionally, this profile of 0910 UTC indicates pronounced ozone enhancement near the ground (below the 900 hPa level) that can be attributed to ozone production inside the plume of Fire 1, detected by FRP at the 0745 UTC MSG slot with 297.70 MW energy in 2 MSG pixels. Then, during the next 1.5 h under strong solar radiation, increased ozone production occurred in the wildfire plume, which from 0740 to 0910 UTC (0940 to 1110 local time) propagated downwind for about 45–50 km with the strong winds of 30–35 km/h in this period. Analyses of processes leading to very rapid ozone production in some cases of biomass burning plumes are provided by Jaffe and Wigder [
21]. Later in the evening, solar radiation and fire activity decreased, as also suggested by the fact that after 1700 UTC Fire 1 was not detected by the FRP product. Accordingly, the low-level ozone concentration decreased at 1944 UTC (magenta profile), which also seems partially due to the slightly decreased upper troposphere ozone concentrations.
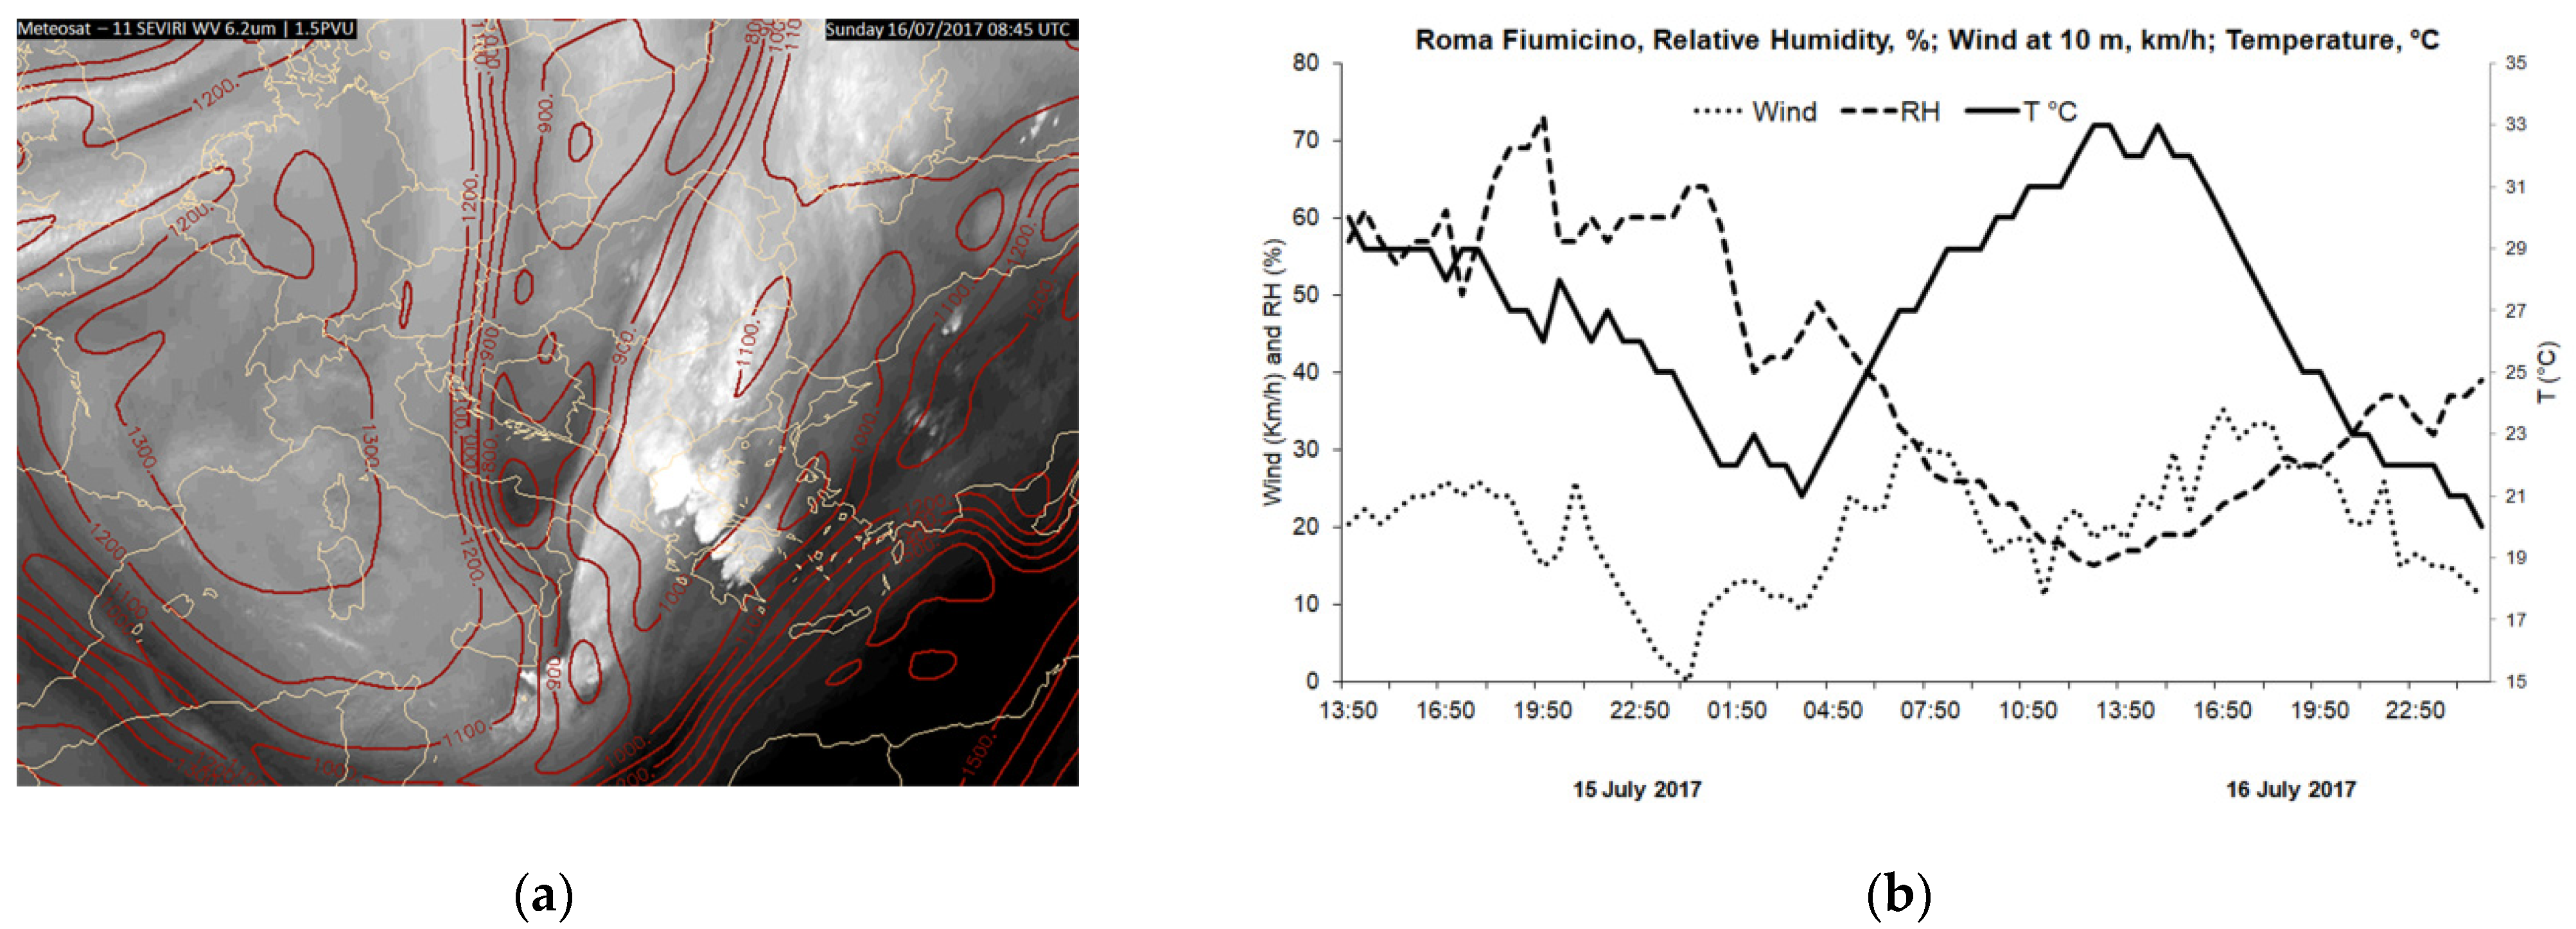
The analysis of the WV image (
Figure 12b) shows that on 17 July at 2000 UTC, Fire 2 (at the red arrow) and its downwind area are found in light grey shades near a moisture boundary related to an upper-level deformation zone, and therefore the subsidence of ozone-rich air masses from the lower stratosphere has terminated. As a result, the red profile on 17 July at 2008 UTC shows that, at 26 km south-west of Fire 2, the ozone concentration in middle and upper troposphere decreased significantly compared to 15 July. At the same time, the low-level ozone concentrations remained high downwind of Fire 2, probably due to the ozone production inside the wildfire plume. The measured wind of 13–14 km/h near the fire location confirms that the plume in the environment of this sounding originated from biomass burning 2 h earlier (around 1800 UTC) and one hour before the last FRP detection. The ozone profile on 18 July (in green) indicates that the upper-level concentration remained the same as it was during the night of 17 July, whereas the low- and mid-level ozone decreased, most likely due to the much weaker fire activity (
Figure 10b). The profiles in
Figure 12a support the complexity of ozone production mechanisms inside the fire plumes, which is the combined result of the interplay of emissions, photochemistry and atmospheric dynamics (see Jaffe and Wigder [
21]). Moreover, there is too much variation in mid–upper-level ozone at a short distance of 30-80 km near moisture boundaries seen in the WV image in
Figure 12b related to areas of upper-level descending/ascending motions in the deformation zone.
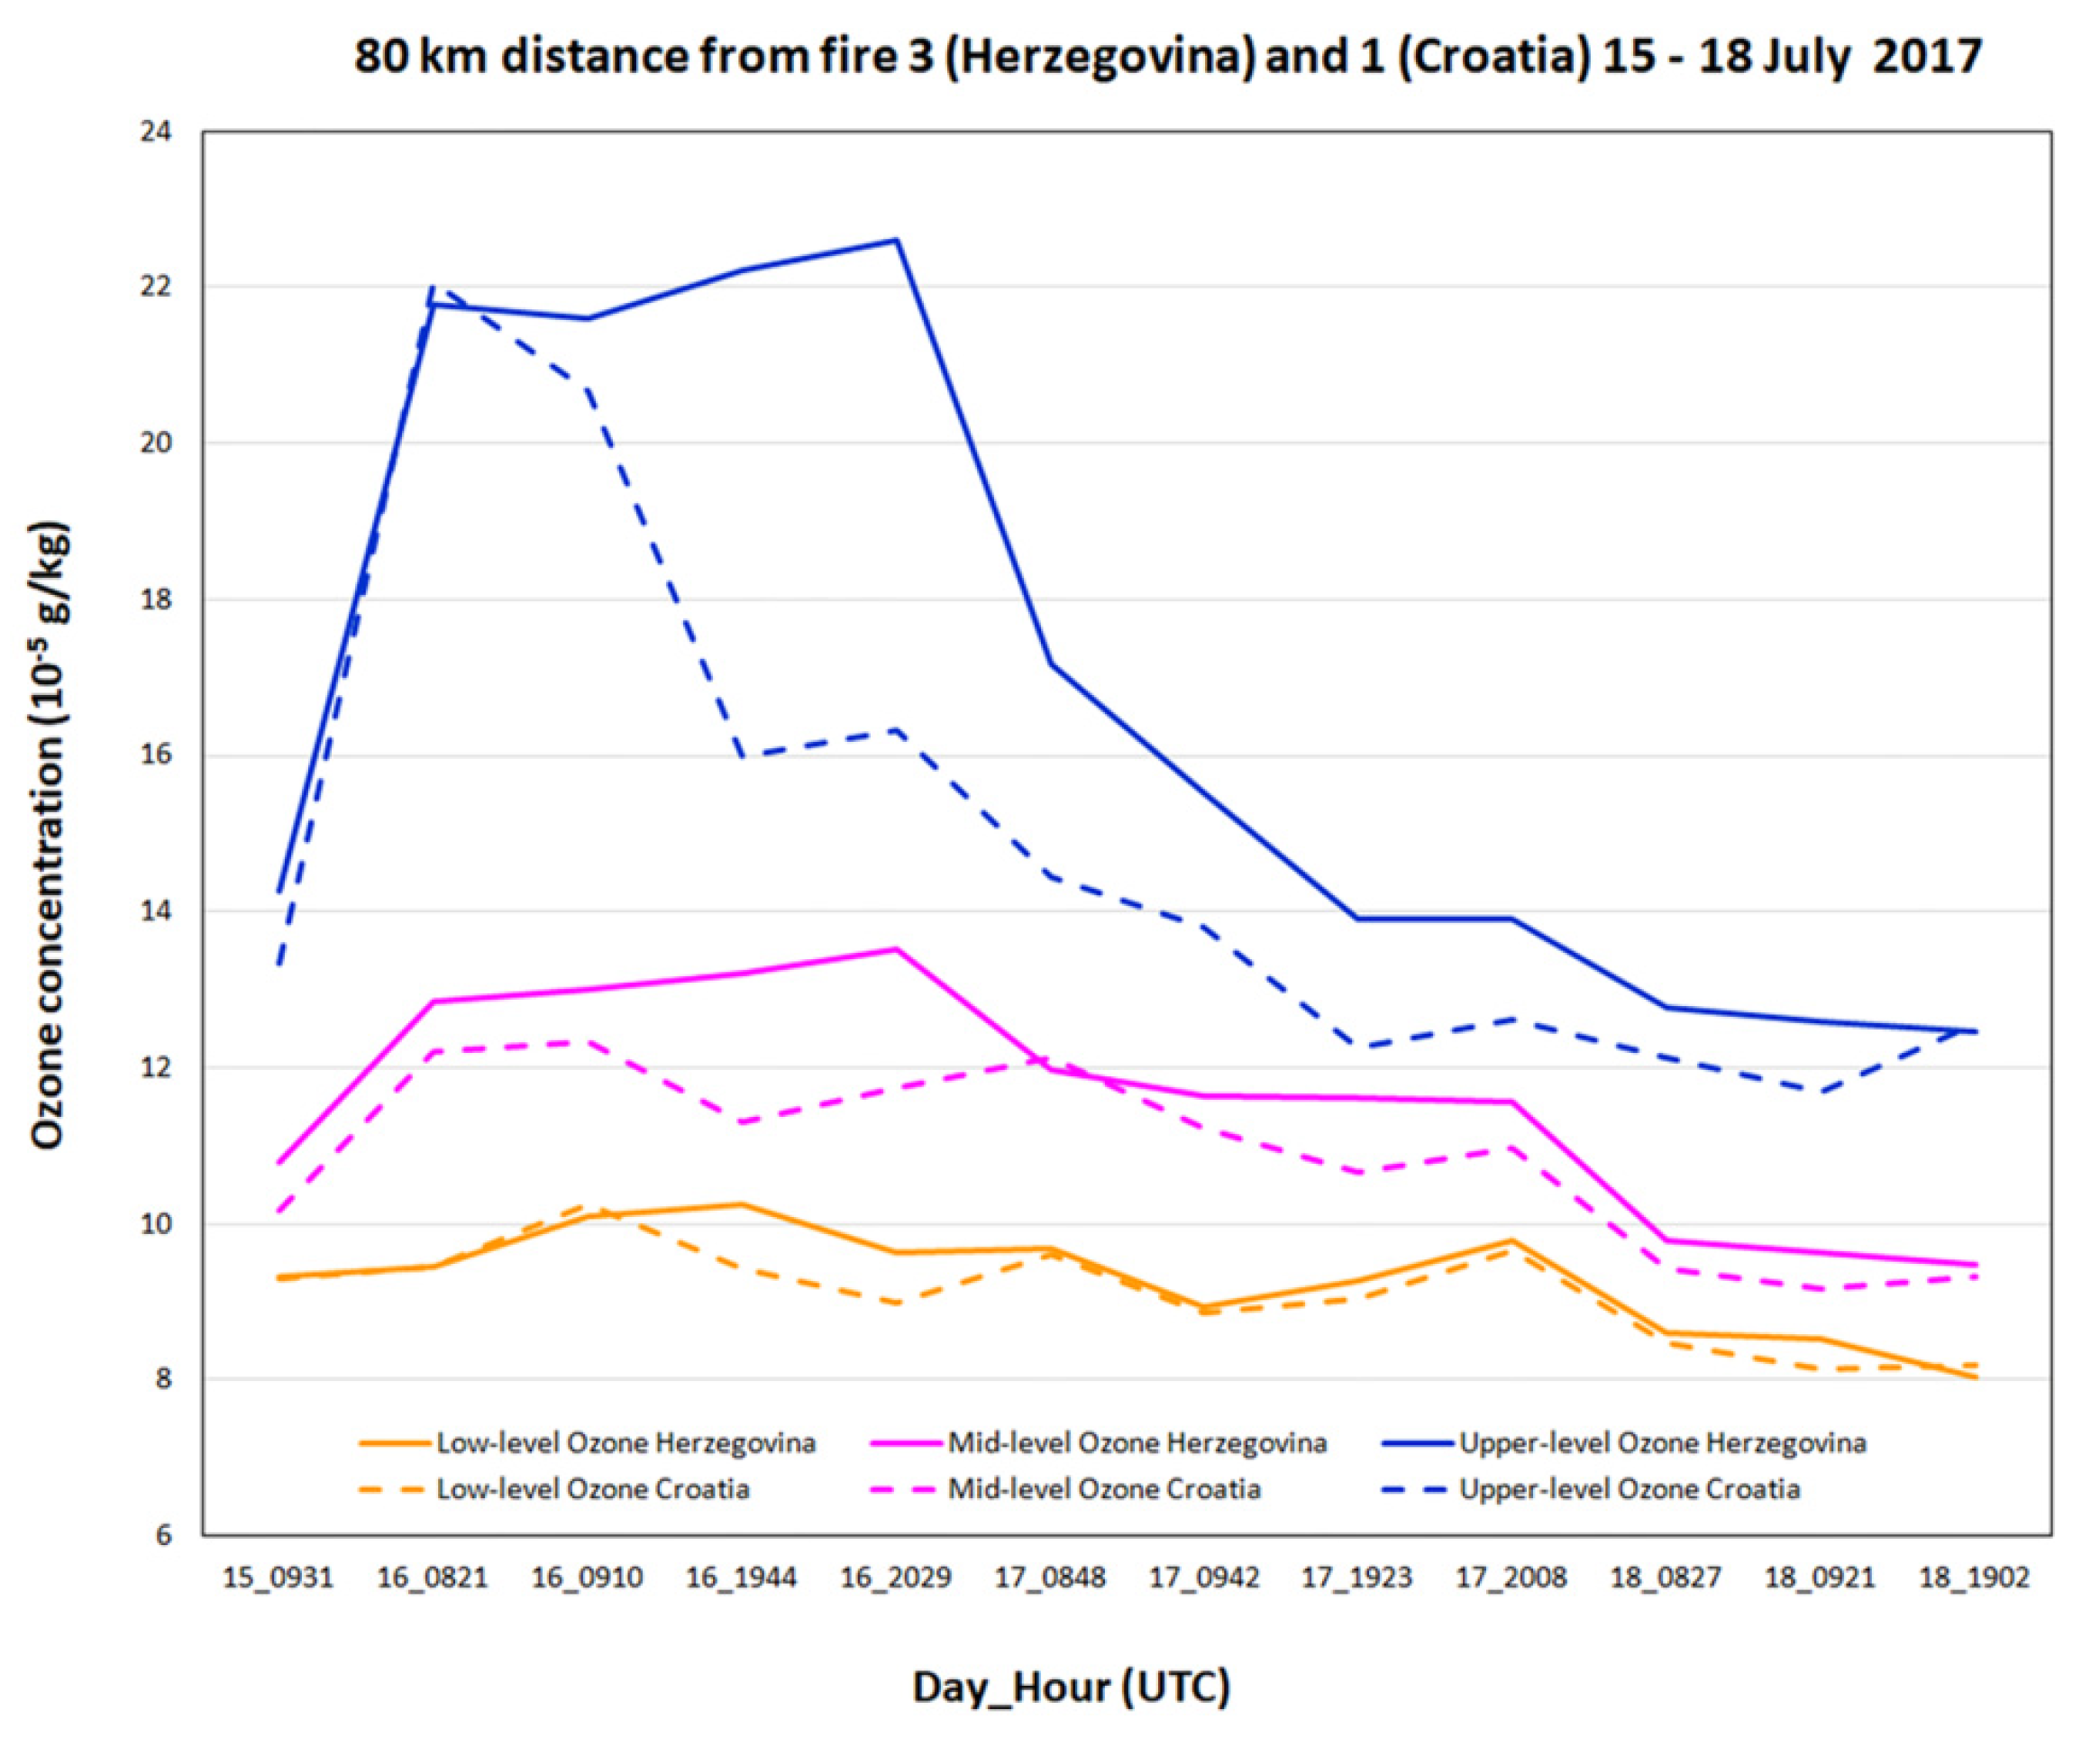
In order to study the contribution of the vertical transport of ozone-rich air masses from stratospheric origin to the low-level ozone production, the averaged concentrations downwind these wildfires were considered for three tropospheric layers: from 1000 to 700 hPa (low-level), from 700 to 500 hPa (mid-level), and from 500 up 320 hPa (upper-level). The average profile values within these three layers from all clear sky IASI soundings of Metop-A and Metop-B satellites in the target areas were used to determine the evolution of the averaged ozone concentration during the period of fire activity.
Figure 13 shows the evolution of the averaged ozone concentration in the three tropospheric layers over the areas at a distance of 80 km south-west (downwind) of the area of Fire 1 and Fire 2 in Croatia (dashed line), and Fire 3 in Herzegovina (solid lines).
The highest average low-level ozone concentration downstream of the wildfire appeared at 0910 UTC on 16 July when both the deep dry stratospheric intrusion and the production in the fire plume contributed to the overall enhanced ozone concentration. At 0910 UTC 16 July 2017, the two downwind fire areas were located at the rear side of the dry intrusion (dark grey shades of
Figure 11b), and were in similar positions regarding the probability for subsidence of ozone-rich stratospheric air. By that time, in the area of Fire 3, the upper- and mid-level ozone was at higher concentrations (
Figure 13, blue lines) but the low-level ozone in the area of Fire 1 increased to higher values than that of Fire 3. Thus, the WV imagery analysis and IASI measurements give us a sign of a greater ozone production in the plume of Fire 1. The data from the satellite FRP measurements in
Table 2 confirm that Fire 1 in Croatia on the morning of 16 July was detected by the FRP product with a much greater total energy release (in 11 pixels) than that of Fire 3 in Herzegovina (detected in 19 pixels) for the same period.
Another important feature that becomes apparent from the analysis is related to the significant difference between the upper-level ozone concentration 80 km south-west of Fires 1 and 3 on the afternoon of 16 July, which were located a short distance of about 105 km from each other. This may be attributed to the difference in their positions in relation to the upper-level dynamic dry zone (see Georgiev et al. [
2]). As seen in the WV imagery analysis of
Figure 1c, at 1800 UTC the Herzegovina fire area was under the influence of dry intrusion and subsidence of stratospheric air indicated by dark grey shades, whereas the fire area in Croatia was located in the light grey pattern related to ascending motions in the upper troposphere. This is an illustration of how the study of ozone production from wildfire emissions can be complicated as it is affected by both enhanced ozone increase due to the descending stratospheric air masses and also the production inside the wildfire plumes. Continuing this analysis, we may conclude that the large difference in mid/low-level ozone concentrations over the two areas on 16 July at 1944 UTC and 2029 UTC was a result of the dry intrusion and subsidence of ozone-rich stratospheric air in the Fire 3 area. This may also support our suggestion that the ozone production from biomass burning in Fire 3 had a relatively small impact.
The upper-level ozone significantly decreased on 17 July, and was at lower concentrations than it was on 16 July. At the same time, the low-level concentration increased under strong solar radiation during day time to higher levels during the evening of 17 July than it was on 16 July. This behavior was likely due to the additional ozone production from ozone precursor emissions (NOx, VOCs) as a result of the biomass burning in Fire 2 and Fire 3, and suggests that IASI can detect ground level ozone variations, although the accuracy of the retrieval method may be limited by fire-related factors such as smoke aerosol and temperature contrast.
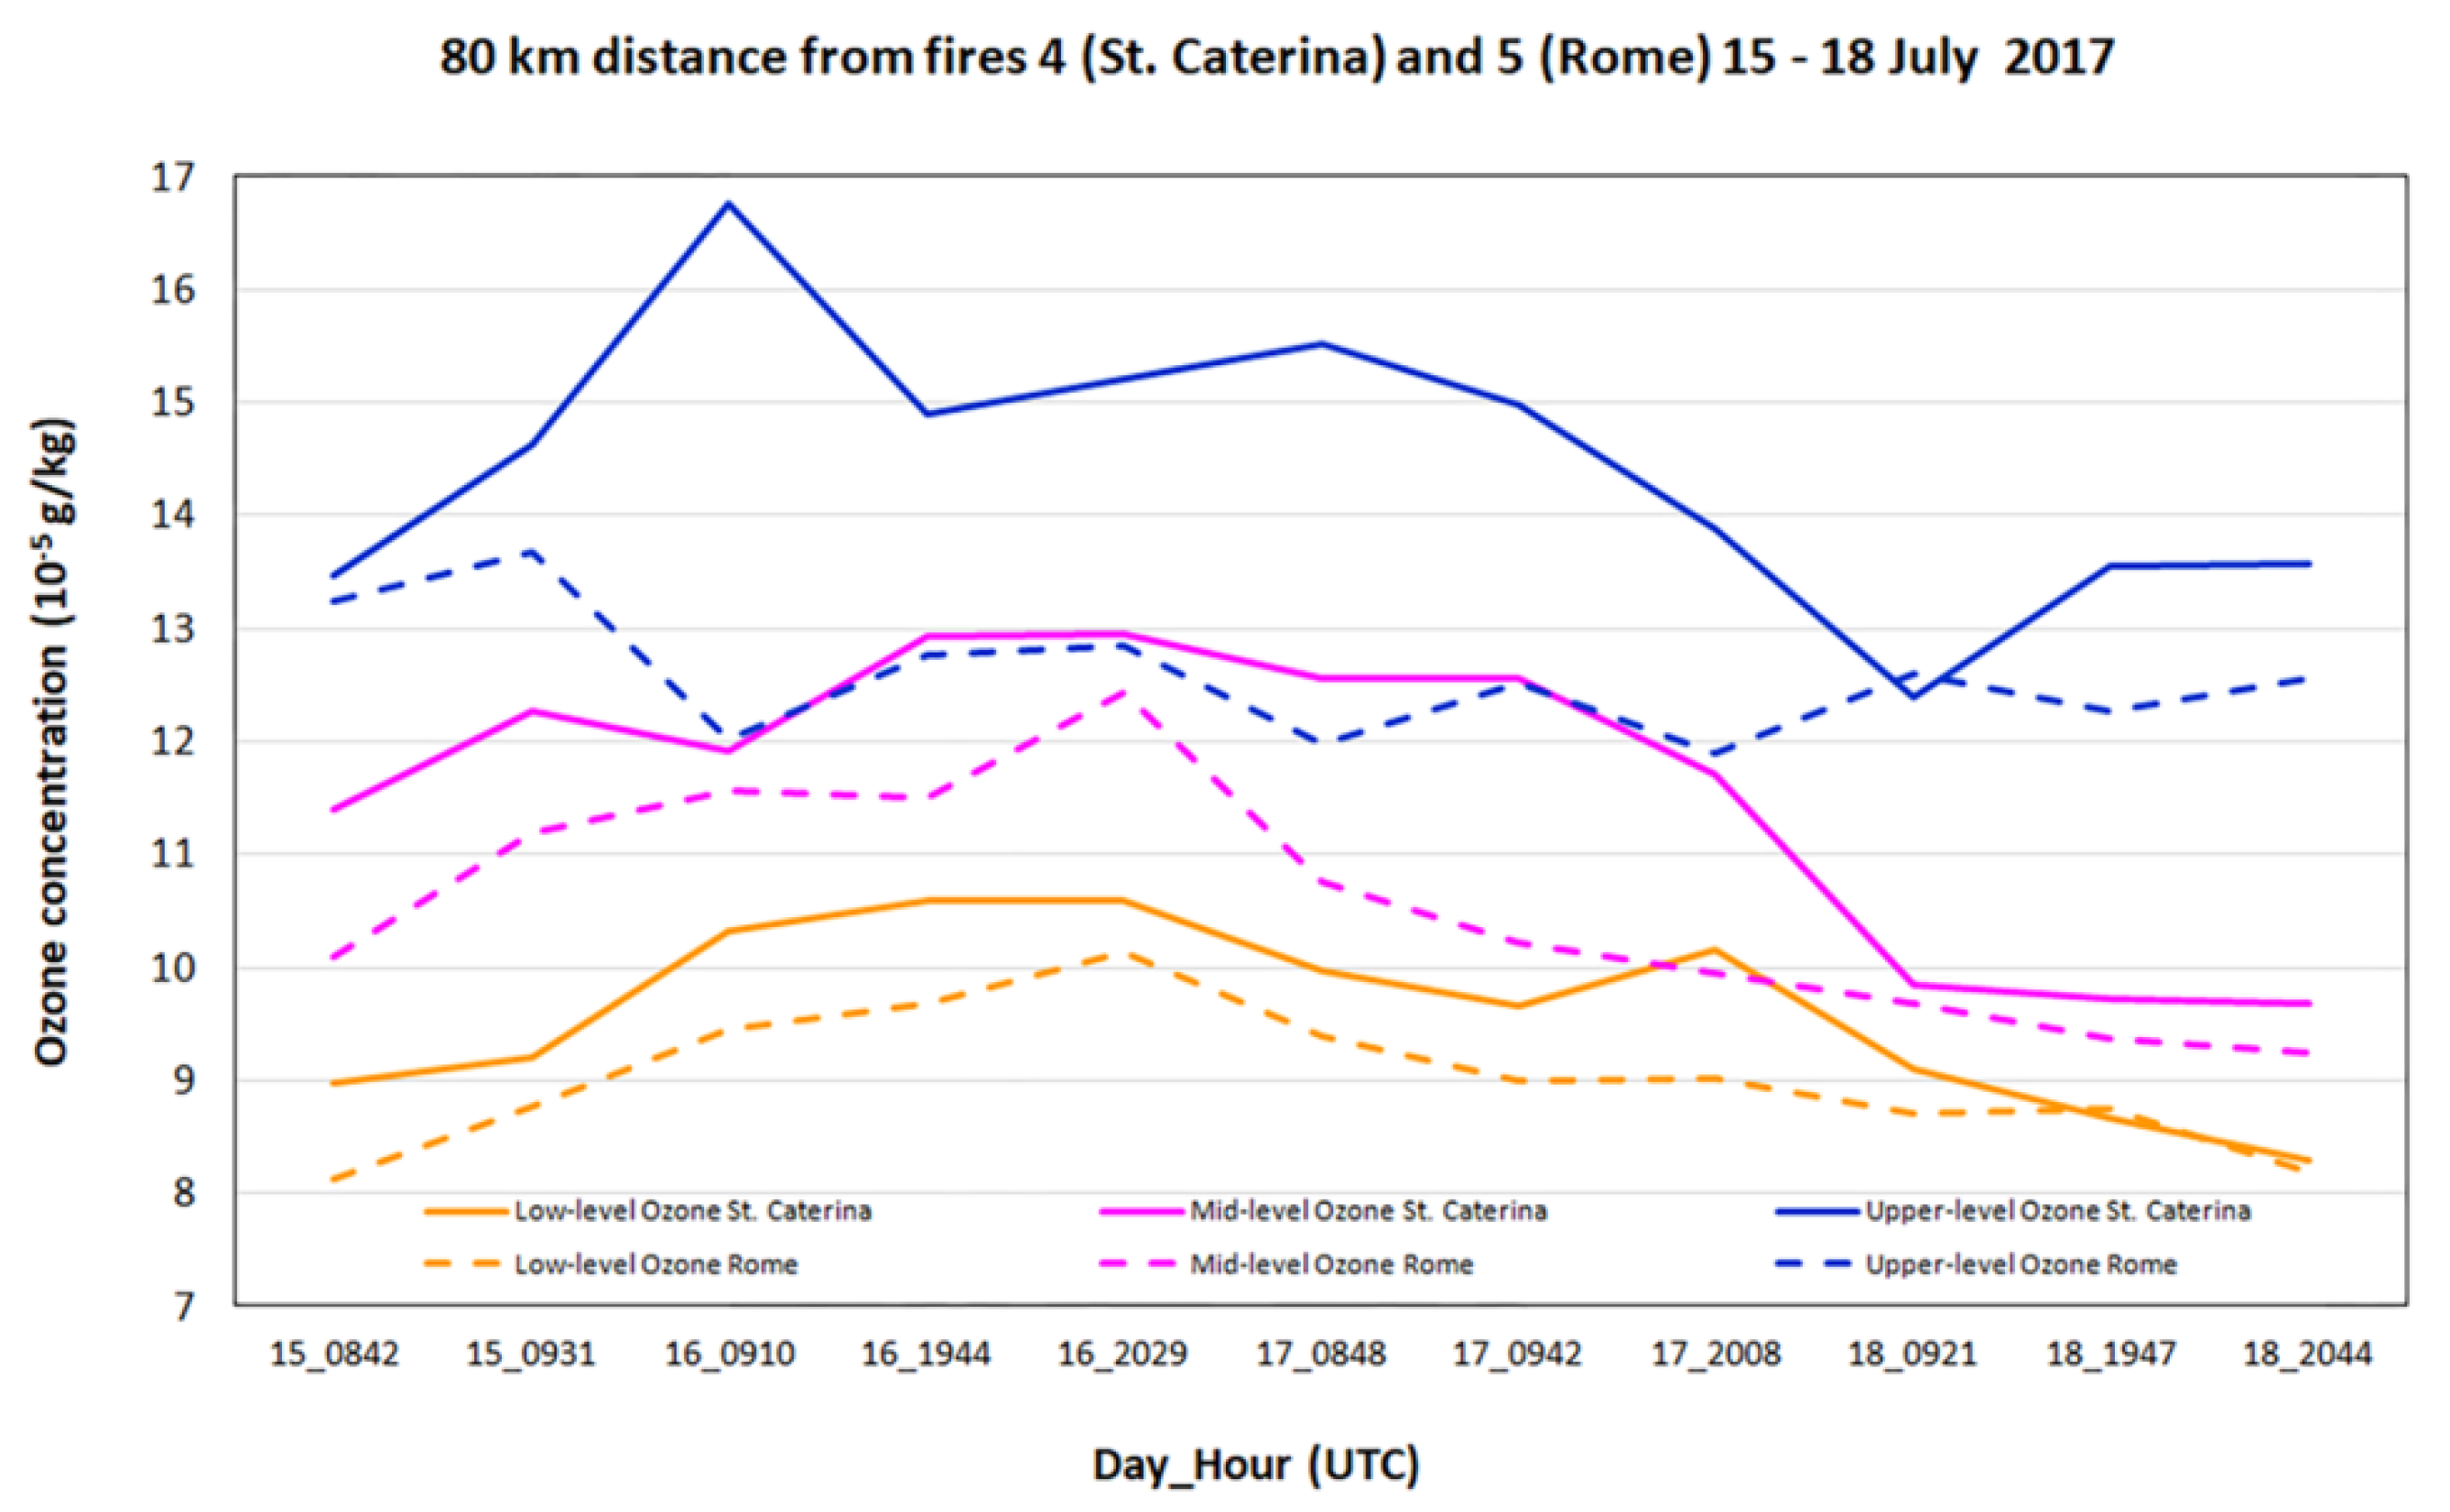
Figure 14 shows the averaged ozone concentration downwind of two wildfire areas over Italy:
Fire 4: Around 40.65° N 15.04° E (St. Catertina) detected by FRP product on 16 July 2017 from 0900 to 2130 UTC, and around 40.36° N 15.04° E on 17 July 2017 from 1145 to 1630 UTC;
Fire 5: Around 42.1° N 12.4° E (Rome) detected by FRP product on 16 July 2017 at 0000 UTC, 0315 UTC later from 0415 to 0915 UTC, then developed only in the late afternoon after 1315 UTC and around 42.15° N 11.81° E, whereas on 17 July 2017 with only one FRP detection at 1445 UTC.
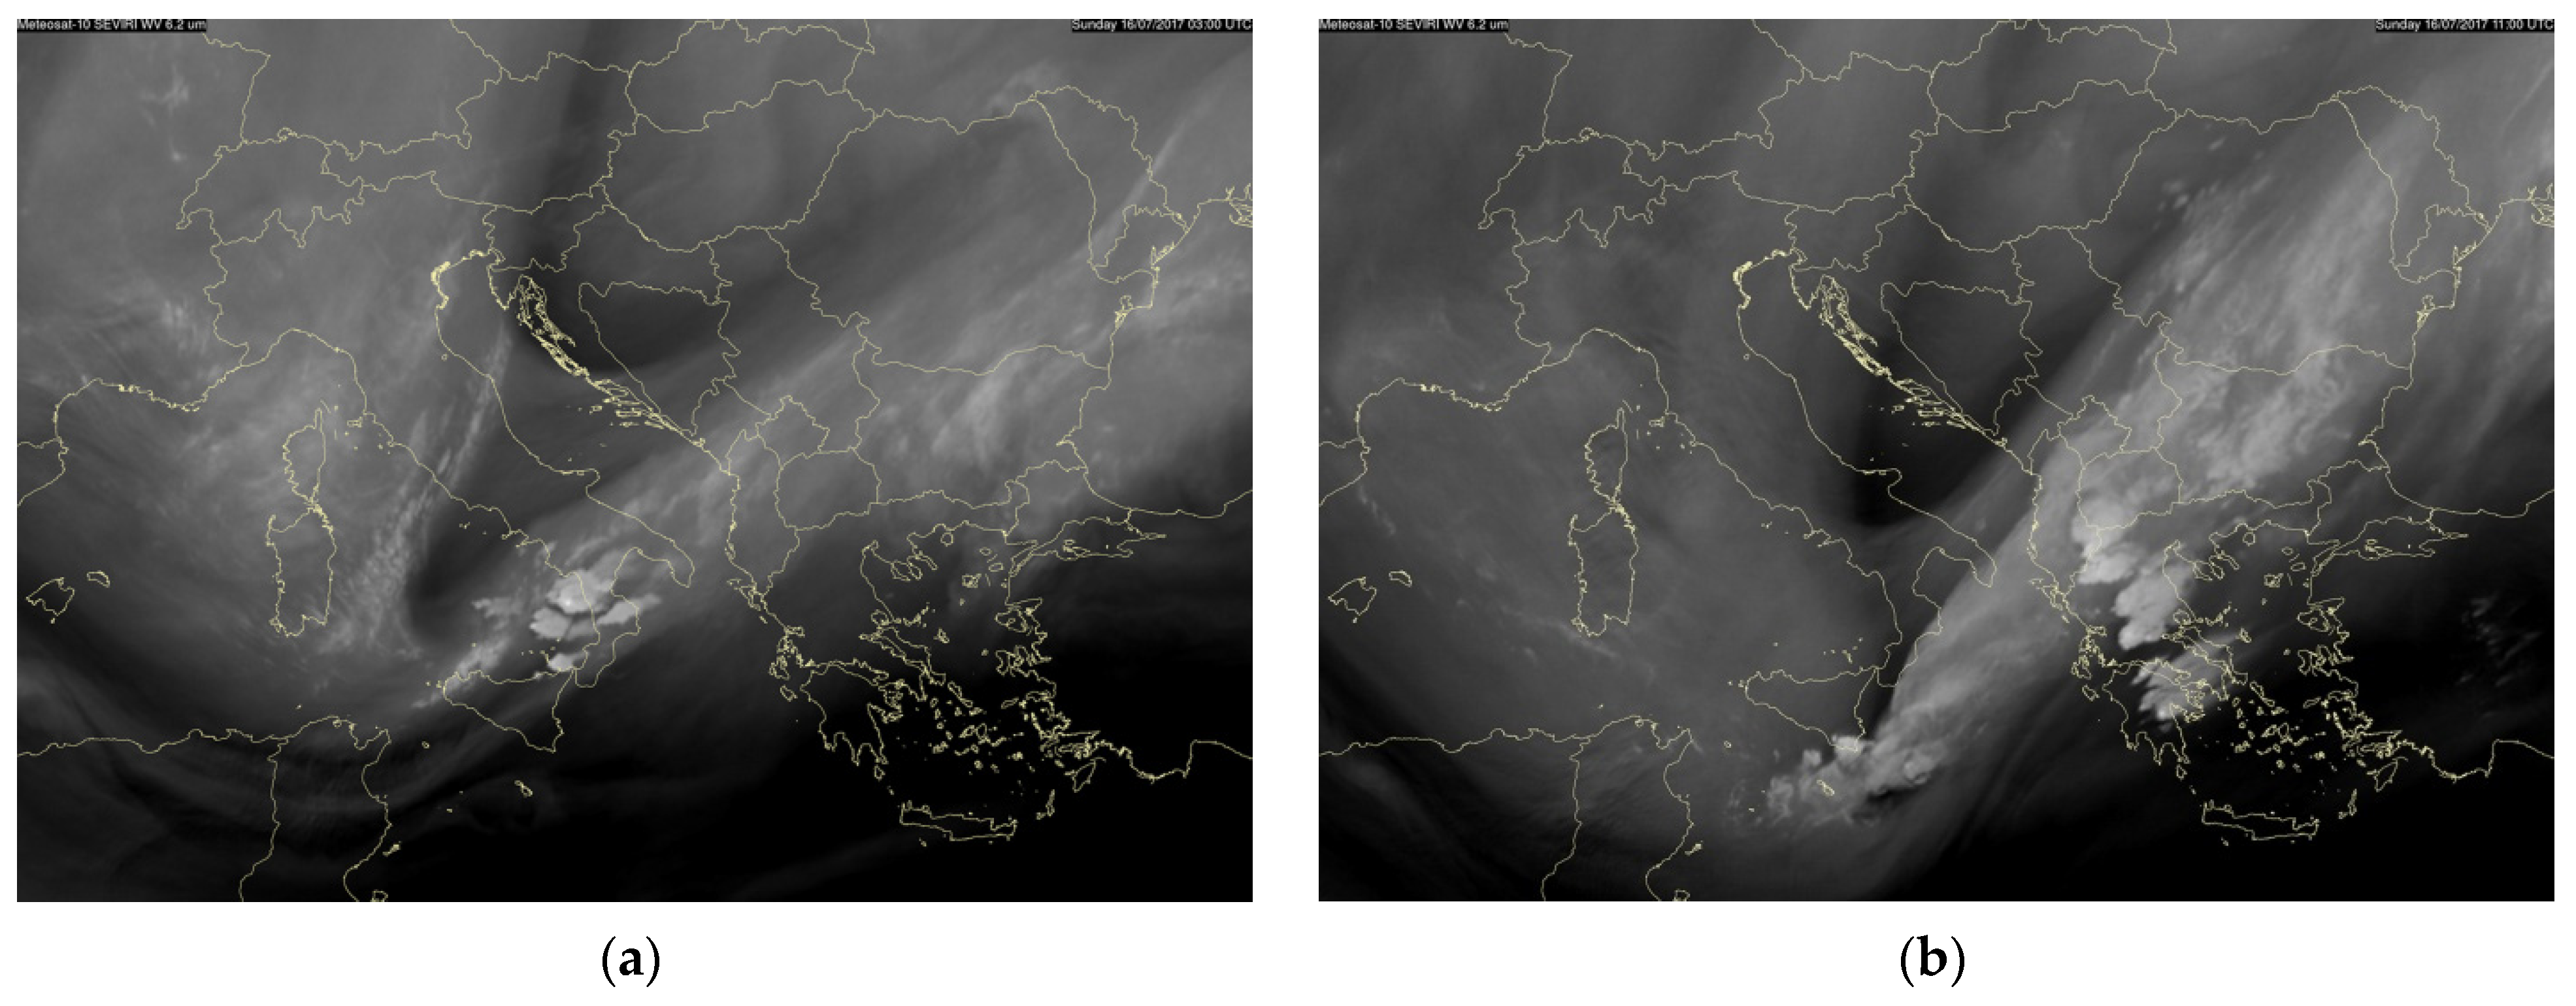
Figure 14 shows a significant difference in upper-level ozone in the two areas: a maximum of ozone concentration at St. Caterina at 0910 UTC on 16 July and at the same time a local minimum near Rome that can be explained by WV imagery analysis. This is due to the difference in the position of the fires in relation to the propagation of the upper-level dynamic dry zone. At 0300 UTC (
Figure 1a), the St. Caterina fire area was just under the influence of the first dry stratospheric intrusion while ascending motions and cloudiness up to the upper troposphere are seen in the Rome area. Then, around 1100 UTC (
Figure 1b), the moisture boundary in the WV image appears between the two areas and their position regarding the second dry intrusion is quite different. The area around St. Caterina was located in the leading part of the dry intrusion at the upper levels and the subsidence of the dry air occurred slightly ahead in the direction of movement due to the slope of the frontal zone [
48]. For that reason, the St. Caterina area was affected by the stratospheric intrusion of ozone-rich air through subsidence, whereas the area around Rome was located about 150 km northwest of the dry intrusion, inside the light WV image grey shading that is an indication of ascending motions at upper troposphere
Two features of the plots of
Figure 14 seem to provide observational evidence of the wildfires’ influence on the ozone concentration. First, regardless of the significant decrease in upper/mid-level ozone, the low-level concentration during the day on 17 July is much increased downwind of the fire area at St. Caterina, a fact that is most likely the result of ozone production inside the fire plumes. At the same time, the low fire activity in the Rome area (only one FRP detection at 1445 UTC) corresponds to only a slight increase in low-level ozone concentration. Second, with the weakening of fire activity on 18 July (
Figure 10b), the low/mid-level ozone concentration decreased significantly.
5.3. Wind Field Evolution as a Factor of Complexity
Ozone production from wildfires is a result of chemical and photochemical reactions that occur rapidly and continue downwind. An additional complexity in studying this effect is that the wind around a wildfire region can change significantly and the fire emissions in an aged plume may change their direction of propagation, and may be diluted in the case of divergent wind or concentrated in the case of convergent wind.
The examined wildfire occurred near Kresna in the south-western region of Bulgaria from 24 to 29 of August. The total affected area was about 2260 ha, 65% of which was forest area [
49]. The development was very powerful on 24 August 2017 due to the influence of dry stratospheric intrusion, as with the case considered in
Section 3 and seen in the WV image in
Figure 15a, where the Kresna fire is indicated by the red arrow.
The plot of FRP detections is shown in
Figure 15b. The estimations based on all of the 264 FRP detections of the Kresna fire on 24–25 August 2017 show the release of 65,517.5 MW energy, which is a similar quantity to that total emitted by the two Croatian fires on 16–17 July 2017 combined (
Section 5.1).
Figure 15 shows that, on 24–25 August 2017, wildfires occurred only over the areas affected by the dry stratospheric intrusion in Bulgaria, North Macedonia, and Albania, although in this period the temperature and humidity conditions over Greece and Turkey were highly favorable. This confirms the critical role of dry intrusions as a forcing factor in wildfire development and associated emissions.
After 1115 UTC on 25 August, the Kresna fire was not detected by the FRP algorithm applied to the data from MSG SEVIRI instrument, but other algorithms using data from polar satellite platforms, MODIS [
50] and the VIIRS active fire product [
51], continued to observe the fire development until the night of 28–29 August.
The fire burnt over hilly and low-mountain terrain, situated at elevations from about 250 to 750 m, and developed over the eastern slopes of Kresna gorge above Struma River [
49]. In this specific terrain and during the long period of fire development, the process of ozone production occurred in a complex and changeable wind field.
Table 3 shows wind data from two synoptic stations near the fire location:
Blagoevgrad, WMO, No 15611, 42.00° N 23.10° E, located 18 km north of the fire;
Sandanski, WMO No 15712, 41.55° N 23.27° E, located 35 km south of the fire.
The wind direction was uniform in the northern and southern sides of the fire location only during the first hours of the fire. North-north-westerly winds up to 18 km/h were present on 24 August at 12 UTC, when the dry intrusion seen in the WV image on
Figure 15a propagated over the Kresna fire area. By this time, the stratospheric intrusion of ozone-rich air through subsidence dominated as a contributing factor and the ozone production from the wildfire could not be distinguished. After 1500 UTC, towards the end of the fire, winds of more or less opposite direction were measured at the two synoptic stations and low-level convergence formed at the fire region.
In the morning of 25 August, a divergent wind pattern over the wildfire area at 0600 UTC was present, which seemed to spread the fire plume to a larger distance. After 1200 UTC on 25 August, and until the end of fire development, the wind field changed to a convergent pattern with low-level speed of 3.6–10.8 km/h.
5.4. Wildfires near Urban Areas and in an Environment of Limited Solar Radiation
In general, demonstrating and quantifying the ozone impacts from wildfires near urban areas is challenging. As discussed in Jaffe and Wigder (2012), this reflects the fact that ozone is a secondary pollutant, so that while most pollutants emitted by a wildfire decrease with distance, ozone can increase. Other studies have also found significant ozone enhancements in wildfire plumes that mix with urban NO
x emissions [
28,
52,
53]. Nonlinearities in the plume photochemistry and wildfire fuel emissions add to these complexities. In addition, decreased transmission of solar radiation due to cloudiness can have a significant impact of reducing ozone production within a fire plume.
The aim of this section is to illustrate the limitations in studying the effect of ozone production from wildfires near urban areas, and in an environment of decreased transmission of solar radiation. We consider the case of wildfires of 23 July 2018 over Attica, Greece.
The Kineta wildfire fire (examined in
Section 4) was ignited around 0900 UTC (1100 local time), in a dense pine forest in the western part of Attica, spreading rapidly; almost 5 h later, at 1355 UTC, another wildfire broke out in a mountainous forested area to the east of Attica near Mati [
37]. The rapid spread of the second wildfire toward the east affected a wildland–urban interface area and resulted in the death of 102 civilians in less than 3 h.
During the first 3 h after its ignition, the Kineta fire developed in partially cloud-free conditions at the leading edge of the baroclinic zone (see
Figure 7a). The ozone production was limited during the cloudy periods since decreased solar radiation can reduce photolysis rates significantly in the fire plume. The FRP product initially detected the fire only at 1115 UTC, most likely due to the cloud-free conditions over Kineta around that time. Between 1300 and 1700 UTC, the solar radiation near Kineta and then Mati wildfires was limited due to cloudiness related to the low-level baroclinic zone. After 1700 UTC (1900 local time), the probability of ozone production in the wildfire plumes of Kineta and Mati fires was progressively limited due to decrease in solar radiation in the evening and related photochemical transformations.
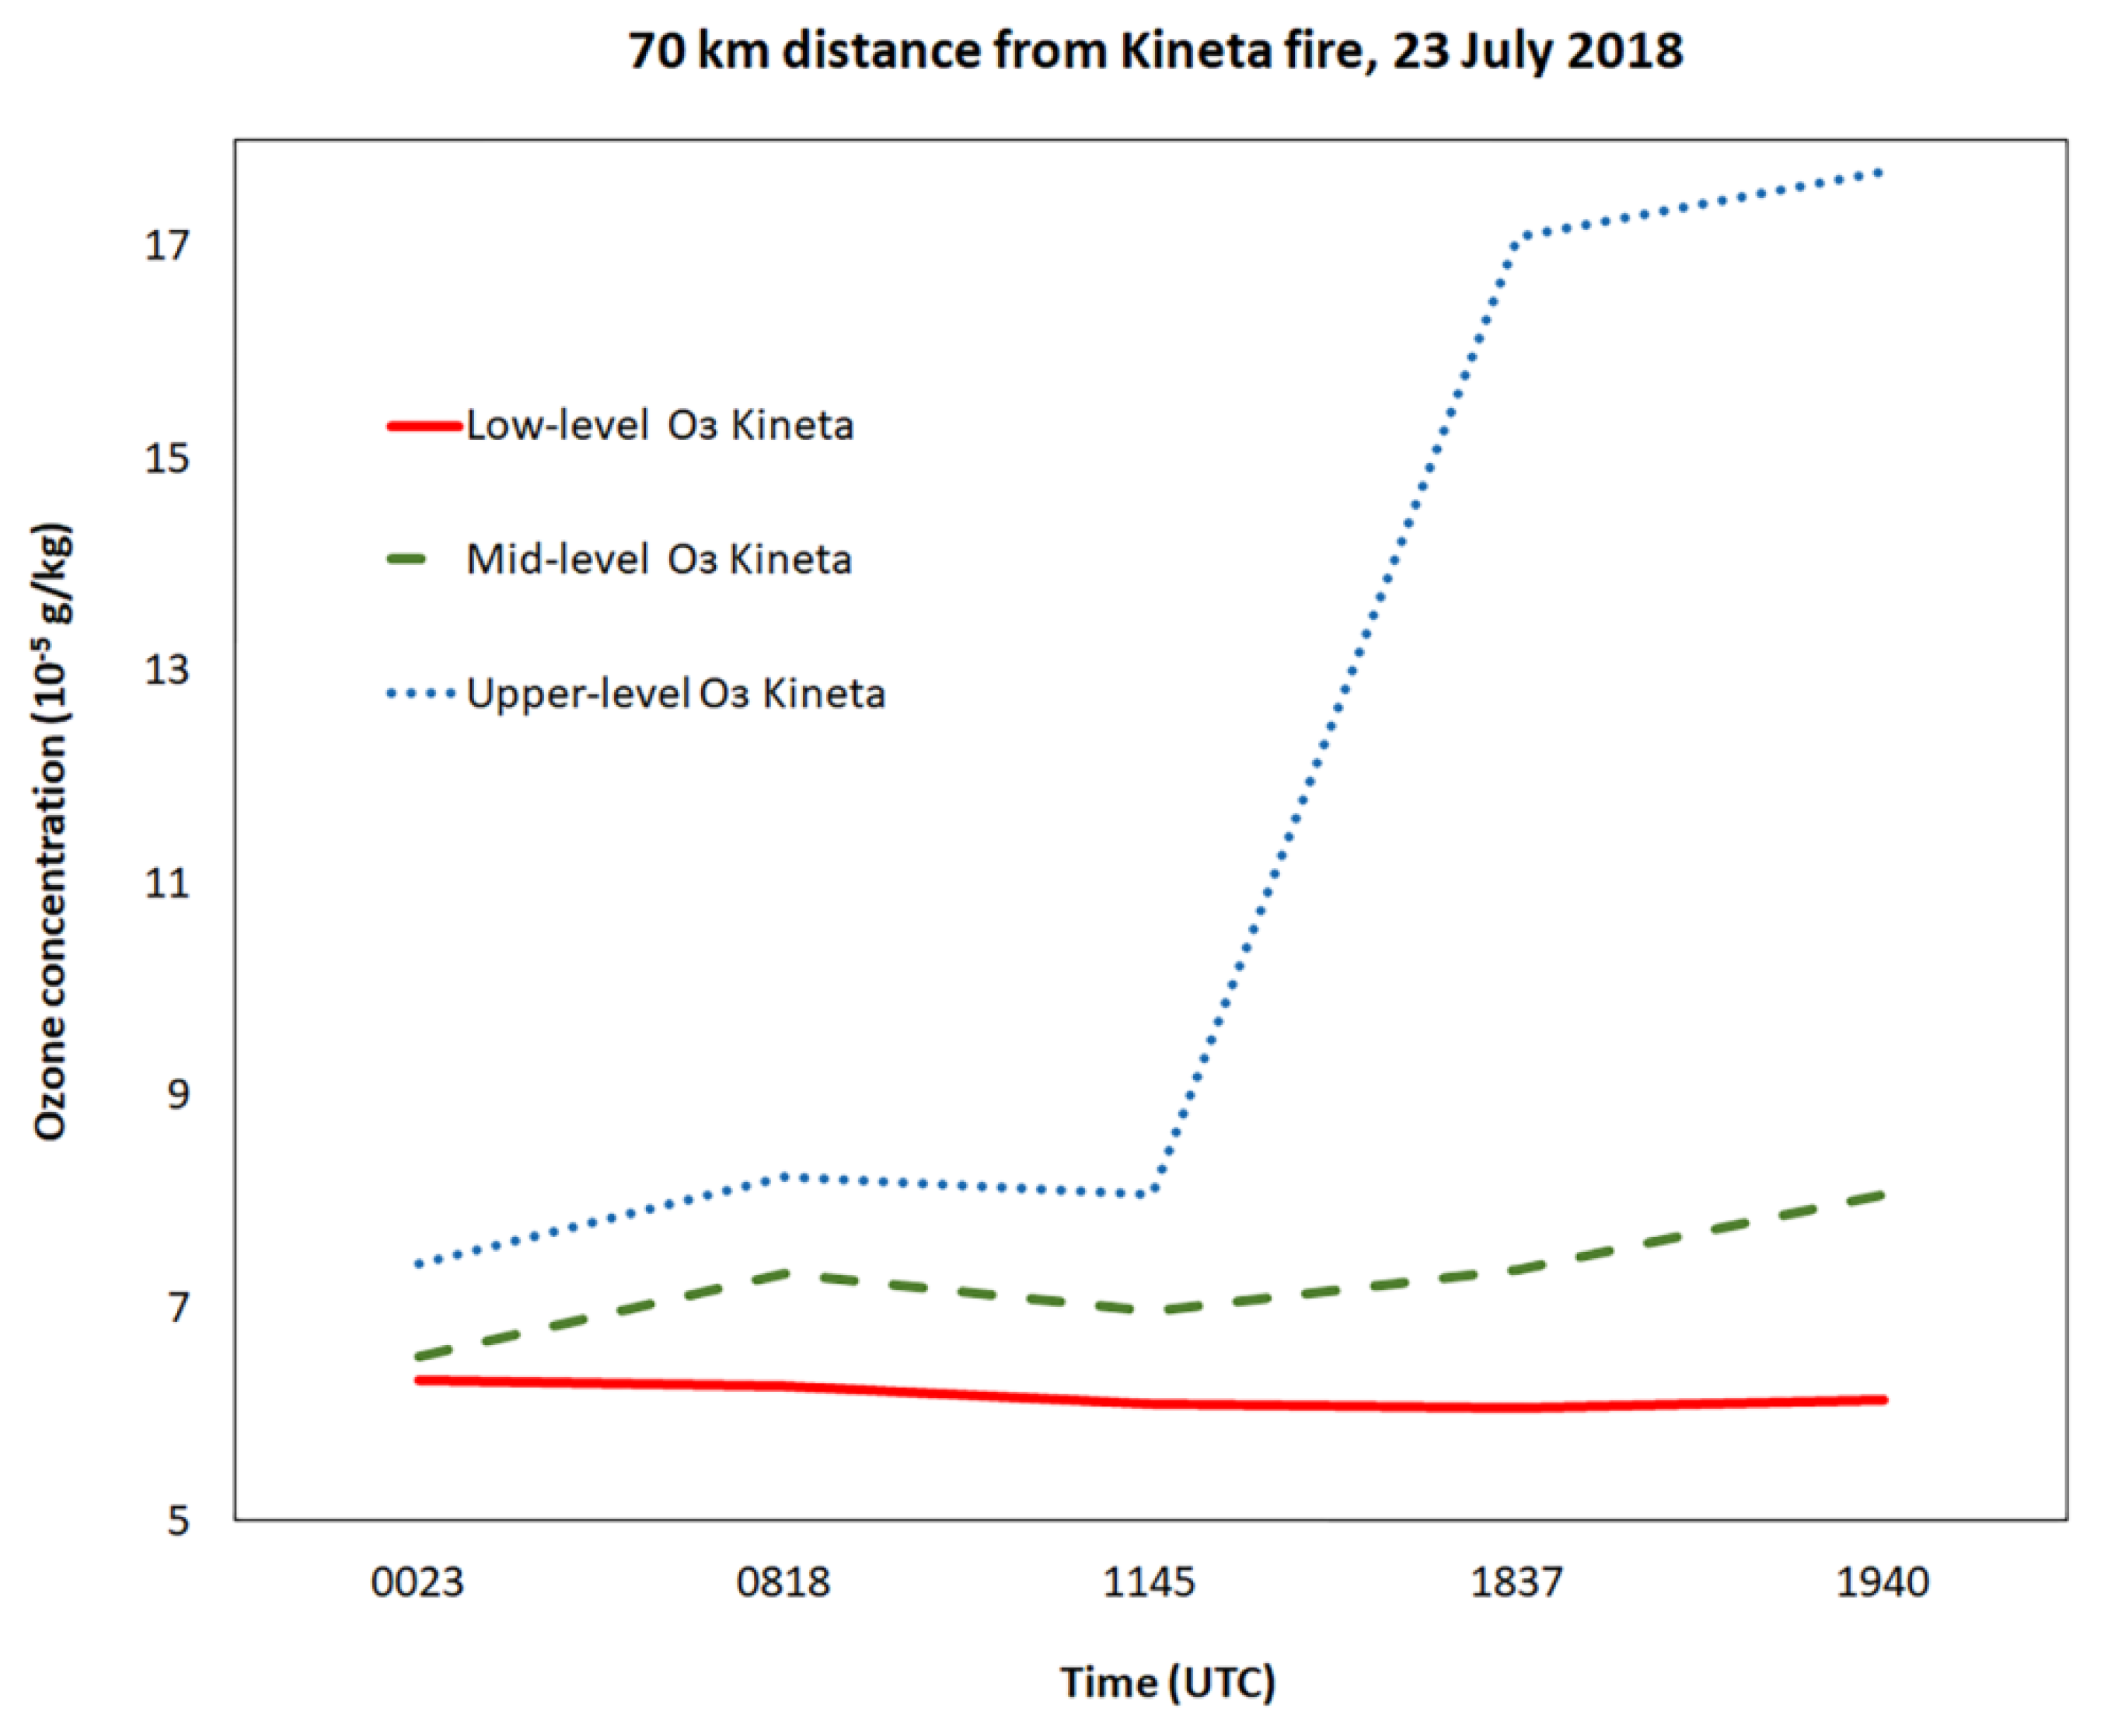
The Mati fire developed mostly under cloudy conditions and ozone production inside its plume is not expected to be significant. Moreover, because of the cloudiness, the hot spot of Mati fire was not detected by the FRP product and IASI/CrIS data for the region was very limited. The satellite imagery of Air Mass RGB composites shows that, at 1730 UTC (
Figure 7c), cloud-free conditions over the region of Kineta (solid blue arrow) were located at the rear side of the occluded front, whereas the region of Mati (dashed blue arrow) remained cloudy. For this reason, our calculations of averaged ozone concentration were performed only for the area downwind of the fire near Kineta at a distance of 70 km (up to the Mati fire location). The results are shown in
Figure 16.
Upper- and mid-level ozone concentrations strongly increased in the afternoon due to the dry intrusion (see
Section 4,
Figure 8); however, the subsidence of stratospheric air did not affect the lower tropospheric layer (
Figure 6). Regarding the low-level ozone, two points offer observational evidence that the ozone production from the Kineta wildfire was not significant. First, in this case the concentration was significantly lower than the case of wildfires near Rome on 15 and 17 July 2017 (
Figure 14) when intrusion of stratospheric air also did not affect the this area. Second, there was no significant variation in low-level ozone concentration downwind of the Kineta fire. The decreased solar radiation reduced photolysis rates significantly inside the Kineta fire plume and the overall ozone production was limited because of the cloudy periods on 23 July 2018.
6. Discussion
The results of the present work concern two aspects of the wildfire problem: (i) forecasting of increased fire risk associated with the atmospheric dynamics; and (ii) monitoring the low-level concentrations of ozone as a result of stratospheric–tropospheric exchange and chemical processes related to fire development.
In the case of 16 July 2017 over the Apennine and Western Balkans, vertical profiles of humidity and ozone, retrieved from satellite observations by IASI and CrIS instruments, confirm that a strong tropopause folding over Southern Europe and associated deep tropospheric circulations can produce abrupt drying near the ground, and thus play a major role in the sharp increase in wildfire activity. The synoptic process is clearly depicted by the evolution of the dynamic dry feature in the Meteosat WV imagery, associated with the potential vorticity anomaly passing over the region. This result confirms the findings of other authors who analyzed similar phenomena in Australia, Tasmania and USA. As shown in
Section 3, these are very deep stratospheric intrusions that influence the surface ozone concentrations. The recognition of their importance in the context of chemical transport and mixing with tropospheric air has already been established in the literature [
54,
55].
At times, the dry intrusions may contribute directly to the severe surface wind gusts [
13,
56]. The case study in
Section 4 may be considered as representative of a typical synoptic-scale dry intrusion during incidents of atmospheric blocking dominating the eastern Mediterranean. The WV imagery analyses provide evidence for two kinds of jet-like features in a cyclonic system that give rise to the strong surface winds and the intensification of wildfires, namely the bent-back front and the sting jet. Another important issue addressed here is the interaction of the over-running PV anomaly with the underlying baroclinic zone, which causes strong surface winds in the areas where the dry intrusion overruns moist air [
1]. The related strong wind gusts measured by the AMSs were identified as the primary factor for fire intensification between 1300 and 1700 UTC on 23 July 2018. The numerical simulations of Kartsios et al. [
39] for this case revealed the presence of induced orographic waves and downward transport of energy and momentum during the maximum wind speed occurrences, a mechanism that produces vertical mixing, and thus the winds at lower levels inherit the characteristics of the wind field aloft, due to conservation of momentum.
Later, the back-bent front development and the sting jet seen in the WV imagery analysis acted as secondary factors in creating further local gusty winds. Using a coupled numerical modeling system to simulate the atmosphere–fire interactions under high fire weather severity, Kartsios et al. [
39] showed that, at the Kineta fire event, the model maintained the downward motions until the early night hours of 23 July. This result is consistent with the conclusions in
Section 4, based on meteorological measurements and satellite observations, about the existence of surface wind gusts associated with dynamical processes near the bent-back front.
The results from observational analysis presented in
Section 5.1 and
Section 5.2 show that tropospheric profiles retrieved from satellite measurements by IASI and CrIS instruments are sensitive to enhanced low-level ozone concentration as a result of ozone production in cases of persistent strong winds in the area of the forest fires. However, at altitudes near the ground, the sensitivity to ozone is rather low, and one may suggest that there must be a substantial role of the prior and the kernel. The optimal estimation methodology [
29] derives the retrievals based on the combination of knowledge on the atmospheric state before the observation is made, and the information from the observation. Thus, the better the prior knowledge of the situation, the better the retrieval. For the results presented in the paper, forecast information from the global ECMWF model was used. Although the ozone forecast from ECMWF forecast model, especially in the troposphere, is not very good, if we see an enhanced ozone in the region of interest and no enhancement outside, then this is an important piece of information since the ECMWF forecast did not produce accurate ozone forecast profiles at these small scales. As ECMWF has a sampling distance of about 15–20 km, they will resolve physical phenomena for at least 50–100 km. Hence, if we detect an enhanced ozone content in the lower troposphere, most likely it comes from the satellite measurements of a real increased ozone and not from the prior information. Therefore, it is relevant to use these retrieval results in combination with information from other different sources to understand the physical phenomena considered in this study.
Determining the influence of the wildfires on ozone production is complicated because increased concentration of atmospheric pollutants near large cities is the combined effect of local emissions and the fire-derived polluted plumes [
26]. At the same time, the most extreme concentrations of ozone coincided with rapidly descending air from mid-tropospheric levels [
18]. All of these factors make the clear identification of the ozone production from wildfires a challenging task. In this context, satellite data can be used to further assess the ozone behavior in areas near large fires and far from the urban areas. Using these data, the ozone behavior can be analyzed by focusing mainly on the chemical reactions taking place during the transfer of pollutants inside the fire plumes, thus minimizing the influence of local emissions.
Jaffe and Wigder [
21] performed detailed analyses of the variables that determine the relative proportion of gas and aerosol emissions by the wildfires, and of the chemical and photochemical reactions involving these species that occur rapidly and continue downwind. They concluded that the identification of fire’s influence on ozone production is complicated because ozone is a secondary pollutant that peaks only downwind of the fire location. Our analyses included examples of complexities due to upper dynamics, wind field evolution and wildfire development near urban areas. Our findings (mainly
Figure 13 and
Figure 14) suggest that, in situations of stratospheric intrusions and dry air subsidence, which are often accompanied by increased fire activity, significant fluctuations in mid- and upper-level ozone may be present in short distances (
Section 5.2). Such a complex ozone distribution is related to the positions of the sounding footprints in regards to the upper-level moisture boundaries and the intensity of the vertical mixing processes. In order to avoid uncertainties in the ozone production, timing and dispersion of fire emissions we considered the averaged ozone concentrations over all clear sky soundings in downwind areas along with plots of ozone profiles. Aiming to determine whether the enhanced low-level ozone concentrations may be solely the result of fire activity or if the vertical transport of ozone-rich air masses of stratospheric origin play an important role, the averaged ozone concentration downwind of these wildfires was examined by considering the average profile values within three tropospheric layers.
The results of our analysis show that the spatial and vertical resolution of soundings from satellite measurements provide a way of identifying areas of enhanced ozone downwind of wildfires (
Section 5.1). Considering the evolution of the averaged ozone concentrations downwind of the fires in the case of 16–17 July 2017 over Croatia/Herzegovina/Italy (
Section 5.2), it became apparent that satellite sounding data have the potential to distinguish between cases of ozone production from wildfire biomass burning and cases where the photochemical transformation in the fire plume is limited. However, it is rather difficult to find ozone enhancements downwind of fires in the environment of a complex wind field as in the case considered in
Section 5.3.
Cloudy conditions have also been shown to affect the ozone production and loss reactions. The Kineta fire (considered in
Section 5.4) developed in partially cloudy conditions during the passage of the baroclinic zone and during the late afternoon, which led to an environment of reduced solar radiation inside the wildfire plume, resulting in limited photochemical production of ozone.
The results of our study show that satellite data from IASI and CrIS instruments can provide valuable information regarding ozone horizontal and vertical distributions in the environment of wildfires, including the effects of downward motions bringing ozone-rich air associated with the dry stratospheric intrusions. In combination with FRP product estimations of the energy released from the biomass burning and WV imagery, such satellite sounding data may contribute to a better understanding of these complicated phenomena.


 ,
, 


