Article

Particle Number Concentration: A Case Study for Air Quality Monitoring

1
Hevesy György Ph.D. School of Chemistry, Eötvös Loránd University, P.O. Box 32, H-1518 Budapest, Hungary
2
Institute of Chemistry, Eötvös Loránd University, P.O. Box 32, H-1518 Budapest, Hungary
*
Author to whom correspondence should be addressed.
Atmosphere 2022, 13(4), 570; https://doi.org/10.3390/atmos13040570
Submission received: 28 February 2022 / Revised: 23 March 2022 / Accepted: 29 March 2022 / Published: 1 April 2022
(This article belongs to the Special Issue Air Quality in Hungary)

Abstract

:
Particle matter is one of the criteria air pollutants which have the most considerable effect on human health in cities. Its legislation and regulation are mostly based on mass. We showed here that the total number of particles and the particle number concentrations in different size fractions seem to be efficient quantities for air quality monitoring in urbanized areas. Particle number concentration (N) measurements were realized in Budapest, Hungary, for nine full measurements years between 2008 and 2021. The datasets were complemented by meteorological data and concentrations of criteria air pollutants. The annual medians of N were approximately 9 × 103 cm−3. Their time trends and diurnal variations were similar to other large continental European cities. The main sources of N are vehicle road traffic and atmospheric new aerosol particle formation (NPF) and consecutive growth events. The latter process is usually regional, so it appears to be better assessible for contribution quantification than mass concentration. It is demonstrated that the relative occurrence frequency of NPF was considerable, and its annual mean was around 20%. NPF events increased the contribution of ultrafine (UF < 100 nm) particles with respect to the regional particle numbers by 12% and 37% in the city center and in the near-city background, respectively. The pre-existing UF concentrations were doubled on the NPF event days.

1. Introduction

Air pollution is one of the most important factors affecting human health, the climate, and the environment. Around 91% of the world’s population live in places with poor air quality. The ambient air pollution is estimated to account for 4.2 million premature deaths per year worldwide due mainly to stroke, lung cancer, heart disease, and acute and chronic respiratory diseases [1]. The sources of air pollution are multiple and complex. On a global scale, the major anthropogenic ambient sources include road vehicles, residential energy production for heating and cooking, power generation, industry, and agriculture [2]. The identification and characterization of the sources are crucial for understanding the effects of pollutants, as well as to develop suitable policies and technologies for moderating the air pollution, especially in cities [3].
Ambient air quality is ordinarily expressed by concentrations of certain key air pollutants and their health limit values. According to the World Health Organization (WHO), the key air pollutants include O3, NO2, SO2, CO, PM2.5 mass, and PM10 mass [1]. The latter two species express the particulate matter (PM) with aerodynamic diameters below 2.5 and 10 µm, respectively. As far as the health limits are concerned, there are global guidelines which also offer quantitative health-based recommendations for air quality management, namely, guidance on how to decrease the levels of these pollutants [1]. The European Environmental Agency (EEA) completed this list with NOx (= NO + NO2), Pb, and benzene [4] and set their health limits. The U.S. Environmental Protection Agency (EPA) defined six outdoor criteria air pollutants, CO, Pb, ground-level O3, NO2, PM2.5 or PM10 masses, and SO2, and determined National Ambient Air Quality Standards (NAAQS) for them [5]. There are many further chemical species which are usually present in the ambient air and which can also cause harmful consequences for human health. The list of the key air pollutants can be further extended, e.g., by soot.
The regulatory issue of the PM is especially complicated since it is not a single chemical species, but it is a heterogeneous system which contains a complex mixture of more than a thousand of inorganic and organic compounds in their condensed phase dispersed in the air. In addition, as a colloidal system, it can be characterized by several different metrics that express important properties of particles. Hence, it cannot be expected that a single or a few metrics of the PM explain its comprehensive health effects. Particulate matter mass (in a certain size range), which is involved in the regulations, is one of the simplest quantities. It is usually associated with the health impacts of particles. Most epidemiological studies were based on mass as the dose metrics. The mass of atmospheric aerosols is, however, made of larger, i.e., coarse and fine particles. The mass contribution of smaller, e.g., of ultrafine (UF) particles (with an equivalent diameter <100 nm) is negligible. There are some PM types, atmospheric conditions, and specific health effects in which some other PM properties than the mass become important. These may include the number and surface area of particles. Many recent epidemiological and toxicological studies demonstrated that particle number concentrations, especially of UF particles, have a more considerable effect on human health than mass concentration [6,7,8,9,10,11,12,13,14,15]. UF particles, due to their size, can penetrate the respiratory system and even enter into the bloodstream and can cause inflammation and respiratory and cardiovascular diseases. This size fraction also represents an excess health risk relative to coarse and fine particles with the same or similar chemical composition [16,17]. It is worth mentioning that 70–80% of total particles in cities belong to the UF size range. It is, therefore, a plausible intention and requirement to extend the list of the key air pollutants by further aerosol metrics such as particle number concentration.
There have been mitigation policies and control regulations to reduce the emission of particle numbers as part of an overall air-quality improvement strategy since the 1990s. The legislation in the EU, including Hungary, focus, e.g., on particle emissions from diesel engines [18]. There were some important changes in the car emissions, which included the introduction of Euro 5 and 6 regulations for light-duty vehicles in January 2011 and Euro VI regulations for heavy-duty vehicles in September 2015 (the number of emitted particles with diameters >23 nm should be <6 × 10¹¹ km–1). The concentration of sulfur in diesel fuel for on-road transport was decreased in several phases to <10 ppm in January 2009 [19]. Sulfur content in fuels for mobile non-road diesel vehicles—including mobile machinery, agricultural and forestry tractors, inland waterway vessels, and recreational crafts—was limited to a level of 1000 ppm in 2008 and at 10 ppm in 2011. Dangerous fuel types for domestic heating are also listed, their emission factors are determined, and the accumulated information is disseminated among potential users. As far as secondary particles are concerned, it is not straightforward to reduce their concentration levels because the effects of gaseous and aerosol species are complex due to their nonlinear relationships and feedbacks in their related processes.
Total particle number concentrations are easily measured for monitoring purposes by condensation particle counters (CPCs), whereas particle number size distributions can be determined by online mobility particle size spectrometers. The latter systems possess the advantage that concentrations for different size fractions can be derived from the measured data. This is important, since different size fractions are related to different source types, atmospheric properties, and processes.
There are two major source types of particle numbers in the atmosphere: new particle formation and growth (NPF) events and high-temperature emissions. The former process is the dominant source in the global troposphere [20,21,22,23]. In cities and urbanized areas, the particle number concentrations are strongly affected by high-temperature emission sources from different sectors such as industrial processes, domestic installations, residential heating and cooking, vehicular road traffic, and power production [24,25]. In large cities, primary particles prevail over secondary particles [26,27,28]. Vehicles emit primary aerosol particles but also contribute to secondary aerosol particle formation by emitting their precursors [3]. New particle formation and growth events have been proven to be also be common in large cities, and they can have large particle number contributions on nucleation days [29]. Local meteorological conditions and long-range transport of air masses can play substantial roles in the concentrations actually realized [30]. It seems to be relevant and useful to investigate and overview the properties and behavior of particle number concentrations in longer data sets from the air quality aspects as well.
Atmospheric particle number concentrations in various size fractions and meteorological data for nine full measurement years are available for Budapest. Budapest is the capital of Hungary, which is located in the Carpathian Basin in Central Europe. It is the biggest and the most inhabited city of the country with around 525 km2 of land area and has a population of 1.72 million inhabitants. The number of passenger cars registered in Budapest (596 × 103 in 2008 and 691 × 103 in 2020) increased slowly, while the share of the diesel-powered passenger cars enhanced somewhat more from approximately 20% in 2008 to 36% in 2020 [31]. The number of buses (ca. 4000) registered in Budapest and the share of the diesel-power buses (98%) on the national bus fleet remained constant.
The major objectives of this study are to overview the properties and time trends in particle number concentrations, to investigate their main sources, and to determine and discuss the contribution of NPF events to particle number concentrations. Further goals are to discuss the trends in nucleation source intensity and to interpret its consequences for the urban air quality.

2. Methods

2.1. Experimental Part

The measurements were performed in two different urban sites in Budapest. Most measurements were realized at the Budapest platform for Aerosol Research and Training (BpART) Laboratory (47°28′29.9″ N, 19°3′44.6″ E; 115 m above mean sea level, m.s.l.) of the Eötvös Loránd University. The location represents a well-mixed, average atmospheric environment for the city center due to its geographical and meteorological conditions [32]. Therefore, it can be regarded as an urban background site. The main local emissions are diffuse urban traffic exhaust, residential and household emissions, industrial sources, and some off-road transport [33]. The long-range transport of air masses can also play an important role. The other location was situated at the northwestern border of Budapest in a wooded area of the Konkoly Astronomical Observatory (47°30′00″ N, 18°57′47″ E; 478 m above m.s.l.) of the Hungarian Academy of Sciences. This site characterizes the air masses entering the city because the prevailing wind direction in the area is northwesterly. The location represents the near-city background.
The time intervals investigated comprise 9 full measurement years: (Y1) from 3 November 2008 to 2 November 2009, (Y2) from 19 January 2012 to 18 January 2013, (Y3) from 13 November 2013 to 12 November 2014, (Y4) from 13 November 2014 to 12 November 2015, (Y5) from 13 November 2015 to 12 November 2016, (Y6) from 28 January 2017 to 27 January 2018, (Y7) from 28 January 2018 to 27 January 2019, (Y8) from 28 January 2019 to 27 January 2020, and (Y9) from 28 January 2020 to 27 January 2021. The measurements in year Y2 were performed in the near-city background, while they were realized in the city center in the other years. As the time base of the data, local time (LT = UTC + 1 or daylight saving time, UTC + 2) was chosen because it has been observed that the daily activity of inhabitants significantly influences many atmospheric processes in the urbanized areas [34,35,36].
The particle number size distributions were determined by a laboratory-made flow-switching-type differential mobility particle sizer (DMPS) [37,38]. The system operates in the electrical mobility diameter range from 6 to 1000 nm in the dry state (with a relative humidity (RH) < 30%) of particles in 30 channels with a time resolution of 8 min [32,37]. Its main components include a Ni-60 radioactive bipolar charger, a Nafion semi-permeable membrane monotube dryer, a 28-cm-long Vienna-type differential mobility analyzer, and a butanol-based CPC (TSI, model 3775, USA, Shoreview, MN). The instrument was operated in two sets of flows: In the high flow mode, the aerosol flow rate was 2.0 L min−1, and in the low mode, it was 0.31 L min−1, while the sheath air flow rates were 10 times larger than the sample flows. The measurements were performed in a continuously way according to the international technical standards [39,40].
The CPC instrument (TSI, model 3752, USA, Shoreview, MN) operated with an aerosol inlet flow of 1.5 L min−1 and measured concentrations of particles with diameters above 4 nm using butanol as a working fluid. Mean particle number concentration data were extracted from its database with a time resolution of 1 min. The data were utilized for quality control of the integrated DMPS data.
The concentrations of SO2; NO, NOx, and NO2; O3; CO; and PM10 mass and PM2.5 mass were measured by UV fluorescence (Ysselbach 43C, Budapest, Hungary), chemiluminescence (Thermo 42C, Waltham, MA, USA), UV absorption (Ysselbach 49C, Budapest, Hungary), IR absorption (Thermo 48i, Waltham, MA, USA), and beta-ray attenuation (two Environment MP101M instrument with PM10 and PM2.5 inlets) methods, respectively, with a time resolution of 1 h. The experimental data were acquired from the closest measurement stations of the National Air Quality Network in Budapest, which is located 4.5 km from the city center site and 6.9 km from the regional background site in the upwind prevailing wind direction [41].
Most meteorological measurements for the city center took place on-site. Air temperature (T), RH, wind speed (WS), and wind direction (WD) data were obtained by standardized meteorological methods (HD52.3D17, Delta OHM, Padova, Italy, and SMP3 pyranometer, Kipp and Zonen, Delft, The Netherlands, respectively) with a time resolution of 1 min (except for Y1, when it was 1 h). The meteorological data for the near-city background were measured using a mobile meteorological station installed at the measurement location at a height of ca. 2 m from the ground and the time resolution was 10 min.
The data coverage for particle number concentrations, meteorological data, and criteria air pollutants were 94, >90, and >85%, respectively, over the whole interval.

2.2. Data Treatment

The measured DMPS data were inverted into discrete size distributions that were utilized to calculate particle number concentrations in the diameter ranges 6–25 nm (N6–25), 25–100 nm (N25–100), 6–100 nm (N6–100), 100–1000 nm (N100–1000), and 6–1000 nm (N6–1000). These size intervals were selected to represent various important particle source types. The concentrations N6–25 are associated with NPF events [20,26,42], N25–100 are mostly emitted by incomplete combustion (such as vehicle road traffic or household heating) in urbanized areas or generated by condensational growth of new particles, and N100–1000 mostly represents physically and chemically aged, thus regional particles [34,36]. The concentration N6–100 (of UF particles) is of special interest since it is often related to excess health effects, while the N6–1000 represents the total particles. The DMPS data were also utilized to generate daily particle number size distribution surface plots for identification and classification of the NPF events [43,44,45]. The following classes were defined: event days, non-event days, undefined days, and missing days. The relative occurrence frequency of NPF events (fNPF) was determined individually for each month and year as the ratio of the number of event days to the total number of relevant days.
The importance and contribution of particles generated by NPF events were assessed by nucleation strength factors (NSFs) [34]. There are two factors, which are defined as follows:
NSF NUC = N 6 100 N 100 1000 nucleation   days N 6 100 N 100 1000 non nucleation   days     ,  
NSF GEN = N 6 100 N 100 1000 all   days N 6 100 N 100 1000 non nucleation   days   .  
It was implicitly assumed that the production of larger particles (>100 nm) was much smaller than the concentration of UF particles. This is typical for cities, and it can be proved by considering the contributions of UF particles to the total particle numbers [45,46]. The NSFNUC is determined exclusively for nucleation days, while the NSFGEN is derived for all available days. The former property represents the concentration increment from NPF on an ordinary nucleation day with respect to N100–1000, while the latter quantity expresses the overall increment in particles in general, thus on an average day [26]. Both NSFs were calculated separately for each month, each measurement year, and the whole measurement interval. Their diurnal variations were also derived.

3. Results and Discussion

3.1. Atmospheric Concentrations and Their Ratios
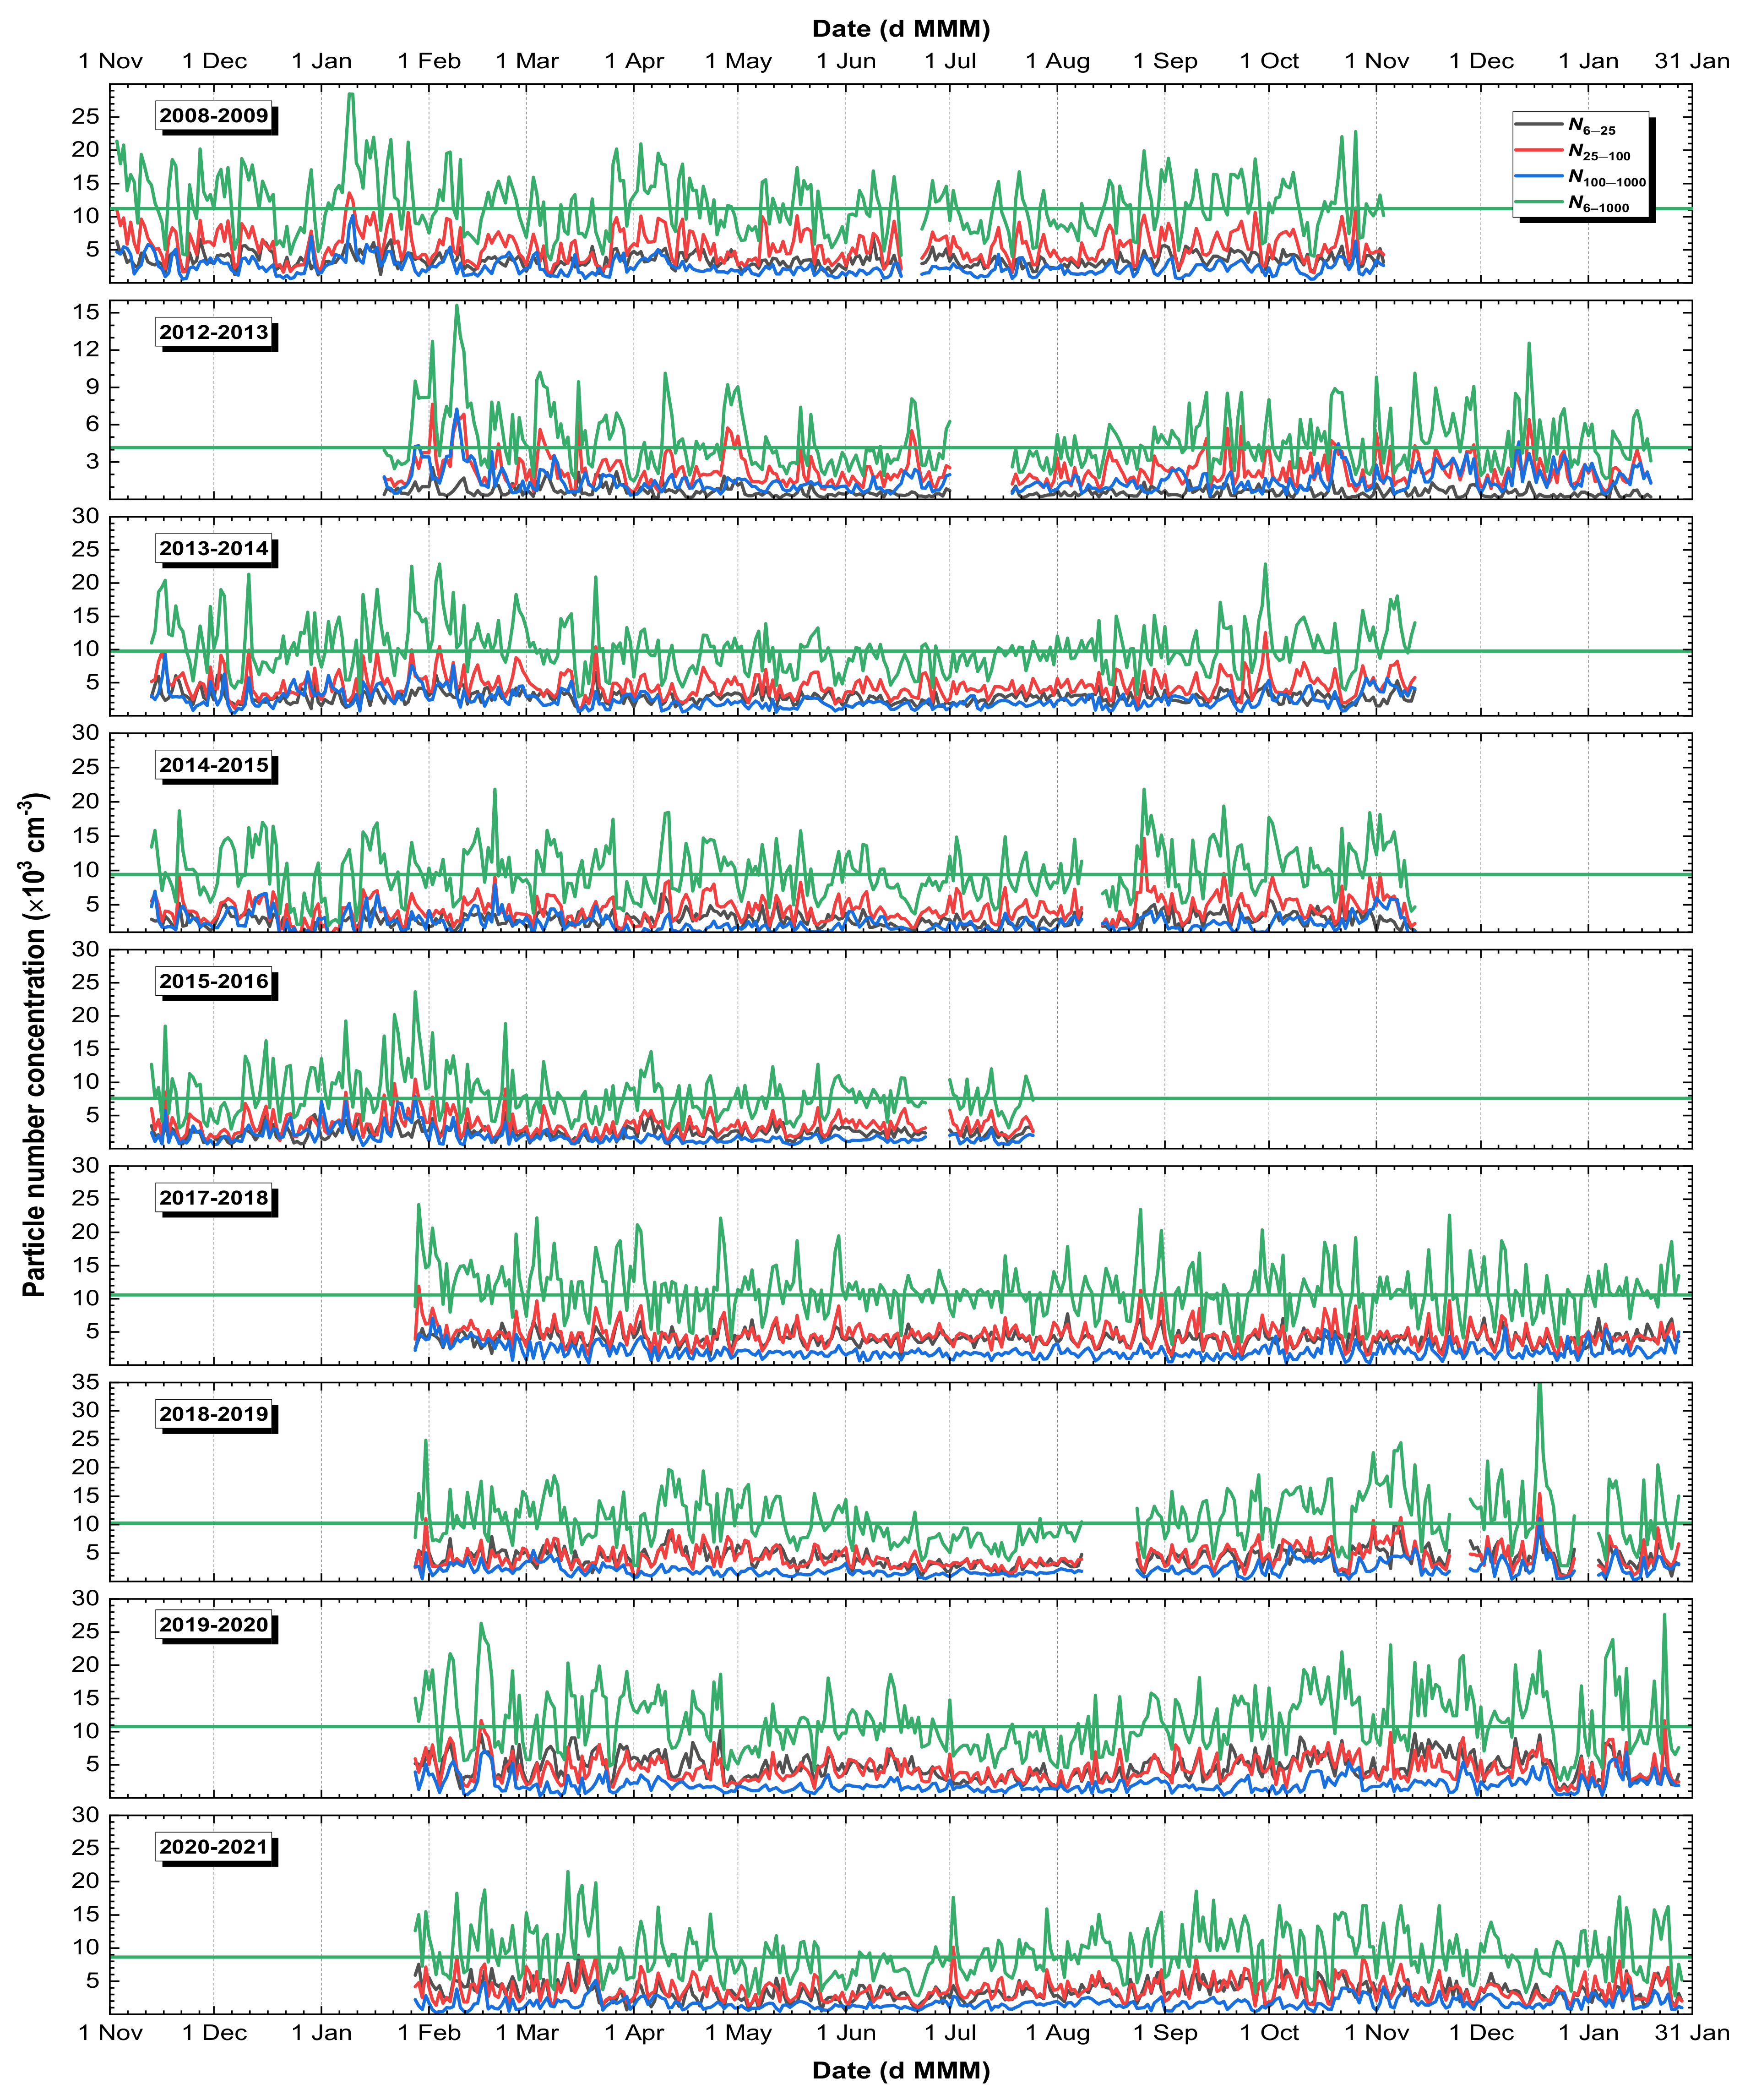
Basic descriptive statistics of the particle number concentrations in different relevant size fractions are summarized in Table 1. They demonstrate that the minimum concentrations in a selected size range were usually similar to each other over the years, while the other concentrations tended to be distinctly larger in the city center (Y1, Y3–Y9) than in the near-city background (Y2). This is due to the larger anthropogenic sources of particles in the city than in its surroundings. The vehicle road traffic represents the major contribution, and the traffic intensity is larger in the city center with respect to the near-city background. From this aspect, particle number concentration is indeed a valuable and useful quantity to express several important urban anthropogenic activities. The ranges of the concentrations were rather large; they could be expressed by a factor of 300. This is a specific feature of particle number concentrations, and it is mainly related to the dynamic character of their sources, atmospheric processes, and relatively short residence time of smaller (UF) particles. It is seen that there was a decreasing trend in the N6–1000 and N6–100 for the city center from 2008 over the years, and this was likely interrupted in 2016. The change in the N100–1000 appeared to be more modest, which can be explained by the baseline character of this size range. The concentrations are in line with or similar to those in other large European cities [11,47,48,49,50,51,52,53].
The N6–100 represents the major contribution to the total particle numbers both in the city center and the near-city background [41]. Their mean values and SDs were (78 ± 10)% and (67 ± 16)%, respectively. In the city center, this is mostly due to the vehicle road traffic and other high-temperature emission sources. In urban areas, N25–100 is also mainly composed of particles from high-temperature emission sources, which explains its larger temporal variability. The mean contribution and SDs of the chemically aged (regionally representative) particles to the total numbers were (22 ± 10)% and (33 ± 14)%, respectively.

3.2. Time Series

The annual time series of particle number concentrations in different size ranges during all measurement years are shown in Figure 1. We can see that there was no considerable monthly or seasonal variability of concentrations during a year. This is different from PM mass concentrations. It can be explained by relatively constant sources, atmospheric processes, and decrease in particle numbers over a year. The concentrations N6–25, N25–100, and N6–1000 showed larger temporal variability, while the changes in N100–1000 were more modest. This can be explained by the different major sources of size-fractionated particles, as discussed in Section 3.1.
The diurnal distribution of the air pollutants and particle number concentrations in different size ranges are presented in Figure 2. We can see that the concentrations of SO2 and PM2.5 mass did not change substantially during the day. They seem to have little relation with the vehicle road traffic. This is because the sources of the fine particles in Budapest are mostly related to non-vehicular processes [33]. In the case of the diurnal variation in PM10 mass, we can see that it changed slowly and modestly during the day with tendencies for lower concentration overnight and higher levels during daylight. This can be related to their major sources such as the resuspension of urban dust, emissions from material wear from moving parts of vehicles, and the ageing of exhausted particles from vehicles and their relatively large atmospheric residence time [54]. At the same time, we can see that NO, NO2, and CO concentrations show two peaks corresponding to the typical behavior of traffic [55]. These pollutants are mainly related to vehicle road traffic. The peaks appeared around the typical rush hours in Budapest [55]. This property can be identified most evidently in the case of N25–100. This is explained by the fact that the main source of this size range (25–100 nm) in urban environments is incomplete combustion [36], thus vehicle traffic. On the diurnal pattern of N6–25, three peaks were identified; the first and the last can be associated with road traffic, while the peak around noon is linked to NPF events. The diurnal variation of N100–1000 was more constant, and it only showed modest variability, as expected. All these features are reflected back on the diurnal variation of the total particle number.
The diurnal series obviously showed associations among particle number concentrations and vehicle traffic. Furthermore, it was estimated that ca. 70% of total particle numbers in cities are generated by emissions [24]. This can, however, sensitively depend on and change with the local and regional atmospheric properties and conditions. Therefore, its contribution or importance are challenging to estimate. Instead of this, we assessed the contributions from NPF events in the present study since this process is related to a larger region at least in the study area, i.e., in the Carpathian Basin [38].

3.3. New Aerosol Particle Formation and Growth Events

The total number of NPF events in 9 years was 663. Its annual mean and SD were 74 ± 17. They resulted in an overall mean relative occurrence frequency and SD of (21 ± 4)%. It means that the phenomenon occurred with a considerable rate; there was an NPF event every fifth day on a yearly scale. This also suggests that the NPF events are an important source of particles even in cities. The numbers of nucleation days for the different months in each year are summarized in Table 2. The distributions of the monthly mean counts exhibited obvious differences, while the annual total counts were similar to each other in various aspects, except for year Y5, which also showed the smallest annual count. We could not find plausible explanation for this extremely small value.
The other differences can likely be explained by substantial changes in multifactorial conditions and by the complex interplay among the influential environmental variables over a year and by inter-annual differences in chemical, aerosol and meteorological properties and in biogenic cycling [56,57,58]. The number of NPF event days in the near-city background location (Y2) was the highest among them. The realization of NPF events depends on the competition between the sources and sinks of condensing vapors expressed by their ratio [58]. They can still create favorable conditions for NPF occurrence for smaller source intensities if the condensation sink (CS) is even lower. This is expected to be the typical case for the near-city background site.
The mean fNPF values were calculated separately for days of the week and for workdays and holidays in the city center for 8 years (Figure 3). It can be seen that the values for the holidays were significantly larger than for the workdays or for the overall mean. On weekends, especially on Sundays, some anthropogenic sources are substantially reduced. For instance, the road traffic on weekends is decreased by approximately 30% with respect to workdays [55]. This results in smaller CS on these days, which appears to be favorable for the NPF event occurrence. As far as the workdays are concerned, they seem to fluctuate around their mean value. Mondays seem to exhibit somewhat lower frequency, which can likely be explained by usually larger traffic intensities on this day than on the other workdays. These results demonstrate that anthropogenic activities, in particular, vehicle road traffic, do affect the urban NPF phenomenon.

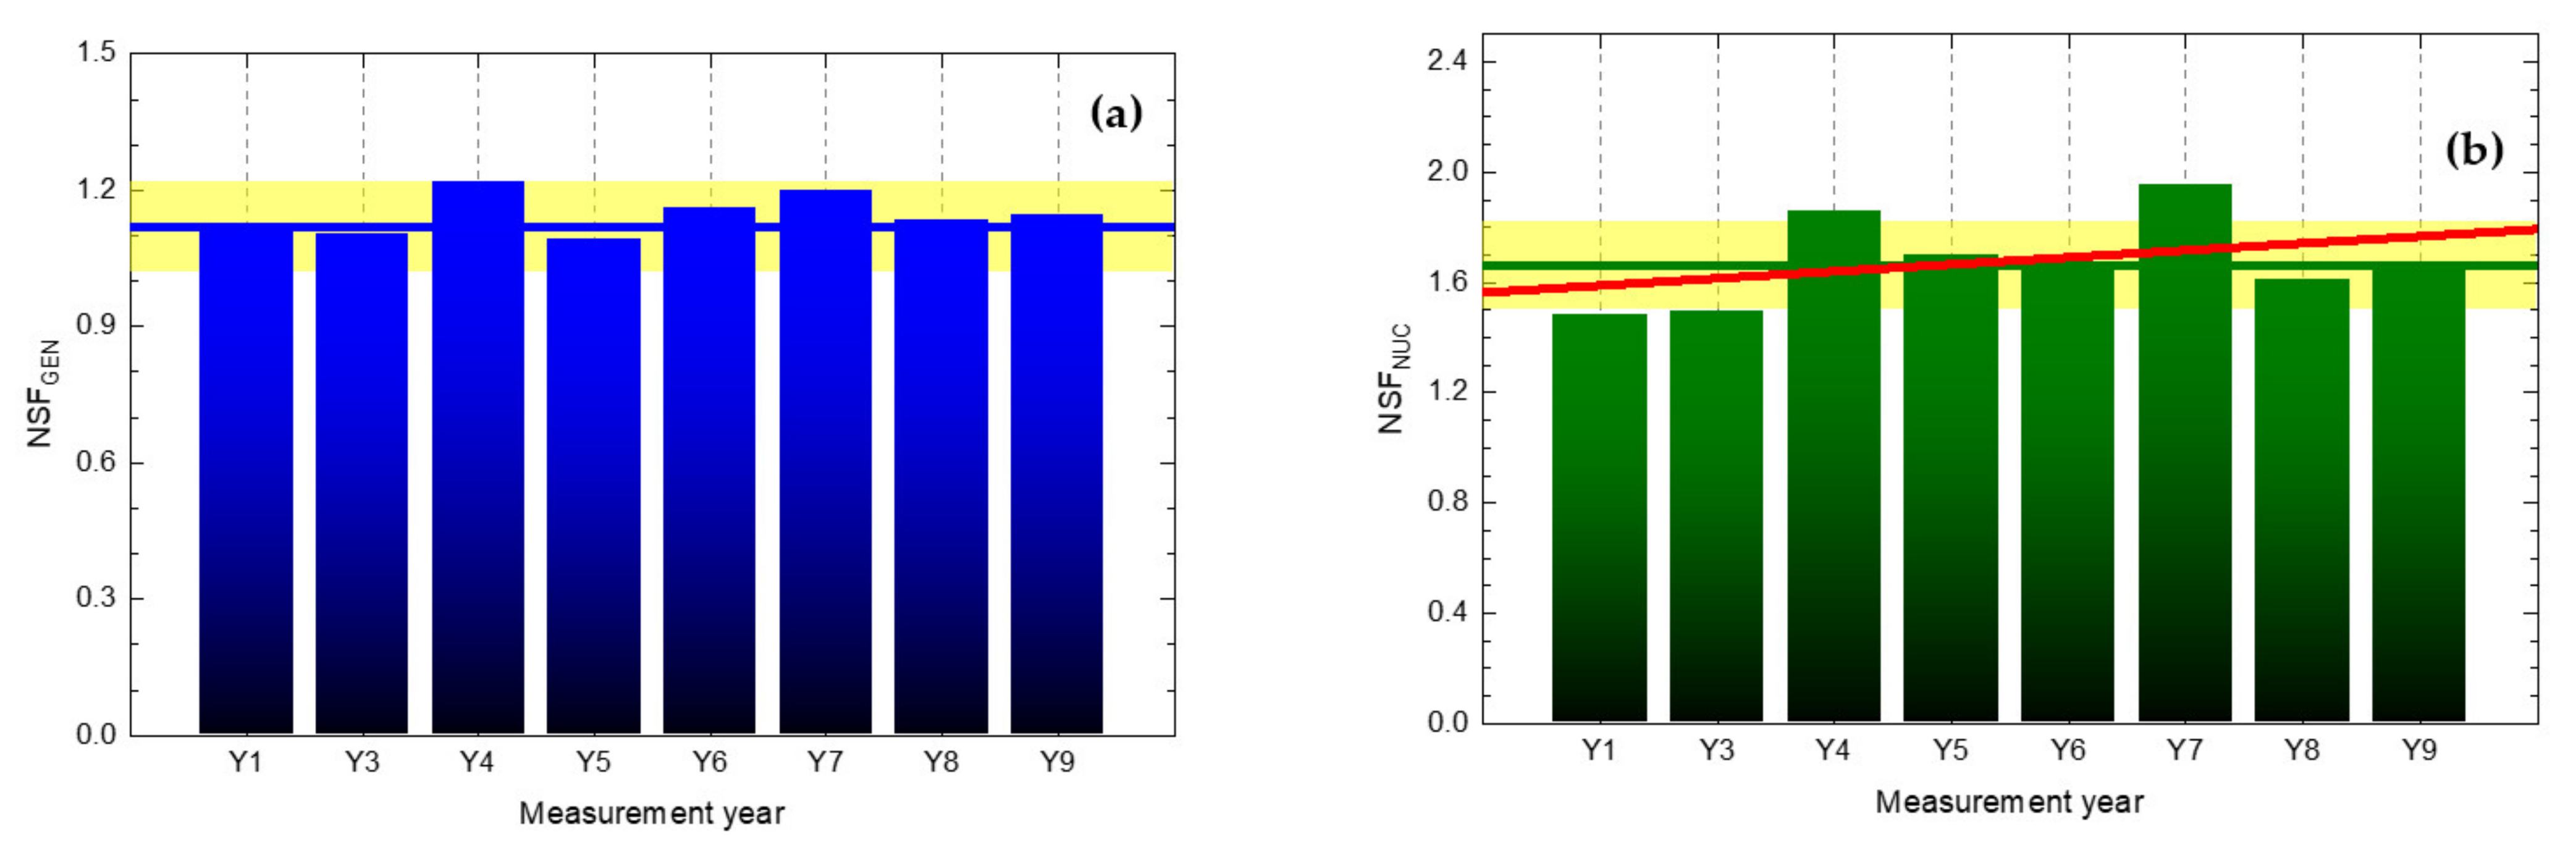
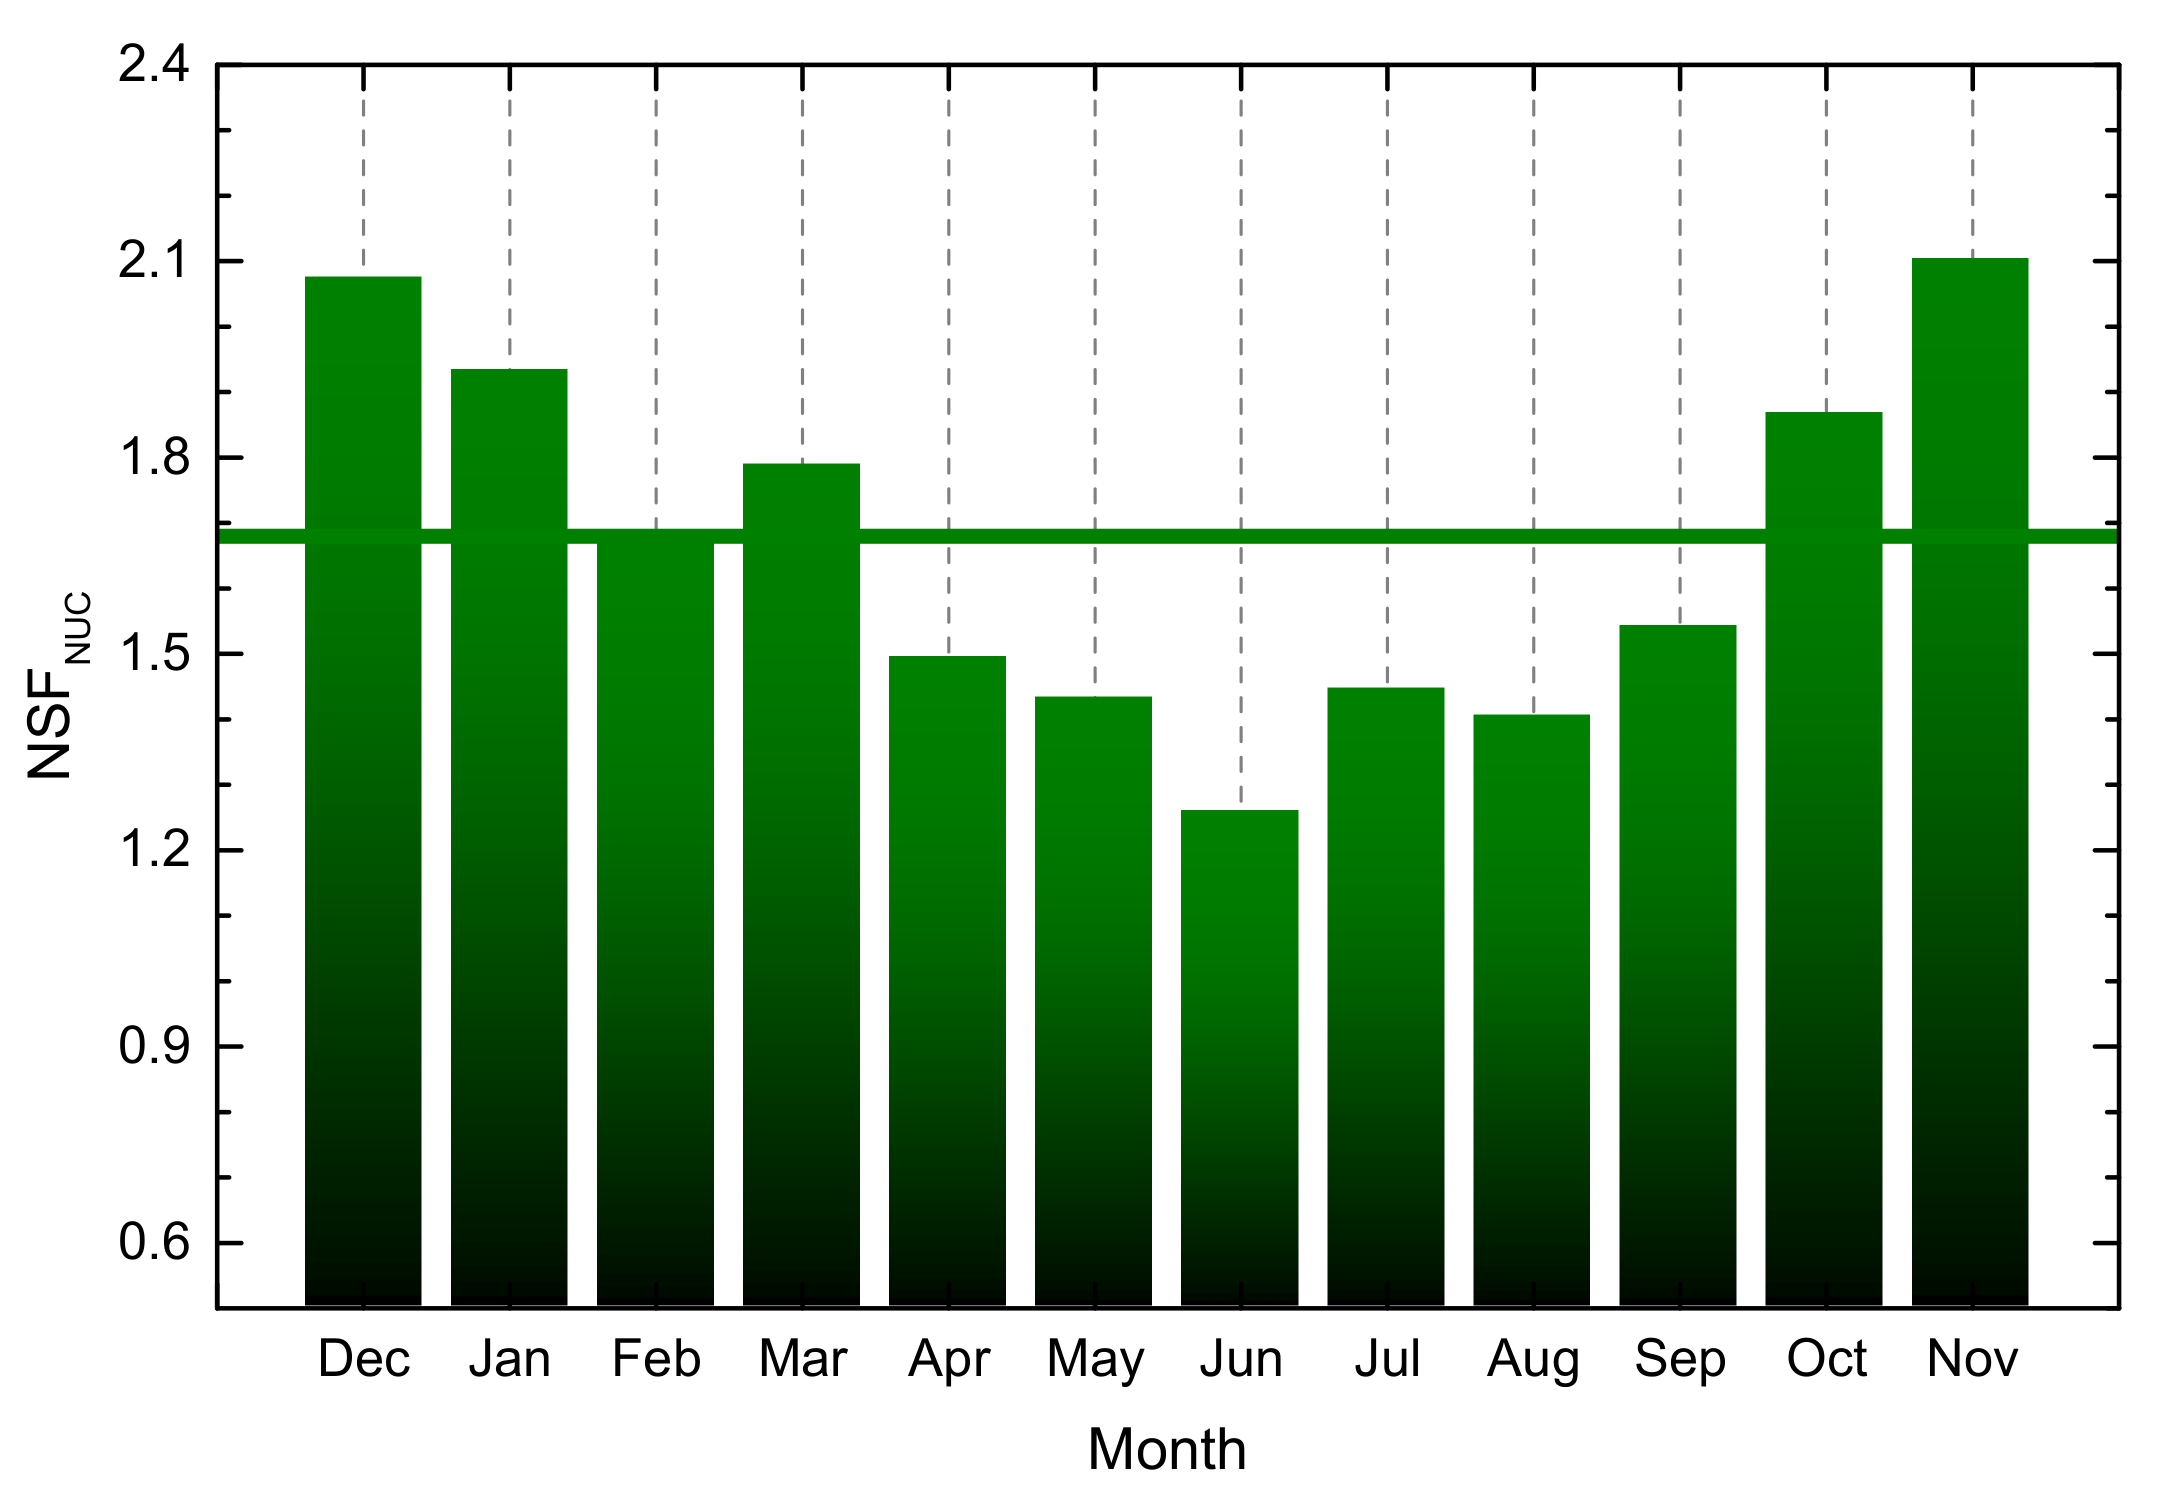
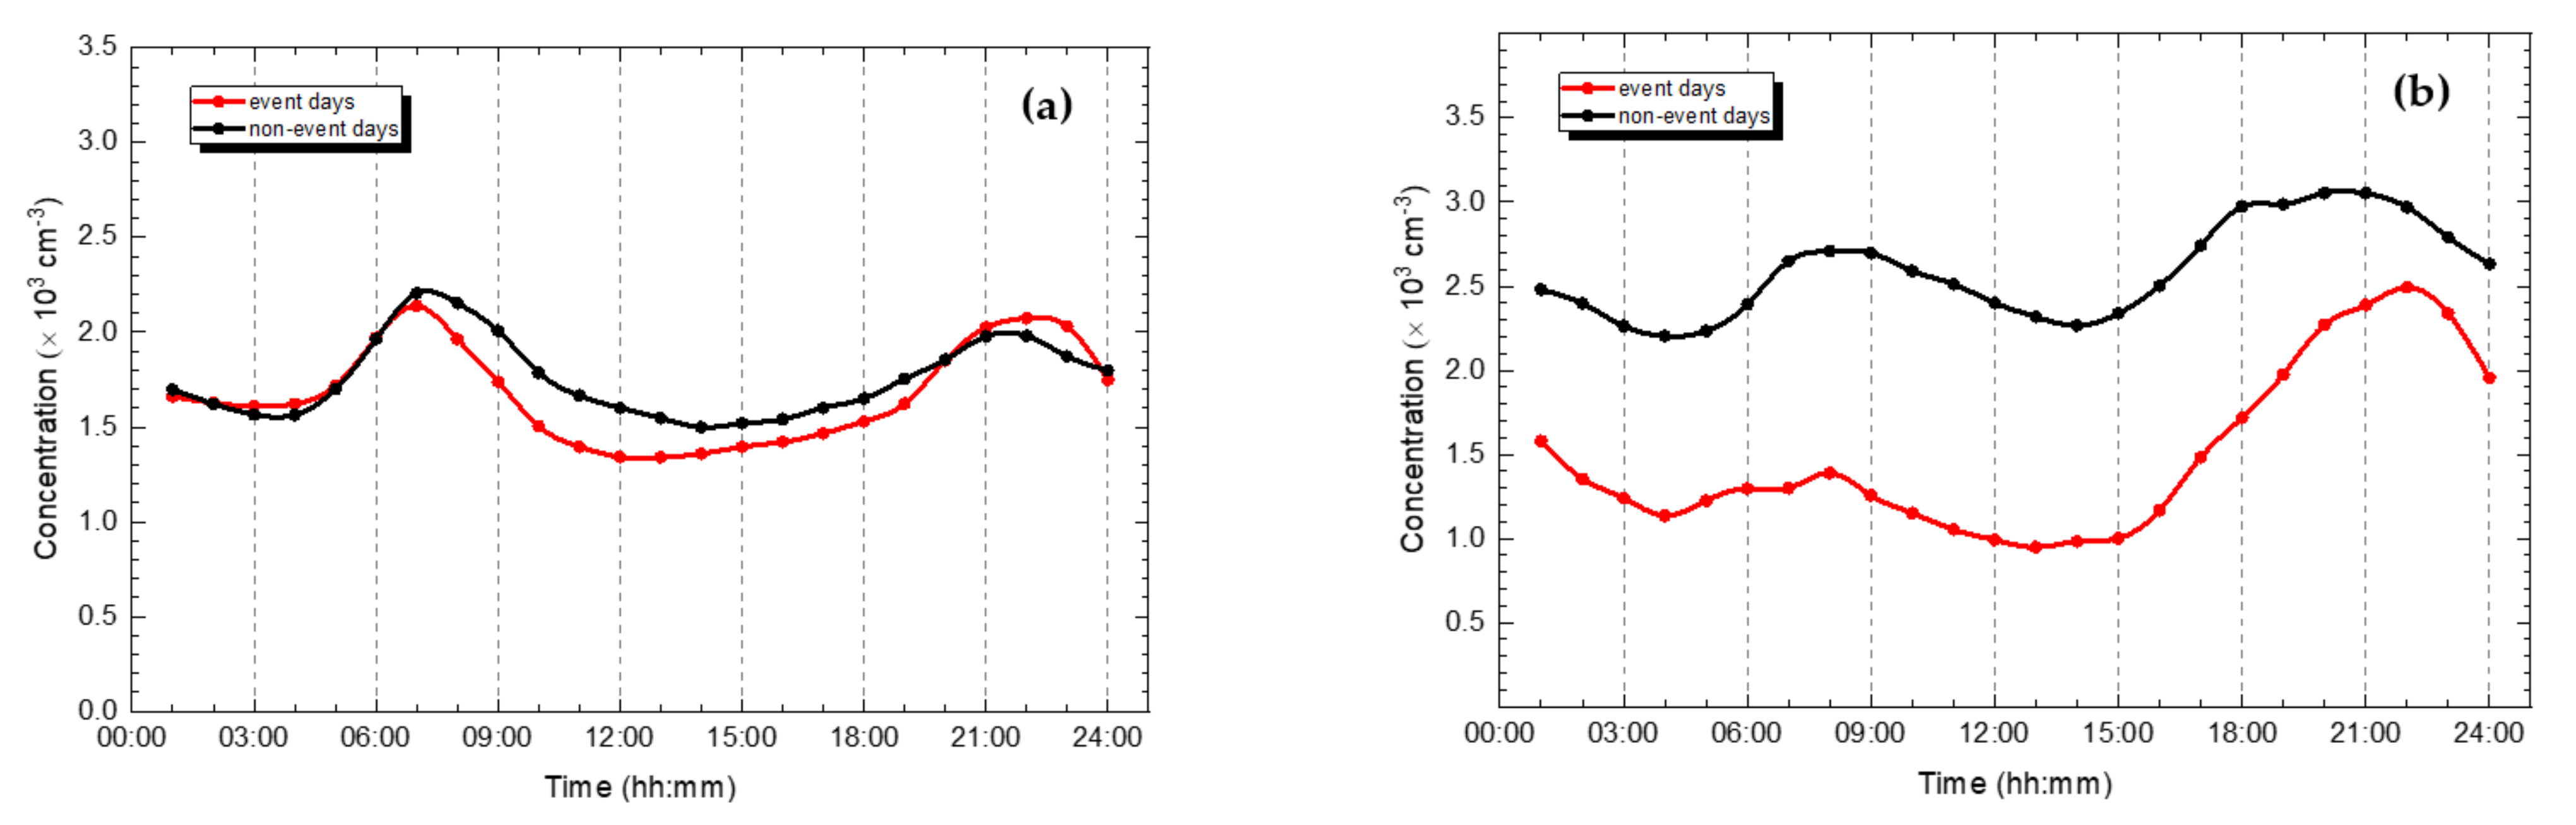
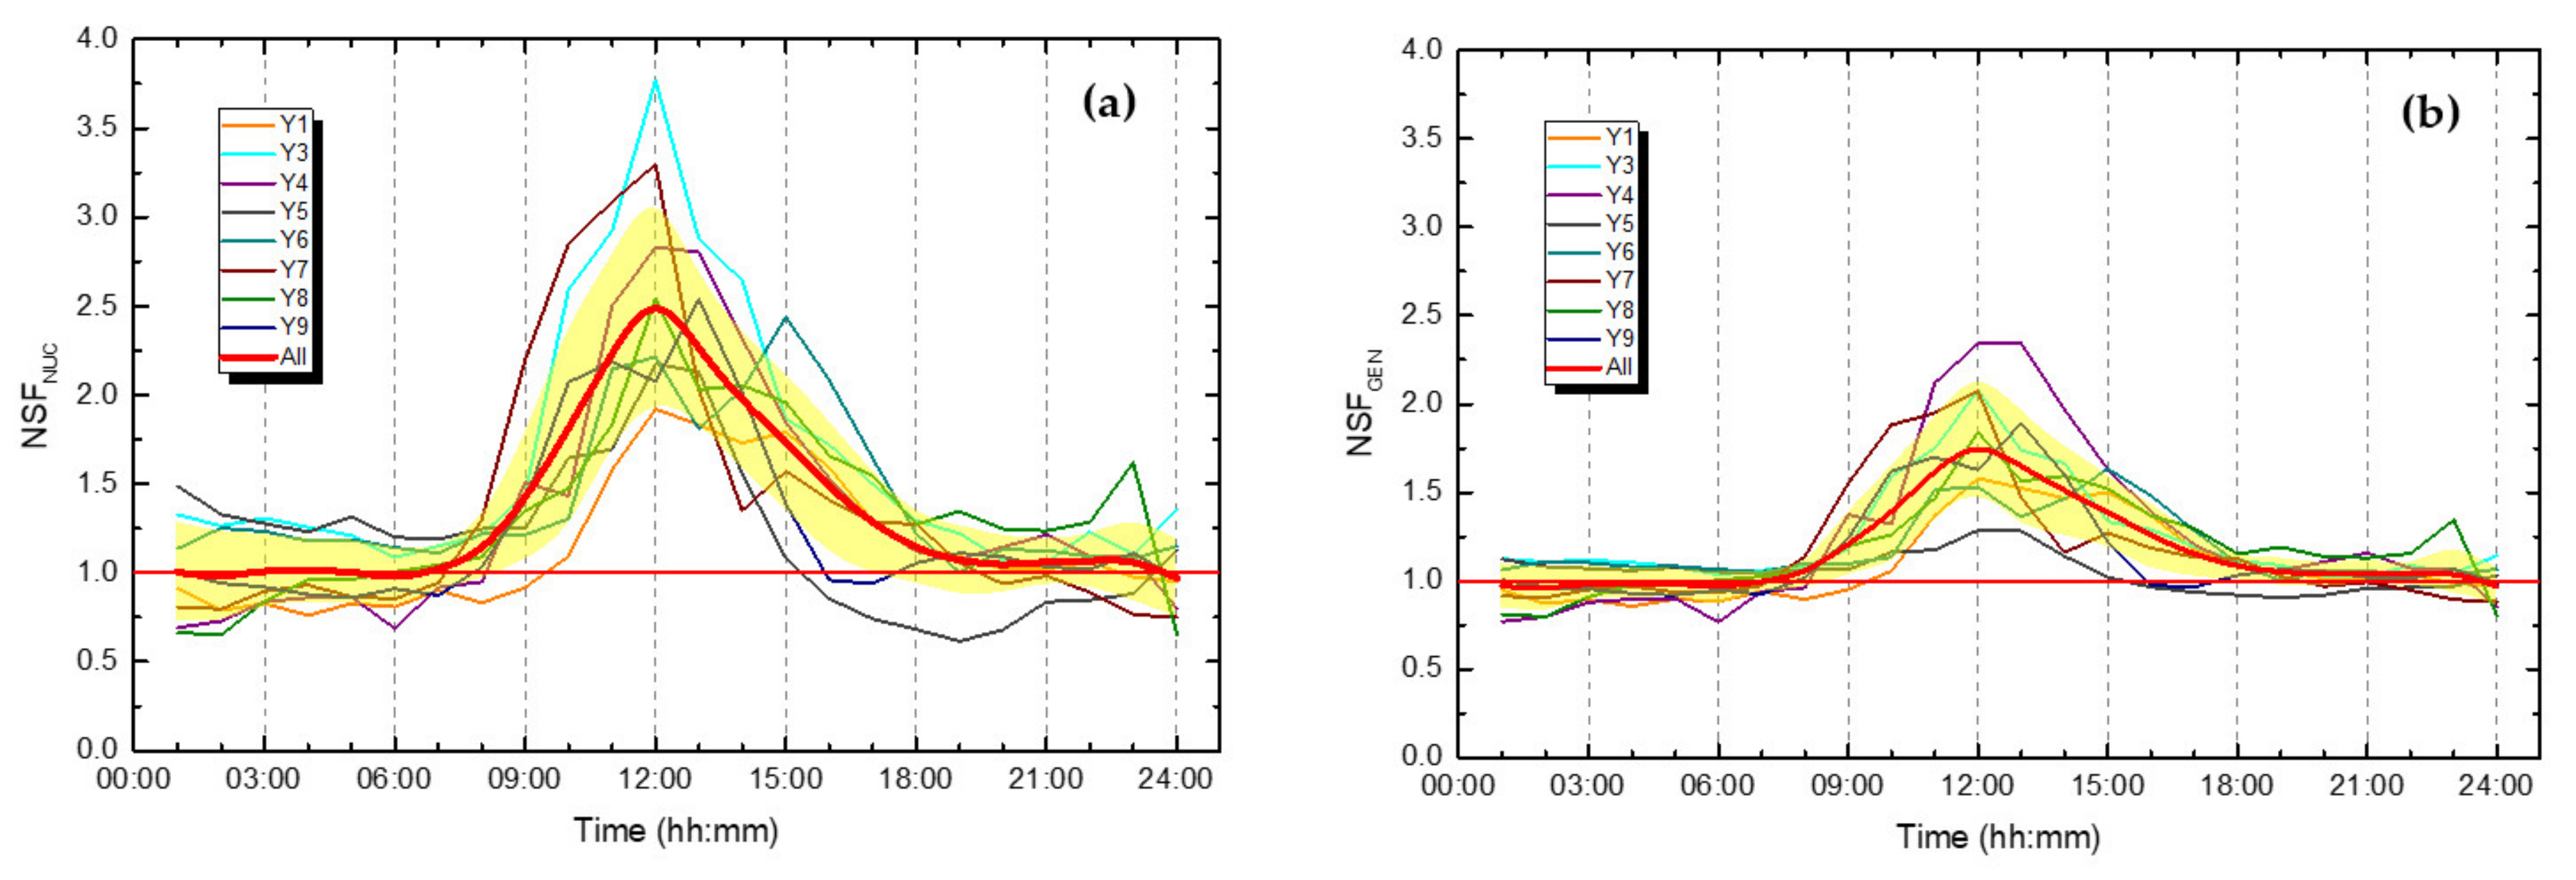
3.4. Contributions of NPF Events

The mean NSFs calculated separately for the city center and near-city background are summarized in Table 3. New particle formation (represented by the NSFNUC) increased the particle number concentrations in the city center by a factor of 1.7 and by ca. 2 times in the near-city background. The importance of NPF on a longer time interval was demonstrated by the mean NSFGEN values. In the city center, 12% of UF particles were generated by NPF as a single source, while it produced 34% of UF particles in the near-city background. The relatively large SDs point to the changing intensity of NPF events. In addition, it is also seen that both the NSFNUC and NSFGEN values were systematically larger for the background than for the center. This is mainly due to the higher particle emissions in the city center, which is caused by anthropogenic activities.
The annual mean NSFs for the city center are presented in Figure 4. The NSFGEN seems to be constant during the whole measurement interval. It is worth mentioning that the occurrence frequency did not change significantly during the investigated years (except for Y5, see Section 3.2). However, the annual mean NSFNUC values appear to indicate a slightly increasing tendency with a slope and SD of (2.6 ± 2.5)% annually. This may be just a fluctuation, or this may suggest that either the contribution of NPF events became larger or that the general level of N100–1000 decreased during the years. The latter tendency cannot be confirmed in the corresponding concentration data from Table 1, and moreover, the possible changes in the annual mean NSFNUC and N100–1000 are not in line or coherent with each other. This hints to possible increasing importance of NPF events with respect to emission sources in Budapest. The hypothesis should be further investigated by independent evaluation methods and on longer data sets.
The monthly mean NSFGEN values changed modestly on an annual scale. Their distribution basically followed the shape of the NPF occurrence frequency, which was shown in [58]. This can be explained by the fact that the monthly NPF contributions on a general day are expected to be larger if the NPF frequency is higher. It is more exciting to investigate the variations in the monthly mean NSFNUC, which are displayed in Figure 5. There seems to be a systematic tendency for lower values (down to 1.1) in summer and larger values (up to 2) in late autumn and early winter.
This is, however, a consequence of the seasonal trend in the N100–1000 level. Its diurnal variations for the NPF days and non-NPF days in the non-winter seasons are presented in Figure 6a. The differences between the curves were negligible. In winter, the shapes were also similar to each other, while their magnitudes were considerably different (Figure 6b). The concentrations were substantially smaller on the NPF days than on the non-NPF days. In winter, the GRad and biogenic precursor gases in the air were decreased [58], and therefore, the source strength of the condensing vapors is expected to also be lower. Consequently, NPF events in this season occur only or preferably if the sink term (related mainly to the existing regional aerosol particles, thus to N100–1000) is even smaller. This explains the difference between the diurnal curves for the NPF and non-NPF days, and the elevated NSFNUC values in winter (see Equation (1)). The NPF events rather took place on those winter days when the particle number concentrations were relatively smaller, and, therefore, the NPF increased the existing low concentration levels by a larger factor.
The mean diurnal variations in the NSFNUC and NSFGEN in the city center are shown in Figure 7a,b. The averaging was performed for the month in which the counts of the nucleation days (or the fNPF) was the largest in each year. This was typically in March or April. The curves exhibited a single peak at noon. The baseline of the peaks from 00:00 to 07:00 and from 19:00 to 24:00 was around unity. In some years, the baseline of the NSFNUC was elevated which can be explained by the fact that the particle growth can take place until the late morning of the next day; thus, the NPF can influence the N6–100 concentrations even in the next morning. Furthermore, we can observe that the peaks have a longer tail in the afternoon side due to the particle growth process. The elevated baseline is a real effect, and it should be included in deriving the mean NSFNUC. The contribution of NPF to the regional concentration level (N100–1000) is the largest at noon, when it reaches a factor of 2.0 to 3.5 (typically 2.5). This is a considerable enhancement, although it only lasts for a few hours. The differences among the annual mean values were likely caused by the year-to-year variability.
The diurnal variation in NGEN also exhibited a single peak with a maximum at noon and with a tail in the early afternoon. The maximum values represented concentration contributions from 50% to 100% due to NPF event for a limited time interval. This means that NPF events have an important contribution to UF particles during the midday even in the city center. The values are lower estimates since a considerable part of the N100–1000 particles can be also produced by NPF from previous days. It is informative to compare the contribution values to the global share of various source sectors in primary UF particle number emission to have an idea on the relative extent of our results. Road transport, power production, and residential heating combustion are the first three largest contributors to primary UF particles with the shares of 40%, 20%, and 17%, respectively [24]. The actual contributions can vary in different parts of the world and with economic development.

4. Summary and Concluding Remarks

Particulate matter is one of the criteria or key air pollutants (if not the most relevant species) which represents the largest health risk for humans in the world. Its monitoring, quantification, and legislation are based on PM mass. It is, however, increasingly recognized that particle number concentrations in urban and industrial areas are important and valuable additional metrics both for health risk and some environmental considerations. As a consequence, the particle number concentrations have been proposed to amend the air pollutants monitored at present. We showed here that the total number of particles and, in particular, the concentrations in several size fractions, are very useful quantities for these goals. The former property can easily be measured for long-term monitoring purposes, while the latter quantities are more advised to be determined as part of background research studies preparing the actual monitoring activity and in an occasional or expedient manner than for continuous observations. This can create a nice example for mutually beneficial and close cooperation among researchers and regulatory bodies.
Ultrafine particles make up a very considerable portion, typically 70–80% of total particles. The atmospheric residence time of these particles is relatively short, and their concentrations can change rapidly in time and space. Therefore, they reflect the active source processes, atmospheric transformations, and sinks of particles in a dynamic way. This is an important advantage of particle numbers with respect to PM mass as air quality metrics.
Particle number characteristics including the concentration levels (annual medians of approximately 9 × 103 cm–3), time trends (no strong seasonal dependency), and diurnal variations (with a remarkable temporal pattern) in Budapest are similar to those in most continental large European cities. Their main source types include vehicle road traffic (and other high-temperature emission sources such as household and residential heating, cooking), and atmospheric NPF. The latter process is usually of regional character, and therefore, it seems to be better assessable for contribution or quantification. It was demonstrated that the occurrence frequency of NPF events is considerable even in large cities with an annual mean value of ca. 20%. We also estimated that NPF events increase the ratio of UF particles with respect to the regional particle numbers (N100–1000) by 12% in the city center and 37% in the near-city background. At the same time, the pre-existing UF concentrations are doubled on the NPF event days. The contributions exhibit substantial diurnal and seasonal variations.

Author Contributions

W.T. processed the raw data, performed the evaluations, made the figures, and wrote the manuscript; I.S. interpreted the results and wrote the manuscript. All authors have read and agreed to the published version of the manuscript.

Funding

Support by the Hungarian Research, Development and Innovation Office (K132254) is acknowledged.

Institutional Review Board Statement

Not applicable.

Informed Consent Statement

Not applicable.

Data Availability Statement

The observational data are available from Imre Salma upon reasonable request.

Acknowledgments

The aerosol and meteorological measurements were accomplished by András Zénó Gyöngyösi of the Eötvös Loránd University, Budapest, Hungary.

Conflicts of Interest

The authors declare no conflict of interest.

References

  1. WHO. Global Air Quality Guidelines. Particulate Matter (PM2.5 and PM10), Ozone, Nitrogen Dioxide, Sulfur Dioxide and Carbon Monoxide; World Health Organization: Geneva, Switzerland, 2021; ISBN 978-92-4-003422-8. [Google Scholar]
  2. Lelieveld, J.; Evans, J.S.; Fnais, M.; Giannadaki, D.; Pozzer, A. The Contribution of Outdoor Air Pollution Sources to Premature Mortality on a Global Scale. Nature 2015, 525, 367–371. [Google Scholar] [CrossRef] [PubMed]
  3. Rönkkö, T.; Kuuluvainen, H.; Karjalainen, P.; Keskinen, J.; Hillamo, R.; Niemi, J.V.; Pirjola, L.; Timonen, H.J.; Saarikoski, S.; Saukko, E.; et al. Traffic Is a Major Source of Atmospheric Nanocluster Aerosol. Proc. Natl. Acad. Sci. USA 2017, 114, 7549–7554. [Google Scholar] [CrossRef] [PubMed] [Green Version]
  4. European Environment Agency. EMEP/EEA Air Pollutant Emission Inventory Guidebook 2019: Technical Guidance to Prepare National Emission Inventories; Publications Office: Luxembourg, 2019. [Google Scholar]
  5. Perlmutt, L.D.; Cromar, K.R. Comparing Associations of Respiratory Risk for the EPA Air Quality Index and Health-Based Air Quality Indices. Atmos. Environ. 2019, 202, 1–7. [Google Scholar] [CrossRef]
  6. Peters, A.; Rückerl, R.; Cyrys, J. Lessons from Air Pollution Epidemiology for Studies of Engineered Nanomaterials. J. Occup. Environ. Med. 2011, 53, S8–S13. [Google Scholar] [CrossRef]
  7. Hofman, J.; Staelens, J.; Cordell, R.; Stroobants, C.; Zikova, N.; Hama, S.M.L.; Wyche, K.P.; Kos, G.P.A.; Van Der Zee, S.; Smallbone, K.L.; et al. Ultrafine Particles in Four European Urban Environments: Results from a New Continuous Long-Term Monitoring Network. Atmos. Environ. 2016, 136, 68–81. [Google Scholar] [CrossRef] [Green Version]
  8. Donaldson, K. Ultrafine Particles. Occup. Environ. Med. 2001, 58, 211–216. [Google Scholar] [CrossRef] [Green Version]
  9. Harrison, R.M.; Shi, J.P.; Xi, S.; Khan, A.; Mark, D.; Kinnersley, R.; Yin, J. Measurement of Number, Mass and Size Distribution of Particles in the Atmosphere. Philos. Trans. R. Soc. London. Ser. A Math. Phys. Eng. Sci. 2000, 358, 2567–2580. [Google Scholar] [CrossRef]
  10. Kelly, F.J.; Fussell, J.C. Size, Source and Chemical Composition as Determinants of Toxicity Attributable to Ambient Particulate Matter. Atmos. Environ. 2012, 60, 504–526. [Google Scholar] [CrossRef]
  11. Rivas, I.; Vicens, L.; Basagaña, X.; Tobías, A.; Katsouyanni, K.; Walton, H.; Hüglin, C.; Alastuey, A.; Kulmala, M.; Harrison, R.M.; et al. Associations between Sources of Particle Number and Mortality in Four European Cities. Environ. Int. 2021, 155, 106662. [Google Scholar] [CrossRef]
  12. Meng, X.; Ma, Y.; Chen, R.; Zhou, Z.; Chen, B.; Kan, H. Size-Fractionated Particle Number Concentrations and Daily Mortality in a Chinese City. Environ. Health Perspect. 2013, 121, 1174–1178. [Google Scholar] [CrossRef] [Green Version]
  13. Sioutas, C.; Delfino, R.J.; Singh, M. Exposure Assessment for Atmospheric Ultrafine Particles (UFPs) and Implications in Epidemiologic Research. Environ. Health Perspect. 2005, 113, 947–955. [Google Scholar] [CrossRef] [PubMed] [Green Version]
  14. Breitner, S.; Liu, L.; Cyrys, J.; Brüske, I.; Franck, U.; Schlink, U.; Leitte, A.M.; Herbarth, O.; Wiedensohler, A.; Wehner, B.; et al. Sub-Micrometer Particulate Air Pollution and Cardiovascular Mortality in Beijing, China. Sci. Total Environ. 2011, 409, 5196–5204. [Google Scholar] [CrossRef] [PubMed]
  15. Stölzel, M.; Breitner, S.; Cyrys, J.; Pitz, M.; Wölke, G.; Kreyling, W.; Heinrich, J.; Wichmann, H.-E.; Peters, A. Daily Mortality and Particulate Matter in Different Size Classes in Erfurt, Germany. J. Expo. Sci. Environ. Epidemiol. 2007, 17, 458–467. [Google Scholar] [CrossRef] [Green Version]
  16. Oberdörster, G.; Oberdörster, E.; Oberdörster, J. Nanotoxicology: An Emerging Discipline Evolving from Studies of Ultrafine Particles. Environ. Health Perspect. 2005, 113, 823–839. [Google Scholar] [CrossRef]
  17. Braakhuis, H.M.; Park, M.V.; Gosens, I.; De Jong, W.H.; Cassee, F.R. Physicochemical Characteristics of Nanomaterials That Affect Pulmonary Inflammation. Part. Fibre Toxicol. 2014, 11, 18. [Google Scholar] [CrossRef] [Green Version]
  18. Giechaskiel, B.; Lahde, T.; Suarez-Bertoa, R.; Clairotte, M.; Grigoratos, T.; Zardini, A.; Perujo, A.; Martini, G. Particle Number Measurements in the European Legislation and Future JRC Activities. Combust. Engines 2018, 174, 3–16. [Google Scholar] [CrossRef]
  19. Ervine, C. Directive 2004/39/Ec of the European Parliament and of the Council of 21 April 2004. In Core Statutes on Company Law; Macmillan Education UK: London, UK, 2015; pp. 757–759. ISBN 978-1-137-54506-0. [Google Scholar]
  20. Kulmala, M.; Kontkanen, J.; Junninen, H.; Lehtipalo, K.; Manninen, H.E.; Nieminen, T.; Petäjä, T.; Sipilä, M.; Schobesberger, S.; Rantala, P.; et al. Direct Observations of Atmospheric Aerosol Nucleation. Science 2013, 339, 943–946. [Google Scholar] [CrossRef]
  21. Spracklen, D.V.; Carslaw, K.S.; Kulmala, M. The Contribution of Boundary Layer Nucleation Events to Total Particle Concentrations on Regional and Global Scales. Atmos. Chem. Phys. 2006, 6, 5631–5648. [Google Scholar] [CrossRef] [Green Version]
  22. Yu, F.; Luo, G.; Bates, T.S.; Anderson, B.; Clarke, A.; Kapustin, V.; Yantosca, R.M.; Wang, Y.; Wu, S. Spatial Distributions of Particle Number Concentrations in the Global Troposphere: Simulations, Observations, and Implications for Nucleation Mechanisms. J. Geophys. Res. 2010, 115, D17205. [Google Scholar] [CrossRef]
  23. Dunne, E.M.; Gordon, H.; Kürten, A.; Almeida, J.; Duplissy, J.; Williamson, C.; Ortega, I.K.; Pringle, K.J.; Adamov, A.; Baltensperger, U.; et al. Global Atmospheric Particle Formation from CERN CLOUD Measurements. Science 2016, 354, 1119–1124. [Google Scholar] [CrossRef] [Green Version]
  24. Paasonen, P.; Kupiainen, K.; Klimont, Z.; Visschedijk, A.; Denier van der Gon, H.A.C.; Amann, M. Continental Anthropogenic Primary Particle Number Emissions. Atmos. Chem. Phys. 2016, 16, 6823–6840. [Google Scholar] [CrossRef] [Green Version]
  25. Masiol, M.; Squizzato, S.; Chalupa, D.C.; Utell, M.J.; Rich, D.Q.; Hopke, P.K. Long-Term Trends in Submicron Particle Concentrations in a Metropolitan Area of the Northeastern United States. Sci. Total Environ. 2018, 633, 59–70. [Google Scholar] [CrossRef] [PubMed]
  26. Salma, I.; Varga, V.; Németh, Z. Quantification of an Atmospheric Nucleation and Growth Process as a Single Source of Aerosol Particles in a City. Atmos. Chem. Phys. 2017, 17, 15007–15017. [Google Scholar] [CrossRef] [Green Version]
  27. Brines, M.; Dall’Osto, M.; Beddows, D.C.S.; Harrison, R.M.; Gómez-Moreno, F.; Núñez, L.; Artíñano, B.; Costabile, F.; Gobbi, G.P.; Salimi, F.; et al. Traffic and Nucleation Events as Main Sources of Ultrafine Particles in High-Insolation Developed World Cities. Atmos. Chem. Phys. 2015, 15, 5929–5945. [Google Scholar] [CrossRef] [Green Version]
  28. Saha, P.K.; Robinson, E.S.; Shah, R.U.; Zimmerman, N.; Apte, J.S.; Robinson, A.L.; Presto, A.A. Reduced Ultrafine Particle Concentration in Urban Air: Changes in Nucleation and Anthropogenic Emissions. Environ. Sci. Technol. 2018, 52, 6798–6806. [Google Scholar] [CrossRef] [PubMed]
  29. Nieminen, T.; Kerminen, V.-M.; Petäjä, T.; Aalto, P.P.; Arshinov, M.; Asmi, E.; Baltensperger, U.; Beddows, D.C.S.; Beukes, J.P.; Collins, D.; et al. Global Analysis of Continental Boundary Layer New Particle Formation Based on Long-Term Measurements. Atmos. Chem. Phys. 2018, 18, 14737–14756. [Google Scholar] [CrossRef] [Green Version]
  30. Bousiotis, D.; Brean, J.; Pope, F.D.; Dall’Osto, M.; Querol, X.; Alastuey, A.; Perez, N.; Petäjä, T.; Massling, A.; Nøjgaard, J.K.; et al. The Effect of Meteorological Conditions and Atmospheric Composition in the Occurrence and Development of New Particle Formation (NPF) Events in Europe. Atmos. Chem. Phys. 2021, 21, 3345–3370. [Google Scholar] [CrossRef]
  31. KSH. National Register of Road Vehicles; Hungarian Central Statistical Office: Budapest, Hungary, 2020. (In Hungarian)
  32. Salma, I.; Németh, Z.; Weidinger, T.; Kovács, B.; Kristóf, G. Measurement, Growth Types and Shrinkage of Newly Formed Aerosol Particles at an Urban Research Platform. Atmos. Chem. Phys. 2016, 16, 7837–7851. [Google Scholar] [CrossRef] [Green Version]
  33. Salma, I.; Vasanits-Zsigrai, A.; Machon, A.; Varga, T.; Major, I.; Gergely, V.; Molnár, M. Fossil Fuel Combustion, Biomass Burning and Biogenic Sources of Fine Carbonaceous Aerosol in the Carpathian Basin. Atmos. Chem. Phys. 2020, 20, 4295–4312. [Google Scholar] [CrossRef] [Green Version]
  34. Salma, I.; Borsós, T.; Németh, Z.; Weidinger, T.; Aalto, P.; Kulmala, M. Comparative Study of Ultrafine Atmospheric Aerosol within a City. Atmos. Environ. 2014, 92, 154–161. [Google Scholar] [CrossRef]
  35. Sun, J.; Birmili, W.; Hermann, M.; Tuch, T.; Weinhold, K.; Spindler, G.; Schladitz, A.; Bastian, S.; Löschau, G.; Cyrys, J.; et al. Variability of Black Carbon Mass Concentrations, Sub-Micrometer Particle Number Concentrations and Size Distributions: Results of the German Ultrafine Aerosol Network Ranging from City Street to High Alpine Locations. Atmos. Environ. 2019, 202, 256–268. [Google Scholar] [CrossRef]
  36. Mikkonen, S.; Németh, Z.; Varga, V.; Weidinger, T.; Leinonen, V.; Yli-Juuti, T.; Salma, I. Decennial Time Trends and Diurnal Patterns of Particle Number Concentrations in a Central European City between 2008 and 2018. Atmos. Chem. Phys. 2020, 20, 12247–12263. [Google Scholar] [CrossRef]
  37. Salma, I.; Borsós, T.; Weidinger, T.; Aalto, P.; Hussein, T.; Dal Maso, M.; Kulmala, M. Production, Growth and Properties of Ultrafine Atmospheric Aerosol Particles in an Urban Environment. Atmos. Chem. Phys. 2011, 11, 1339–1353. [Google Scholar] [CrossRef] [Green Version]
  38. Salma, I.; Németh, Z.; Kerminen, V.-M.; Aalto, P.; Nieminen, T.; Weidinger, T.; Molnár, Á.; Imre, K.; Kulmala, M. Regional Effect on Urban Atmospheric Nucleation. Atmos. Chem. Phys. 2016, 16, 8715–8728. [Google Scholar] [CrossRef] [Green Version]
  39. Wiedensohler, A.; Birmili, W.; Nowak, A.; Sonntag, A.; Weinhold, K.; Merkel, M.; Wehner, B.; Tuch, T.; Pfeifer, S.; Fiebig, M.; et al. Mobility Particle Size Spectrometers: Harmonization of Technical Standards and Data Structure to Facilitate High Quality Long-Term Observations of Atmospheric Particle Number Size Distributions. Atmos. Meas. Tech. 2012, 5, 657–685. [Google Scholar] [CrossRef] [Green Version]
  40. Schmale, J.; Henning, S.; Henzing, B.; Keskinen, H.; Sellegri, K.; Ovadnevaite, J.; Bougiatioti, A.; Kalivitis, N.; Stavroulas, I.; Jefferson, A.; et al. Collocated Observations of Cloud Condensation Nuclei, Particle Size Distributions, and Chemical Composition. Sci. Data 2017, 4, 170003. [Google Scholar] [CrossRef]
  41. Salma, I.; Németh, Z. Dynamic and Timing Properties of New Aerosol Particle Formation and Consecutive Growth Events. Atmos. Chem. Phys. 2019, 19, 5835–5852. [Google Scholar] [CrossRef] [Green Version]
  42. Kulmala, M.; Vehkamäki, H.; Petäjä, T.; Dal Maso, M.; Lauri, A.; Kerminen, V.-M.; Birmili, W.; McMurry, P.H. Formation and Growth Rates of Ultrafine Atmospheric Particles: A Review of Observations. J. Aerosol Sci. 2004, 35, 143–176. [Google Scholar] [CrossRef]
  43. Dal Maso, M.; Kulmala, M.; Riipinen, I.; Wagner, R.; Hussein, T.; Aalto, P.P.; Lehtinen, K.E.J. Formation and Growth of Fresh Atmospheric Aerosols: Eight Years of Aerosol Size Distribution Data from SMEAR II, Hyytiälä, Finland. Boreal Environ. Res. 2005, 10, 323–336. [Google Scholar]
  44. Kulmala, M.; Petäjä, T.; Nieminen, T.; Sipilä, M.; Manninen, H.E.; Lehtipalo, K.; Dal Maso, M.; Aalto, P.P.; Junninen, H.; Paasonen, P.; et al. Measurement of the Nucleation of Atmospheric Aerosol Particles. Nat. Protoc. 2012, 7, 1651–1667. [Google Scholar] [CrossRef]
  45. Németh, Z.; Rosati, B.; Zíková, N.; Salma, I.; Bozó, L.; Dameto de España, C.; Schwarz, J.; Ždímal, V.; Wonaschütz, A. Comparison of Atmospheric New Particle Formation Events in Three Central European Cities. Atmos. Environ. 2018, 178, 191–197. [Google Scholar] [CrossRef]
  46. Putaud, J.-P.; Van Dingenen, R.; Alastuey, A.; Bauer, H.; Birmili, W.; Cyrys, J.; Flentje, H.; Fuzzi, S.; Gehrig, R.; Hansson, H.C.; et al. A European Aerosol Phenomenology—3: Physical and Chemical Characteristics of Particulate Matter from 60 Rural, Urban, and Kerbside Sites across Europe. Atmos. Environ. 2010, 44, 1308–1320. [Google Scholar] [CrossRef]
  47. Von Schneidemesser, E.; Steinmar, K.; Weatherhead, E.C.; Bonn, B.; Gerwig, H.; Quedenau, J. Air Pollution at Human Scales in an Urban Environment: Impact of Local Environment and Vehicles on Particle Number Concentrations. Sci. Total Environ. 2019, 688, 691–700. [Google Scholar] [CrossRef] [PubMed]
  48. Reche, C.; Querol, X.; Alastuey, A.; Viana, M.; Pey, J.; Moreno, T.; Rodríguez, S.; González, Y.; Fernández-Camacho, R.; de la Rosa, J.; et al. New Considerations for PM, Black Carbon and Particle Number Concentration for Air Quality Monitoring across Different European Cities. Atmos. Chem. Phys. 2011, 11, 6207–6227. [Google Scholar] [CrossRef] [Green Version]
  49. Puustinen, A.; Hämeri, K.; Pekkanen, J.; Kulmala, M.; de Hartog, J.; Meliefste, K.; ten Brink, H.; Kos, G.; Katsouyanni, K.; Karakatsani, A.; et al. Spatial Variation of Particle Number and Mass over Four European Cities. Atmos. Environ. 2007, 41, 6622–6636. [Google Scholar] [CrossRef] [Green Version]
  50. Aalto, P.; Hämeri, K.; Paatero, P.; Kulmala, M.; Bellander, T.; Berglind, N.; Bouso, L.; Castaño-Vinyals, G.; Sunyer, J.; Cattani, G.; et al. Aerosol Particle Number Concentration Measurements in Five European Cities Using TSI-3022 Condensation Particle Counter over a Three-Year Period during Health Effects of Air Pollution on Susceptible Subpopulations. J. Air Waste Manag. Assoc. 2005, 55, 1064–1076. [Google Scholar] [CrossRef]
  51. Borsós, T.; Řimnáčová, D.; Ždímal, V.; Smolík, J.; Wagner, Z.; Weidinger, T.; Burkart, J.; Steiner, G.; Reischl, G.; Hitzenberger, R.; et al. Comparison of Particulate Number Concentrations in Three Central European Capital Cities. Sci. Total Environ. 2012, 433, 418–426. [Google Scholar] [CrossRef]
  52. Zhao, J.; Birmili, W.; Wehner, B.; Daniels, A.; Weinhold, K.; Wang, L.; Merkel, M.; Kecorius, S.; Tuch, T.; Franck, U.; et al. Particle Mass Concentrations and Number Size Distributions in 40 Homes in Germany: Indoor-to-Outdoor Relationships, Diurnal and Seasonal Variation. Aerosol Air Qual. Res. 2020, 20, 576–589. [Google Scholar] [CrossRef]
  53. Sun, J.; Hermann, M.; Yuan, Y.; Birmili, W.; Collaud Coen, M.; Weinhold, K.; Madueño, L.; Poulain, L.; Tuch, T.; Ries, L.; et al. Long-Term Trends of Black Carbon and Particle Number Concentration in the Lower Free Troposphere in Central Europe. Environ. Sci. Eur. 2021, 33, 47. [Google Scholar] [CrossRef]
  54. Salma, I.; Maenhaut, W. Changes in Elemental Composition and Mass of Atmospheric Aerosol Pollution between 1996 and 2002 in a Central European City. Environ. Pollut. 2006, 10, 479–488. [Google Scholar] [CrossRef]
  55. Salma, I.; Vörösmarty, M.; Gyöngyösi, A.Z.; Thén, W.; Weidinger, T. What Can We Learn about Urban Air Quality with Regard to the First Outbreak of the COVID-19 Pandemic? A Case Study from Central Europe. Atmos. Chem. Phys. 2020, 20, 15725–15742. [Google Scholar] [CrossRef]
  56. Tunved, P.; Hansson, H.-C.; Kerminen, V.-M.; Ström, J.; Maso, M.D.; Lihavainen, H.; Viisanen, Y.; Aalto, P.P.; Komppula, M.; Kulmala, M. High Natural Aerosol Loading over Boreal Forests. Science 2006, 312, 261–263. [Google Scholar] [CrossRef] [PubMed]
  57. Kerminen, V.-M.; Chen, X.; Vakkari, V.; Petäjä, T.; Kulmala, M.; Bianchi, F. Atmospheric New Particle Formation and Growth: Review of Field Observations. Environ. Res. Lett. 2018, 13, 103003. [Google Scholar] [CrossRef] [Green Version]
  58. Salma, I.; Thén, W.; Aalto, P.; Kerminen, V.-M.; Kern, A.; Barcza, Z.; Petäjä, T.; Kulmala, M. Influence of Vegetation on Occurrence and Time Distributions of Regional New Aerosol Particle Formation and Growth. Atmos. Chem. Phys. 2021, 21, 2861–2880. [Google Scholar] [CrossRef]
Figure 1. Time series of daily median particle number concentrations N6–25, N25–100, N100–1000, and N6–1000 for the nine measurement years. The year 2012–2013 (Y2) was realized in the near-city background, while in the other years, the measurements were accomplished in the city center. The solid line represents the annual median N6–1000.
Atmosphere 13 00570 g001
Figure 2. Mean diurnal variation in concentrations of SO2, NO, NO2, O3, CO, PM10, and PM2.5 masses (a) and particle number concentrations in 6–25, 25–100, 100–1000, and 6–1000 nm size ranges (b) for the city center for 8 years. The concentration of CO was divided by 10. The smoothed curves serve to guide the eye.
Atmosphere 13 00570 g002
Figure 3. Relative occurrence frequency of new aerosol particle formation in the city center over 8 measurement years separately for days of the week and for workdays and holidays. The solid horizontal line indicates the overall mean, and the yellow band shows its standard deviation. The actual counts of the new particle formation event days are written above the columns.
Atmosphere 13 00570 g003
Figure 4. Annual means of NSFGEN (a) and NSFNUC (b) for the city center separately for the 8 measurement years. The solid line and yellow band represent the overall mean and its standard deviation. The red line was obtained by fitting a linear line of the annual data and indicates a possible increasing tendency.
Atmosphere 13 00570 g004
Figure 5. Distribution of the monthly mean nucleation strength factor on a nucleation day (NSFNUC) averaged for 8 measurement years in the city center. The horizontal line indicates the overall mean.
Atmosphere 13 00570 g005
Figure 6. Diurnal variations in the particle number concentrations in the size range from 100 to 1000 nm (N100–1000) separately for NPF event days and non-NPF days in non-winter seasons (a) and in winter (b) in the city center for 8 measurement years. The smoothed curves serve to guide the eye.
Atmosphere 13 00570 g006
Figure 7. Diurnal variations in nucleation strength factor on a nucleation day (NSFNUC) (a) and on a general day (NSFGEN) (b) in the city center during the 8-year-long time interval. The factors were calculated in each year for the month in which the counts of the nucleation days were maximal. The red curve indicates the overall mean NSF value, the yellow band represents its ±1 standard deviation and the horizontal solid black line at unity serve as a reference.
Atmosphere 13 00570 g007
Table 1. Ranges, medians, and means with standard deviations (SDs) of particle number concentrations N6–25, N25–100, N6–100, N100–1000, and N6–1000 (all in 103 cm−3) in the city center and near-city background for the measurement years Y1 to Y9.
Time IntervalStatisticsN6–25N25–100N6–100N100–1000N6–1000
Y1 (center)minimum0.0920.440.840.171.16
median3.35.18.82.211
maximum3643531769
mean3.96.1102.613
SD2.64.15.91.67.0
Y2 (background)minimum0.0150.180.270.080.47
median0.472.02.71.24.2
maximum2522371239
mean1.12.73.81.65.3
SD2.02.23.51.13.9
Y3 (center)minimum0.0580.190.410.0790.50
median2.64.37.22.29.8
maximum5561762678
mean3.35.18.52.711
SD2.83.45.31.76.4
Y4 (center)minimum0.0660.230.410.0740.61
median2.64.07.02.09.4
maximum6350712274
mean3.44.88.22.511
SD3.53.35.71.76.5
Y5 (center)minimum0.0300.290.410.100.66
median2.23.35.71.67.6
maximum5740701471
mean2.93.96.82.08.8
SD2.62.74.71.55.6
Y6 (center)minimum0.100.280.530.0760.61
median3.84.28.41.811
maximum937211914122
mean5.05.2102.212
SD4.83.87.61.68.3
Y7 (center)minimum0.110.150.350.140.64
median3.83.98.01.910
maximum1186815220154
mean5.14.89.92.312
SD4.93.57.31.58.1
Y8 (center)minimum0.0700.290.520.120.79
median4.34.08.71.811
maximum1104612214125
mean5.75.0112.113
SD5.13.77.71.58.5
Y9 (center)minimum0.0670.220.380.0380.77
median3.13.46.91.58.6
maximum6841831586
mean4.34.28.51.810
SD4.23.06.31.16.8
Table 2. Number of new particle formation event days in each month and over the whole measurement years Y1 to Y9.
Time IntervalY1Y2Y3Y4Y5Y6Y7Y8Y9
1042121412
2387333146
39147113122139
4179112068121617
581210106121348
67896512473
783810310645
86933101812
913165948758
1056644852
11422121351
12352312313
Annual8396728135 *83647376
* The DMPS measurements were missing in August and October of year Y5.
Table 3. Nucleation strength factor values for nucleation days (NSFNUC) and for all days (NSFGEN) separately for the city center and near-city background sites during the whole measurement time interval.
Urban EnvironmentStatisticsNSFNUCNSFGEN
city centermean1.661.12
SD0.660.10
near-city backgroundmean2.251.37
SD0.790.34
Publisher’s Note: MDPI stays neutral with regard to jurisdictional claims in published maps and institutional affiliations.

