Abstract
Aerosol radiative effects usually have a heating effect on the atmosphere and a cooling effect on the surface, and they are also important uncertainty factors that cause climate change. Based on the Moderate-Resolution Imaging Spectrometer (MODIS) and Aerosol Optical Properties Observation Network (AERONET), a study on the distribution characteristics of aerosol optical depth (AOD) in Beijing was developed, and a method to calculate the regional aerosol direct radiative forcing (ADRF) was improved. ADRF was calculated for Beijing by inputting aerosol optical parameters and surface parameters based on this method. The results show that the MODIS AOD and AERONET AOD both reached the correlation coefficient of 0.9 at 412 nm, 470 nm and 660 nm. Additionally, the correlation coefficient of ADRF as calculated by SBDART reached 0.8 through verification with AERONET ADRF. In addition, the ADRF of the atmosphere (ATM) under different degrees of pollution in Beijing was also calculated; the results indicate that the aerosol radiative effect becomes more obvious with higher pollution degrees. Finally, the interaction between the relevant factors (relative humidity, lower troposphere stability and wind speed) and the aerosol radiative effect was analyzed. Studies have found that the aerosol radiative effect influences the occurrence and continuation of pollution and provides a supporting basis for preventing the occurrence of pollution and predicting the climate.
1. Introduction
In climate research, aerosols, which are important factors affecting the radiation balance of the Earth–atmosphere system, are distributed in different elevation layers of the Earth’s atmosphere [1,2]. The quantification of the aerosol radiative effect is generally expressed by aerosol direct radiative forcing (ADRF). The incoming solar radiation and the solar radiation reflected from the ground are absorbed and scattered by aerosol particles, resulting in changes in the atmospheric radiation flux, which is known as ADRF [3,4]. The uncertainty of ADRF comes from the physical and chemical properties of the aerosol itself, meteorological conditions and the variability of surface reflectivity [5]. On the one hand, due to the spatial-temporal distribution of aerosol characteristics and content, it is currently difficult to accurately calculate ADRF on a global scale. On the other hand, the temperature changes caused by ADRF can lead to feedback from the climate system, which strengthens the degree of ADRF and changes aerosol distribution [6].
Numerical characterization of ADRF combined with aerosol optical property parameters and a radiative transfer model is one of the most effective ways to study the aerosol radiative effect. The Santa Barbara DISORT Atmospheric Radiative Transfer (SBDART) model is a radiative transfer model developed by Ricchiazzi et al. [7]. The accuracy of the SBDART for calculating ADRF has been confirmed in numerous studies and has a wide range of applicability. Bi et al. studied the relationship between ADRF in the atmosphere, AOD and SSA and aerosol direct radiative forcing efficiency using the SBDART model in Northwest China [8]. Esteve et al. used the SBDART to analyze ADRF in coastal areas of Mediterranean cities [9]. It should be noted that the characterization of regional ADRF requires aerosol optical parameters in continuous space. Satellite observation equipment, e.g., Moderate Resolution Imaging Spectrometer (MODIS), can provide aerosol optical property data covering a wide range of space [10,11]. With the support of AERONET data, many studies on the validation of MODIS data have been carried out extensively; thus, MODIS aerosol products are well-characterized at the regional scale. Bi et al. carried out the verification of MODIS aerosol optical depth inversion and AERONET data on the Indo-Gangetic Plain, and the results show the reliability of the MODIS data [12]. Bright et al. compared and validated the MODIS with AERONET Level 2 AOD daily averages from 2000 to February 2018 [13]. This suggests that regional-scale-based ADRF characterization is also theoretically feasible.
The current research on the data of the aerosol radiative effect is mainly focused on MODIS and AERONET [14,15]. Scientists have made great efforts to increase understanding of the aerosol radiative effect and climate impact [16,17]. However, due to the limitations of AERONET observation points, it is hard to observe the aerosol distribution characteristics of the entire region. For example, Lu et al. conducted a detailed data study on ground characteristics (aerosol optical properties, type, size and radiative characteristics) measured by AEROMET between 2005 and 2012 in different cities [18]. However, due to the limitations of site data and the lack of analysis of continuous spatial data, the research results are not a reliable source for the characterization of the area. In recent years, the coverage of MODIS has enabled regional research of aerosols to be supported by data [19,20], but satellite observation is often affected by the weather and cloudy conditions. Many scientists have ensured the reliability of MODIS data by correcting for sampling biases caused by the inherent limitations of satellite measurements, despite the influence of variable factors [21,22,23]. Therefore, with the support of high-precision AERONET data, using high-coverage MODIS data to study the aerosol characteristics in the research region to accurately calculate ADRF is the research idea of this paper. In practice, due to differences in regional meteorological conditions and pollutant emissions, ADRF also varies greatly on a regional scale [24]. Therefore, it is important to study the aerosol spatiotemporal distribution and ADRF in the entire region. In this study, the distribution of aerosol characteristics, such as aerosol optical depth (AOD), single-scattering albedo (SSA), asymmetry factor (ASY) and the surface parameters (surface reflectivity) were obtained using MODIS. A regional-scale DARF assessment method was improved based on MODIS data to calculate ADRF at short wavelengths (0.25–4 µm) in Beijing. The ADRF at top of the atmosphere (TOA), bottom of the atmosphere (BOA) and general atmosphere (ATM) were calculated using this method, and their accuracy was verified by comparison with AERONET data. Moreover, ADRF at different degrees of air pollution was calculated for Beijing. Scientific data support is provided for the prediction and analysis of the causes and trends of major air pollution events to better control and prevent air pollution and optimize air quality.
2. Data and Methodology
2.1. Introduction to the Research Region
Beijing is located at longitude 115.7–117.4 east and latitude 39.4–41.6 north. The climate is warm temperate semi-humid and semi-arid monsoon climate, which is characterized by hot and rainy summer, cold and dry winter, short spring and autumn and affected by sand and dust. As the capital of China, the population has exploded in recent years, and surveys show that the permanent resident population reached 21.53 million in 2021. With the rapid development of urban industrialization, the total energy consumption is increasing, and air pollution is becoming more severe, which seriously affects the climate problem. Most areas of Beijing are dominated by slight air pollution, with the main pollutants being ozone and PM2.5/10, and moderate to severe pollution may occur in local areas. The main reasons for the frequent occurrence of air pollution are as follows. First, high pollutant emissions, major coal-fired pollution, motor vehicle emissions, industrial pollution, dust and so on are major factors. Second, the diffusion conditions are disadvantageous; as Beijing is surrounded by mountains on three sides, pollutants do not spread easily. Third, pollution in the surrounding region of Beijing is superimposed in the central urban region, resulting in compound pollution, which does not easily spread, aggravating the pollution level.
The trends of monthly average relative humidity (RH) and precipitation (meteorological data and PM2.5/10 from https://quotsoft.net/air/ (accessed on 14 July 2021) in recent years in Beijing are shown in Figure 1a, showing a single-valley trend. It can be seen that the precipitation in summer is very sufficient, with the highest occurring in July at about 190 mm, followed by autumn at about 35–50 mm. Precipitation is low in spring and winter, especially in December, January and February. The average monthly precipitation is less than 10 mm, resulting in low RH in winter. Obviously, the change in RH is positively correlated with the change in precipitation.
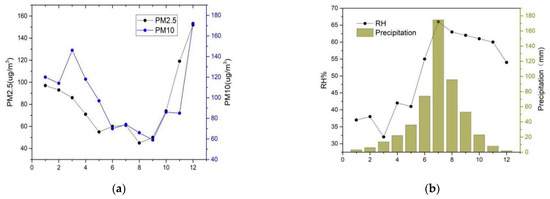
Figure 1.
Site description: (a) trend chart of monthly pollutant concentration; (b) trend chart of monthly relative humidity and precipitation.
Figure 1b shows the trends in air quality changes in recent years. The horizontal axis represents the month, with higher concentrations of winter pollutants after November, peaking in December, with PM2.5/10 concentrations of pollutants as high as 150 μg/m3. In the spring before April, it is about 90 to 130 μg/m3. The lowest pollutant concentration is in summer, which reaches as low as 50 μg/m3 in August. The reason for the low concentration of pollutants in summer is the strong wind speed, high temperature and large temperature difference between day and night, which results in strong convection conditions. Additionally, this may also be attributed to the strong scavenge of particles by precipitation, allowing summer pollutants to spread easily to higher altitudes. In addition to the high emissions of biomass combustion in winter, the atmospheric boundary layer is low, as is often seen in the reversal layer, making it difficult for pollutants to dissipate and form a pile, which is also a reason why frequent air pollution in winter cannot be ignored.
2.2. Data and Methodology
2.2.1. MODIS
The MODIS, published at https://ladsweb.modaps.eosdis.nasa.gov/ (accessed on 1 May 2021) mounted on the Terra and Aqua satellites is an important tool for observing global climate data. MODIS has 36 spectral bands with a medium resolution level, observing the earth’s surface every 1 to 2 days. MODIS data comprise many types of products, including atmospheric standard products, land standard products and marine standard products. Data are widely used because of the advantages of a wide spectrum range, they are free to use for global personnel, simple data acceptance and high update frequency. The MOD04_L2 is a Level 2.0 aerosol product released by National Aeronautics and Space Administration (NASA), and provides parameters via parameter files. Its spatial resolution is 10 km, and it is provided via HDF 5 formats. It can be used to obtain atmospheric aerosol optical properties and other parameters of the global ocean and terrestrial environment. The reliability of the data has been tested in various articles [25,26]. It is worth mentioning that the product uses the Deep Blue algorithm, which can be widely applied to various surface types. Because the occurrence of scattering and absorption of aerosol particles in the Deep Blue band is not as significant as in the ultraviolet band, aerosol products using the Deep Blue product are less affected by the vertical distribution of aerosols [27,28,29].
2.2.2. AERONET
AERONET is a project focused on aerosols on the ground. It provides recent, continuous aerosol optical and radiative characteristics data [29]. It is primarily used for aerosol research and characterization, satellite product verification and the synergy of other data, which can be obtained at https://aeronet.gsfc.nasa.gov/ (accessed on 1 May 2021). AERONET not only provides AOD data in different regions of the world but can also use data inversion to obtain aerosol phase function, single-scattering albedo, complex refractive index, fine-mode particle ratio and other information, as well as radiant flux and radiative forcing data. AERONET observation instrument measures once every 15 min, and the measurement band varies from 340 nm to 1020 nm. The datum is divided into 3 levels: Level 1.0, Level 1.5 and Level 2.0. Level 1.0 data are not processed and verified by the filtered cloud, which is quite controversial. Level 1.5 data are processed by the cloud, and the accuracy of the verified data processed by the filter cloud at Level 2.0 is verified [30]. AERONET can accurately provide aerosol optical properties such as AOD, SSA, ASY and surface reflectivity. However, the instruments and equipment are easily affected by meteorological conditions and cannot support extensive space observations. On the contrary, MODIS remote sensing overcomes the lack of ground-based observation space and provides global aerosol optical characteristics data. It should be noted that because MODIS and AERONET have different bands and time-space scales for aerosol observations, in order to make the two comparable in time and space, the aerosol optical characteristic data need to be processed for band interpolation and space-time matching.
AERONET data are continuous observations at fixed intervals, while the MODIS data are instantaneous observations in space with a pixel unit of 10 km × 10 km. Due to the wide observation region of MODIS, the data of the corresponding region of the station are compared with the average value of the AERONET data within 0.5 h before and after the satellite transit, and the accuracy of this method has been verified [31].
2.3. SBDART Radiative Transfer Model
The SBDART (Santa Barbara DISORT Atmospheric Radiative Transfer) radiative transfer model was developed by the Geospatial Research Group of the School of Earth System Computing. It is mainly used to calculate the radiative transfer of the Earth’s atmosphere and ground under clear-sky and cloud conditions. The solution method of the radiation transfer equation used in the SBDART is the Discrete Ordinate Method (DISORT), which was originally proposed by Chandrasekhar, who, when studying the radiation problem of atmospheres, discretized the integral-differential form of the radiation transfer equation into a set of ordinary differential equations [32]. All absorption and scattering processes that can affect ultraviolet, visible and infrared radiation are taken into account for the pattern. Compared to other models, SBDART has the advantages of long calculation wavelength range and high waveband resolution [33]. Since in practice the scale of variation in the vertical direction is much larger than that in the horizontal direction, the importance of the horizontal radiative transfer is significantly reduced. So, in practice it is feasible to assume that the atmosphere is a flat horizontal atmosphere. When the SBDART model calculates ADRF, the input parameters include aerosol optical characteristic parameters, surface reflectivity, ozone content, atmospheric water vapor content, etc. Table 1 shows the parameters used to calculate ADRF, the source of all input parameters.

Table 1.
SBDART input parameters data source.
The model calculates the radiation flux at TOA and BOA, while the radiation flux for ATM is calculated by subtracting BOA from TOA. ADRF arises from the difference between aerosol and nonaerosol solar fluxes. The mathematical descriptions of TOA, BOA and ATM are given in Equations (1)–(3):
ADRF is the net radiation flux, defined as the radiation flux in the upward direction minus the radiation flux in the downward direction.
ADRFa indicates the aerosol direct radiative forcing at ATM in the presence of aerosol.
ADRF0 indicates the aerosol direct radiative forcing under clear-sky conditions.
3. Results and Discussions
3.1. Trends in Aerosol Optical Properties
The Beijing site data (39.977 N, 116.381 E) for this study are from the AERONET https://aeronet.gsfc.nasa.gov/cgi-bin/draw_map_display_inv_v3/ (accessed on 1 May 2021). Since 2015, due to the implementation and remarkable results of Beijing’s pollution control measures, it can be clearly seen that the aerosol optical properties have changed significantly, which is shown in Figure 2.
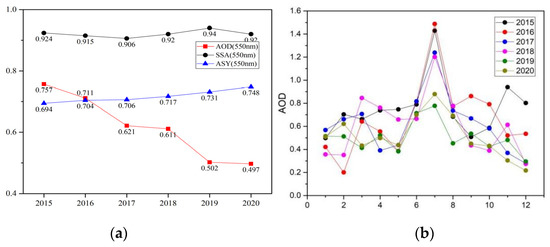
Figure 2.
Description of aerosol optical characteristic parameters: (a) annual change trend graph of aerosol optical properties; (b) monthly change trend graph of AOD from 2015 to 2020.
Trends in the aerosol optical properties in recent years are shown in Figure 2a, where AOD is defined as the integration of the extinction coefficient of a medium in the vertical direction. From 0.757 in 2015 to 0.497 in 2020, there was a clear downward trend because of the improvement of the atmospheric environment. Second, SSA reflects the proportion of aerosol scattering extinction to total extinction, which remained within a stable range. The relative variation was obvious in ASY, which represents the aerosol ratio of forward scattering to backscatter. Since there were fewer particles absorbed in the air, ASY showed a slight upward trend year by year, from 0.694 to 0.748. Aerosol absorption generally comes from pollutant emissions, biomass combustion and other sources, which also shows Beijing’s pollution emissions are decreasing.
To study the seasonal characterization of AOD, the monthly scale distribution for 2015–2020 was counted, as shown in Figure 2b. The horizontal axis represents the month, and the vertical axis represents the value of the AOD. It is clear that AOD peaked in the summer (June to August) each year, with a high AOD of 1.5 in July. Compared with spring (March to May), the autumn (September to November) showed lower values, followed by winter (December to February). Spring and autumn are affected by dust aerosols, while summer precipitation is high in humidity and hygroscopicity of aerosol particles, although summer rain has some settling and cleaning effects on aerosol particles. AOD was still at a high level in summer. Because Beijing has high temperatures and relative humidity, when the solar radiation is very strong, the water vapor content in the atmosphere increases. At the same time, the photochemical reaction is very active, enhancing atmospheric instability and accelerating the formation of secondary aerosol particles, resulting in the highest value of AOD in summer. This can also be observed in the aerosol particle size distribution in winter and summer. In winter, due to the severe air pollution, aerosol particles mainly come from biomass combustion and anthropogenic emissions, which also lead to high AOD loading.
3.2. Annual Trend of ADRF
Figure 3 shows the trend of changes in ADRF from 2015 to 2020 in Beijing. The data come from https://aeronet.gsfc.nasa.gov/ (accessed on 16 July 2021). ADRF at the ATM varied from 72.52 W/m2 to 83.82 W/m2. Overall, there was a downward trend, which indicates that the aerosol radiative effect reduced the heating effect on the atmosphere. A positive value of ADRF at the ATM indicates that aerosols can absorb solar radiation and warm the atmosphere. The ADRF at the TOA and BOA varied from −97.51 W/m2 to −120.76 W/m2 and −24.99 to −34.96 W/m2. ADRF at the TOA is negatively expressed as the part of solar radiation that reaches the atmosphere and is reflected due to the presence of aerosols. Additionally, ADRF at the BOA can be understood as aerosols in the atmosphere that block solar radiation from reaching the surface and cool it down.
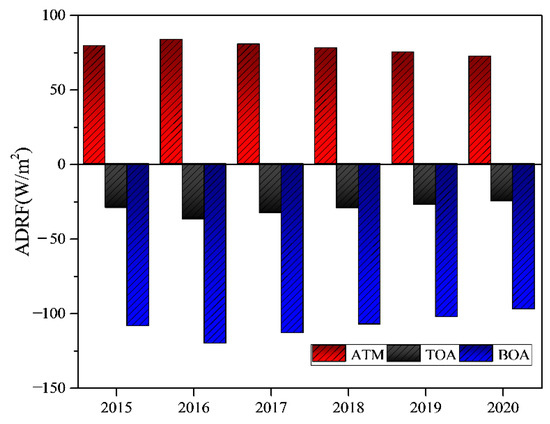
Figure 3.
Annual average of ADRF from 2015 to 2020.
3.3. Data Validation
3.3.1. Verification of AOD
The accuracy assessment was derived from the comparison between MODIS AOD and AERONET AOD matching. MODIS provided data in three bands of 412 nm, 470 nm and 660 nm, but as AERONET lacked the data from these three bands, the interpolation method was used to calculate and compare them. Figure 4 shows the results of the analysis of 412 nm, 470 nm and 660 nm. The red solid line represents the regression line. Most of the data were more consistent after the correlation coefficient reached 0.9, and the error was relatively small. This indicates that the MODIS AOD obtained in Beijing is reliable, and the accuracy of data products is trustworthy.

Figure 4.
Verification of AOD for MODIS and AERONET at 412 nm, 470 nm and 660 nm.
3.3.2. Verification of ADRF
Figure 5 shows the results of ADRF calculated by SBDART and AERONET validation for TOA, ATM and BOA. The horizontal axis was derived from the data measured by AERONET, and the vertical axis was calculated by SBDART; both sets of data were matched in terms of time and space. Noteworthily, the accuracy of SBDART’s calculation of ADRF has been verified in many articles [34,35]. In the resulting 300 sample data, the comparison found that the correlation coefficient of all reached 0.8. A high correlation between them is shown; thus, the results from calculating ADRF using MODIS data and substituting SBDART are reliable. Therefore, calculating regional ADRF in Beijing is theoretically feasible.

Figure 5.
Verification of SBDART ADRF and AERONET ADRF at TOA, ATM and BOA.
3.4. Trends in MODIS AOD
In order to further confirm the availability of MODIS AOD, the annual and monthly scale changes of AOD (550 nm) were obtained through the treatment of MODIS products, which are shown in Figure 6. Compared with the AERONET data, MODIS AOD showed a similar trend, that is, AOD showed a downward trend from 2015 to 2020. Likewise, MODIS AOD also showed a similar trend on the monthly scale distribution. The current verification of MODIS aerosol products worldwide shows that compared to AERONET, the regression coefficient between MODIS AOD and AERONET AOD in Section 3.1 is less than 1, which is also confirmed.
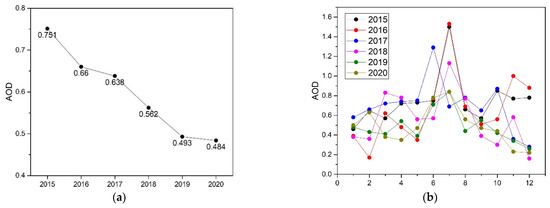
Figure 6.
Description of MODIS AOD at 550 nm: (a) annual change trend graph of AOD; (b) monthly change trend graph of AOD from 2015 to 2020.
3.5. Distribution of AOD in Beijing
The change trend of AOD was analyzed by AERONET for Beijing, and the observation results in recent years show that the aerosol loading decreased year by year. In order to understand the distribution of AOD throughout Beijing clearly, more than 5000 MODIS DB AOD (412 nm) from 2015 to 2020 were extracted, and the data were resampled for one year on average, resulting in a graph of annual mean distribution.
MODIS data, published at https://ladsweb.modaps.eosdis.nasa.gov/ (accessed on 15 July 2021) processing was implemented using the IDL programming language and was divided into four steps: data projection, band extraction, region cropping and mean resampling. After processing, the average annual distribution of AOD from 2015 to 2020 was obtained, as shown in Figure 6.
The downward trend of the annual mean of AOD can be clearly seen in Figure 7, and the maximum of AOD appeared in the central southeast region. The central region experiences high population density and pollutant emissions, resulting in a high aerosol loading. Additionally, the southeast region is close to Tianjin, Hebei and other heavily polluted cities, and thus is also vulnerable to the secondary pollution of these urban pollutants; therefore, a general declining trend can be seen from the center of these areas to their surroundings.
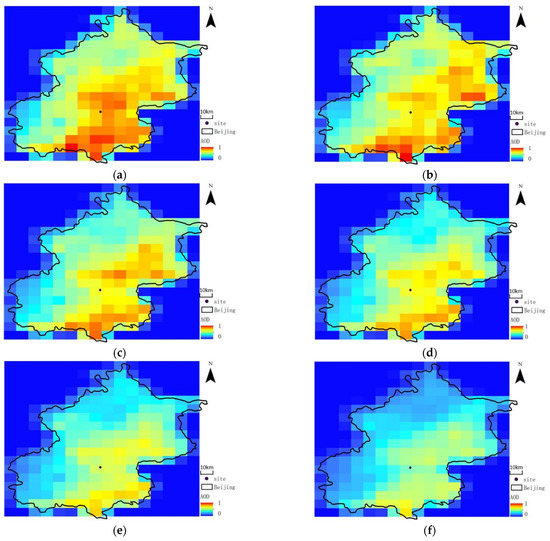
Figure 7.
The distribution of AOD (412 nm) in Beijing from 2015 to 2020 (a–f).
3.6. The Results of ADRF in Beijing
Many different degrees of pollution data were extracted for air pollution events during the winters of recent years, and finally, averages were taken to study the numerical characterization of ADRF. The degree of contamination is usually based on the PM2.5/10 concentration index. Concentrations of PM contaminants greater than 400 μg/m3 indicate severe pollution, those between 250 μg/m3 and 400 μg/m3 indicate moderate pollution, those between 100 μg/m3 and 250 μg/m3 indicate slight pollution, and those less than 100 μg/m3 indicate a clear weather.
Table 2 shows the aerosol optical properties and aerosol direct radiative forcing at the ATM under different degrees of pollution in Beijing. During clear weather, the concentration of pollutants was maintained at a low level, and the corresponding AOD was generally less than 0.1. Meanwhile, the aerosol radiative effect was not obvious. ADR at the TOA ranged from −10 to −25 W/m2, BOA from −15 to −40 W/m2, and that at the ATM did not exceed 25 W/m2. With the increase in pollution degrees, the AOD increased, and the aerosol radiative effect increased significantly. When air pollution was severe, ADRF at the TOA ranged from −130 to −70 W/m2; that at the BOA ranged from −200 to −150 W/m2; and that at the ATM as 70 to 120 W/m2. ADRF at the TOA was negative, indicating that the presence of aerosols causes part of the solar radiation to be reflected to outer space, and the earth–atmosphere system is in a cooling state [36]. A negative value at the BOA means that the solar radiation reaching the surface is scattered and absorbed by aerosols in the atmosphere, having a cooling effect on the surface, and the surface temperature drops. The value at the ATM was positive, indicating that aerosols absorb the energy of solar radiation and have a warming effect on the atmosphere [37].

Table 2.
The average values of the data at different degrees of pollution.
In order to analyze the aerosol radiative effect in Beijing under complex pollution conditions, the regional aerosol optical characteristics distribution under different degrees of pollution was obtained using MODIS in Beijing. In this way, the ADRF is calculated for each grid, and the result map of the regional ADRF at the ATM under different pollution degrees was obtained. The atmospheric warming effect caused by the aerosol radiative effect had a strong positive correlation with the continuation and development of pollution. It can be seen from Figure 8 that as the degree of pollution increased, ADRF at the ATM increased. This is mainly due to the increase in anthropogenic emissions, resulting in a quantitative change in the radiation effect of aerosols. In the period of severe pollution, the proportion of urban industrial aerosols can be as high as 80%, which shows that local aerosol loading mainly comes from anthropogenic emissions and biomass combustion, which are the main causes of air pollution.
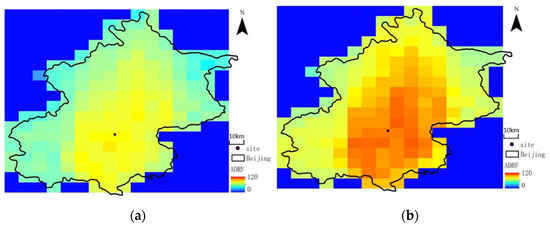
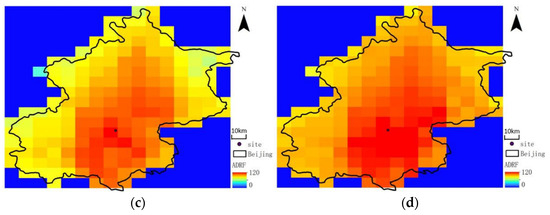
Figure 8.
Distribution of ADRF at ATM under different degrees of pollution (from no pollution to severe pollution, (a–d).
From the perspective of the whole region, the calculation results are more realistic; the value of ADRF in the center and local southeast was relatively high, and that of the surrounding region was generally relatively small. There are two main reasons for this distribution characteristic. First, the population density in the center of city is high, the industrial transportation industry develops faster, and the anthropogenic emissions are greater. Beijing is situated on terrain surrounded by mountains on three sides. Once aerosol accumulation occurs, it does not dissipate in a short period of time. This results in the current situation, where the highest amounts of gradually dispersed ADRF are found in the surrounding regions, while higher values of undispersed ADRF are found in the city center. Second, the southeast region of Beijing is close to Hebei, Tianjin and other more polluted cities. Under the action of strong winter winds, the aerosols in the two regions likely cause secondary mixing. The extinction effect caused by this mixed secondary aerosol is stronger, and it further strengthens the aerosol radiative effect. From the calculation results, ADRF distribution was in the range of 10 to 25 W/m2 over the entire area in no-pollution areas. Under slight pollution and moderate pollution, these values also increased correspondingly, especially in severely polluted weather, in which the maximum reached 110 W/m2. Under the aerosol radiative effect, the absorption and scattering of solar radiation by aerosols is more significant, reducing the net radiation reaching the surface and increasing the absorption of solar radiation by aerosols in the atmosphere. The effect of atmospheric heating is obvious, and it contributes to the continuation and occurrence of air pollution.
3.7. Correlation Verification of Influencing Factors
The strong correlation between the aerosol radiative effect and AOD has been demonstrated in previous chapters, and a certain understanding of the overall pollution situation in Beijing’s urbanization process has also been obtained. In order to have an improved understand of the more frequent and severe pollution events in autumn and winter, the interaction between the aerosol radiative effect and related factors is discussed in this section, e.g., relative humidity (RH), lower troposphere stability (LHS) and wind speed (WS). To eliminate the influence of the solar zenith angle and intraseasonal differences, this section used the winters of 2015–2020 as a representative. Radiation data are published at https://aeronet.gsfc.nasa.gov/ (accessed on 28 February 2022), and LHS and WS are published at https://disc.gsfc.nasa.gov/ (accessed on 28 February 2022), while RH can be found at https://quotsoft.net/air/ (accessed on 28 February 2022).
3.7.1. Relative Humidity
From no pollution to severe pollution, the absolute value of ADRF increased. Because more solar radiation is absorbed by higher concentrations of atmospheric pollutants, more solar radiation is prevented from reaching the surface. It is worth noting that in several samples with different degrees of pollution, the absolute value of ADRF was positively correlated with relative humidity [38]. As shown at Figure 9, it can be understood that as the aerosol radiative effect heats the atmosphere and cools the surface, a temperature inversion layer easily forms, which inhibits the upward diffusion of aerosol particles and the transfer of temperature and water vapor. An increase in humidity near the ground below the inverse temperature layer enhances the hygroscopicity of aerosols and increases the scattering effect. This in turn helps to stabilize the persistence of the inversion layer, so that the atmospheric boundary layer is stable and the air pollution is further strengthened [39]. The presence of the inverse temperature layer increases the surface water vapor content, and the relative humidity of the air increases. The concentration of air pollutants continues to grow and does not easily dissipate, more solar radiation is absorbed by the atmosphere, and the stability of the atmospheric boundary layer is increased, so air pollution continues to occur.
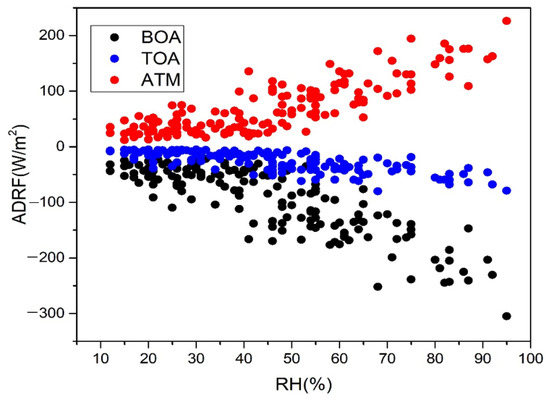
Figure 9.
Correlation analysis of ADRF and RH.
The aerosol radiative effect and changes in relative humidity under different degrees of pollution were observed from a complete set of data on air pollution events. Under slight to severe pollution conditions, the ADRF at the ATM had a positive correlation with the concentration of ground pollutants, with an average of 1 W/m2 that increased by 0.46 μg/m3. It was also positively correlated with humidity, with an average increase of 1.875% by 1 W/m2. At the same time, the higher the ADRF at the ATM, the higher the humidity [40].
3.7.2. Lower Troposphere Stability
In general, the less severe the pollution, the less obvious the aerosol radiative effect, the higher the height of the boundary layer, the stronger the lower troposphere stability (LHS) and the easier the diffusion of pollutants near the ground. The atmospheric boundary layer height (ABLH, also be called planetary boundary layer) usually refers to the troposphere, which is directly affected by the ground and has a direct relationship with the ground. Therefore, in times of pollution, the ABLH is used as the standard for dividing the stability of the LHS. (Stability: ABL < 500 m, secondary stability: 500 m < ABL < 1500 m, instability: ABL > 1500 m) [41]. The correlation between LHS and ADRF is analyzed in this section.
It can be seen from Figure 10 that ADRF and LHS showed a strong negative correlation. As the absolute value of ADRF increased, ABLH decreased, implying enhanced LHS. When the pollution was not severe, the aerosol radiative effect was not obvious, and the higher the ABL, the worse the LHS. The aggravation of pollution level leads to significant absorption and scattering effects of aerosols, cooling the surface and heating the atmosphere, reducing ABLH and thereby increasing the stability of ABLH. It is the continuous feedback effect between ADRF and LHS that allows the air pollution to continue. In particular, in the case of severe pollution, the ADRF at the ATM varied from 90 W/m2 to 200 W/m2, and the ABLH at this time was low, which can easily lead to a strong inversion layer with a thickness of 300~500 m [42]. When the inversion layer occurs, atmospheric turbulence movement is inhibited, especially vertical turbulence movement, resulting in unfavorable convective diffusion, enhancing LHS.
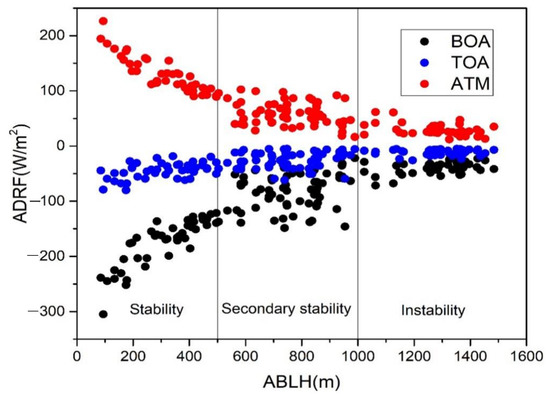
Figure 10.
Correlation analysis of ADRF and LHS.
3.7.3. Wind Speed
From 2015 to 2020, several pollution incidents occurred in Beijing, with the most frequent and severe pollution seen in autumn and winter. Wind speed has a significant impact on the occurrence and dissipation of pollution. Normally, the weak southwesterly wind prevailing before the pollution occurs transports the pollutants to Beijing; the strong northwesterly wind effectively removes the pollutants during the pollution dissipation stage and after the pollution occurs [43]. After the pollution event, the WS is generally small, the ABLH is low and the RH is high, and it is accompanied by strong LHS.
Figure 11 shows the negative correlation between ADRF and WS. The stronger the aerosol radiative effect, the higher the WS. The explosive growth of pollutants caused by persistently strong wind speed and the subsequent high aerosol loading had a dramatic impact on the radiation budget of the Earth’s atmospheric system [44]. The water vapor conveyor belt formed under the action of strong wind made the water vapor continuously transport to Beijing, which increased RH. Overall, the probability of pollution occurrence decreased with increasing wind speed, suggesting that pollution events mainly occurred in low-wind-speed conditions. It can be further seen that when the WS was less than 1 m/s, the aerosol radiative effect was more obvious, and the possibility of pollution in autumn and winter was very high. Generally, under the action of strong wind, this stable state can be broken, and the pollution incident can be ended [45].
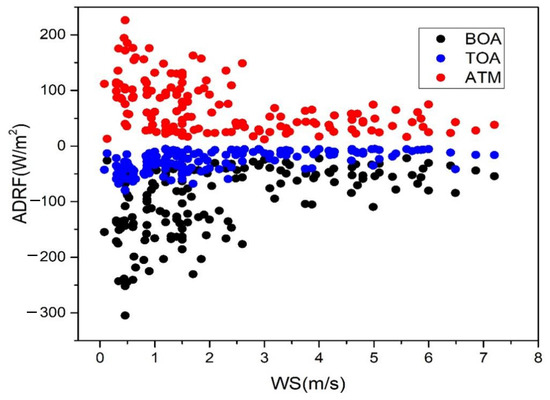
Figure 11.
Correlation analysis of ADRF and WS.
4. Conclusions
Based on the study of traditional single-point regions, the spatial distribution of aerosol optical properties throughout Beijing was carried out, and the ADRF at the ATM in Beijing was calculated. The distribution of AOD clearly shows the distribution of air quality in Beijing, which can better characterize the region climate. These following conclusions were reached:
- (1)
- Beijing has different degrees of pollution throughout the year, especially in winter, but due to the vigorous control measures in recent years, the air quality has gradually improved. The results show that the average annual AOD ranged from 0.757 in 2015 to 0.497 in 2020, and ASY showed a slight upward trend year by year, from 0.694 to 0.748, while SSA remained within a stable range.
- (2)
- The distribution of ADRF at the ATM in Beijing was similar to that of AOD, which is due to the strong correlation between the aerosol radiative effect and AOD.
- (3)
- The regional distribution of ADRF at the ATM under different degrees of pollution was calculated. From clear weather to severe pollution, ADRF at the ATM ranged from 24.2 to 92.3 W/m2, from −37.8 to −184.5 W/m2 at the BOA and from −13.6 to −92.2 W/m2 at the TOA. With increasing severity of pollution, the absolute value of ADRF increased, and the aerosol radiative effect became more obvious.
- (4)
- The aerosol radiative effect showed a strong positive correlation with RH and LHS, but a negative correlation with WS. As pollution increases, the aerosol radiative effect warms the atmosphere and cools the surface, inhibiting the upward diffusion of aerosol particles and the transmission of water vapor, resulting in an increase in RH and LHS and a decrease in WS. This continuous feedback effect exacerbates air pollution, while dry, clean and strong wind breaks this feedback, ending the pollution event.
Author Contributions
Conceptualization, Q.M.; methodology, H.W.; writing—original draft preparation, Q.M. and H.W.; writing—review and editing, Q.M. and H.W. All authors have read and agreed to the published version of the manuscript.
Funding
This work was supported by the National Natural Science Foundation of China (Grant No. 51876147).
Institutional Review Board Statement
Not applicable.
Informed Consent Statement
Not applicable.
Data Availability Statement
The study did not report any data.
Acknowledgments
This work was supported by the National Natural Science Foundation of China (No.51876147). In addition, we are grateful for the support provided by the data websites, such as (MODIS, AERONET). A very special acknowledgement is made to the editors and referees, who gave us feedback to improve this paper.
Conflicts of Interest
The authors declare no conflict of interest.
References
- Jin, S.K.; Ma, Y.Y.; Fan, R.; Wang, L.C.; Gong, W. Haze events at different levels in winters: A comprehensive study of meteorological factors, Aerosol characteristics and direct radiative forcing in megacities of north and central China. Atmos. Environ. 2021, 245, 118056. [Google Scholar]
- Savijärvi, Y.Z. The effect of aerosols on long wave radiation and global warming. Atmos. Res. 2014, 1, 102–111. [Google Scholar]
- Zhang, X.; Wang, H.; Che, H.Z.; Tan, S.C.; Yao, X.P.; Peng, Y. Radiative forcing of the aerosol-cloud interaction in seriously polluted East China and East China Sea. Atmos. Res. 2021, 252, 105405. [Google Scholar] [CrossRef]
- Charlson, R.J.; Schwartz, S.E.; Hales, J.M.; Cess, R.D.; Coakley, J.A. Climate forcing by anthropogenic aerosols. Science 1992, 255, 423–430. [Google Scholar] [CrossRef] [PubMed]
- Zhuang, B.L.; Wang, T.J.; Deng, J.J.; Xie, M.; Yin, C.Q. Direct radiative forcing and climate effects of anthropogenic aerosols with different mixing states over China. Atmos. Environ. 2013, 79, 349–361. [Google Scholar] [CrossRef]
- Wang, L.L.; Wang, Y.S.; Wang, Y.H.; Sun, Y.; Ji, D.S. Relationship between different synoptic weather patterns and concentrations of atmospheric pollutants in Beijing during summer and autumn. China Environ. Sci. 2010, 30, 924–930. [Google Scholar]
- Ricchiazzi, P.; Yang, S.; Gautier, C.; Sowle, D. SBDART: A Research and Teaching Software Tool for Plane-Parallel Radiative Transfer in the Earth’s Atmosphere. Bull. Am. Meteorol. Soc. 1998, 79, 2101–2114. [Google Scholar] [CrossRef] [Green Version]
- Bi, J.; Shi, J.; Xie, Y. Dust Aerosol Characteristics and Shortwave Radiative Impact at a Gobi Desert of Northwest China during the Spring of 2012. J. Meteorol. Soc. Jpn. 2014, 92, 33–56. [Google Scholar] [CrossRef] [Green Version]
- Esteve, A.R.; Estellés, V.; Utrillas, M.P. Analysis of the aerosol radiative forcing over a Mediterranean urban coastal site. Atmos. Res. 2014, 137, 195–204. [Google Scholar] [CrossRef]
- Osgouei, P.E.; Roberts, G.; Kaya, S.; Bilal, M.; Dash, J.; Sertel, E. Evaluation and comparison of MODIS and VIIRS aerosol optical depth (AOD) products over regions in the Eastern Mediterranean and the Black Sea. Atmos. Environ. 2022, 268, 118784. [Google Scholar] [CrossRef]
- Cai, H.; Yang, Y.; Luo, W. City-level variations in aerosol optical properties and aerosol type identification derived from long-term MODIS/Aqua observations in the Sichuan Basin, China. Urban Clim. 2021, 38, 100886. [Google Scholar] [CrossRef]
- Bibi, H.; Alam, K.; Chishtie, F. Intercomparison of MODIS, MISR, OMI, and CALIPSO aerosol optical depth retrievals for four locations on the Indo-Gangetic plains and validation against AERONET data. Atmos. Environ. 2015, 111, 113–126. [Google Scholar] [CrossRef]
- Bright, J.M.; Gueymard, C.A. Climate-specific and global validation of MODIS Aqua and Terra aerosol optical depth at 452 AERONET stations. Sol. Energy 2019, 183, 594–605. [Google Scholar] [CrossRef]
- Zhang, X.; Li, L.; Chen, C.; Zheng, Y.; Dubovik, O.; Derimian, Y.; Lopatin, A.; Gui, K.; Wang, Y.; Zhao, H.; et al. Extensive characterization of aerosol optical properties and chemical component concentrations: Application of the GRASP/Component approach to long-term AERONET measurements. Sci. Total Environ. 2022, 812, 152553. [Google Scholar] [CrossRef]
- Fan, Y.Z.; Sun, X.B.; Huang, H.L. The primary aerosol models and distribution characteristics over China based on the AERONET data. J. Quant. Spectrosc. Radiat. Transf. 2021, 275, 107888. [Google Scholar] [CrossRef]
- Mao, Q.J.; Zhang, H.X.; Chen, Q.X.; Huang, C.L. Satellite-based assessment of direct aerosol radiative forcing using a look-up table established through AERONET observations. Infrared Phys. Technol. 2019, 102, 103017. [Google Scholar] [CrossRef]
- Mao, Q.J.; Huang, C.L.; Zhang, H.X.; Chen, Q.X.; Yuan, Y. Aerosol optical properties and radiative effect under different weather conditions in Harbin, China. Infrared Phys. Technol. 2018, 89, 304–314. [Google Scholar] [CrossRef]
- Rui, L.; Yu, X.; Jia, H. Aerosol optical properties and direct radiative forcing at Taihu. Appl. Optic. 2017, 56, 7002–7012. [Google Scholar]
- Almazroui, M. A comparison study between AOD data from MODIS deep blue collections 51 and 06 and from AERONET over Saudi Arabia. Atmos. Res. 2019, 225, 88–95. [Google Scholar] [CrossRef]
- Loria-Salazar, S.M.; Holmes, H.A.; Arnott, W.P. Evaluation of MODIS columnar aerosol retrievals using AERONET in semi-arid Nevada and California, U.S.A. during the summer of 2012. Atmos. Environ. 2016, 144, 345–360. [Google Scholar] [CrossRef]
- Jia, H.; Ma, X.; Yu, F. Significant underestimation of radiative forcing by aerosol–cloud interactions derived from satellite-based methods. Nat. Commun. 2021, 12, 3649. [Google Scholar] [CrossRef] [PubMed]
- Kinne, S.; North, P.; Pearson, K.; Popp, T. Aerosol radiative effects with dual view AOD retrievals. Atmos. Chem. Phys. 2021, 25, 954. [Google Scholar]
- Jia, H.L.; Quaas, J.; Gryspeerdt, E.; Böhm, C.; Sourdeval, O. Addressing the difficulties in quantifying the Twomey effect for marine warm clouds from multi-sensor satellite observations and reanalysis. Atmos. Chem. Phys. Discuss. 2022, 7, 999. [Google Scholar]
- Xu, X.T.; Liu, C.; Wang, J.D. Long-term multi-dataset direct aerosol radiative forcing and its efficiencies: Intercomparisons and uncertainties. Atmos. Res. 2021, 267, 105964. [Google Scholar] [CrossRef]
- Zhang, J.; Reid, J.S. MODIS aerosol product analysis for data assimilation: Assessment of over-ocean level 2 aerosol optical thickness retrievals. J. Geophys. Res. Atmos. 2006, 111. [Google Scholar] [CrossRef]
- Mao, Q.J.; Huang, C.L.; Zhang, H.X.; Chen, Q.X.; Yuan, Y. Performance of MODIS aerosol products at various timescales and in different pollution conditions over eastern Asia. Sci. China Technol. Sci. 2021, 64, 774–784. [Google Scholar] [CrossRef]
- Su, Y.; Shi, G.Y.; Lin, C. Evaluation of Moderate-Resolution Imaging Spectroradiometer (MODIS) Deep Blue Aerosol Products Using Ground-Based Measurements over Beijing. Sci. Online Lett. Atmos. 2011, 7, 133–136. [Google Scholar]
- Misra, A.; Jayaraman, A.; Ganguly, D. Validation of Version 5.1 MODIS Aerosol Optical Depth (Deep Blue Algorithm and Dark Target Approach) over a Semi-Arid Location in Western India. Aerosol Air Qual. Res. 2015, 15, 252–262. [Google Scholar] [CrossRef] [Green Version]
- Che, Y.H.; Xue, Y.; Guang, J.; She, L. Evaluation of the AVHRR Deep Blue aerosol optical depth dataset over mainland China. ISPRS J. Photogramm. Remote Sens. 2018, 146, 74–90. [Google Scholar] [CrossRef]
- Shi, H.; Xiao, Z.; Zhan, X. Evaluation of MODIS and two reanalysis aerosol optical depth products over AERONET sites. Atmos. Res. 2019, 220, 75–80. [Google Scholar] [CrossRef]
- García, J.P.; Diaz, F.J.; Exposito, A.M. Díaz, Shortwave radiative forcing and efficiency of key aerosol types using AERONET data. Atmos. Chem. Phys. 2012, 12, 5129–5145. [Google Scholar] [CrossRef] [Green Version]
- Chandrasekhar, S. Radiative Transfer; The Clarendon Press: Reading, UK, 1950. [Google Scholar]
- Zhang, W.; Huiyun, M.A.; Zou, Z. Automatic detection of night time radiation fog based on SBDART radiative transfer model and the analysis of time series. Remote Sens. Land Resour. 2014, 26, 14. [Google Scholar]
- Fu, Y.; Zhu, J.; Yang, Y. Grid-cell aerosol direct shortwave radiative forcing calculated using the SBDART model with MODIS and AERONET observations: An application in winter and summer in eastern China. Adv. Atmos. Sci. 2017, 34, 952–964. [Google Scholar] [CrossRef]
- Valenzuela, A.; Arola, A.; Anton, M. Black carbon radiative forcing derived from AERONET measurements and models over an urban location in the southeastern Iberian Peninsula. Atmos. Res. 2017, 191, 44–56. [Google Scholar] [CrossRef] [Green Version]
- Valenzuela, A.; Olmo, F.J.; Lyamani, H. Aerosol radiative forcing during African desert dust events (2005–2010) over Southeastern Spain. Atmos. Chem. Phys. 2012, 12, 10331–10351. [Google Scholar] [CrossRef] [Green Version]
- Tian, P.F.; Zhang, L.; Cao, X.J.; Sun, N.X. Enhanced Bottom-of-the-Atmosphere Cooling and Atmosphere Heating Efficiency by Mixed-Type Aerosols: A Classification Based on Aerosol Nonsphericity. J. Atmos. Sci. 2018, 75, 113–124. [Google Scholar] [CrossRef]
- Goel, R.K.; Varshneya, N.C.; Verma, T.S. Effect of relative humidity on the scattering properties of urban aerosol particles. Proc. Indian Acad. Sci.-Earth Planet. Sci. 1984, 93, 17. [Google Scholar] [CrossRef]
- Tian, S.L.; Pan, Y.P.; Liu, Z.R.; Wen, T.X.; Wang, Y.S. Size-resolved aerosol chemical analysis of extreme haze pollution events during early 2013 in urban Beijing, China. J. Hazard. Mater. 2014, 279, 452–460. [Google Scholar] [CrossRef]
- Zhang, W.J.; Zhang, X.Y.; Zhong, J.T.; Wang, Y.Q.; Wang, J.Z.; Zhao, Y.F. The effects of the “two-way feedback mechanism” on the maintenance of persistent heavy aerosol pollution over regions with relatively light aerosol pollution in northwest China. Sci. Total Environ. 2019, 688, 642–652. [Google Scholar] [CrossRef]
- Hu, T.T.; Yoshieb, R. Effect of atmospheric stability on air pollutant concentration and its generalization for real and idealized urban block models based on field observation data and wind tunnel experiments. J. Wind Eng. Ind. Aerodyn. 2020, 207, 104380. [Google Scholar] [CrossRef]
- Zhao, D.D.; Xin, J.Y.; Gong, C.S.; Quan, J.N.; Liu, G.J. The formation mechanism of air pollution episodes in Beijing city: Insights into the measured feedback between aerosol radiative forcing and the atmospheric boundary layer stability. Sci. Total Environ. 2019, 692, 371–381. [Google Scholar] [CrossRef] [PubMed]
- Prasad, P.; Basha, G.; Ratnam, M.V. Is the atmospheric boundary layer altitude or the strong thermal inversions that control the vertical extent of aerosols? Sci. Total Environ. 2022, 802, 149758. [Google Scholar] [CrossRef] [PubMed]
- Liu, C.; Huang, J.; Tao, X.; Deng, L.; Fang, X.; Liu, Y.; Luo, L.; Zhang, Z.; Xiao, H.W.; Xiao, H.Y. An observational study of the boundary-layer entrainment and impact of aerosol radiative effect under aerosol-polluted conditions. Atmos. Res. 2021, 250, 105348. [Google Scholar] [CrossRef]
- Lu, Q.; Chao, L.; Zhao, D.L.; Zeng, C.; Li, J.; Lu, C.S. Atmospheric heating rate due to black carbon aerosols: Uncertainties and impact factors. Atmos. Res. 2020, 240, 104891. [Google Scholar] [CrossRef]
Publisher’s Note: MDPI stays neutral with regard to jurisdictional claims in published maps and institutional affiliations. |
© 2022 by the authors. Licensee MDPI, Basel, Switzerland. This article is an open access article distributed under the terms and conditions of the Creative Commons Attribution (CC BY) license (https://creativecommons.org/licenses/by/4.0/).