Abstract
The regional climatic comfort index (CCI) deteriorated significantly due to climate change and anthropogenic interference. Knowledge, regarding the long-term temporal dynamics of the CCI in typical regions, should be strengthened. In this study, we analyze the temporal and spatial evolution of CCI from 1969 to 2018 in Guangdong Province, based on a number of meteorological indicators. Additionally, the population exposure to climate unconformity was examined since 1990 with the help of population data. Our study found that: (1) the warming and humidifying of the summer climate served as the main driving force for the continuous deterioration of the CCI, with comfortable days decreased by 1.06 day/10 year and the extremely muggy days increased by 2.83 day/10 year; (2) spatially, the lowest climate comfortability concentrated in southwestern Guangdong with more than 50 uncomfortable days each year, while the climate comfortability in northeastern Guangdong tends to deteriorate with a higher rate, which can reach as high as 6 day/10 year; (3) in summer, the population exposure to uncomfortable climate highly centralized in the Pearl River Delta, Shantou, Jieyang, and the surrounding areas, and both area and population exposure showed increasing trends. Particularly, Shenzhen held the highest growth rate of population exposure with an increased rate of 2.94 million/10 year; (4) although the discomfort distribution and deterioration rate vary across the province, the spatial heterogeneity of comfortability is diminishing in Guangdong Province. This study will provide a scientific reference in areas of regional urban planning, thermal environment improvement, local resident health risk analysis, and key strategy implementation.
1. Introduction
The climatic comfort index (CCI) is a biometeorological indicator evaluating the comfort of human beings in different climatic conditions from the perspective of meteorology, stemming from the principle of heat exchange between the human body and the near-Earth atmosphere [1]. Under the background of global change, more frequent climate extremes, including heatwaves, rainstorms, and tropical storms with higher intensity have been witnessed all over the world [2,3], posing a higher burden on human regulatory capability, threatening the public’s lives and health, and at the same time, leading to significant economic losses [4,5,6]. As a comprehensive denotation of climatic conditions, including temperature, humidity, wind, etc., the CCI alteration can negatively impact human health and socioeconomic life severely once the threshold is overrun [7]. It is particularly significant to discuss the influence of climate change on the human body’s awareness from the perspective of the CCI [8]. Moreover, conducting long-term CCI evaluation research with daily ground monitoring data, on the one hand, strengthens the understanding of climate change and its influences, and on the other hand, provides scientific guidance for the regulation of human settlement assessment, urban and rural planning, climate event response, and the corresponding adaptive strategies [9,10,11].
Extensive CCI research has been carried out domestically and globally based on various CCI models [12,13]. Evaluations of the CCI were based on simple empirical models in the early stages, which developed into complex mechanism models in recent years, with the refinement of data sources and the diversification of the research aims [8,14]. The influence of different meteorological factors on human comfort originated from Europe and the United States since the early 20th century [15,16]. Over the past decades, more than 160 evaluation indices have been successively involved in the evaluation of climate comfort, which can be summarized as empirical and mechanistic models [17]. However, although mechanistic models are based on heat balance, equations have become increasingly mainstream in the theoretical research of climate comfort evaluation since their emergence in the 1960s, and empirical models, which emerged in the early 20th century, provide significant support to practical applications [18]. The mechanism model is of high computational complexity and strongly limited by the observational records, involving not only unconventional meteorological observation data such as average radiation temperature and somatosensory average wind speed, but also several estimated variables, such as uniform temperature of clothing surface, average temperature of skin and human sweating rate [19]. On the contrary, the simple and relatively reasonable empirical models requiring less computation power, become widely adopted as climate comfort evaluation index, such as the effective temperature (ET) [20], wet bulb globe temperature (WBGT) [21], temperature–humidity index (THI) [22,23] for thermal environments and the wind chill index (WCI) [24] for cold environments. However, due to the certain spatial or temporal limitations of empirical models, some scholars were trying to establish a universal evaluation indicators applicable to all seasons [25]. Climate biologist Terjung improved the WCI to form the wind effect index (WEI), integrating the physical effects of solar radiation in addition to the wind speed on human comfort in cold environments [26]. The THI was originally proposed under the name discomfort index (DI) [27] and was initially applied to hot and humid environments, which was also applied to cold environments as the grading criteria for the model were extended [28,29]. The lack of consideration of individual physiological characteristics has been the biggest challenge for empirical models, incorporating human heat exchange mechanisms to more accurately characterize human comfort would be an efficient solution [30,31]. For example, based on the ideological basis of the principle of human thermal balance, Auliciems and de Freitas qualified a mechanistic-based analysis of the index of clothing (ICL) with empirical formula, to extend its serviceability in temporal and spatial scale [32]. The comprehensive consideration of core meteorological variables, such as temperature, relative humidity, wind speed, and solar radiation makes the empirical model more applicable. However, it would lack of theoretical support if considering the four core elements in a single model. Therefore, combining a series of single models become a beneficial direction for improvement, to for one thing take the advantage of the respective strengths of each, and for another give full consideration to the overall influence of the 4 core meteorological variables [18]. Terjung first proposed the combined model evaluation of CI and WEI, which is suitable to any spatial and temporal scale and can be applied to medical geography, military geography, tourism, architecture, and clothing [26]. In China, since the introduction of the Terjung evaluation system in the 1980s, scholars have conducted a large number of climate comfort evaluation studies based on the combination of classical empirical measurement models [33,34,35,36].
With the further warming of the global climate and intense interference of human activities [2], regional meteorological conditions are conducive to variations and uncertainties in regional CCI, which eventually influence the human body and local social-economic environment to various extents. The evaluation of regional CCI and research of its spatial-temporal variations lay the basis for clarifying the climate change impact and relieving the negative influence of climate deterioration. Spatial-temporal analysis of CCI patterns with high precision based on a long-term data series is especially important for metropolitan areas with dense populations and rapid economic growth.
As one of the pilot regions of China’s reform opening up, Guangdong Province has experienced a rapid concentration of the economy, population, and resources over recent decades, resulting in a non-negligible cumulative effect of climate change impact [37]. With the continuous advancement of the major strategies, such as the Guangdong-Hong Kong-Macao Greater Bay Area and the “Belt and Road Initiative”, the regional urban expansion and population agglomeration will maintain rapid growth, owing to the sufficient social/economic driving force. Compounding the climate background of inhomogeneous global and regional warming, Guangdong Province will confront unprecedented climate and environmental challenges. Given the above considerations, Guangdong Province is taken as study area, to explore the spatial-temporal dynamic of the CCI, with the daily meteorological data of 86 meteorological stations for nearly 50 years, covering temperature, humidity, and the clothing index. The seasonal variation and spatial pattern of population exposure to discomfort climate were analyzed based on the CCI model and population growth data. This paper aims to provide a scientific and theoretical reference for regional urban planning, the thermal environment improvement of human settlements, and the advancement of major strategies.
2. Data and Methodology
2.1. Research Area and Data Sources
Guangdong Province is located in the southeastern coastal area of China across 109.65–117.32° E and 20.22–25.52° N, bordering the South China Sea, with a total land area of 178,500 hm2. Dominated by a subtropical monsoon climate with hot and rainy summers and cool and dry winters, the region is with abundant light, heat, and water resources. The weather and climate show high seasonal and interannual variation, with frequent incidences of natural disasters, such as tropical cyclones, thunderstorms, drought, and heat/cold waves.
In this paper, the modeling and evaluation of the CCI were conducted based on daily average temperatures, relative humidity, sunshine hours, and other meteorological elements based on the metrological observations from 86 stations in Guangdong Province (Figure 1) from 1969 to 2018. Furthermore, the population spatial distribution data (gridded spatial distribution data, POP) from the Data Center of Resources and Environmental Sciences Chinese Academy of Sciences (https://www.resdc.cn/DOI/DOI.aspx?DOIid=32, accessed on 15 November 2021) in 1990, 2000, 2010, and 2015, as well as statistical data for the permanent resident population specified in the 1991–2019 statistical yearbook of Guangdong prefecture-level cities, were collected for the calculation and evaluation of population exposure to discomfort climates.
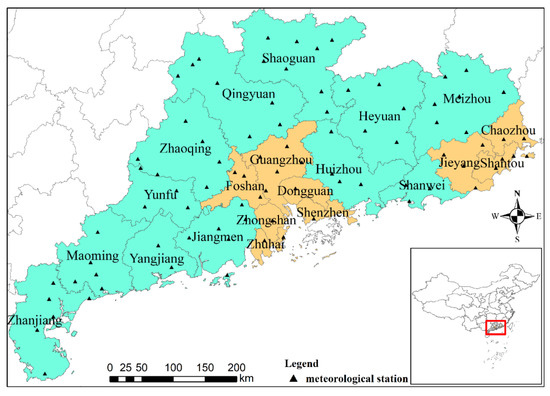
Figure 1.
Location of the study region and meteorological station.
2.2. Research Methods and Evaluation Indicators
The CCI evaluation model recommended by China’s “Climate Suitability Evaluation on Human Settlement Environment” (GB/T27963-2011) mainly covers THI, WEI, and other indicators. Based on previous CCI evaluation models, ICL was combined with THI and WEI to build an integrated CCI evaluation index system [38,39]. The weights of indicators were determined with a combined methodology of analytic hierarchy, classification and assignment, and other methods [40]. Then, a comprehensive CCI evaluation model was established to perform a thorough evaluation of regional CCI (Table 1).

Table 1.
The grading standard of THI, WEI, ICL, and CCI.
The definition and calculation method of each index are detailed below:
- (1)
- THI: A combination of temperature and humidity reflecting the heat flow between the human body and the surrounding environment [41]. This is a classic index to evaluate thermal discomfort, expressed as:where is the air temperature in degrees Celsius (℃), and is the relative humidity (%).
- (2)
- WEI: The law of human body heat loss under the constraints of wind speed and temperature, an important indicator originating from the cold environment evaluation [42]. WEI specifically indicates the heat exchange amount per unit area of the body surface at a skin temperature of 33 °C, expressed as:where denotes the wind speed (m/s), represents the air temperature (℃), and is sunshine hours (h/day).
- (3)
- ICL: Cloth loading recommendations are based on a variety of factors, including air temperature, solar radiation, human metabolism, and wind speed. Different choices of cloth loading can effectively improve or exacerbate climate discomfort [39]:where is 75% of the human body’s metabolic rate (under small activity), taken as , means the human body’s absorption of solar radiation, taken as 0.06, is the solar constant, taken as , and is the solar altitude angle taken as the average condition.
- (4)
- CCI: A comprehensive representation of regional Climate Comfort Index, which is generated based on the weighted average of THI, WEI, and ICL is:where , , and are the graded assignments of THI, WEI, and ICL, respectively, with the weight coefficients of 0.6, 0.3, and 0.1, respectively. Specifically, the comfort level, relatively comfortable level, relatively uncomfortable level, and the discomfort level were classified as Table 2.
 Table 2. The classification standard of the CCI.
2.3. Statistical Analysis
(1) Daily CCI was calculated based on the Equations (1)–(4), and the monthly and annual comfort/discomfort periods were then obtained by adding up the number of comfort/discomfort days in the corresponding month or year. The monthly CCI was assigned to NULL if the missing or false measurements exceeded more than 6 days.
(2) Linear trend estimation [35] was applied to the analysis of the climate change trend as well as the CCI and comfort/discomfort period variation.
2.4. Analysis of Population Exposure
(1) Spatial analysis of population exposure was conducted based on the summer (June to August) data of the comprehensive discomfort days (SD) from 86 stations in 1990, 2000, 2010, and 2015. Herein, the exposure degree of the climate discomfort population was defined as the product of the normalized result of the SD corresponding to the grid point and population size. Spatial interpolation was performed with the Ordinary Kriging method. Then, the SD spatial-temporal distribution map of Guangdong Province was formulated, with a time resolution of 1 year and a spatial resolution of 1 km:
where is the population exposure of Grid in the -th year, is the population size of Grid in the -th year, is the SD of Grid in the -th year, and and are the maximum and minimum values of SD within 29 years, respectively.
(2) Temporal analysis of population exposure was carried out based on the SD data of stations during 1990–2018. The exposure of the discomfort population in every prefecture-level city was defined as the product of normalized results of SD and the number of permanent residents in the city:
where is the population exposure of City in the -th year, is the number of permanent residents of City in the -th year. The other parameters are the same as Formula (5).
3. Results
3.1. Temporal Evaluation of the Comfortable Indexes
The temporal trends of THI, WEI, and ICL over the last 50 years are shown in Figure 2. According to the results, THI, WEI show a significant increase, indicating the climate has been deteriorating from warm relative comfort to thermal discomfort. Compared to the other two indicators, ICL shows a slight downward trend with large fluctuations, especially from the late 1980s to the early 21st century due to continued local warming, while temperature in winter rise in particular faster compared with that in summer and autumn (Figure 2c) [43].
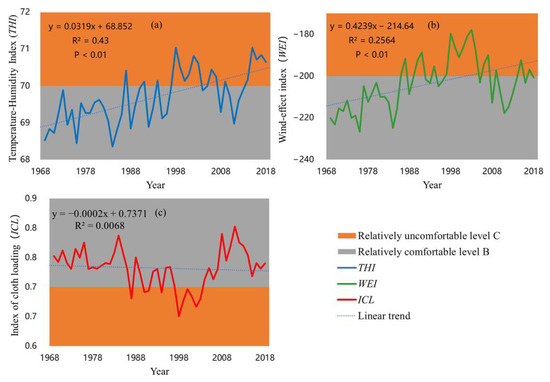
Figure 2.
Interannual variations of comfort index from 1969 to 2018. (a): THI, (b): WEI, (c): ICL.
The variation of averaged monthly uncomfortable periods in the last 50 years was given in Figure 3. In terms of heat and humidity, the non-comfort period (70 ≤ THI ≤ 80) in Guangdong lasts from May to October, which is associated with the combination of high temperatures and high humidity in late spring and summer. THI presents a flat parabolic curve, with an extremely uncomfortable July (Figure 3a). From the wind perspective, Guangdong is under the comfortable level (−600 ≤ WEI ≤ −50) except July and August. WEI shows a clear inverted V-shape, with the lowest and highest values occurring in January (cold winds) and July (slightly hot wind) (Figure 3b). ICL is inversely correlated with temperature, and a higher ICL represents more clothes loading. The thermal discomfort related to clothing lasts from May to September (Figure 3c).
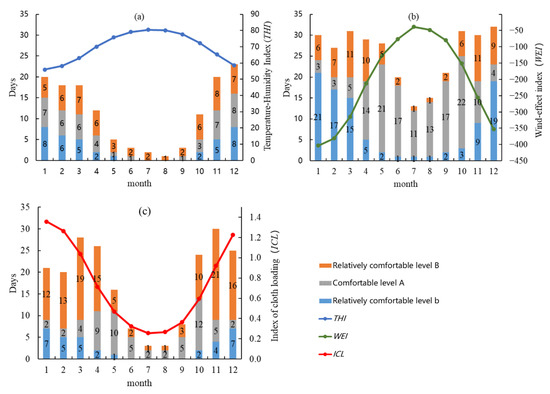
Figure 3.
Monthly variation of comfort index and period of different grades from 1969 to 2018. (a): THI, (b): WEI, (c): ICL.
The average monthly comfort days indicate that July and August hold the least number of comfort days, followed by June and September (Figure 3). The comfort level remained high from November to March. In general, the comfort and relative comfort days of THI, WEI, and ICL were 135 day/year, 307 day/year, and 211 day/year, respectively. Uncomfortable days resulting from heat and humidity were much more than that connected to wind or clothing.
According to the annual average days at different comfort levels in the last 50 years (Table 3), the extremely muggy and muggy days indicated by THI were the highest, reaching 107 and 71 days, respectively. On the contrary, the extremely cold and cold days connected to THI were the least, around 2 days and 5 days, respectively. When referring to the wind impact, the relatively uncomfortable (slightly hot wind) days were the most common condition according to WEI, exhibiting a period of 135 days. Additionally, when it comes to clothing loading, there were around 110 ICL comfortable days and 77 ICL uncomfortable or extremely uncomfortable days.

Table 3.
Variation characteristics of phased comfort index from 1969 to 2018 (day/year).
We examined the number of days of different comfort levels at the 10-year slice to investigate the temporal climate trend. In view of the temporal variation of the comfortable level (Figure 2), the extremely muggy days stemmed from THI exhibited a significant rising trend, with a growing rate of 2.83 day/10 year. For WEI and ICL, the number of days at the relatively cool level presented a decreasing trend, while the relatively hot days, on the contrary, tended to grow. All the indexes indicated the warming inclination of Guangdong Province, aggravating the deterioration of climate comfortability.
3.2. CCI Variations along Time
Affected by the regional climate changes, the comprehensive CCI of Guangdong Province has continuously decreased. According to the variations of characteristics of the CCI in the previous 50 years (Figure 4a), three stages were clearly divided. From 1968 to 1990, the climate comfortability was steadily maintained at a relatively comfortable level, while an obvious decline was witnessed in 1991, resulting the CCI kept at the border of the relative comfortable. Since 1998, climate comfortability degraded continuously and stepped into a relatively uncomfortable stage. The sudden drop in the CCI in the early 1990s was associated with temperature fluctuations in Guangdong Province. Previous studies pointed out that the annual mean temperature in Guangdong generally showed a sudden warming in the late 1980s–1990s [43], while in the Greater Bay Area the abrupt warming occurred around 1993 [44], which is an important reason for the deterioration of the CCI during the corresponding period.
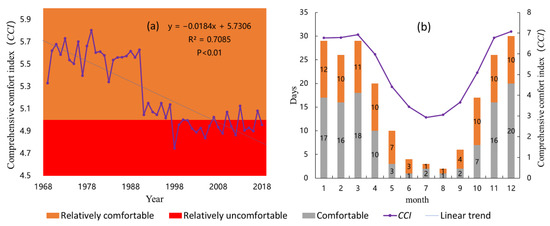
Figure 4.
Interannual variations of CCI (a) and monthly variation of CCI and comfortable duration of different grades (b).
The monthly curve of comfort degree showed an obvious “V” type change (Figure 4b), with the CCI floating between 2.9–3.6 (the uncomfortable level) from June to August, during which only 2–4 comfortable or relatively comfortable days were identified from each month. The comfortable days mainly concentrated from October to the next April, during which the comfort degrees of January, March, and December was the highest.
In terms of the variation tendency of the CCI (relatively) comfortable and (relatively) uncomfortable days (Table 4), the comfortable and relatively comfortable days prominently reduced at a rate of 1.06 day/10 year and 0.28 day/10 year. Meanwhile, the uncomfortable and relatively uncomfortable days significantly increased with a rate of 0.73 day/10 year and 0.64 day/10 year (Table 4). Combined with Table 3, which shows decreasing relatively cold level and increasing relatively hot days, suggests that the increased number of days at the uncomfortable level was mainly led by the higher number of days at the relatively hot (uncomfortable) level.

Table 4.
The variation characteristics of comfort period of a comprehensive index between different years from 1969 to 2018.
As shown in Figure 5a, the uncomfortable days were mainly distributed in Zhanjiang, Foshan, Zhongshan, Shantou, and the surrounding regions, where the average numbers of days at the uncomfortable level in summer reached 47–51 days. The average minimum number of days at the uncomfortable level in summer was distributed in Heyuan and other regions in the northeast, and the annual average number of days at the uncomfortable level was around 37. The changing trend of the number of annual uncomfortable days and its spatial distribution characteristics were detected, and the result was provided in Figure 5b. In general, the number of uncomfortable days increased all over the province. Spatially, northern and eastern Guangdong exhibited a large increase rate, while the rest of the region showed relatively lower growth rate of the uncomfortable days. As a result, although the discomfort degree was rising in general in all the regions, the spatial heterogeneity gradually narrowed along with time. The southeastern province displayed both the high discomfort degree and high deterioration rate, especially in the marine region of Shantou, Jieyang, and Shanwei, where more severe heat threats and environmental risks were recognized.
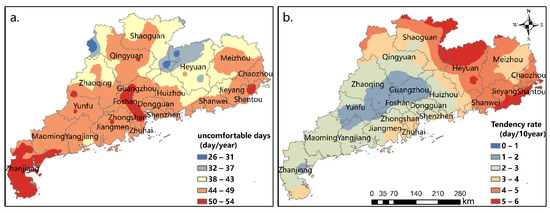
Figure 5.
Distribution of the uncomfortable grade days (a) and corresponding tendency rate (b) during summer 1969 to 2018.
3.3. Population Exposure to Climate Discomfort in Summer
On the basis of the long sequence of the summer uncomfortable days and population distribution data, the population exposure to climate discomfort in summer was explored, and its temporal-spatial change pattern was shown in Figure 6. The high population exposure was mainly concentrated in the Pearl River Delta (PRD) and eastern Guangdong. The core cities of PRD, including Guangzhou and Shenzhen, served as the high-exposure center, and at the same time, exhibited the largest growth from 1990 to 2015, especially in the midst of the city. In 2010, the population exposure of Guangzhou firstly achieved 24 thousand people, with the area of exposure covering 28 km2, while Shenzhen surmounted 24,000 people exposed to the discomfort climate with a 32 km2 coverage in 2015. At the provincial level, the population exposure and its coverage area were continuously expanding from 1990 to 2015. In 1990, the area of population exposure of higher than 3000 people covered 255 km2 in total, which stretched to 1724 km2, 2282 km2, and 3408 km2, in 2000, 2010, and 2015, respectively.
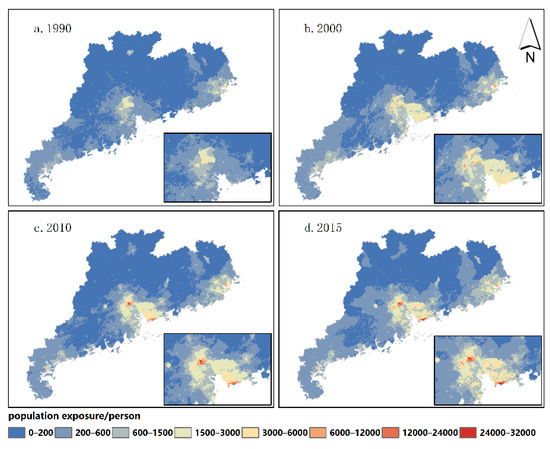
Figure 6.
PSS in the summers of 1990 (a), 2000 (b), 2010 (c), and 2015 (d).
The population exposure to climate discomfort overall significantly increased in all prefecture-level cities (Figure 7). Being the prefecture-level city with the highest population exposure to climate discomfort and the highest rate increase in Guangdong province, the increased rate of population exposure in Shenzhen was 2.94 million people/10 year and reached 9.29 million people in 2015. The rising rate of population exposure in Dongguan, Foshan, and Shantou was also high, around 1.7 million people/10 year, 1.19 million people/10 year, and 0.83 million people/10 year, respectively, and exceeded 5 million people in 2015 in each city. Because of the low population growth rate, the increase in population exposure to climate discomfort was relatively slow in Zhuhai, Chaozhou, Jieyang, Zhongshan, and other cities.
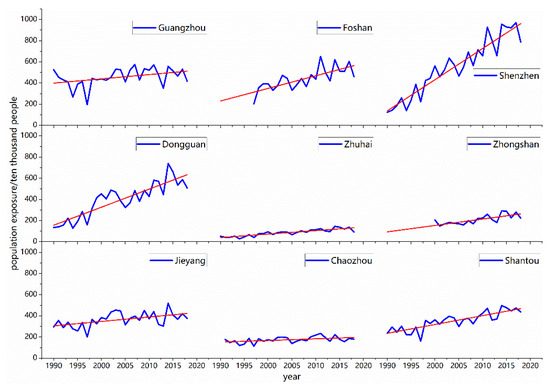
Figure 7.
PST (red line) and corresponding linear trend (blue line) during summer 1990 to 2018. Notes: All reach a significance level of 0.05.
4. Discussion
Previous studies have revealed that the deterioration of the CCI in southern China has been more rapidly than the national average level in the context of global climate changes and urbanization development [45]. Influenced by the changes in temperature, wind speed, relative humidity, and other climatic factors, the annual average WEI in southern China has substantially increased [46]. The climate sensitivity of northeastern and southern China is higher than that of other regions; hot days in southern China throughout the year have increased substantially, and the possibility of future increases tends to be larger than that of nearly all other regions under various climate scenarios [47]. The results of this study are essentially consistent with those of previous research, regarding CCI changes towards the relatively hot level with the rapid deterioration rate.
The spatial distribution of the annual averages of the THI and CCI are clearly affected by latitude and altitude, of which Guangxi, Guangdong, and Hainan have shown the highest discomfort degree connected to high temperature and humidity [48]. Our study indicated that 47% of days were at the uncomfortable level in summer in Guangdong Province during the past 50 years, demonstrating the increasing local heat risk and threat. If we compare the discomfort degree of the three megalopolis in China, the discomfort degree of the Pearl River Delta far exceeded that of the Yangtze River Delta and the Beijing-Tianjin-Tangshan region. Because the vast region in the Pearl River Delta are dominated by the uncomfortable level, and most areas in the Yangtze River Delta and the Beijing-Tianjin-Tangshan region are ranged at the relatively uncomfortable or relatively comfortable levels in the last decades.
In addition, according to the annual uncomfortable duration and the spatial variation tendency in summer in the last 50 years, the Pearl River Delta, Zhanjiang, and the surrounding regions presented the highest climate discomfort degree, but the CCI deterioration rate of these regions was relatively lower than that of the other regions. Hence, the regional heterogeneity of discomfort degree in summer in Guangdong Province tends to be narrowed, but the comprehensive discomfort degree would prominently grow.
Long-term discomfort weather or climate presents a certain accumulation effect and serves as one of the important influencing factors related to disease occurrence and social-economic development [49,50,51]. For example, high temperatures and high humidity exert critical impacts on respiratory and cardiovascular diseases, according to medical reports and related research [52,53,54]. A case study regarding the health impact of temperature in Guangzhou and Zhuhai suggested that high temperatures lead to a decreasing of life expectancy of residents [55]. Climate warming in Guangzhou, in the future, will further reduce residents’ life expectancy, excluding the changes of future populations and their adaptive capacities, while improvements of residents’ regulatory and adaptive capacities could resist the influence of climate deterioration to a significant extent in the future [56]. Studies of population health in the Greater Bay Area revealed that the daily average temperature threshold could increase the risk of death for residents; for example, heatwaves seriously degrade residents’ life quality, leading to a worsening of diseases or even result in death. Therefore, researching the occurrence and development of climate discomfort and regional diseases is of high significance. To improve the health conditions and climate comfortable level of regional residents, corresponding measures must be taken as soon as possible to halt the momentum of the rapid deterioration of the CCI, particularly in summer and in areas with increased population exposure, such as Pearl River Delta, and eastern Guangdong province. In this study, the temporal-spatial changes of population exposure to climate discomfort in summer in Guangdong Province were preliminarily investigated to improve our understanding of regional CCI deterioration trends, expand the knowledge of the climate impact on humans, and provide a scientific basis for the responding countermeasures.
5. Conclusions
In this paper, the temporal-spatial distribution characteristics of the climate comfort index (CCI) and the population exposure under the background of climate variations and population aggregation were explored based on daily meteorological records monitored from 86 ground stations from 1969 to 2018, and the population archives of Guangdong Province since 1990. The results clearly demonstrated that:
- (1)
- The comfortability of climate was on a decreasing trend in Guangdong Province over the last 50 years, due to the growing tendency of the heat and humidity. Hot and relatively hot days showed significant growth, with a rate of 0.73 day/10 year and 0.64 day/10 year, respectively. Temperature–humidity index (THI), wind effect index (WEI), and climate comfortable index (CCI) prominently increased, while the index of clothes loading (ICL) constantly decreased.
- (2)
- Summer was the most uncomfortable season, with only four comfortable days and 47% of days rated at the uncomfortable level. The comfortability in autumn was lower than that of spring, while winter was the most comfortable season.
- (3)
- The high population exposure to summer discomfort was mainly concentrated in the Pearl River Delta and Eastern Guangdong, with significant expansion in exposure area and population. Specifically, the core city of Guangdong-Hongkong-Macao Great Area, like Shenzhen, Dongguan, and Foshan, presented an exposure growth rate exceeding one million people/10 year.
The dramatic increase in population exposure in the Pearl River Delta and eastern Guangdong brings higher environmental and health risks to the local residents. With continuous urbanization and accelerating climate warming, the local CCI will steadily deteriorate. More accurate simulations and predictions of the CCI, as well as its impact on human activity, needs to be implemented, based on interdisciplinary advantages, including public health, medicine, meteorological science, urban planning, architecture design, and other disciplines. The research will provide scientific and technological support for national and local climate adaption, help to improve the risk management level and public health response of the government, so as to promote the construction of climate-adaptive cities and the implementation of a health agenda stemmed from the Sustainable Development Goals (SDGs2030).
Author Contributions
Conceptualization, S.S.; methodology, Z.Y.; investigation, S.S. and R.Z.; data preparation, Z.Y. and R.Z.; validation, Z.Y. and R.Z.; draft writing, Z.Y.; review and revise, S.S. supervisor, S.S. All authors have read and agreed to the published version of the manuscript.
Funding
This research was funded by Guangdong Province Universities and Colleges Pearl River Scholar Funded Scheme (2019), the Natural Science Foundation of Guangdong Province (2020A1515011065), and Key Special Project for Introduced Talents Team of Southern Marine Science and Engineering Guangdong Laboratory (Guangzhou) (GML2019ZD0301).
Data Availability Statement
All the data are from Guangdong Meteorological Bureau.
Acknowledgments
Thanks to the editors and the anonymous reviewers, who have made great suggestions helping the improvement of this manuscript.
Conflicts of Interest
The authors declare no conflict of interest.
References
- Feng, L.; Liu, Y.; Feng, Z.; Yang, S. Analysing the Spatiotemporal Characteristics of Climate Comfort in China Based on 2005–2018 MODIS Data. Theor. Appl. Climatol. 2021, 143, 1235–1249. [Google Scholar] [CrossRef]
- Fischer, E.M.; Sippel, S.; Knutti, R. Increasing Probability of Record-Shattering Climate Extremes. Nat. Clim. Chang. 2021, 11, 689–695. [Google Scholar] [CrossRef]
- Thiery, W.; Lange, S.; Rogelj, J.; Schleussner, C.-F.; Gudmundsson, L.; Seneviratne, S.I.; Andrijevic, M.; Frieler, K.; Emanuel, K.; Geiger, T.; et al. Intergenerational Inequities in Exposure to Climate Extremes. Science 2021, 374, 158–160. [Google Scholar] [CrossRef] [PubMed]
- Batibeniz, F.; Ashfaq, M.; Diffenbaugh, N.S.; Key, K.; Evans, K.J.; Turuncoglu, U.U.; Önol, B. Doubling of U.S. Population Exposure to Climate Extremes by 2050. Earth Future 2020, 8, e2019EF001421. [Google Scholar] [CrossRef] [Green Version]
- Forzieri, G.; Bianchi, A.; Silva, F.B.E.; Marin Herrera, M.A.; Leblois, A.; Lavalle, C.; Aerts, J.C.J.H.; Feyen, L. Escalating Impacts of Climate Extremes on Critical Infrastructures in Europe. Glob. Environ. Chang. 2018, 48, 97–107. [Google Scholar] [CrossRef]
- Hong, C.; Zhang, Q.; Zhang, Y.; Davis, S.J.; Tong, D.; Zheng, Y.; Liu, Z.; Guan, D.; He, K.; Schellnhuber, H.J. Impacts of Climate Change on Future Air Quality and Human Health in China. Proc. Natl. Acad. Sci. USA 2019, 116, 17193–17200. [Google Scholar] [CrossRef] [Green Version]
- Zhou, J.-Q.; Huang, W.; Zhu, Y.; Li, M.; Zhou, B.-T. Climate Comfort Distribution, Change and Projection in Yunnan Province. Adv. Clim. Chang. Res. 2018, 14, 144. [Google Scholar] [CrossRef]
- Odnoletkova, N.; Patzek, T.W. Data-Driven Analysis of Climate Change in Saudi Arabia: Trends in Temperature Extremes and Human Comfort Indicators. J. Appl. Meteorol. Climatol. 2021, 60, 1055–1070. [Google Scholar] [CrossRef]
- Aminipouri, M.; Rayner, D.; Lindberg, F.; Thorsson, S.; Knudby, A.J.; Zickfeld, K.; Middel, A.; Krayenhoff, E.S. Urban Tree Planting to Maintain Outdoor Thermal Comfort under Climate Change: The Case of Vancouver’s Local Climate Zones. Build. Environ. 2019, 158, 226–236. [Google Scholar] [CrossRef]
- Dino, I.G.; Meral Akgül, C. Impact of Climate Change on the Existing Residential Building Stock in Turkey: An Analysis on Energy Use, Greenhouse Gas Emissions and Occupant Comfort. Renew. Energy 2019, 141, 828–846. [Google Scholar] [CrossRef]
- Summa, S.; Tarabelli, L.; Ulpiani, G.; Di Perna, C. Impact of Climate Change on the Energy and Comfort Performance of NZEB: A Case Study in Italy. Climate 2020, 8, 125. [Google Scholar] [CrossRef]
- Cheung, C.S.C.; Hart, M.A. Climate Change and Thermal Comfort in Hong Kong. Int. J. Biometeorol. 2014, 58, 137–148. [Google Scholar] [CrossRef] [PubMed]
- Blazejczyk, K.; Epstein, Y.; Jendritzky, G.; Staiger, H.; Tinz, B. Comparison of UTCI to Selected Thermal Indices. Int. J. Biometeorol. 2012, 56, 515–535. [Google Scholar] [CrossRef] [PubMed] [Green Version]
- Ma, L.; Sun, G. Evaluation of climate comfort index for tourism hot-spot cities in west China. Arid. Land Geogr. 2009, 32, 791–797. [Google Scholar]
- Barbosa, R.; Vicente, R.; Santos, R. Climate Change and Thermal Comfort in Southern Europe Housing: A Case Study from Lisbon. Build. Environ. 2015, 92, 440–451. [Google Scholar] [CrossRef]
- Kramer, R.; van Schijndel, J.; Schellen, H. Dynamic Setpoint Control for Museum Indoor Climate Conditioning Integrating Collection and Comfort Requirements: Development and Energy Impact for Europe. Build. Environ. 2017, 118, 14–31. [Google Scholar] [CrossRef]
- Potchter, O.; Cohen, P.; Lin, T.P.; Matzarakis, A. Outdoor Human Thermal Perception in Various Climates: A Comprehensive Review of Approaches, Methods and Quantification. Sci. Total Environ. 2018, 631, 390–406. [Google Scholar] [CrossRef]
- Sun, M.S.; Li, S. Empirical Indices Evaluating Climate Comfortableness: Review and Prospect. Tour. Trib. 2015, 30, 19–34. [Google Scholar] [CrossRef]
- Malchaire, J. Human thermal environments: The effects of hot, moderate and cold environments on human health—Comfort and performance: The principles and the practice. Saf. Sci. 2003, 18, 67–68. [Google Scholar] [CrossRef]
- Houghten, F.C.; Yaglou, C.P. Determining Lines of Equal Comfort. ASHVE Trans. 1923, 29, 163–176. [Google Scholar]
- Yaglou, C.P. Control of heat casualties at military training centers. AMA Arch. Ind. Health 1957, 16, 302–316. [Google Scholar] [PubMed]
- Thom, E.C. The Discomfort Index. Weatherwise 1959, 12, 57–60. [Google Scholar] [CrossRef]
- Thom, H. A New Concept for Cooling Degree Days. Air Cond. Heat. Vent. 1957, 54, 73–80. [Google Scholar]
- Siple, P. Measurement of Dry Atmospheric Cooling in Subfreezing Temperatures. Proc. Am. Philos. Soc. 1945, 89, 177–199. [Google Scholar] [CrossRef]
- Yan, Y.C.; Yue, S.P.; Liu, X.H.; Wang, D.D.; Chen, H. Advances in Assessment of Bioclimatic Comfort Conditions at Home and Abroad. Adv. Earth Sci. 2013, 28, 1119. [Google Scholar] [CrossRef]
- Terjung, W.H. Physiologic Climates of the Conterminous United States: A Bioclimatic Classification Based on Man. Ann. Assoc. Am. Geogr. 2015, 56, 141–179. [Google Scholar] [CrossRef]
- Tout, D.G. The Discomfort Index, Mortality and the London Summers of 1976 and 1978. Int. J. Biometeorol. 1980, 24, 323–328. [Google Scholar] [CrossRef] [PubMed]
- Kyle, W.J. The Human Bioclimatic of Hong Kong. Contemp. Climatol. 1994, 345–350. [Google Scholar]
- Ma, L.J.; Sun, G.N.; Li, F.L.; Wang, B.Z. Evaluation of Tourism Climate Comfortableness in Shaanxi Province. Resour. Sci. 2007, 29, 40–44. [Google Scholar] [CrossRef]
- Gonzalez, R.R.; Nishi, Y.; Gagge, A.P. Experimental Evaluation of Standard Effective Temperature a New Biometeorological Index of Man’s Thermal Discomfort. Int. J. Biometeorol. 1974, 18, 1–15. [Google Scholar] [CrossRef]
- Steadman, R.G. Indices of Windchill of Clothed Persons. J. Appl. Meteorol. 2010, 10, 674–683. [Google Scholar] [CrossRef]
- Auliciems, A.; Freitas, C. Cold Stress in Canada. A Human Climatic Classification. Int. J. Biometeorol. 1976, 20, 287–294. [Google Scholar] [CrossRef] [PubMed]
- Ma, L.J.; Sun, G.N.; Ma, Y.R.; Cai, X.F.; Hou, K. Variation of Tourism Climate Comfort Degree in Beijing in the Last 50 Years. J. Arid. Land Resour. Environ. 2011, 25, 164–169. [Google Scholar] [CrossRef] [Green Version]
- Cao, W.H.; Wang, S.X. Evaluation of Climate Suitability for Urban Human Settlement in Beijing-Tianjin-Hebei Region. J. Glaciol. Geocryol. 2017, 39, 8. [Google Scholar] [CrossRef]
- Yu, C.; Sun, Y.L.; Wu, M.X. Spatial and Temporal Characteristics of the Periods of Climate Comfon in the Beijing-Tianjin-Hebei Region from 1966 to 2015. Acta Ecol. Sin. 2019, 39, 16. [Google Scholar] [CrossRef]
- Yu, X.R.; Wang, N.A. Analysis of the Changes in Tourism Climate Comfort in Gansu Province from 1955 to 2015. J. Lanzhou Univ. Nat. Sci. 2021, 57, 8. [Google Scholar] [CrossRef]
- Li, S.; Wang, Z.; Lai, C.; Lin, G. Quantitative Assessment of the Relative Impacts of Climate Change and Human Activity on Flood Susceptibility Based on a Cloud Model. J. Hydrol. 2020, 588, 125051. [Google Scholar] [CrossRef]
- Zhang, X.; Jiang, C.; Sun, J.; Zhou, M. Spatio-Temporal Variation and Influencing Factors of Thermal Comfort at Different Elevations. J. Appl. Ecol. 2018, 29, 2808–2818. [Google Scholar]
- Zhao, J.; Wang, S. Spatio-Temporal Evolution and Prediction of Tourism Comprehensive Climate Comfort in Henan Province, China. Atmosphere 2021, 12, 823. [Google Scholar] [CrossRef]
- Ma, L.; Sun, G.N.; Wang, J.J. Evaluation of Tourism Climate Comfortableness of Coastal Cities in the Eastern China. Prog. Geogr. 2009, 28, 713–722. [Google Scholar] [CrossRef]
- De Freitas, C.R. Human Climates of Northern China. Atmos. Environ. 1979, 13, 71–77. [Google Scholar] [CrossRef]
- Wilson, O. Objective Evaluation of Wind Chill Index by Records of Frostbite in the Antarctica. Int. J. Biometeorol. 1967, 11, 29–32. [Google Scholar] [CrossRef] [PubMed]
- Wu, H.Y.; Zhai, Z.H.; Zhang, Y. Analysis of Climate Change in Guangdong-Hong Kong-Macao Greater Bay Area from 1961 to 2018. Torrential Rain Disasters 2019, 38, 303–310. [Google Scholar] [CrossRef]
- Ding, L.J.; Wang, C.L.; Ling, L.X. Spatial-Temporal Variation Characteristics of Average Temperature in Guangdong. Chin. J. Agrometeorol. 2011, 32, 7. [Google Scholar] [CrossRef]
- Li, S.; Sun, M.S.; Zhang, W.J.; Tan, L.; Zun, N.L.; Wang, W.F. Spatial Patterns and Evolving Characteristics of Climate Comfortable Period in the Mainland of China: 1961–2010. Geogr. Res. 2016, 35, 2053–2070. [Google Scholar] [CrossRef]
- Wang, M.; Zheng, S.; Wang, S.; Shang, K. The Tendency of Spatial-Temporal Changes of Wind Effect Index in Main Capital Cities in China from 1951 to 2008. J. Arid. Land Resour. Environ. 2012, 26, 64–70. [Google Scholar]
- Jin, A.; Zhang, A.; Zhao, X. Estimation of Climate Comfort in Eastern China in the Context of Climate. Acta Sci. Nat. Univ. Pekin. 2019, 55, 165–174. [Google Scholar]
- Deng, L.; Bao, J. Spatial Distribution of Summer Comfortable Climate and Winter Comfortable Climate in China and Their Differences. Geograhpical Res. 2020, 39, 41–52. [Google Scholar]
- Hayes, K.; Blashki, G.; Wiseman, J.; Burke, S.; Reifels, L. Climate Change and Mental Health: Risks, Impacts and Priority Actions. Int. J. Ment. Health Syst. 2018, 12, 28. [Google Scholar] [CrossRef]
- Stechemesser, A.; Wenz, L.; Kotz, M.; Levermann, A. Strong Increase of Racist Tweets Outside of Climate Comfort Zone in Europe. Environ. Res. Lett. 2021, 16, 114001. [Google Scholar] [CrossRef]
- Cetin, M. Climate Comfort Depending on Different Altitudes and Land Use in the Urban Areas in Kahramanmaras City. Air Qual. Atmos. Health 2020, 13, 991–999. [Google Scholar] [CrossRef]
- Luan, G.; Yin, P.; Li, T.; Wang, L.; Zhou, M. The Years of Life Lost on Cardiovascular Disease Attributable to Ambient Temperature in China. Sci. Rep. 2017, 7, 13531. [Google Scholar] [CrossRef] [PubMed] [Green Version]
- Lin, Z.; Meng, X.; Chen, R.; Huang, G.; Ma, X.; Chen, J.; Huang, M.; Huang, M.; Gui, Y.; Chu, C.; et al. Ambient Air Pollution, Temperature and Kawasaki Disease in Shanghai, China. Chemosphere 2017, 186, 817–822. [Google Scholar] [CrossRef] [PubMed]
- Im, E.-S.; Pal, J.S.; Eltahir, E.A.B. Deadly Heat Waves Projected in the Densely Populated Agricultural Regions of South Asia. Sci. Adv. 2017, 3, e1603322. [Google Scholar] [CrossRef] [PubMed] [Green Version]
- Li, Z.; Xu, Y.; Lin, G.; Liu, T.; Lin, H.; Xiao, J.; Zeng, W.; Li, X.; Ma, W. Impact of Air Temperature on Years of Life Lost among Residents in Guangzhou and Zhuhai: A Time-Series Study. Chin. J. Epidemiol. 2015, 36, 720–724. [Google Scholar] [CrossRef]
- Liu, T.; Xiao, J.; Zeng, W.; Li, X.; Li, Z.; Lin, H.; Du, Y.; Xu, X.; Ma, W. Investigation on the Heat Effect of Climate Change on Years of Life Lost in Guangzhou. J. Environ. Hyg. 2018, 8, 393–398. [Google Scholar]
Publisher’s Note: MDPI stays neutral with regard to jurisdictional claims in published maps and institutional affiliations. |
© 2022 by the authors. Licensee MDPI, Basel, Switzerland. This article is an open access article distributed under the terms and conditions of the Creative Commons Attribution (CC BY) license (https://creativecommons.org/licenses/by/4.0/).