1. Introduction
The Great Lakes are a dominant geographical feature of North America and represent the first major change in land surface conditions as surface weather features sweep south and east across the continent from the Arctic. Cold fronts are one such weather feature that commonly affects the Great Lakes region. Cold fronts are baroclinic boundaries, typically strongest at the surface, which, upon passage, are typically associated with cool and dry air advection, and a wind that shifts to have an equatorward component [
1]. Wind speed may increase after frontal passage. The air mass which enters behind many cold fronts forms over a cold, dry surface. This contrasts with the air mass which forms over the Great Lakes, which may be relatively warm and moist in the cool season and relatively cool in the warm season. Given the large difference in air mass characteristics, there is potential for large and unusual changes in sensible weather when a cold front removes a marine layer and replaces it with continental air. Of the Great Lakes, Lake Superior is the largest and deepest, and has cold, open water year-round in most years. Lake Superior is also the first Great Lake encountered by many cold fronts as they move south and east. Despite this, prior studies have not identified the typical effects of cold fronts on sensible weather conditions around Lake Superior. It is the broad goal of this study to assess sensible cold front effects near Lake Superior, with a special focus on coastal areas dominated by the marine boundary layer. The focus is on the North Shore of Lake Superior, with inland sites used as a control, since this is the first portion of the Great Lakes region to be affected by cold fronts moving from the north and west.
No comprehensive climatology of cold frontal passages has been published for the vicinity of Lake Superior. An early climatology of surface baroclinic boundaries over North America [
2] noted a 0000 UTC maximum over Michigan in spring and summer, which the authors attributed to the influence of Lake Superior’s cold water, relative to the warmer temperatures over land. They noted that this effect is largest over the Upper Peninsula of Michigan. Little effect was noted in fall, while in winter, a 1200 UTC maximum in baroclinic zone occurrence was present over Michigan. Though this was not discussed by the authors, we speculate it may be related to the Great Lakes warming their surroundings overnight when the surrounding land is colder. The first global frontal climatology [
3], which used 850 hPa wet bulb potential temperature to delineate fronts, did not examine North America in high resolution but did indicate that the Lake Superior region experiences cold fronts throughout the year, but especially in autumn. Most salient to the understanding of frontal passage characteristics in this region is [
4], in which the authors developed a machine learning approach using several meteorological variables (temperature, moisture, wind) to identify fronts. Over a 40-year period (1979–2018), they found that cold fronts are most frequent near Lake Superior in winter, when ~12–14% of time steps from their reanalysis dataset had a cold front. Cold fronts were also somewhat common in autumn (~8–10% of time steps had a cold front), and relatively uncommon in winter (~6–8% of time steps had a cold front). The authors also found that cold fronts have become slightly less common near Lake Superior during summer and fall and slightly more common in winter and spring, though these results were not significant [
4].
The Great Lakes affect cold frontal motion. For example, a study which examined a cold front moving over Lake Michigan in March indicated that stronger low-level convergence over the lake led to frontogenesis and an increasing temperature gradient, resulting in frontal acceleration [
5]. These effects were attributed primarily to reduced turbulence and friction over the lake, meaning that such effects are most likely when the lake is colder than the surrounding land [
5].
As indicated by the results of [
5], the Great Lakes may strongly influence the characteristics of the overlying boundary layer (BL) through fluxes of heat and moisture, and through reduced turbulence and friction. In [
6], the authors examined latent and sensible heat fluxes from Lake Ontario during an October cold frontal passage, and found a 15-fold increase in latent heat flux after the frontal passage compared to before (due to increased evaporation) and a slight increase in sensible heat flux. Effects included moistening and warming of the post-frontal air mass, and cooling of the lake surface temperature [
6]. In contrast, in a January case when Lake Michigan was markedly warmer than surrounding land, ref. [
7] found a slowing of the cold front over the lake, resulting in a strong increase in latent and sensible heat fluxes to the cold air mass.
Given their large fluxes of heat and moisture to the BL, the Great Lakes are known to have a large influence on the climate of their surroundings. A comprehensive observational study of how the Great Lakes influence regional temperature, precipitation, cloud cover, vapor pressure, and wind speed was carried out by [
8]. They found that Lake Superior has the largest influence on its surrounding climate. Typical effects include downwind precipitation increases in winter and decreases in summer, warmer minimum temperatures during all seasons, and reductions in maximum temperature during spring and summer [
8]. Along the North Shore of Lake Superior, ref. [
8] indicated a 3–4 °C increase in wintertime minimum temperature, a 1–2 °C warming of wintertime high temperature, and a summertime high temperature reduction of up to 4 °C along northern portions of the North Shore. Vapor pressure decreases in summer and increases in winter were also noted. A similar numerical study [
9] indicated generally similar results. Ref. [
9] also showed large latent and sensible heat fluxes produced by the Great Lakes, large basin-wide changes in the evaporation and precipitation budgets, and statistically robust changes to the strength of synoptic-scale low and high pressure systems. Specifically, cold-season highs and warm-season lows were weakened, and cold-season lows and warm-season highs were strengthened [
9], likely due to regional stability changes near the Great Lakes.
More recent observational work along the southern shore of Lake Superior adds important considerations to the understanding of how large lakes influence surrounding weather [
10]. This study found (i) that lakeshore-perpendicular winds can bring lake influence relatively far inland while lakeshore-parallel winds may be associated with little lake influence even along the shoreline; (ii) lake influence on temperature is largest in summer; and (iii) topographic features, such as inland mountains, may strongly limit the inland extent of lake-influenced air [
10].
Here, we focus specifically on the influence of cold fronts along and near Minnesota’s North Shore, an area where lake influence is often strong near the lakeshore. In this area, generally southerly flow ahead of a cold front brings lake-influenced air inland, which is then replaced by post-cold front air during frontal passage. This sharp changing of air masses can present forecasting challenges and atypical events, such as warming after cold frontal passage, and may potentially influence how hazards, such as fire weather, are manifested [
11]. Thus, our goals in this study are, for the region along and near Minnesota’s North Shore, to (i) present typical post-cold front changes to temperature, moisture and wind characteristics; and (ii) examine the influence of season and time of day in determining the effects of cold frontal passage. The findings will be discussed in the context of regional forecasting challenges.
2. Data and Methods
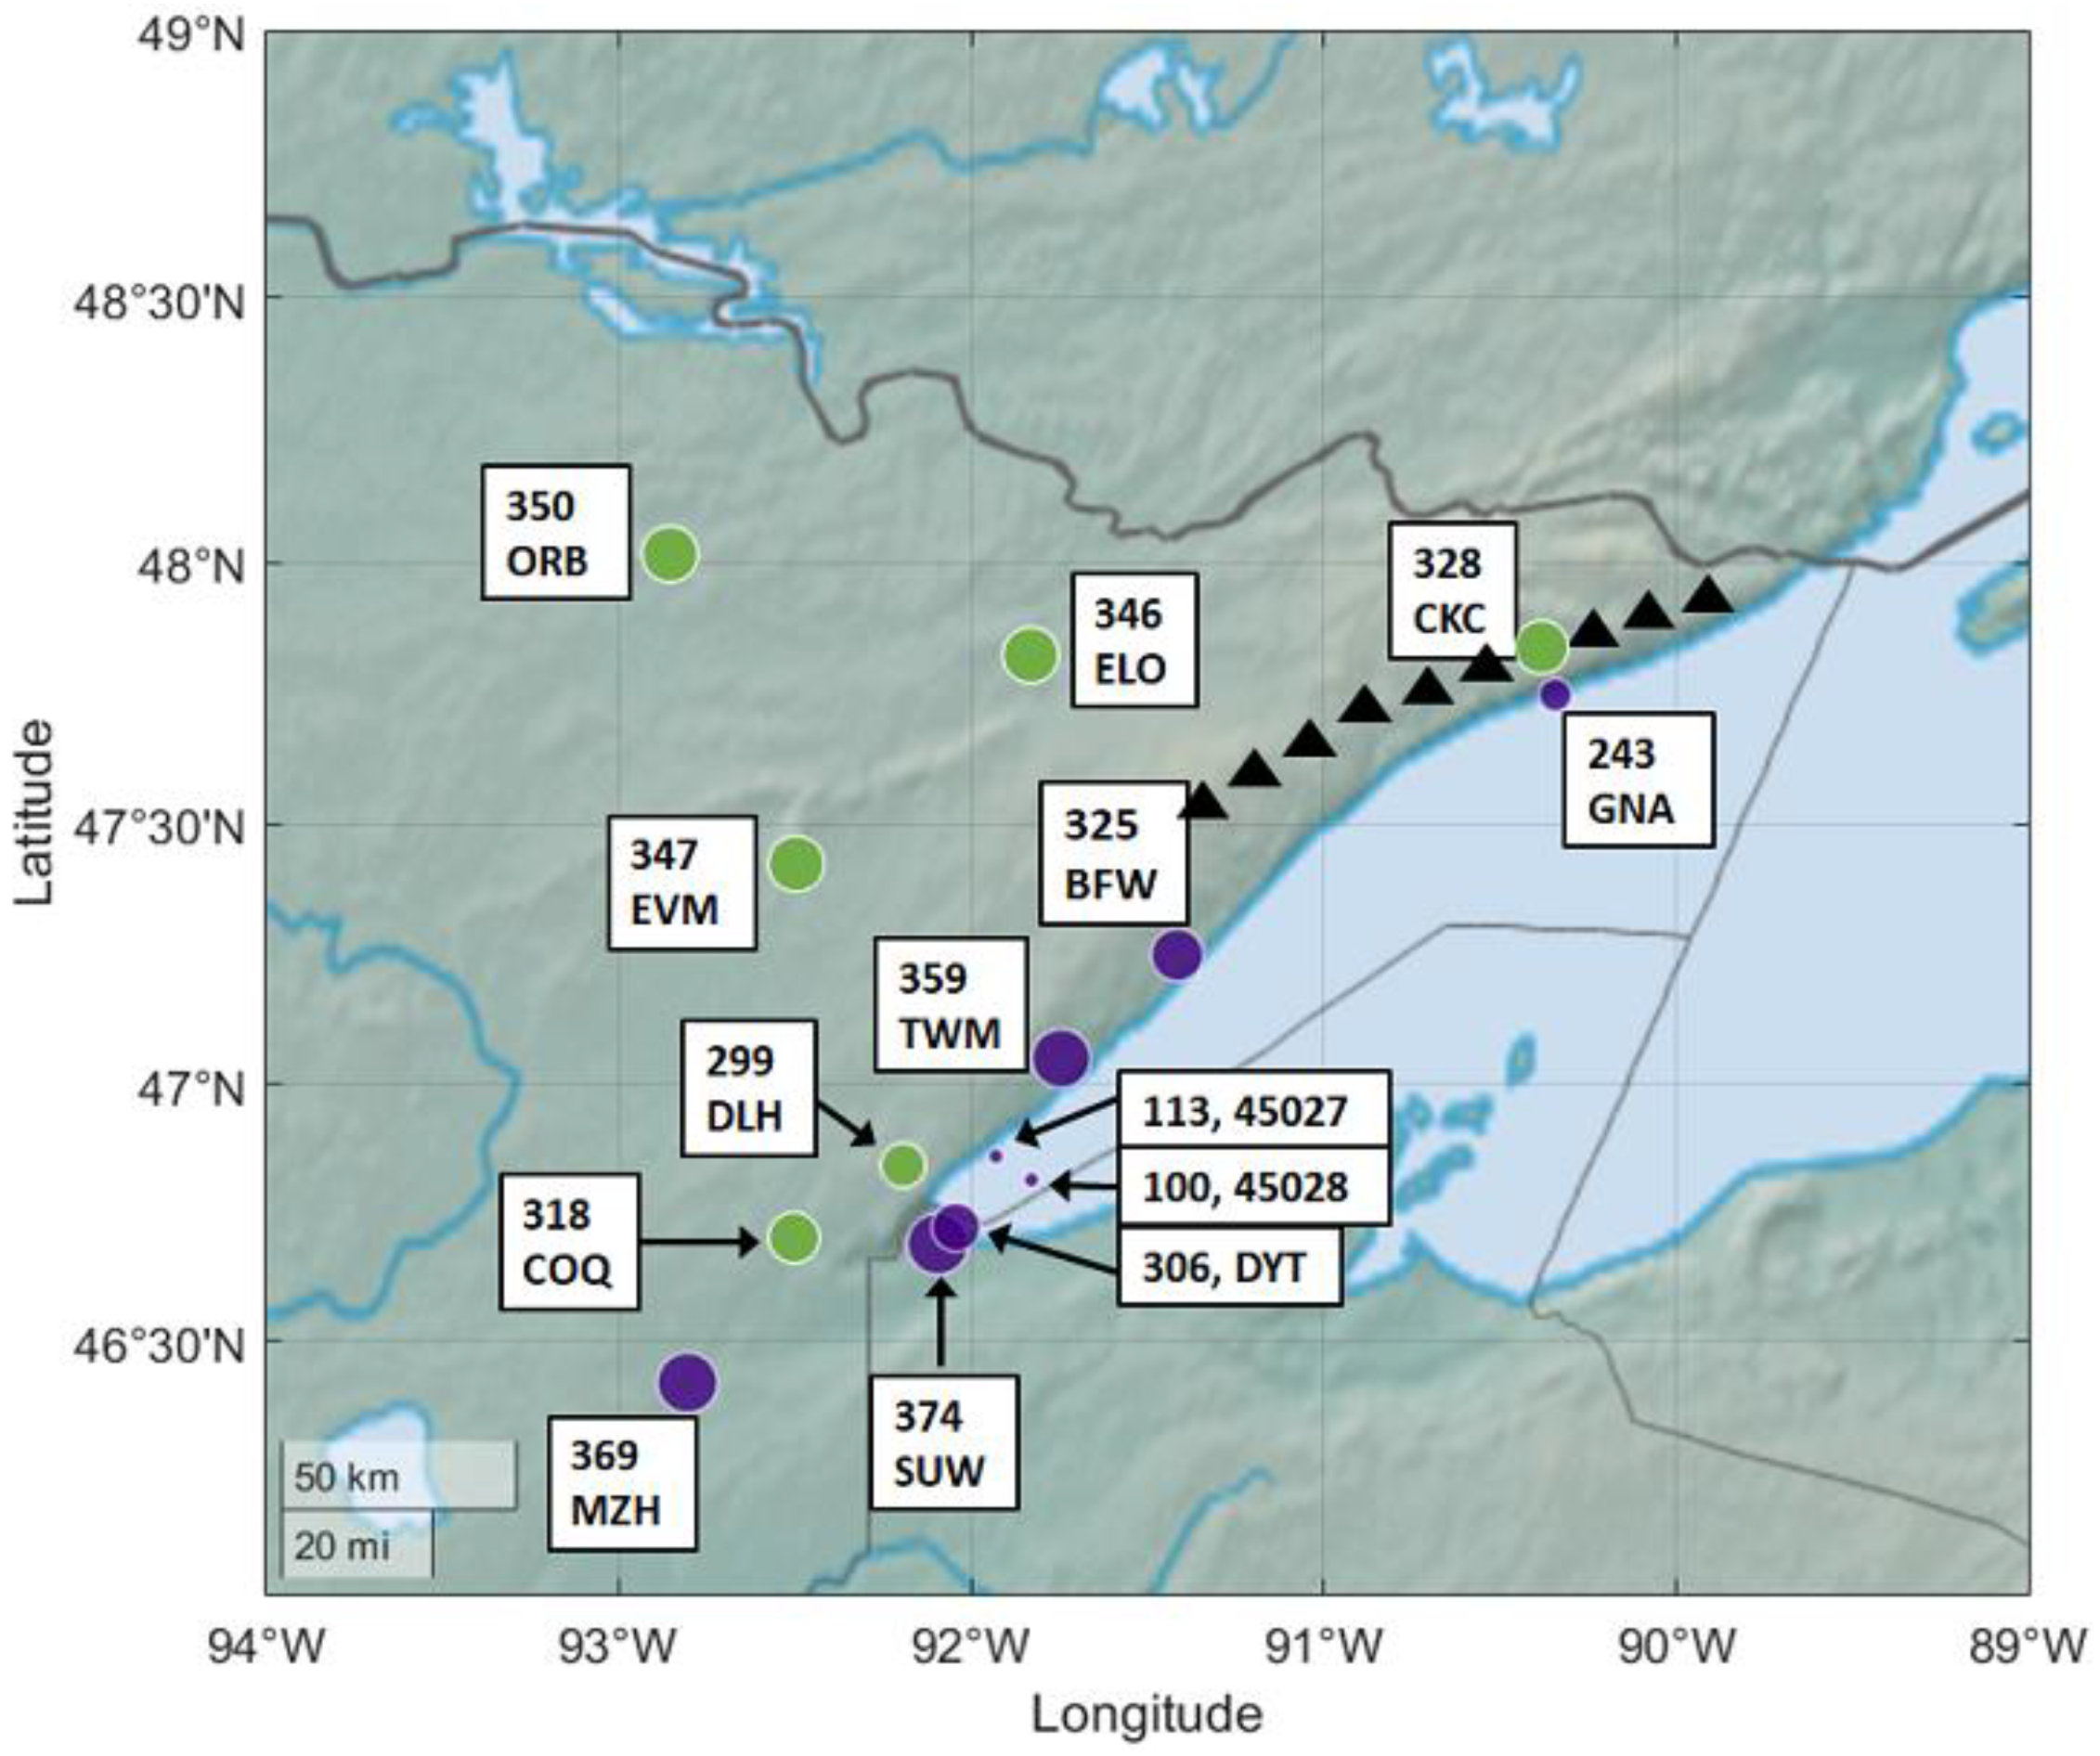
The study area (
Figure 1) is the Arrowhead region of northeastern Minnesota, including the North Shore of Lake Superior from the Canadian border to the southwest tip of Lake Superior. Inland stations at which no influence from Lake Superior is expected have been included to serve as controls. Note that MZH (Moose Lake, MN, USA), some distance southwest of the southwestern tip of Lake Superior (
Figure 1), occasionally experiences substantial lake influence because of the arrangement of surrounding hills. The North Shore of Lake Superior is relatively low in the south near Duluth (DLH), rising gradually into volcanic hills north of Two Harbors (TWM). Farther north are the rugged Sawtooth Mountains (black triangles in
Figure 1), which approach the lakeshore around Grand Marais (CKC/GNA). Thus, the lake-influenced air mass is likely to remain relatively close to the lakeshore from TWM northward, and especially in the vicinity of GNA.
Data were used from 12 Automated Surface Observing System (ASOS) stations around Lake Superior and two buoys on the southwestern lobe of the lake. The locations of these stations are indicated on
Figure 1 (stations indicated as blue dots are likely to experience lake influence and those indicated by green dots are not), and additional details about these stations are provided in
Table 1. Pairs of nearby sites allow comparison between a coastal and inland location (DLH/DYT and CKC/GNA). Of these, the latter is in the Sawtooth Mountains, resulting in a 363 m altitude difference between the coastal and inland sites despite being only ~10.5 km apart. Several locations were near the shore but a non-negligible distance above the lake (TWM, 145 m; KBFW, 151 m), so the degree of lake influence at these sites is uncertain.
Possible cold front events were initially identified from archived surface analyses provided by the Weather Prediction Center (
https://www.wpc.ncep.noaa.gov/archives/web_pages/sfc/sfc_archive.php (accessed on 5 July 2018)). Possible cold fronts were collected from 1 January 2010 to 5 July 2018 (~8.5 years). For fronts to be included in this analysis, they were required to meet several criteria, as follows:
- (i)
In the surface analyses examined, the front had to fully pass the North Shore from DLH to the Canadian border (while allowing for possible brief periods when the front was stationary).
- (ii)
In the surface analyses, the front was required to either be classified as a cold front the entire time, or to transition from an occluded front to a cold front while over the North Shore.
- (iii)
An acceptable boundary could also be identified as a trough axis but then become a cold front over the North Shore. In this case, the surface wind shift must also be consistent with a cold front.
Once these criteria had been applied, the remaining frontal features were checked for continuity through a deeper layer; this additional check helps ensure that true synoptic-scale fronts are being identified rather than surface-only wind shifts [
12]. To be retained at this step, frontal features were required to be associated with a 925 hPa temperature gradient and 925 hPa cold air advection as the surface frontal feature was passing through. Finally, if two cold frontal features satisfying all the preceding conditions passed through within 24 h, only the first was retained, since conditions preceding the second are strongly influenced by the initial cold frontal passage. This procedure resulted in the identification of 634 cold front events that were then analyzed in this study, or about 55 events per year.
For each of the 634 cold fronts identified, the ASOS/buoy raw data (typical temporal resolution ~20 min) from the stations listed above (
Table 1;
Figure 1) were manually examined to identify the time of frontal passage. For this purpose, the time of frontal passage was defined in one of two ways corresponding to different frontal behaviors, as follows:
- (i)
For fronts which were marked by a sharp shift in wind direction, the time of frontal passage was the time of the marked wind direction shift to a more westerly or northerly component, even if that wind shift did not result in a northerly wind direction (e.g., 270–360° or 0–90°). In this case, the wind shift was required to occur over 1 h or less and be the only such short-duration cyclonic shift of this nature in the surrounding 24 h.
- (ii)
For fronts which were marked by a gradual wind shift to a northerly component, the wind was required to steadily become more northerly, and the time of frontal passage was taken as the first time when the wind direction exceeded 270° (e.g., a northerly component was present).
Many of the 634 frontal events did not survive these criteria at each individual ASOS or buoy station (note that in
Figure 1 the highest number of cold frontal passages was 374 at SUW). Retained events represent deep, synoptic-scale events associated with cold air advection and a defined surface reflection. Once the time was determined for each frontal passage, the mean value of temperature (°C), dewpoint (°C), relative humidity (%), wind direction (degrees, where 0° or 360° represents due north) and wind speed (m s
−1) were recorded in the 4 h prior to and 4 h after frontal passage. The difference between these (value after minus value prior) was the change, or ‘delta’, value of that variable across frontal passage.
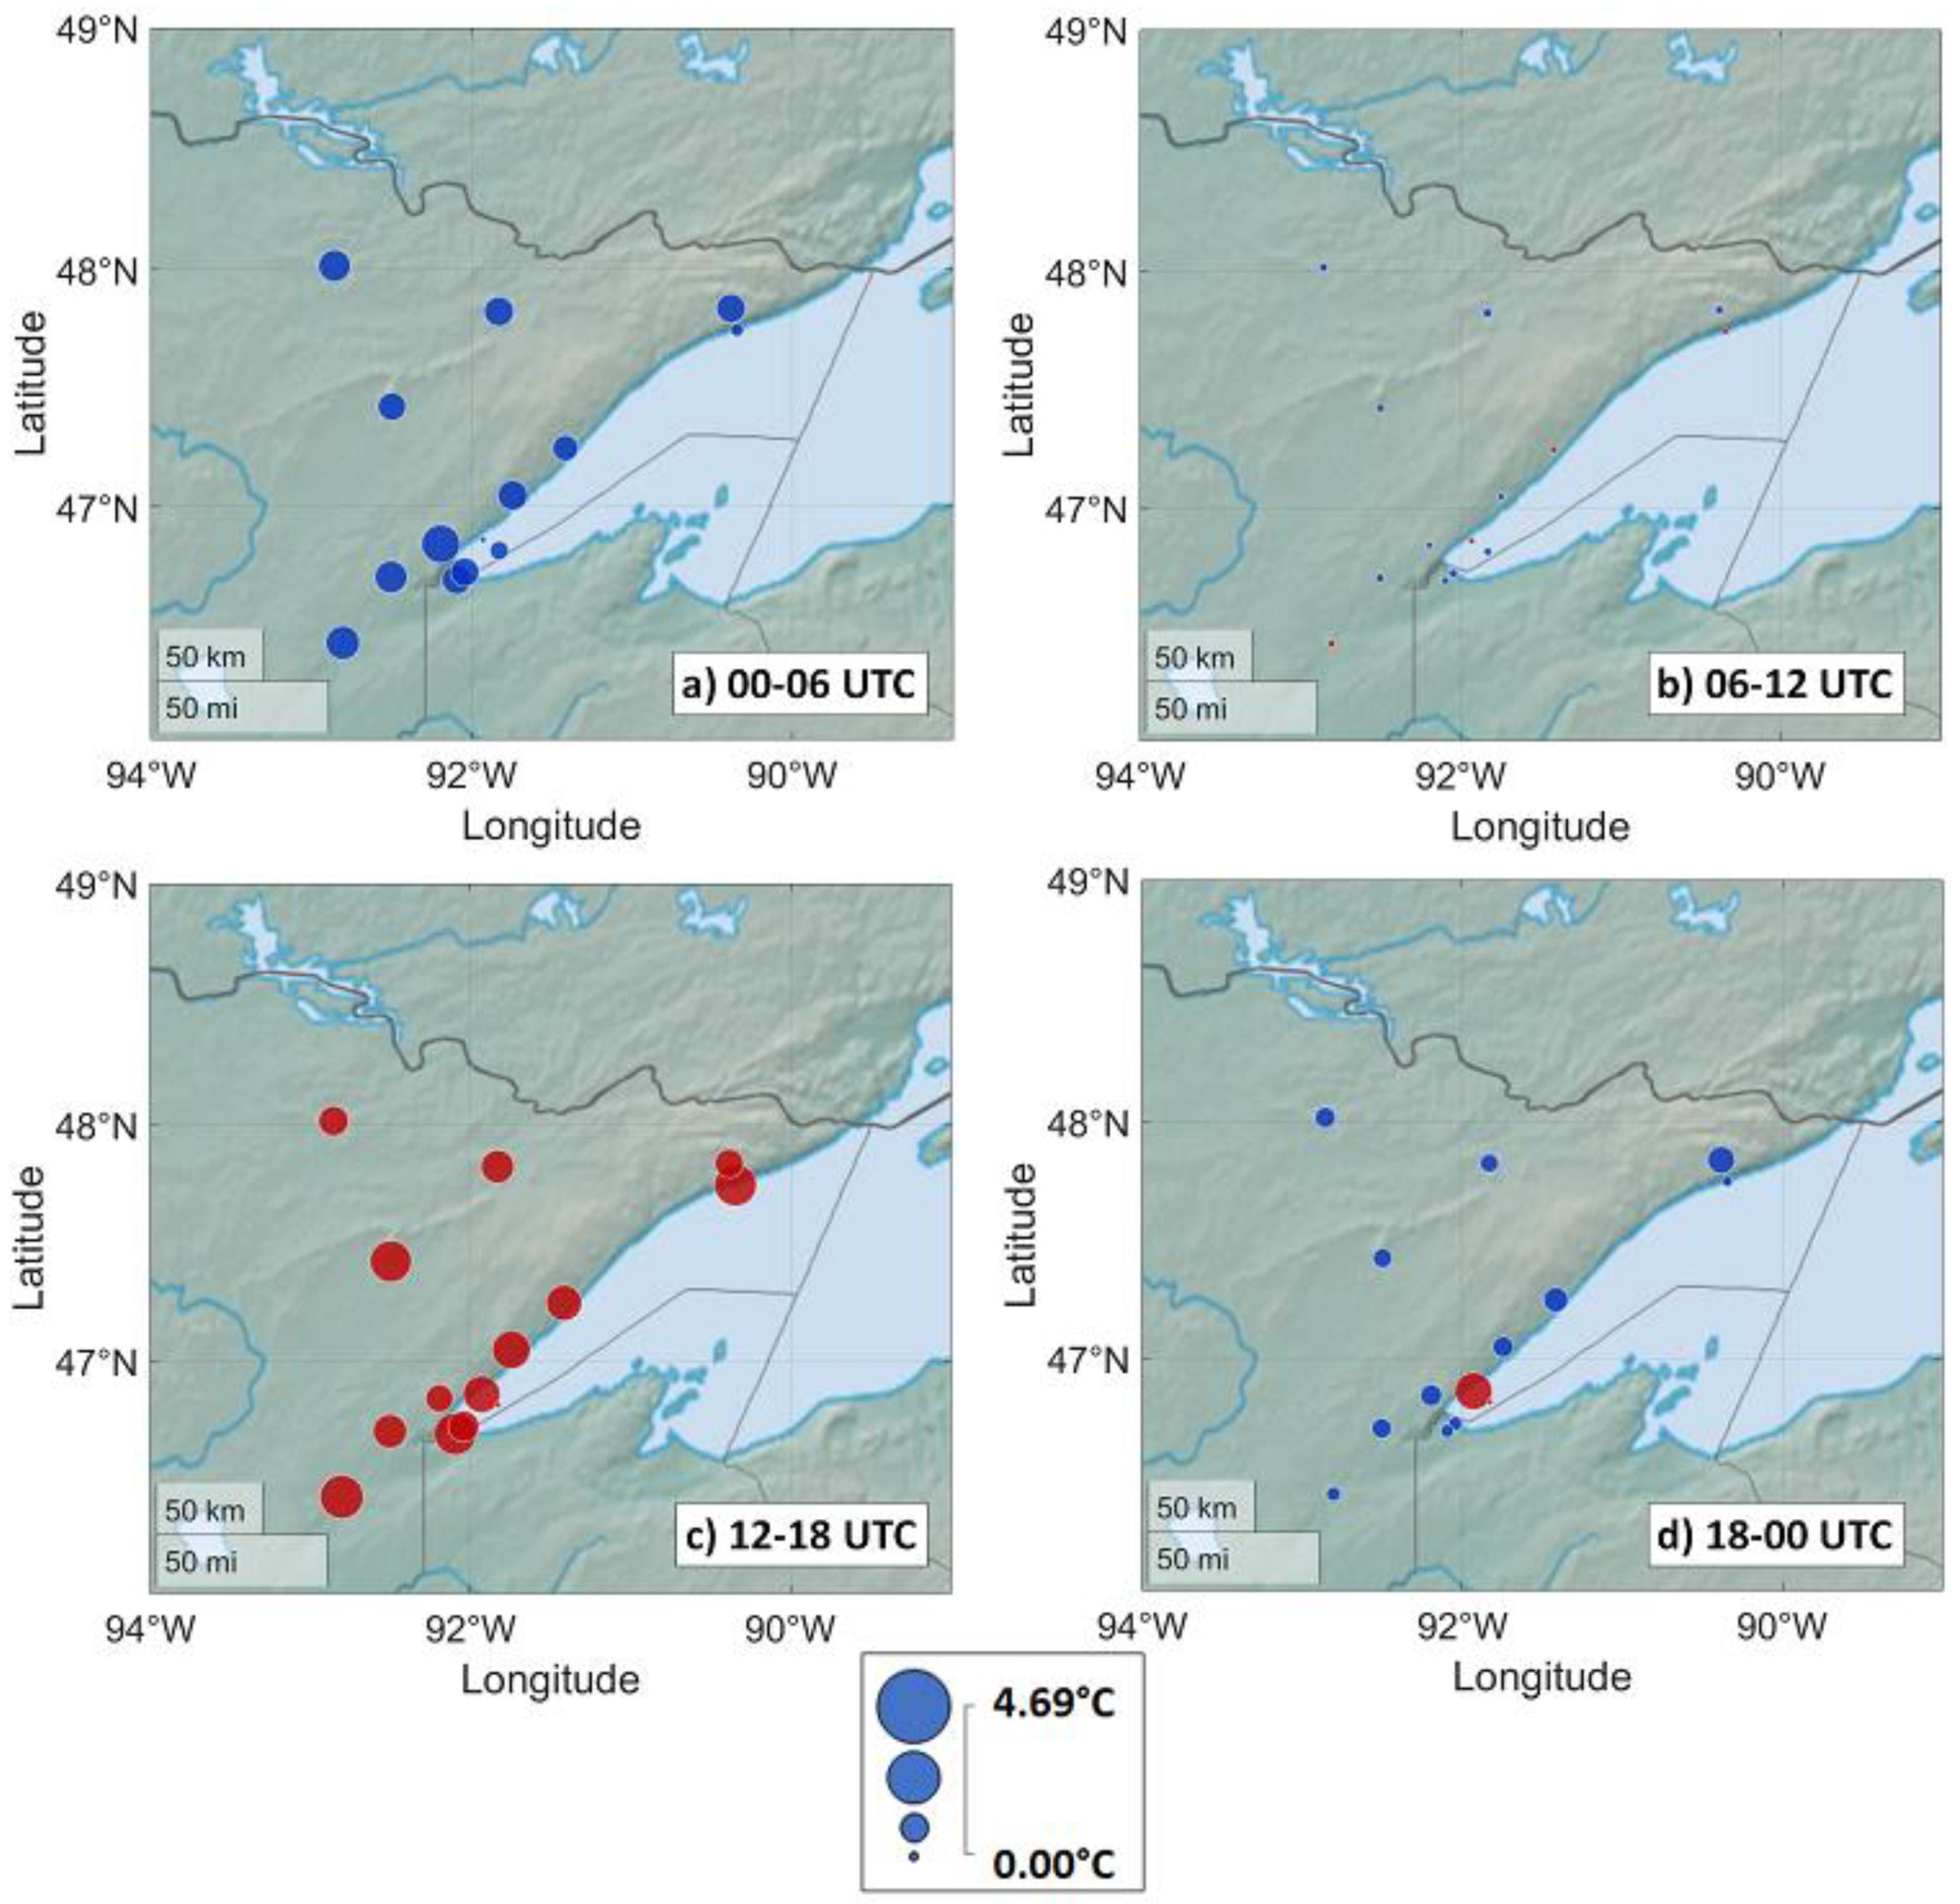
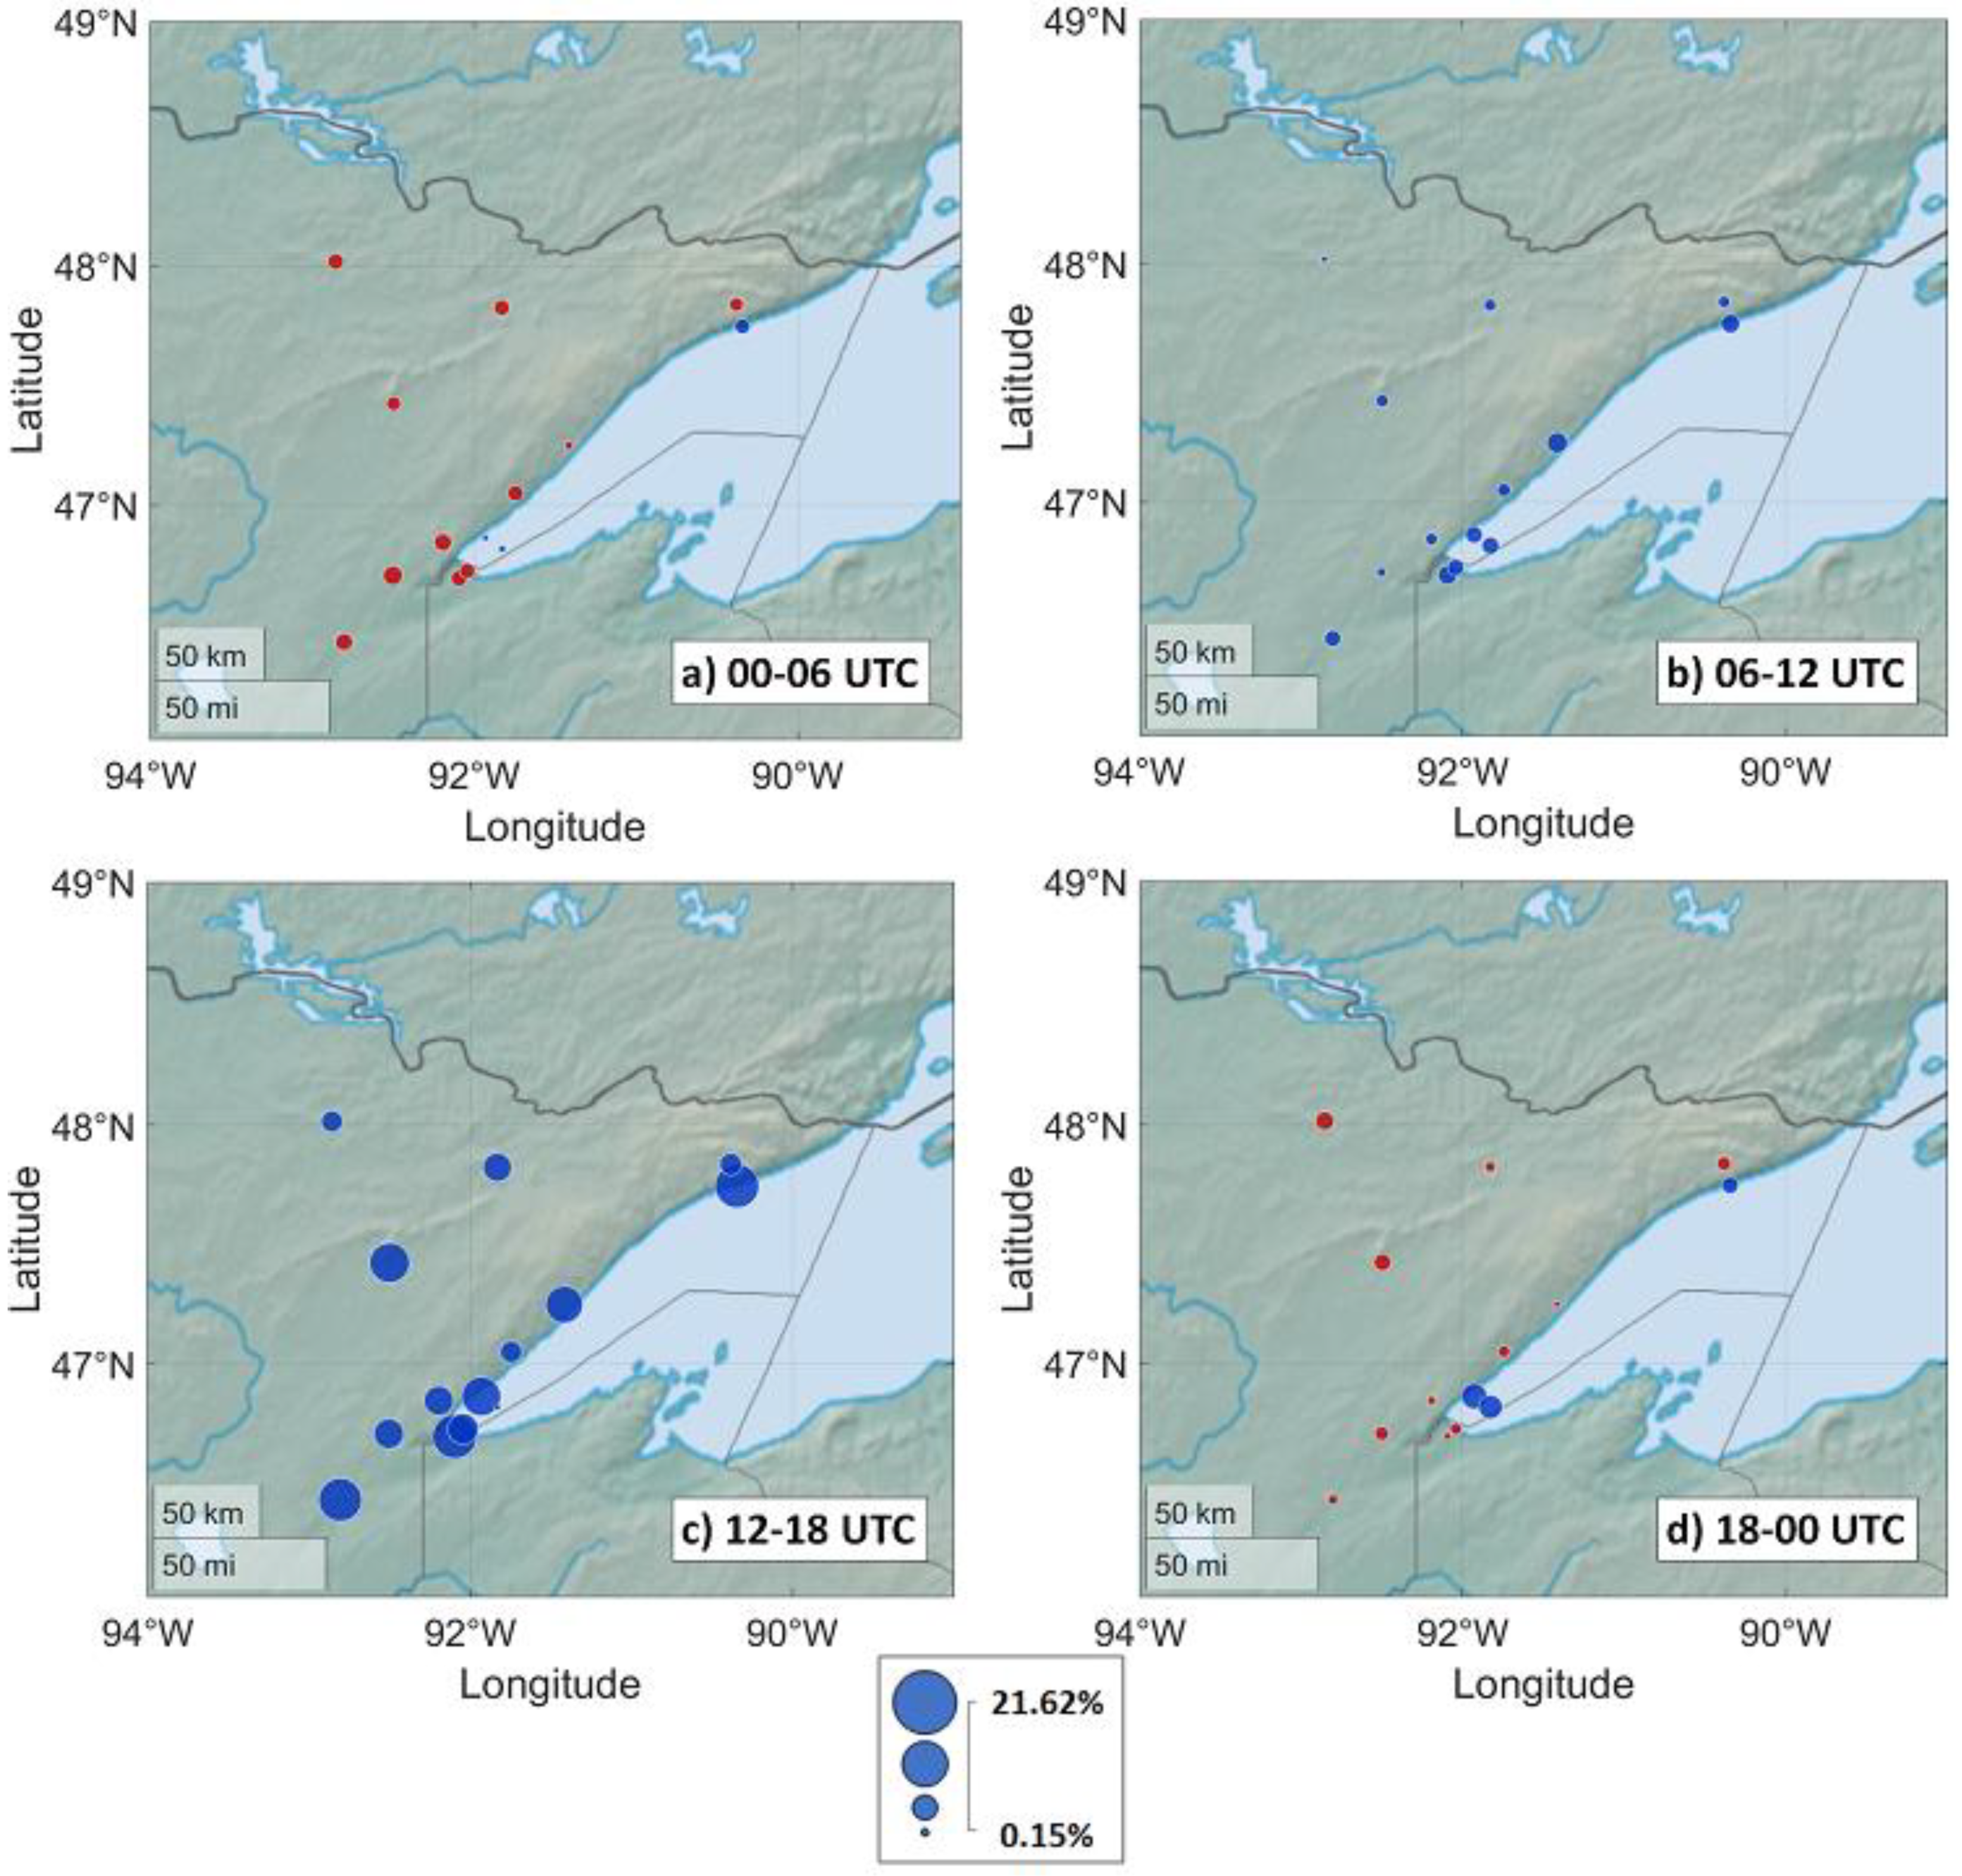
Cold fronts were separated by season (spring = March–May; summer = June–August; fall = September–November; winter = December–February) and by time of day (early night = 00–06 UTC; late night = 06–12 UTC; morning = 12–18 UTC; afternoon = 18–00 UTC). For each of these categories, mean delta was calculated for each of the meteorological variables at each station. These values were plotted on a map as bubbles that are size scaled to the magnitude of the mean delta value. A Wilcoxon signed-rank test was used to determine whether the delta values were systematically greater or less than zero (indicating that a repeatable frontal effect exists); a p-value < 0.01 was required to indicate significance at the 1% level.
Time series of the percentage of Lake Superior covered by ice were obtained from the Great Lakes Environmental Research Laboratory (
https://www.glerl.noaa.gov/data/ice/#historical (accessed on 27 April 2018)). An average seasonal ice cover was calculated as the average of every day’s ice cover from 1 January–15 May. This average ranged from 1.99% (2012) to 66.76% (2014). Two years had mean ice cover > 25% (2014, and 2015 at 43.38%), while four years had mean ice cover < 5% (2010 at 4.74%, 2012, 2016 at 4.08%, and 2017 at 4.24%).
3. Results
The findings are presented here for typical cold frontal passage effects in the vicinity of Lake Superior’s North Shore, and then cold front effects are examined in more detail by season and time of day. For context, typical diurnal and seasonal temperature ranges are first examined. Here, two inland sites (KORB and KCOQ) and two coastal sites (KCKC and KSUW) were selected. Their average high and low temperatures were recorded for January (winter), May (spring) and July (summer) from 2000–2021. Then, the average high and low were determined for the inland and coastal sites for each season, and the difference (mean diurnal temperature range) was calculated;
Table 2 summarizes the results. The diurnal temperature range was much larger at inland sites in all seasons, while the difference in range between coastal and inland sites was largest in spring. This is consistent with the expectation that the water–land temperature difference should be greatest from spring to early summer, and generally consistent with [
10], who found the largest lake influence in summer for a location on the south shore of Lake Superior. The largest factors responsible for the larger inland temperature range were warmer inland high temperatures in spring and summer< and warmer coastal high temperatures in winter, consistent with [
8].
3.1. Bulk Climatology of Cold Frontal Effects
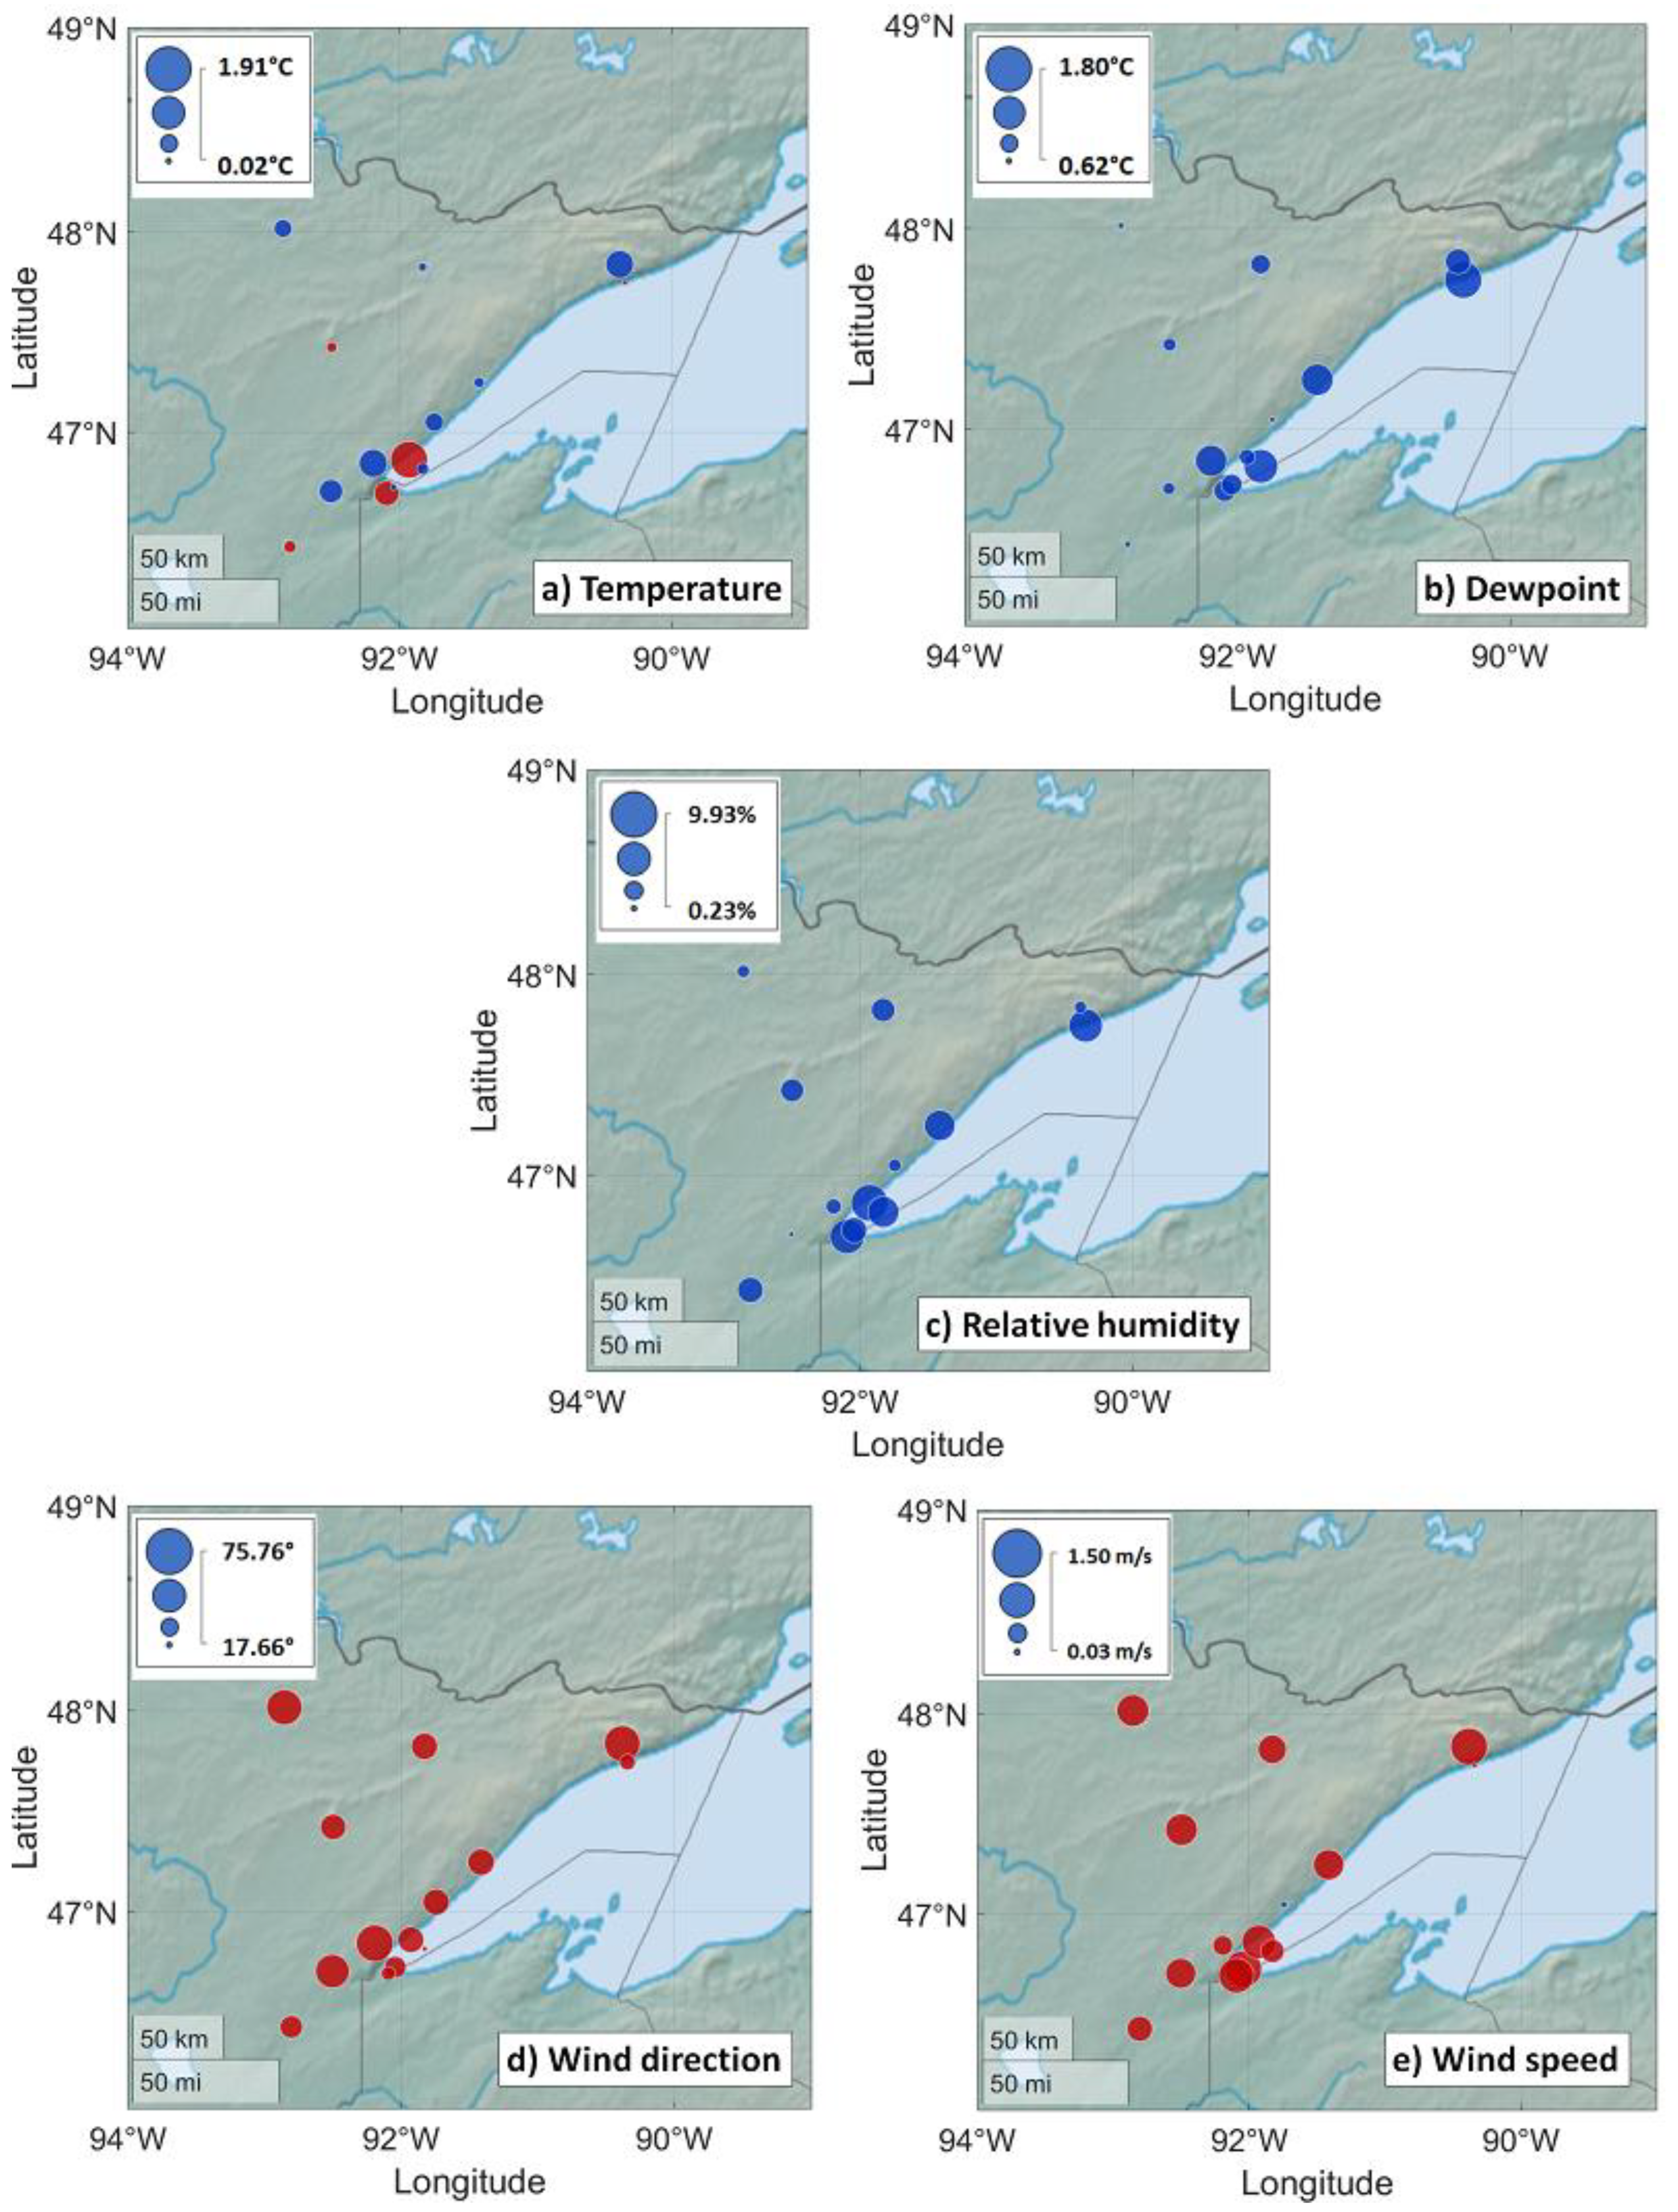
First, data from all 634 cold fronts were examined without regard for season or time of day. Following the typical patterns seen with cold frontal passages, it was hypothesized that cooling and drying would be observed, along with strengthening wind and a wind shift to the northwest. Numerical results and statistical significance for this analysis are presented in
Table 3. Cooling was observed at most inland sites, though warming was observed at five sites (
Table 3)—four of these are substantially influenced by Lake Superior (GNA, SUW, MZH, and 45027;
Figure 2a). Drying was observed at all sites, as hypothesized (
Figure 2b;
Table 3). The drying was substantial enough to result in relative humidity decreases at all sites, even those with falling temperature (
Figure 2c). Winds turned more northwesterly and strengthened, as hypothesized (
Figure 2d,e;
Table 3), except at TWM where a slight wind speed decrease was noted.
3.2. Seasonality of Cold Front Effects
It was hypothesized that cold fronts would affect the region near Lake Superior differently as a function of season. Specifically, it was hypothesized that:
- (i)
Sites that are strongly influenced by a marine air mass will experience warming after cold frontal passage in the spring and summer as the lake air mass is replaced by a warmer inland air mass. In fall and winter, cooling is hypothesized at these sites since the lake air mass is no longer cold relative to the land.
- (ii)
Dewpoint changes will be less seasonally dependent than temperature, since the post-frontal air mass is likely to almost always be drier than the lake air mass.
- (iii)
Wind speed and direction changes will be more pronounced in spring and summer since the lake is cold and therefore lake breezes are common in these seasons [
13]. Along the North Shore a lake breeze would generally have an easterly wind component, which would be expected to reverse during the passage of a sufficiently strong cold front.
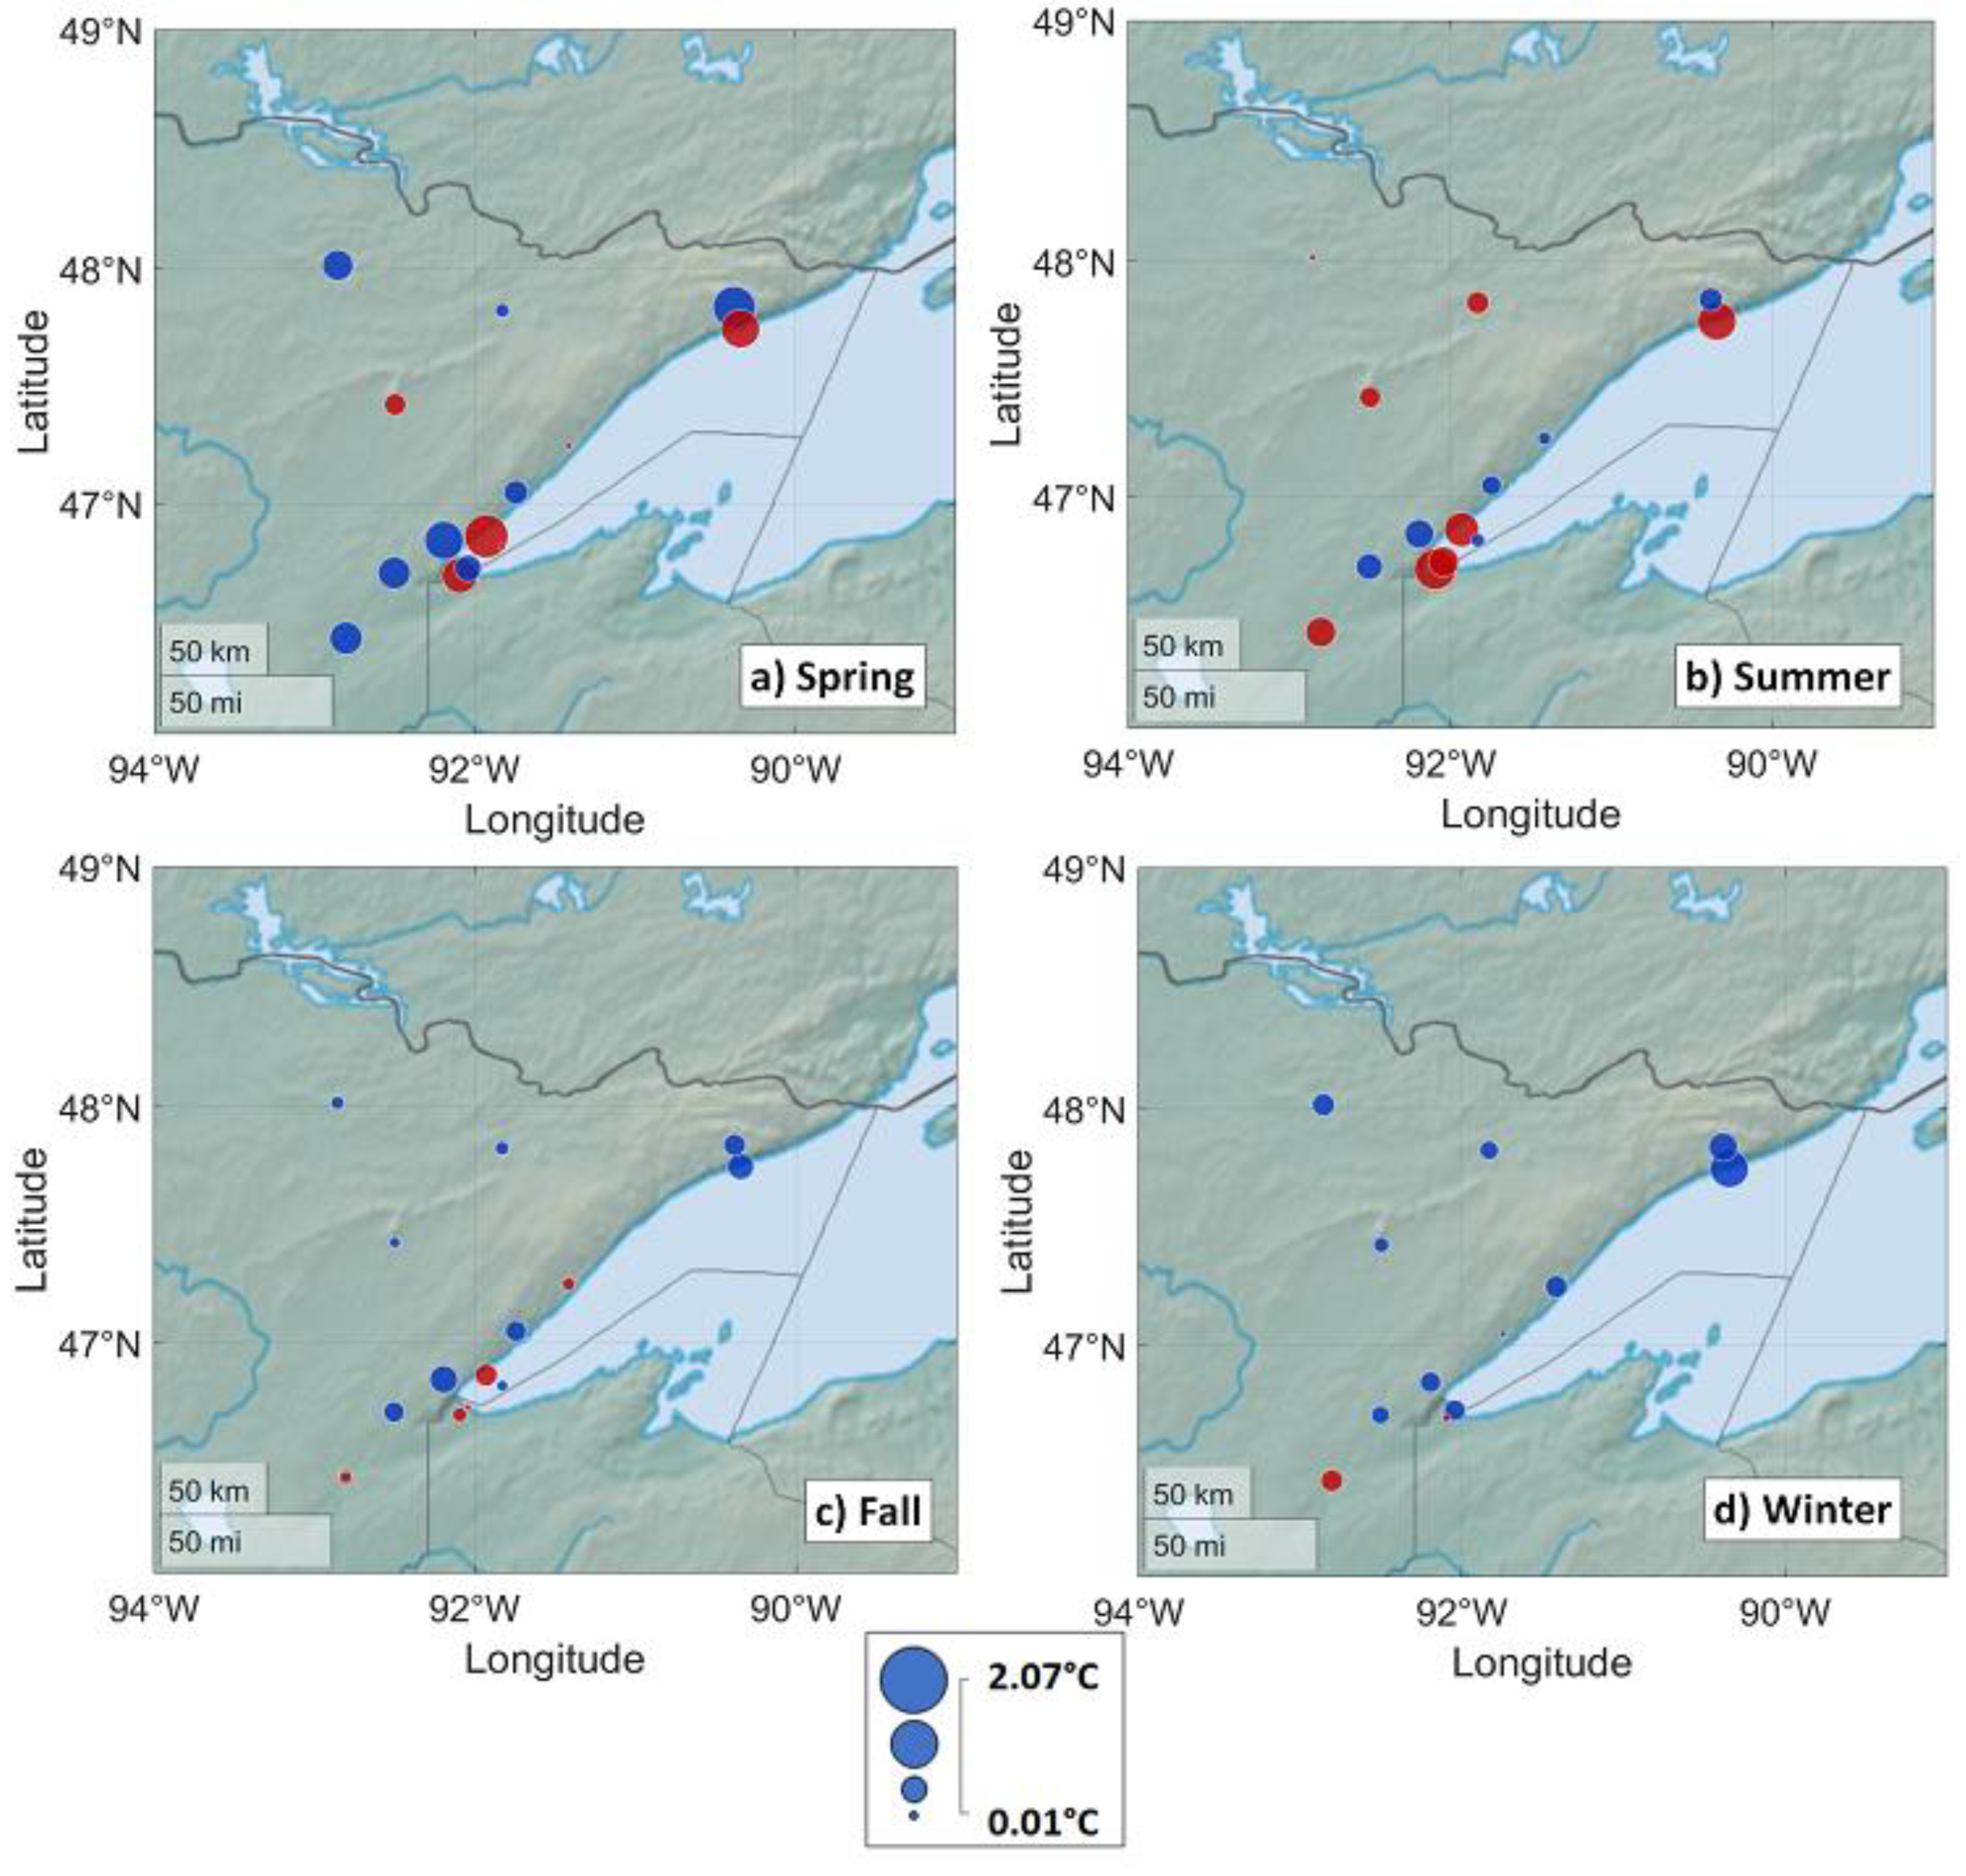
Spring and summer temperatures did warm as hypothesized at most lake sites, even when the corresponding inland site experienced cooling (
Figure 3a,b). In summer a larger number of inland sites experienced warming, but the largest magnitude of warming was experienced near the lake (
Figure 3b). The warming effect near the lake was strongly reduced in the fall (
Figure 3c) and absent in winter (
Figure 3d), confirming the hypothesis that near-lake warming is most likely when the lake is cold relative to surrounding land. Substantial drying occurred in most seasons, though in spring a few sites experienced moistening with cold frontal passages (
Table 4). This may result from the very cold lake waters, which serve as an upper limit to the local dewpoint. The combined effect of spring/summer warming and replacement of the lake air mass by a typically drier inland air mass was to markedly reduce relative humidity at stations near the lake, in all seasons (
Figure 4;
Table 4). Wind speed became stronger and direction more northwesterly in all seasons (
Table 5), though strong evidence was not found in support of the hypothesis that changes would be largest in spring and summer.
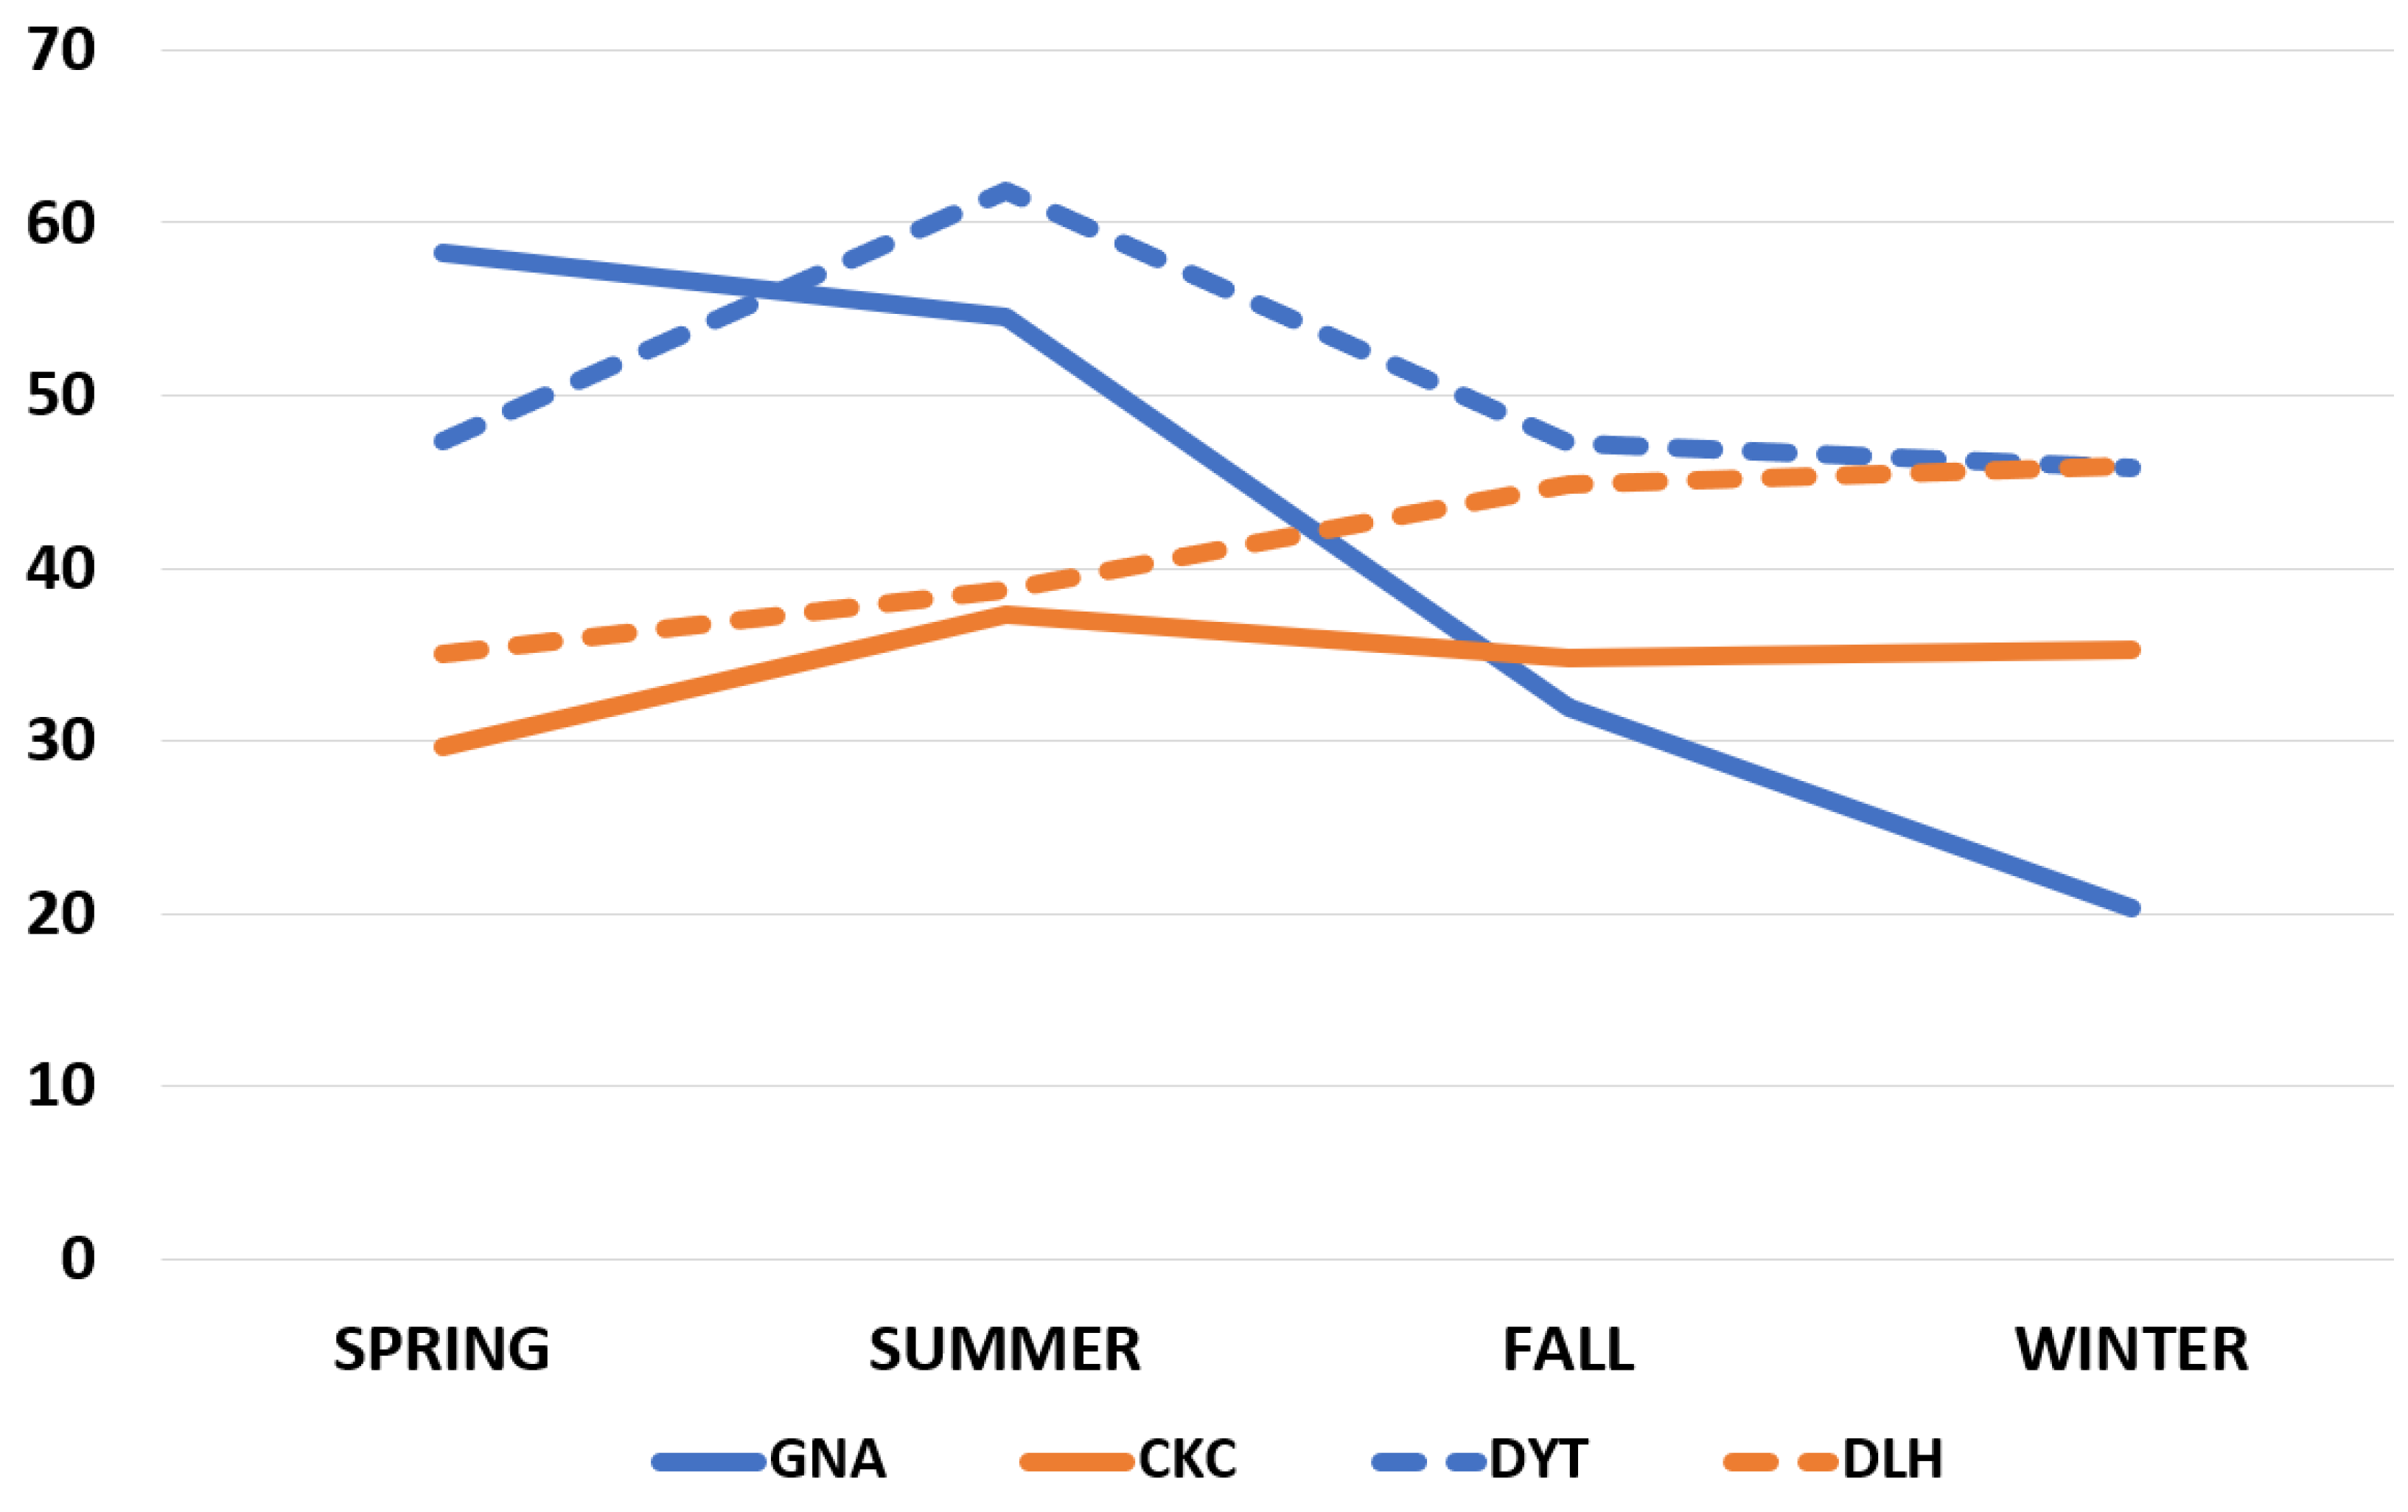
For a different perspective which is expected to yield the same result, the percentage of cold fronts associated with warming was also calculated for two lake-influenced/inland site pairs (GNA/CKC and DYT/DLH). As above, it is hypothesized that a larger percentage of frontal events will be associated with warming at coastal sites in spring and summer. This analysis also reduces any diurnal bias resulting from cold fronts coming through during different times of day. Results indicate that coastal sites (blue lines in
Figure 5) have more post-frontal warming events in spring and summer, while the percentages of warming events in fall and winter become more comparable for adjacent sites (pairs of dashed and bold lines in
Figure 5). Percentage of fronts associated with warming seasonally changes approximately in parallel for the inland sites (orange lines in
Figure 5) and separately for the coastal sites (blue lines in
Figure 5).
3.3. Diurnal Differences in Cold Front Effects
It is also anticipated that cold front effects will be dependent on time of day, since weather changes produced by fronts temporally overlap diurnal weather changes brought about partially by the higher specific heat of water compared to land. Specifically, it is hypothesized that:
- (i)
Cold fronts in the early and late night (00–06 UTC and 06–12 UTC) will be associated with stronger cooling, and cold fronts in the morning and afternoon (12–18 UTC and 18–00 UTC) will be associated with lesser cooling and possibly warming. Warming is possible since diurnal heating could overwhelm the effects of cold air advection, especially over land. Overnight cold fronts could produce warming, especially if they produce an increase in wind speed and subsequent increase in low-level mixing (e.g., as reported by [
14] and references therein).
- (ii)
Relative humidity, which typically decreases after cold frontal passage, will decrease by an especially large amount during the daytime due to the added effect of diurnal warming.
- (iii)
Wind speed and direction changes may be especially large with overnight cold fronts, since the background synoptic-scale wind often decreases overnight, but note that decreased vertical mixing at night may somewhat offset this effect.
In summary, it is anticipated that overnight cold fronts will generally be associated with larger sensible weather changes.
Post-frontal temperature changes generally followed the diurnal cycle, with post-frontal warming during the day and post-frontal cooling at night (
Figure 6;
Table 6). Cooling was typically less pronounced (or warming more pronounced) at coastal sites at all times of day except morning (
Figure 6; smaller bubbles are typically near the coast), likely because the lake-influenced boundary layer was cooler compared to the surrounding land on average.
Relative humidity showed strong diurnal changes and influence of Lake Superior (
Figure 7;
Table 6). While typical diurnal trends were observed (increasing [decreasing] values during the evening/early overnight [morning]), relative humidity values decreased at sites strongly influenced by Lake Superior regardless of time of day (
Figure 7). This is attributed to the removal of the lake air mass by a cold front, and to preferential warming during cold frontal passages.
Finally, it was hypothesized that wind speed and direction changes would be especially large for overnight cold fronts. Wind direction changes were generally smallest during the late overnight hours (06–12 UTC), though little evidence was found for the repeatably strongest wind directional changes at night (
Table 7). Wind speed increases were generally largest in the morning (12–18 UTC) and smallest in the afternoon/evening (18–00 UTC), possibly reflecting the typical diurnal progression of increasing wind speeds during the morning as mixing increases, and decreasing wind speeds into the evening as mixing decreases.
4. Discussion
Considering these results in the context of value for local forecasters, it was found that cold fronts near Lake Superior often do not lead to the typical changes in meteorological variables expected from cold fronts [
1]. The temperature and relative humidity findings are considered the most important. Though it is ‘common knowledge’ that cold fronts usually cause temperature decreases, this study highlights the importance of features, such as large bodies of water, in challenging this assumption. Near Lake Superior, it was found that ~60% of cold fronts may be associated with post-frontal warming in spring and summer. The best site pair to illustrate this is GNA/CKC, two ASOS stations separated by ~10.5 km. The inland site (CKC) is 363 m higher than the coastal site and out of the influence of the lake air mass. Spring [summer] cold fronts were 97% [46%] more likely to be associated with post-frontal warming at the coastal site compared to the inland site. Similar though less pronounced results were found when DYT/DLH were compared (
Figure 5). These results highlight the importance of knowing lake air mass characteristics prior to cold frontal passage in order to make an accurate forecast of expected temperature change.
The results should also be considered in terms of wildfire hazards. Wildfires are a recurrent and relatively common hazard in northeast Minnesota [
15,
16]. Wildfire behavior is strongly a function of relative humidity [
11,
17] and temperature [
11]. Given the potential removal of a moist lake air mass and the potential introduction of a warmer inland air mass post-front, relative humidity was often observed to decrease substantially at lake-influenced sites. This decrease appears to often be much sharper than at nearby inland locations. A relative humidity decrease combined with possible temperature and wind speed increases means that fire danger is likely to rapidly increase post-front, and this increase in wildfire danger is likely to be larger than at nearby inland sites. These findings indicate the importance of considering near-shore conditions and likely condition changes during cold frontal passage if fire weather is active. This may be especially salient if the region is in drought and the duff layer is climatologically dry [
18].
Many of the typical effects of cold fronts are substantially altered near Lake Superior. This is because fluxes of heat and moisture from the lake help generate a lake-influenced air mass, which may have different characteristics to the air mass present over the surrounding land [
5,
6,
9], consistent with the more frequent occurrence of baroclinic zones near Lake Superior [
2]. In the cool season, the lake-influenced air mass may be warmer and moister. Imagine a year, however, when Lake Superior is mostly covered in ice—in this case, fluxes to the overlying atmosphere are diminished, and one could hypothesize that the lake will have a smaller influence on its surroundings. Specifically, for coastal sites we could expect that wintertime cold fronts in high-ice years will be associated with smaller temperature and dewpoint decreases compared to low-ice years, and that spring/summer cold fronts following high-ice winters will be associated with larger temperature increases. These hypotheses were tested by comparing cold front effects during the 2 years with average ice cover >25% to those during years with average ice cover <5%. The distributions of temperature and dewpoint change were compared between high- and low-ice years using a Wilcoxon rank-sum test. ‘Wintertime fronts’ were defined as occurring in January and February, and ‘spring and summer fronts’ occurred from March through August. These comparisons were made at GNA, a station with a large amount of data and a strong lake influence. No significant differences were found in support of the hypotheses, so the results are not reported here in more detail. Nevertheless, it is possible that wintertime ice cover on Lake Superior may influence the lake surface temperature into the early summer, which may influence the magnitude of differences between the lake and inland air masses and thus the magnitude of changes that occur during cold frontal passages. If such an effect were found, it would have additional implications for temperature and fire weather forecasting in the area where an air mass influenced by Lake Superior can move inland. This example illustrates how different degrees of surface inhomogeneity might lead to different frontal effects. For example, the surface may be relatively homogeneous in winters when Lake Superior is frozen, and in this case, cold front effects may be similar between sites, whether or not they are near the shore.
