Abstract
PM2.5 measurements using a network of lost-cost sensors were conducted during 2017–2019 in the greater area of Patras, Greece. The average PM2.5 concentration in all sites during the study period was 9.4 μg m−3, varying from 6.2 μg m−3 in the background areas to 12.8 μg m−3 at the city center. The site with the peak PM2.5 levels was not located in an area with high traffic density but rather in a square with pedestrian-only zones and a high restaurant density. The highest PM2.5 concentrations were observed during the colder period (November–March) due to high emissions from residential wood burning for heating purposes. The measurements of the sensors were used to estimate the importance of regional and local PM2.5 sources. During the warm period, regional transport dominated, contributing approximately 80–85% of the PM2.5 in the city center; however, during the colder period, the local sources were responsible for approximately half the PM2.5. The network operated reliably during this multiyear study. Such measurements provide, at a very low cost, valuable insights not only about the temporal and spatial variability of PM2.5 in a city but also about its sources, including the role of regional transport.
1. Introduction
Atmospheric pollution affects the natural environment, climate, and human health. Particulate matter (PM) is a significant air pollutant consisting of inorganic and organic components from various anthropogenic and biogenic sources. These particles affect Earth’s energy balance and climate both directly via absorption and scattering of solar radiation and indirectly by acting as cloud condensation nuclei and affecting the cloud albedo and lifetime [1,2]. Several epidemiological studies have shown that exposure to high PM2.5 (particles with diameter less than 2.5 μm) concentrations is associated with adverse health effects [3,4,5,6,7,8,9].
Regulatory PM monitoring stations measure PM2.5 concentration using reference methods and provide accurate measurements to determine if an area is above or below the concentration standard and to facilitate regulatory compliance. These valuable approaches are usually costly (high installation and operational costs) and seriously limit the number of such stations in an urban area or its surrounding areas. These regulatory measurements are accompanied by research campaigns using state-of-the-art instrumentation in usually one or maybe two sites for a limited period of time. Both of these approaches cannot capture the spatial variability of PM2.5 levels in a city and may miss important hot spots. The use of low-cost PM2.5 sensors has been proposed as a complementary approach to fill the gaps and improve the spatiotemporal resolution of sparse regulatory networks [10,11,12,13,14]. Giordano et al. [15] summarized the needs and challenges that should be addressed to characterize the air quality quantitatively with low-cost PM sensors and provided a summary of previous studies. However, questions remain open regarding their data accuracy and reliability as well as their outdoor long-term performance, especially under different meteorological conditions and complex PM emissions sources and corresponding concentration fields.
In this study, we describe the deployment and operation for 3 years of a network of 16 low-cost PM2.5 monitors in a modest-size urban area and its surroundings. Their measurements are analyzed using a series of approaches to estimate the contribution of the various sources to the PM2.5 in the area and to identify the hot spots as well as the periods of high concentration levels. A number of research campaigns characterizing PM2.5 and its sources have taken place during the last decade in single sites in the same urban area, so the conclusions reached from the analysis of just the low-cost sensor network can be evaluated against those of state-of-the-art instruments and techniques. Therefore, our study can investigate the use of such sensor networks for other areas where such previous knowledge is not available. Finally, our work also offers an example of the development of such networks including approaches for the analysis of the corresponding huge data sets.
In the first section, we provide a summary of the results of previous research campaigns and chemical transport modeling studies for the city of Patras. These are helpful for the evaluation of our results using the low-cost sensor network data. We then describe the sensor, its performance evaluation in the same area, and the network. Then, the results of the measurements are analyzed focusing on the spatial and temporal variability of PM2.5 in the study area and the impact of local sources as well as long-range transport.
2. Origins of Fine Particulate Matter in Patras: Results from Previous Studies
Patras is the third largest Greek city and has a population of approximately 250,000 inhabitants. It is a coastal city located in the central western part of the country. Traffic has been historically considered the major air pollution source in this urban area [16,17]. A modest industrial area is located approximately 15 km southwest of the city center. The city has an international port in its southern part that is quite active during the summer months. The port is used mostly by passenger ships rather than cargo ones. Merico et al. [18] reported that the contribution of maritime activities to total PM concentrations in the port is around 3%.
Manousakas et al. [17] used positive matrix factorization (PMF) of elemental PM2.5 composition measurements during 2011 to estimate that secondary sulfate (34%), traffic emissions (34%), biomass burning (11%), shipping (10%), sea salt (11%) and mineral dust (2%) were the major PM2.5 sources in the city center. For a suburban site in Patras, using the same approach, Manousakas et al. [19] found that secondary sulfate (34%), traffic emissions (25%), biomass burning (15%), mineral dust (10%), and sea salt (5%) were the major PM2.5 contributors. Biomass burning for residential heating is the most important organic aerosol source in the area during winter [20]. Agricultural waste burning activities are also frequent, especially from November to February [21,22]. During summer, the contribution of transported particulate pollution is quite high [16]. The area is occasionally affected by dust episodes originating from the Sahara Desert with more intense contribution during fall and spring [23,24,25]
Kostenidou et al. [26], using aerosol mass spectrometer measurements, estimated that the contribution of local traffic was only 10% of the organic aerosol in a suburban site during the summer of 2012. Florou et al. [20], using the same approach, reported that local traffic was responsible for only 10% of the organic aerosol in the southern part of the city during the winter of 2012. These two studies pointed out the unexpected importance of cooking organic aerosol in the city with contributions of around 15% of the organic aerosol. The modeling study of Siouti et al. [27] reported that the highest concentration of cooking organic aerosol is predicted to be in Trion Navarchon Square, to the south of the city center where there is the highest restaurant density.
All these studies have taken place in one or two sites in the city during campaigns that lasted from a few weeks to sporadic measurements during a year. The regulatory network in Patras has two stations in the center of the city measuring the concentrations of the major gas-phase pollutants (O3, ΝO2, SO2, and CO) and PM10 concentrations. There are no regulatory measurements of PM2.5 or PM composition.
3. The Patras Low-Cost PM2.5 Sensor Network
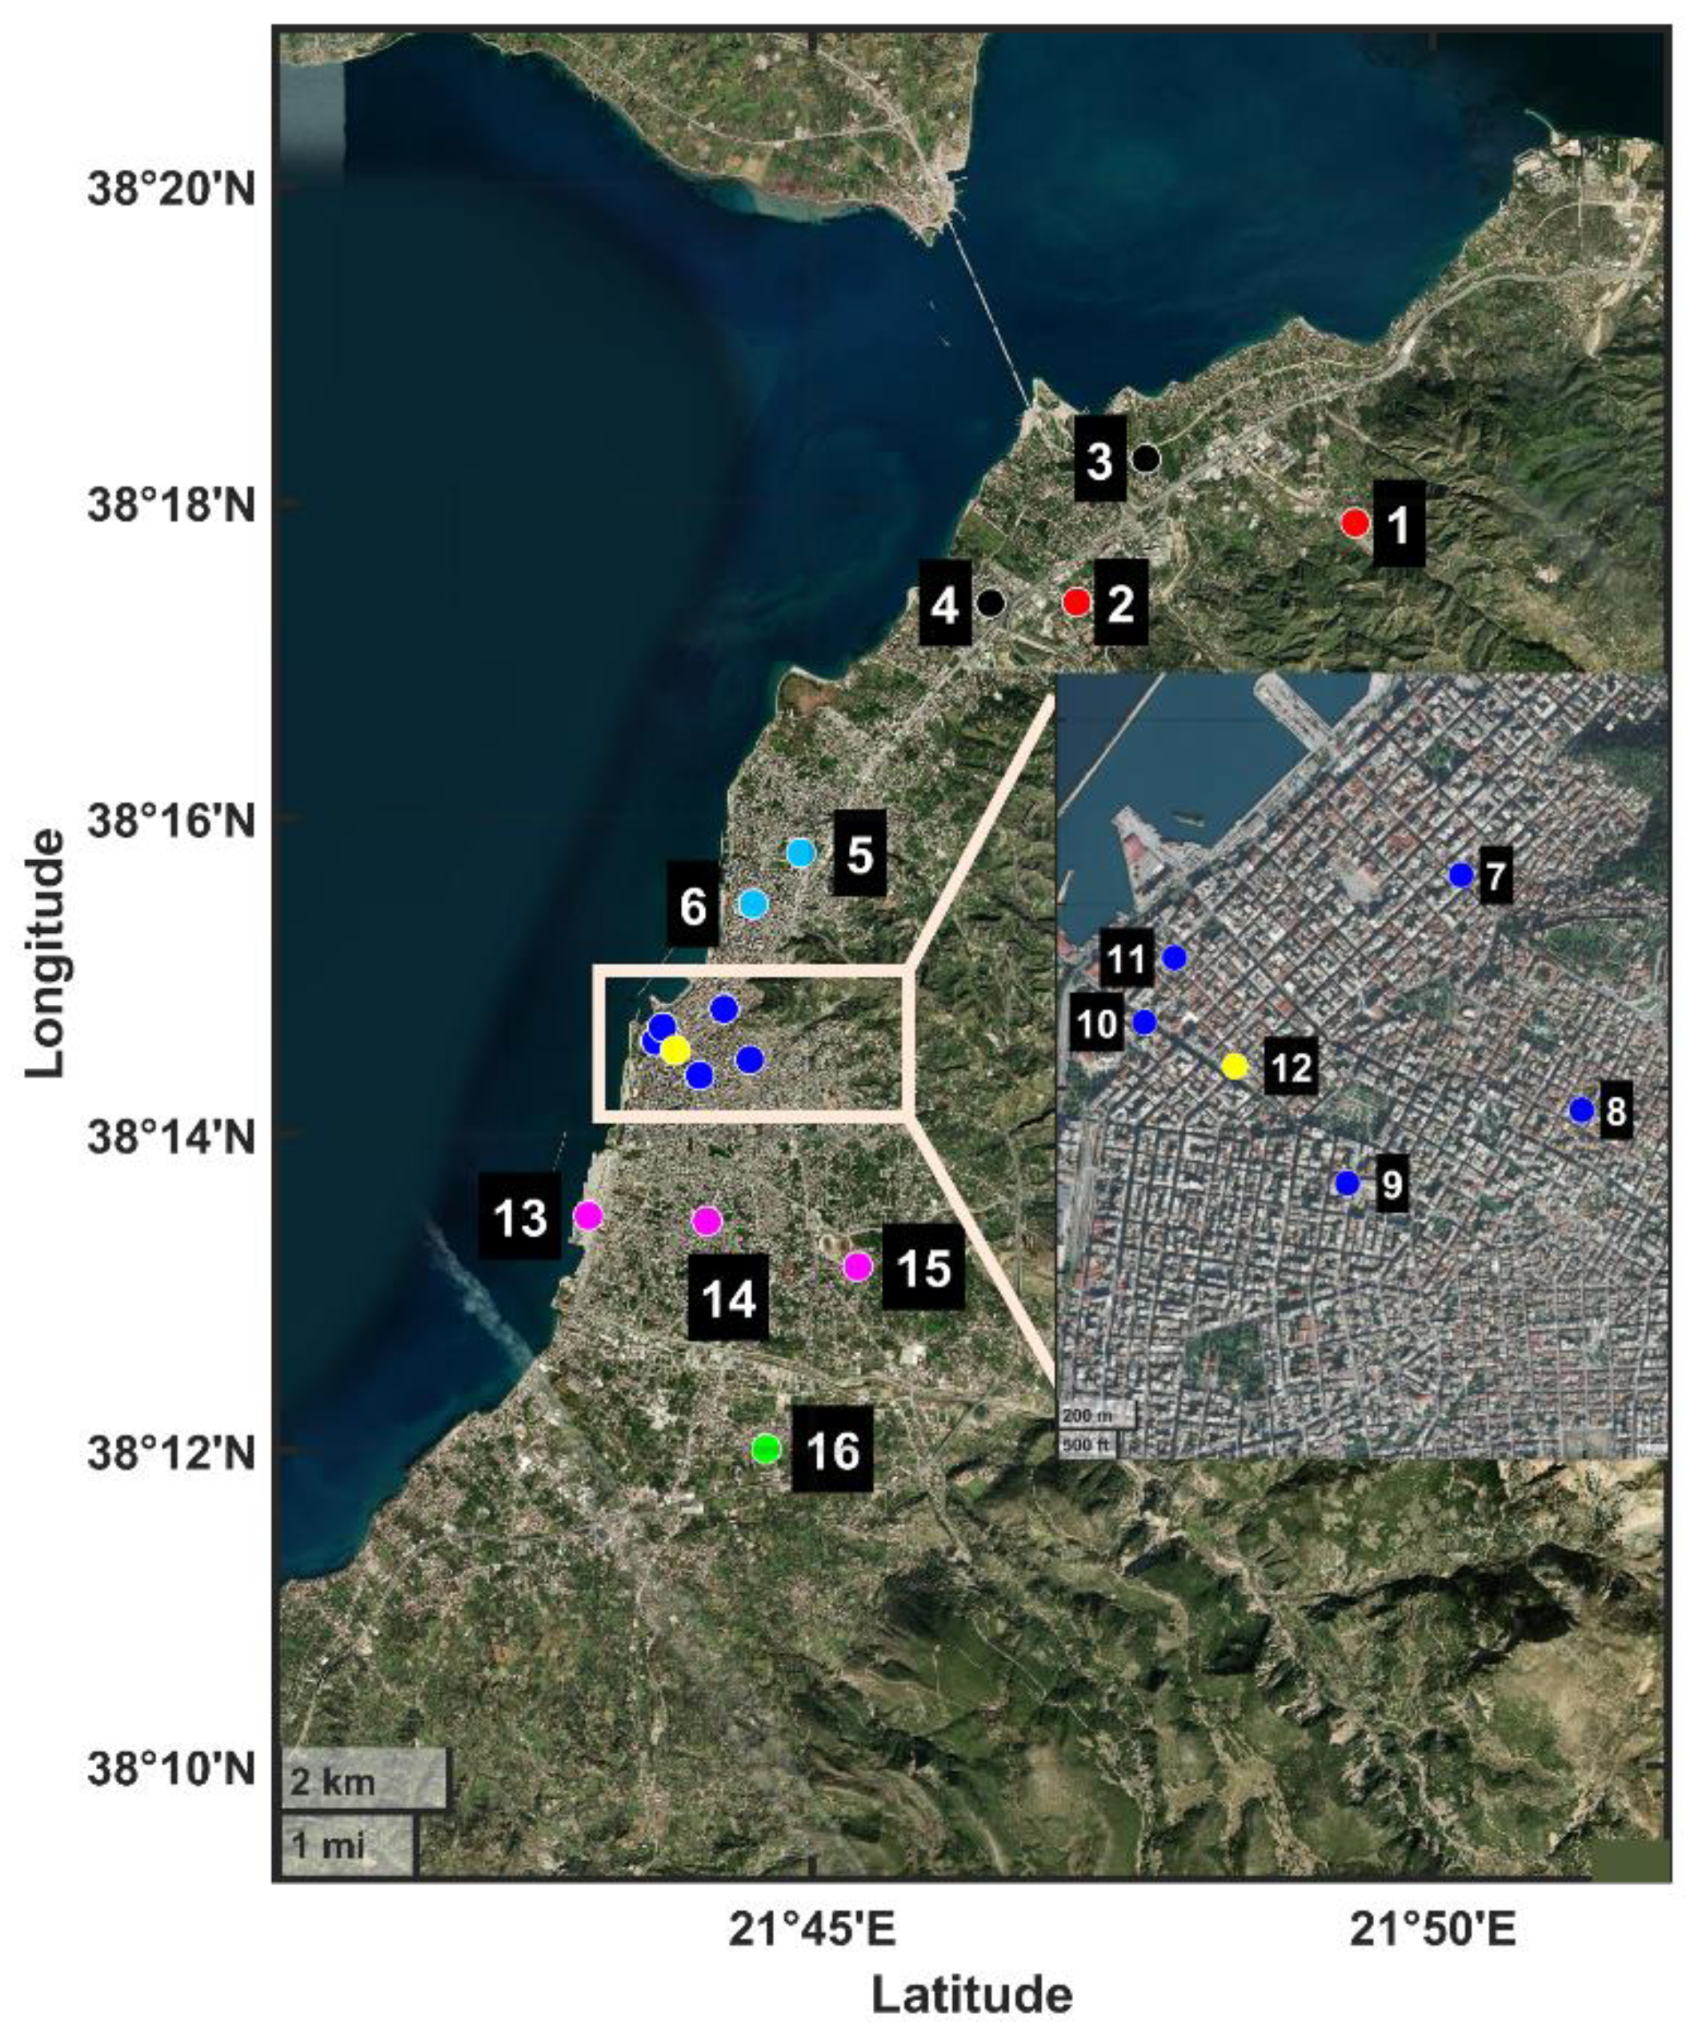
The low-cost PM2.5 monitoring network developed in Patras includes 16 PurpleAir sensors. The measuring sites (Figure 1) were selected based on criteria such as topography, population density, and possible emission sources. The knowledge gained from previous short-term campaigns was used for the selection of measuring sites. In this way, we identified possible sites that could provide estimates of the background conditions. Road traffic and wood burning for domestic heating (directly related to the population density) as well as the harbor-related activities were considered to be the main PM contributors. As a result, the measuring network was planned to be dense in the city center and a measuring station was established at the city harbor. Finally, it was important to cover the whole city since the complex topography was expected to increase the spatial and temporal variability of PM. The measurements described in this work were collected from February 2017 to December 2019. The network continues to operate; however, this study focuses on measurements before February 2020 when a lock-down was implemented in Greece due to the outbreak of COVID-19.

Figure 1.
Spatial distribution of the measurement sites across the city of Patras. The inset shows an enlarged view of the city center where several measurement sites are located. The colored dots represent the type of each site: (a) background (red); (b) suburban north (black); (c) urban north (cyan); (d) city center (blue); (e) high-restaurant-density area in city center (yellow); (f) urban south (magenta); (g) suburban south (green). The numbers correspond to the stations of the network.
To facilitate the analysis of the results, the 16 measurement stations were classified into 7 groups taking into account both their type and their geographical location.
- The two background stations, Platani (1) and University of Patras (2), are located to the north of the city. They are located in a sparsely populated rural area approximately 10 km from the city center. There are limited local PM sources and traffic is light in both of these areas.
- Rio (3) and Kastelokampos (4) are suburban sites to the north of the city. They are 1–2 km from the background stations but are characterized by higher population density, and most of the residences are equipped with fireplaces.
- In the northern part of the urban area, there are two stations: Agia (5) and Agia Sofia (6). Due to their proximity to the city center (around 2 km), the population density and road traffic are both high.
- Five stations, Agiou Nikolaou, Germanou, Psila Alonia, Agios Andreas, and Palio Telonio (numbered as 7–11 in Table 1), are located in the city center. In all of these areas, there is high traffic density in the immediate neighborhood, and three of the stations (Agiou Nikolaou, Germanou, Palio Telonio) are located on major city roads while the other two could be characterized as urban background stations.
 Table 1. Information about the stations of the low-cost PM2.5 network in Patras.
 - The station of Trion Navarchon (12) is located in the area of the city center with the highest restaurant density. This is the area that according to the chemical transport modeling predictions of Siouti et al. [27] has the highest cooking organic aerosol concentrations in the city. Despite its proximity to the rest of the city center stations, the measurements in Trion Navarchon are analyzed separately from the rest.
- Three stations, New Port of Patras, Kypseli, and Koukouli (13–15), are in urban areas in the southern part of the city. One of them is at the new port of the city which has been a suspected hot spot for particulate pollution.
- The last area is the suburban south with one station at Demenika (16), approximately 9 km south of the city center. It is mainly affected by agricultural and domestic biomass burning emissions.
The sensors were progressively installed, so the total number of observations differs across the measurement sites. For example, the station at Agia, installed in February 2017, reported 35 months of measurements while the latest one at Germanou, installed in March 2019, reported only 9 months of data. A sensitivity analysis was conducted to investigate if sensors with different periods of data collection may have an influence on the averages presented in the following sections. According to results, for all stations and in the vast majority of months, the influence on the 2017–2019 average when a month of measurements was not included was less than 2% and 4% for the warm (April–October) and the cold (November–March) periods, respectively. Moreover, for each cluster, PM averages were extracted only from the common measuring period of all stations. According to the results, the differences from the 2017–2019 averaged values were less than 0.6 μg m−3. In the city center, differences up to 1 μg m−3 were calculated.
The PurpleAir Low-Cost Monitor
The PM2.5 mass concentration measurements were performed using PurpleAir-II particle concentration monitors. Each PurpleAir unit includes two Plantower sensors (model PMS 5003) so two PM2.5 values are reported continuously. Their operation is based on particle scattering and conversion of the signal to mass concentration values. A fan draws ambient air at a flow rate of 0.1 L min−1, and a laser of 680 nm wavelength is used as the light source. A photodetector collects the 90° scattered light. A proprietary algorithm converts the output signal to mass concentration. These sensors are widely used because of their relatively good performance and long-term performance stability [28,29,30,31,32]. The uncorrected PM2.5 values (CF = 1) were used for the subsequent analysis in this work following Kosmopoulos et al. [30].
In order to ensure the high quality of the retrieved data, measurements were considered valid only when the two values reported by the two sensors in the same PurpleAir monitor differed by less than 20% of their average or less than 2 μg m−3. The average of the valid measurements was used for the subsequent analysis.
The raw PM2.5 measurements, PAir2.5, provided by the PurpleAir monitors were corrected using the equation derived for the conditions and aerosol encountered in Patras by Kosmopoulos et al. [29]:
This simple relative-humidity-independent calibration equation was found to reduce the relative mean error for hourly PM2.5 to 1.1 μg m−3 and the root mean square error for hourly PM2.5 to 1.6 μg m−3 compared to the reference measurements. The biases of the corrected values are practically zero. Please note that the application of the same sensors in other areas with different pollution and meteorological characteristics may require different forms of corrections. For example, Sayahi et al. [29] also reported a small sensitivity of the same sensors to RH, while Zamora et al. [33] showed a change of the sensors’ response when RH exceeded 50%.
For the quality assurance of our measurements, we used three traveling standard sensors which were continuously tested against a calibrated Grimm PM2.5 monitor (Grimm Environmental Dust Monitor 180). The two sensors were tested against the reference instrument while the third was collocated with a network sensor to check its performance. For each network sensor, the comparison was performed every six months for approximately one week. The differences in PM2.5 were found to be within the expected uncertainty limits. The comparison of the hourly measurements of the standard sensors against the reference instrument for different comparison periods revealed a mean bias error and root mean square error below 1.5 and 2.0 μg m−3 respectively, accompanied by R2 values above 0.93. No seasonal pattern was revealed from these comparisons. Consistent with previous studies, the response of the sensors compared to the reference instrument changed significantly during periods with high dust (or other coarse particle) concentrations. These few periods were excluded from the analysis as well as from the results presented in the following sections [30].
In areas like Patras, when there are periods in which almost all the PM2.5 is regional, it is possible to check the performance of the sensors by a direct comparison of their measurements (Figure 2).
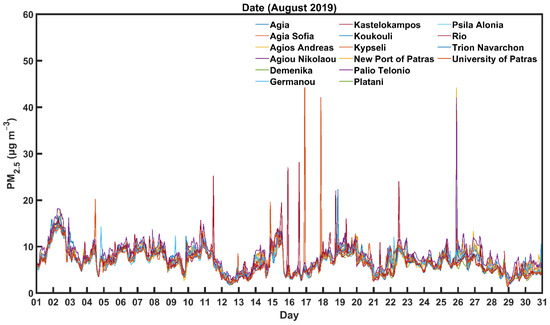
Figure 2.
PM2.5 hourly measurements of 16 low-cost sensors installed in different areas of Patras during August 2019.
During that period, most of the fine PM in the area was regional. The agreement among the measurements of the 16 sensors during long periods was within 1 μg m−3, strongly suggesting that there were no problems in the operation of all sensors at that time. This simple strategy can be used in other networks for all or parts of the network as a quality control check.
4. Results
4.1. Performance of Sensor Network
Adding the operation time of each sensor (with two sensors per PurpleAir monitor), there were 702 months of sensor operation. During this period, 1 of the 32 sensors was replaced because its performance was problematic. This was determined from the difference between the measurements of the two sensors in the same PurpleAir monitor.
There was no evidence of gradually deteriorating performance of the sensors, including those in operation for 3 years. The average data completeness was 87%, varying from 75% to 98%, except for the station of Agiou Nikolaou (65%) due to network connection problems. Loss of data was mainly due to external factors (loss of Wi-Fi connection and power interruptions) and not to sensor problems.
4.2. Spatial Variability
The average of all PM2.5 measurements in all sites, during the 2017–2019 period, was 9.4 μg m−3, suggesting that the area is, at least on average, just below the limit of 10 μg m−3 recommended by the World Health Organization (WHO). It should be noted that, in 2021, the recommended WHO limit was reduced to 5 μg m−3. Moreover, there is significant variability of the average levels, which range from 6.1 μg m−3 in Platani to 12.7 μg m−3 in Trion Navarchon and 12.8 μg m−3 in Kypseli (Figure 3). A summary of concentration levels measured during the whole period as well as the colder (November–March) and the warm (April–October) periods is provided in Table 2.
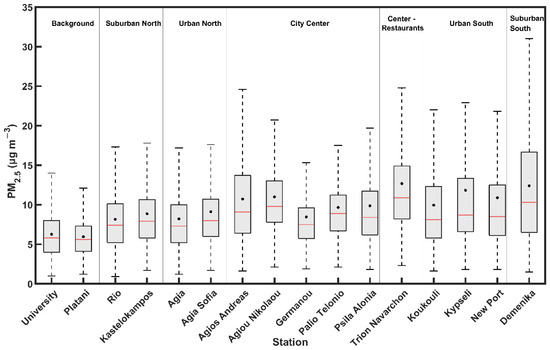
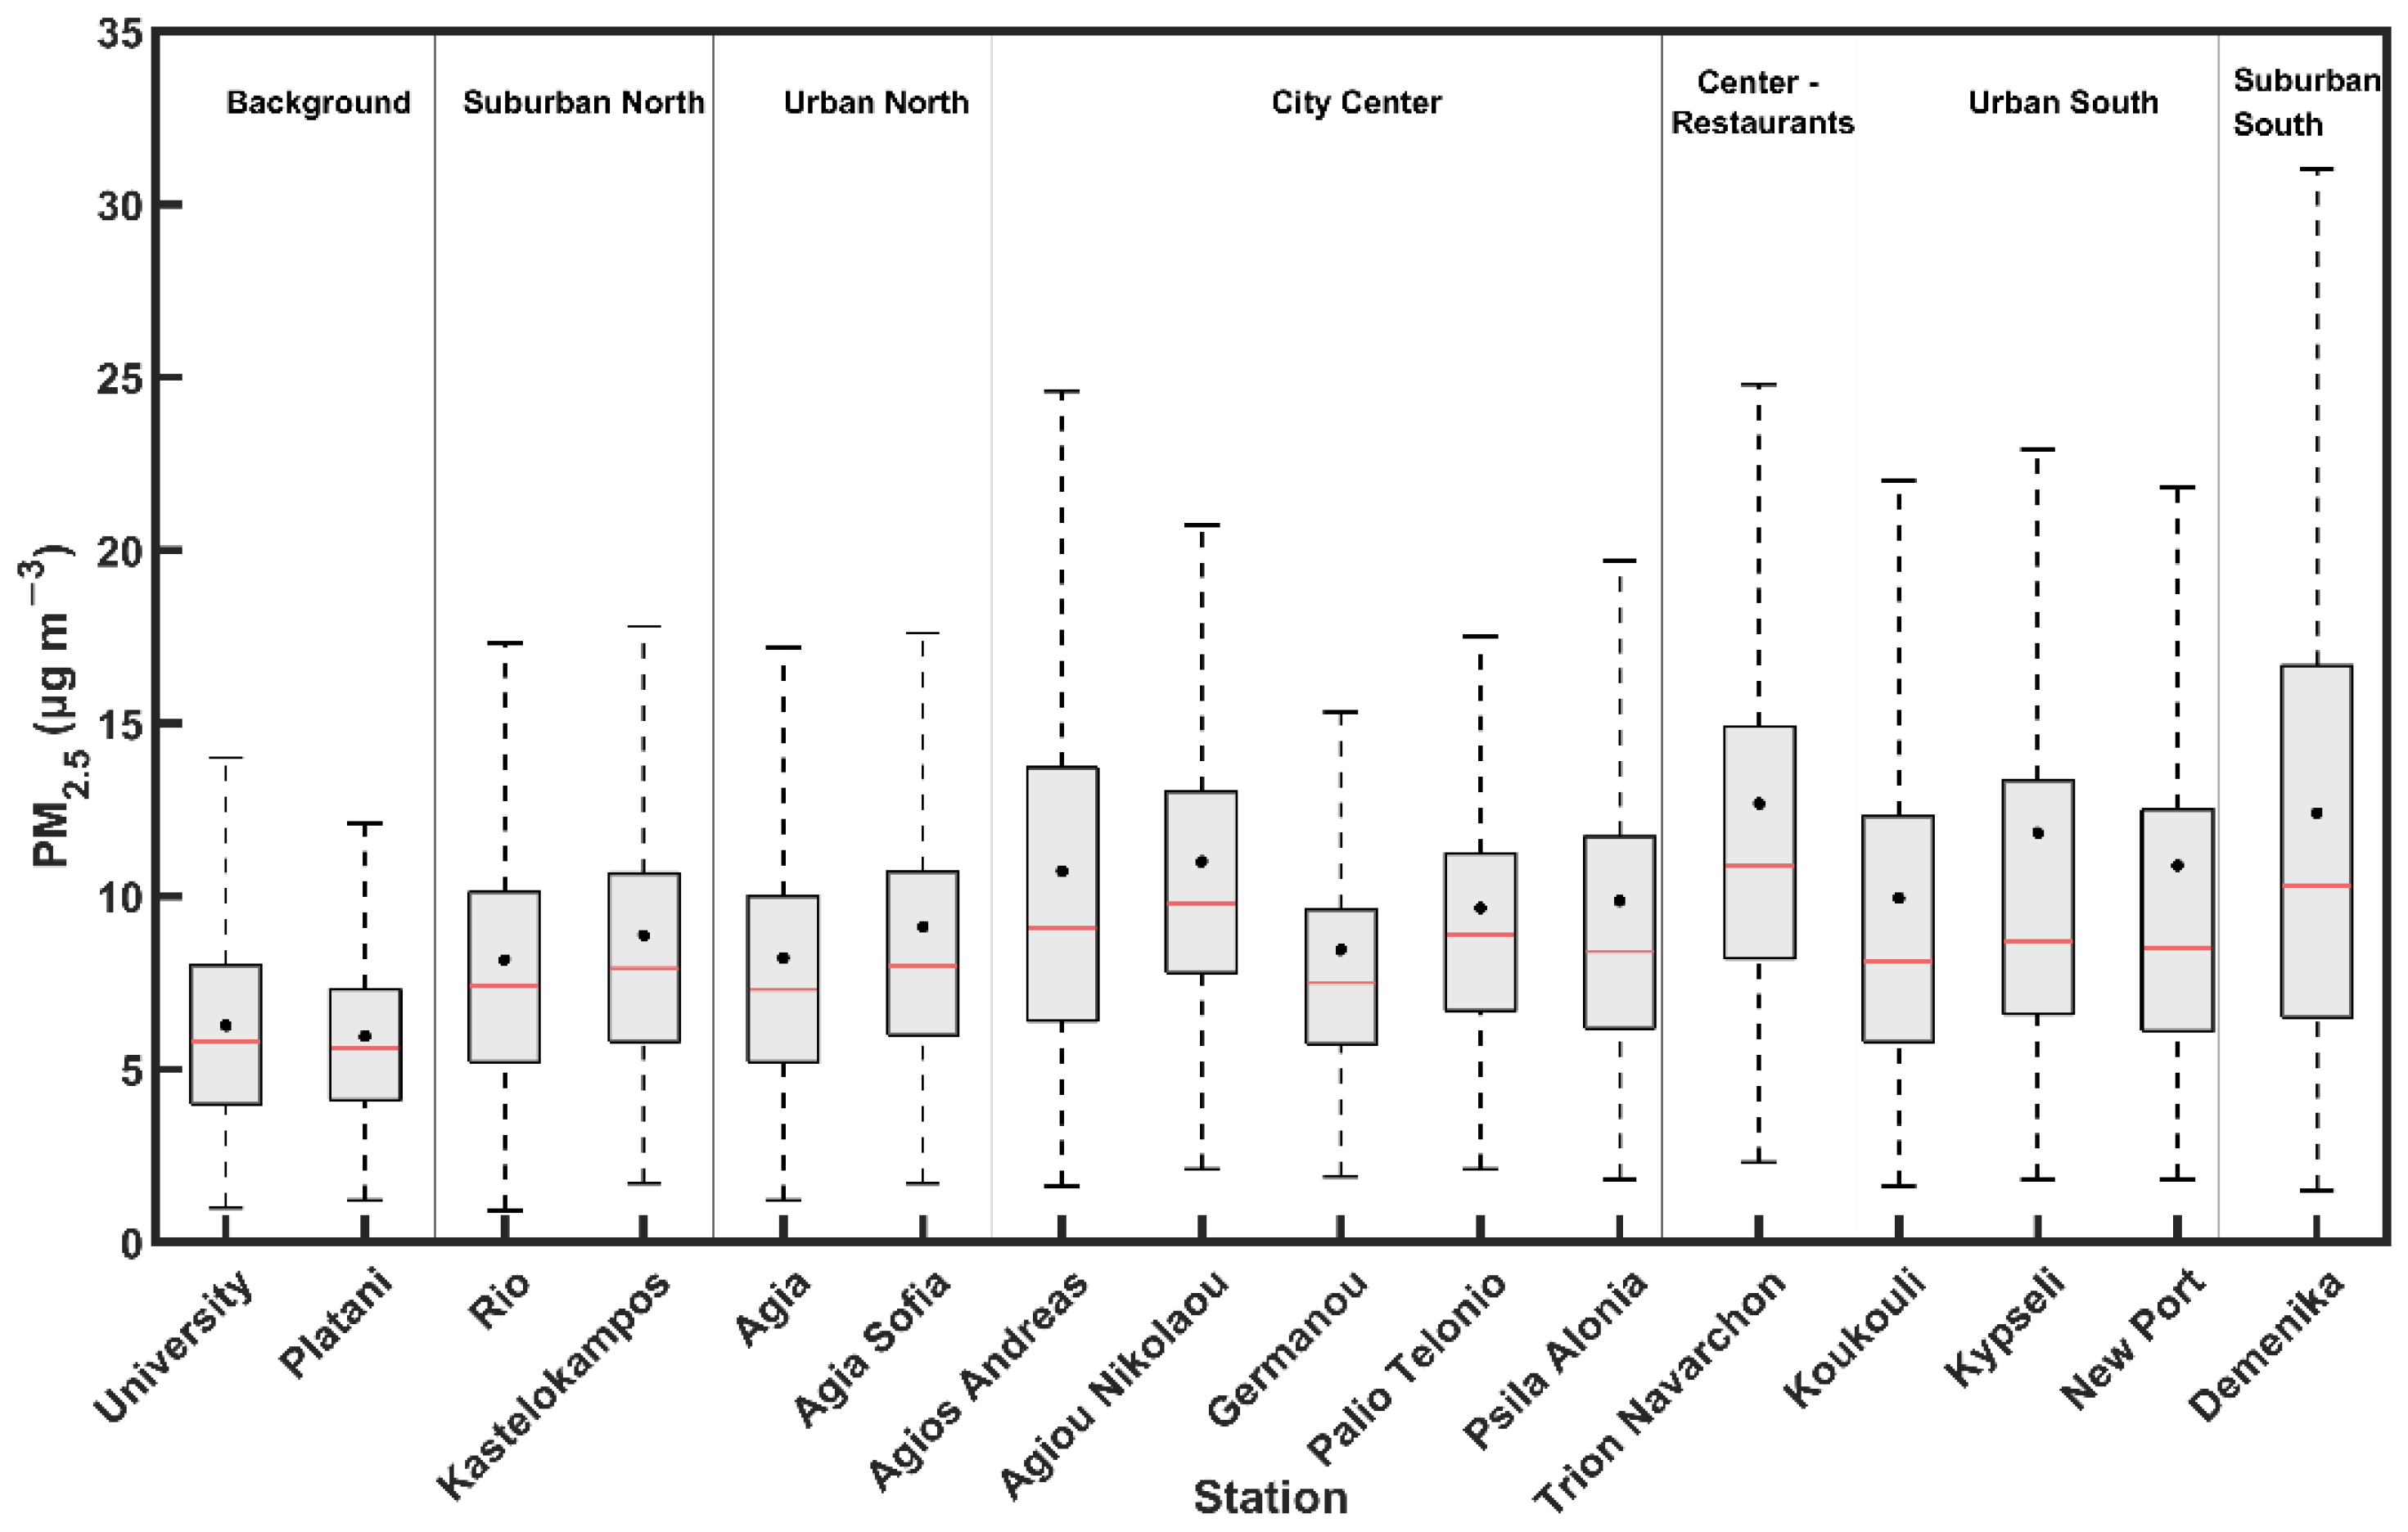
Figure 3.
Boxplots of daily average PM2.5 concentrations at all stations of the network. The black dots and the solid red lines correspond to the mean and median PM2.5 concentrations. The bottom and top edges of the box indicate the 25th and 75th percentiles.
Table 2.
Average (±standard deviation) concentrations and the range of daily PM2.5 measurements (in μg m−3) of each station during the full (02/2017–12/2019), cold, and warm periods.
One of the highest average concentrations was in an area of the city center with a high restaurant density. This is consistent with the modeling predictions of Siouti et al. [27]. A site in the southern part of the city (Kypseli) was also a PM2.5 hot spot with relatively high PM2.5 average levels. This is due mainly to high concentrations in these areas during the winter (Table 2).
The lowest average concentrations were recorded, as expected, in the two background stations of Platani (6.1 μg m−3) and the University (6.3 μg m−3). The level of 6.2 μg m−3 can be used as a first approximation as the average background concentration of the urban area during the study period.
In the suburban north area (Rio and Kastelokampos stations), average PM2.5 levels were around 2.5 μg m−3 higher than the background ones. This was mainly due to concentrations during the colder period which were 4–5 μg m−3 above the background. During the summer the increase was 1–1.5 μg m−3. Although these suburban stations are quite close to the background ones, their average PM2.5 value is approximately 40% higher. Moreover, the increased variability (Figure 2 and Table 2) indicates a daily variability in the corresponding emission sources in these northern suburbs that is not observed for the background area.
The average concentration in the two northern urban sites (Agia and Agia Sofia) was 8.8 μg m−3 and is quite similar to the average of the northern suburban sites (8.6 μg m−3). This behavior suggests that the PM2.5 concentration gradients in this northern coastal region, at least on average, were modest during the measurement period.
The average PM2.5 concentration in the city center area was 9.9 μg m−3. While the previous areas showed small variations (less than 10%) among the stations of each group, the difference between the city center area sensors reaches close to 30%. The highest concentration, 11.5 μg m−3, is in a station (Agiou Nikolaou) on one of the major city roads. These results indicate PM2.5 increments in the city center of 4–5 μg m−3 above the background.
The Trion Navarchon site had average PM2.5 levels that were 2.8 μg m−3 higher (28%) than the average of the other five city center stations and 6.5 μg m−3 above the background levels.
In the urban south area, the mean PM2.5 concentration was 11.3 μg m−3, a little higher than the average values in the center of the city. The highest values in this area were measured at Kypseli (12.8 μg m−3). The PM2.5 levels at the port (11.5 μg m−3) were close to the average for this area, suggesting a small contribution on average of the local emission sources.
Finally, the suburban south site at Demenika had a relatively high average PM2.5 concentration at 11.1 μg m−3, similar to the relatively high values at the urban south sites located a little further to the north. These measurements suggest that there may be a hot spot of pollution in this southern area of the city during the colder period which extends to the suburbs.
4.3. Monthly Variation
The average monthly PM2.5 in the two background stations varied from 4.8 (during May) to 7 μg m−3 (during January) with no distinct seasonal pattern (Figure 4). The background concentration was 6 μg m−3 during the colder period and 6.15 μg m−3 during the warmer period.
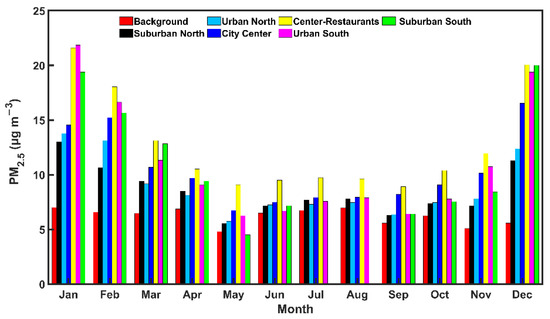
Figure 4.
Monthly averaged PM2.5 concentrations for different areas in the city during 2/2017–12/2019: (a) background (red); (b) suburban north (black); (c) urban north (cyan); (d) city center (blue); (e) city center restaurants (yellow); (f) urban south (magenta); (g) suburban south (green).
The PM2.5 behavior in all sites inside the urban and suburban areas showed a strong seasonal pattern with the highest concentrations during December and January and the lowest during May, the three summer months, and September. The highest monthly average values, exceeding 20 μg m−3, were recorded during January in the high-restaurant-density area of the city center and the urban south. The suburban south was also characterized by average concentrations close to 20 μg m−3 during the same period.
The city center also had worse air quality conditions during the winter compared to the rest of the year. However, the corresponding average concentrations were in the 14–16.5 μg m−3 range, significantly lower than in areas further to the south of the city. This indicates that traffic was not the dominant source of PM2.5 during this wintertime period.
The highest monthly average PM2.5 value, 21.6 μg m−3, was measured during January in the Trion Navarchon site in the high-restaurant-density area of the city center. This concentration was more than 5 μg m−3 higher than the PM2.5 in the other areas in the center, suggesting that cooking emissions together with the relatively low nighttime mixing heights in this cold period resulted in these relatively high PM2.5 levels. The same site had the highest concentrations during the summer months, but the average levels during the warm period, 9.3 μg m−3, were less than half those during December and January.
Overall, the highest gradients in space were observed during December and January which are also the months with the highest concentrations. A combination of increased local emissions, mainly due to wood burning and weaker atmospheric mixing, are responsible for this behavior. On the other hand, during the three summer months, the average PM2.5 is quite similar in all sites, with the exception of the high-restaurant-density site. The effect of local emissions during the summer appears to be small.
4.4. Average Diurnal Variation
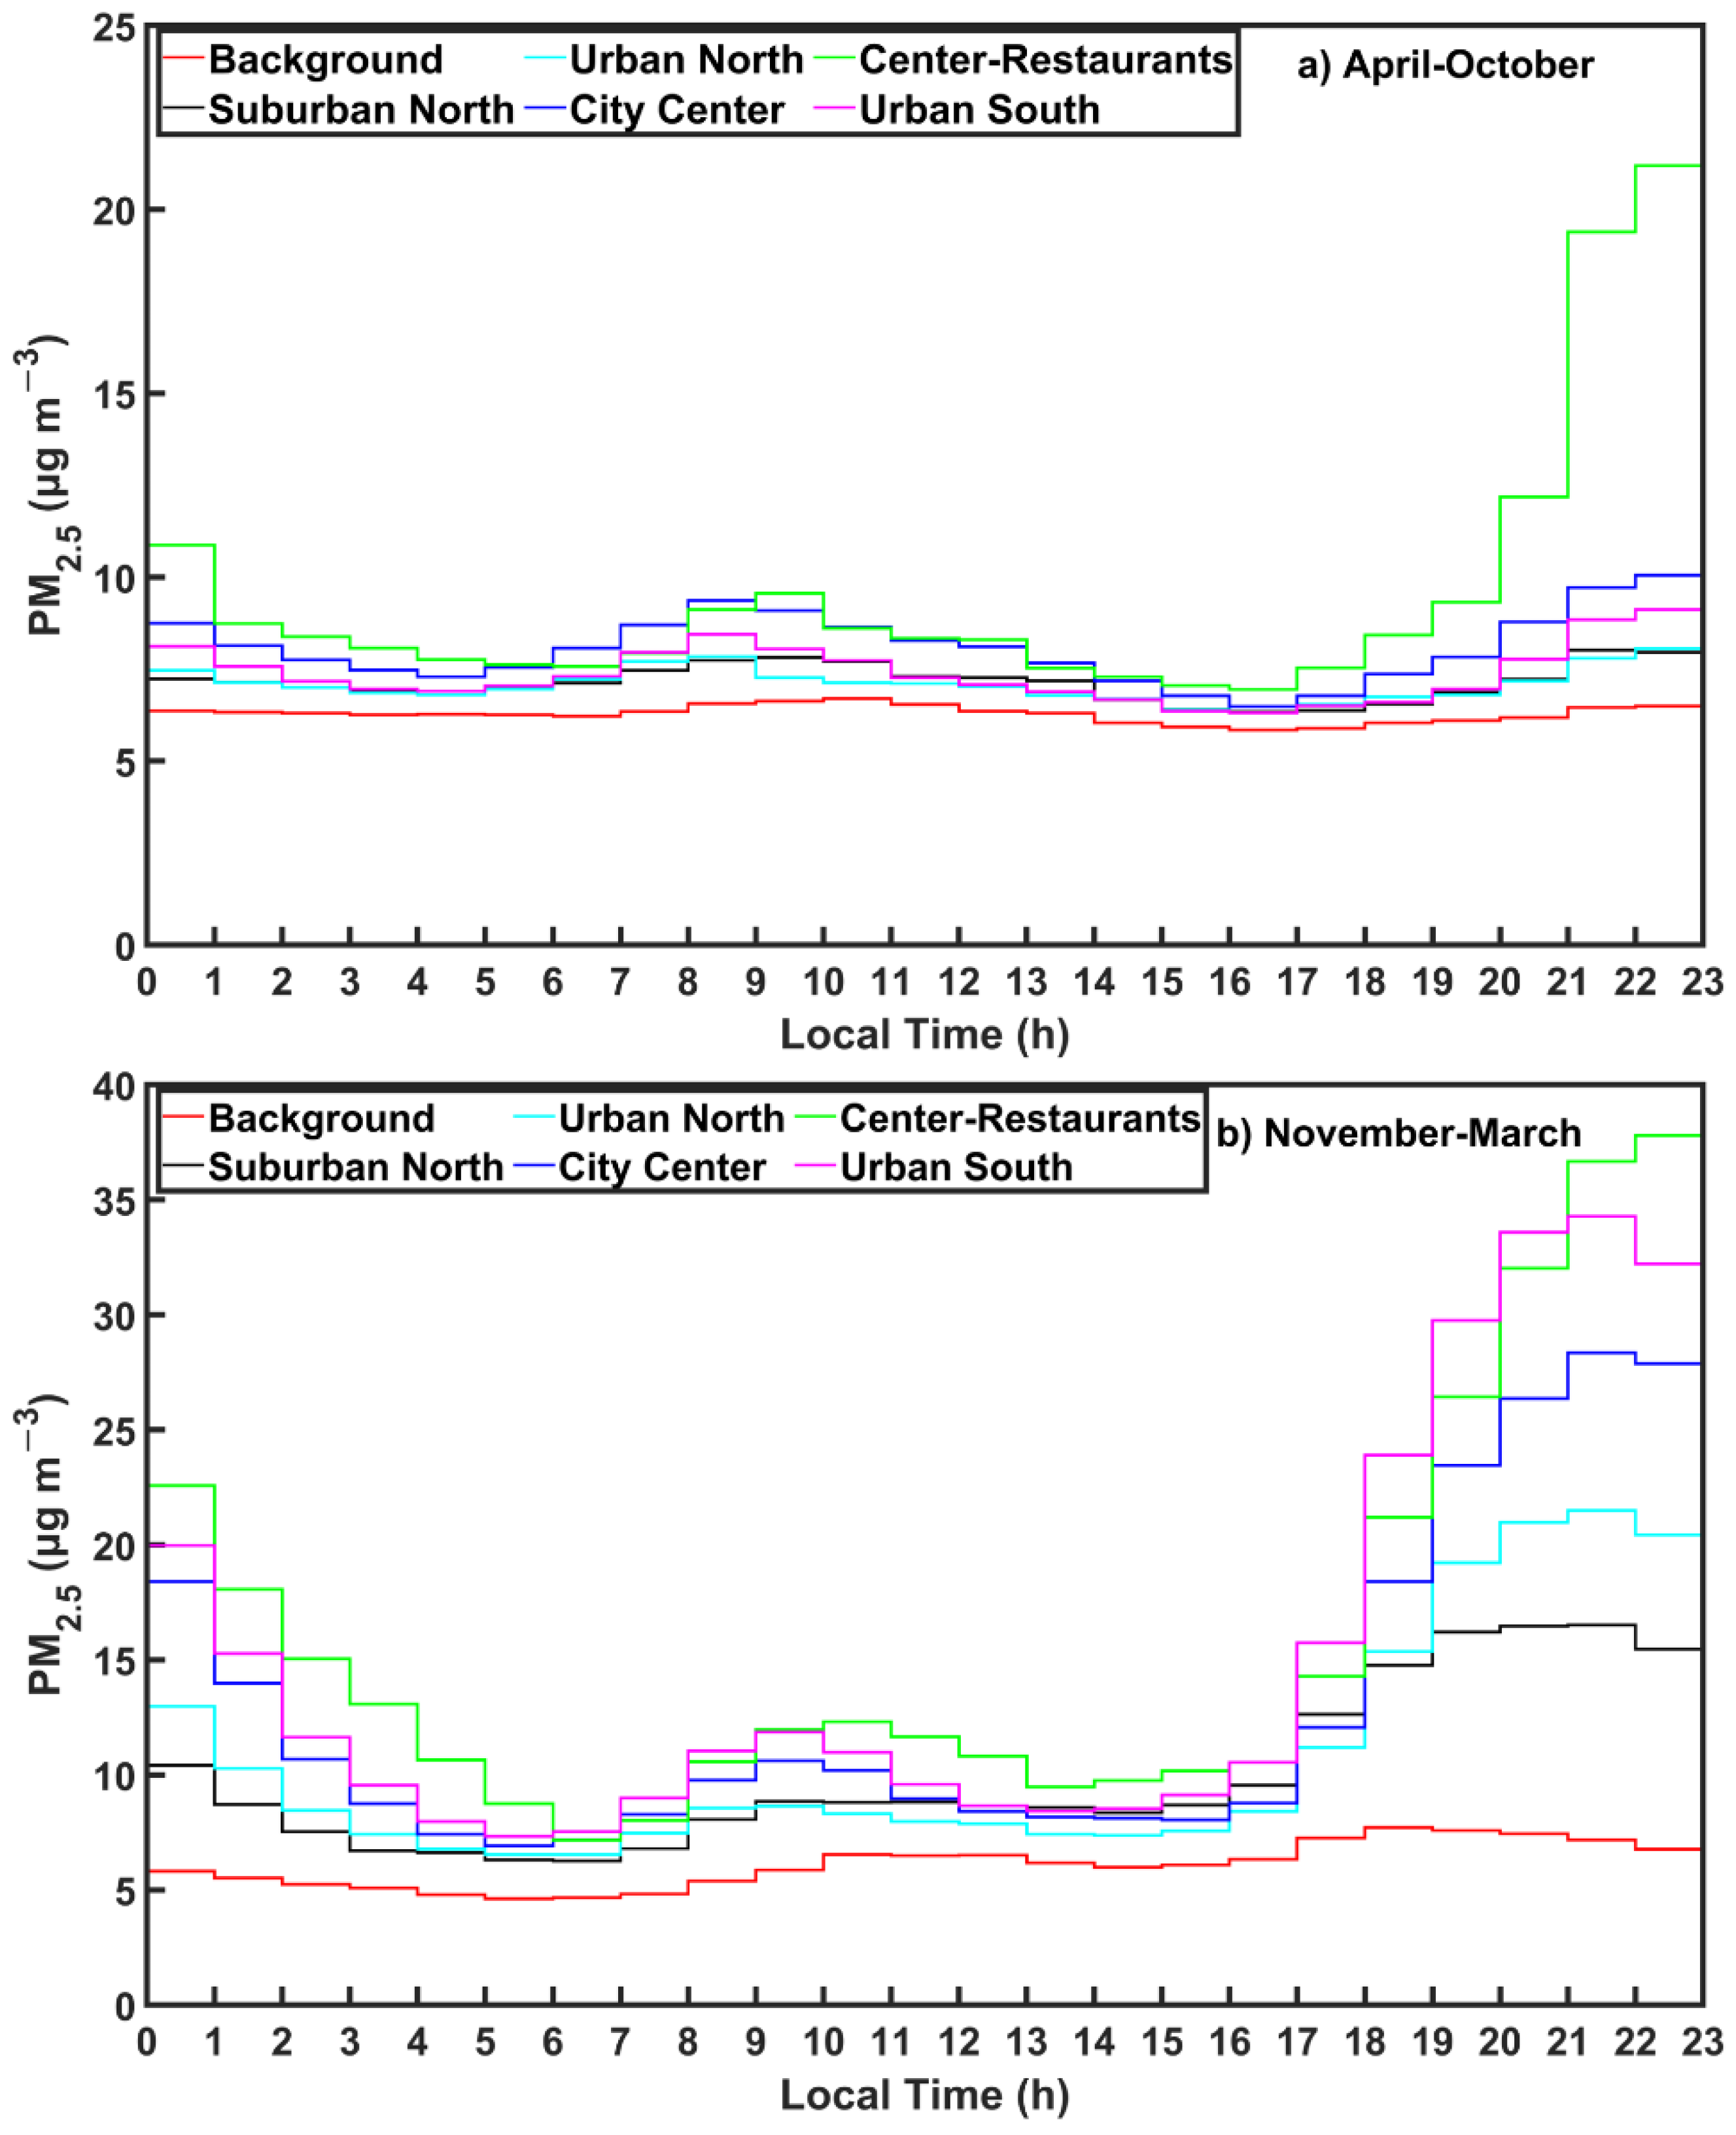
The average diurnal variability of PM2.5 in the six examined areas during the warmer (April–October) and colder (November–March) periods can also provide valuable insights about the dominant sources of PM2.5 in the area. These diurnal cycles for each area were calculated simply by averaging the corresponding cycles in the sites in the area. The diurnal profiles for all sites can be found in Figure S1.
During the warmer period, the average PM2.5 diurnal profile in the background stations is quite flat with variations of less than 0.5 μg m−3 around its mean (Figure 5). This behavior is consistent with our assumption that the PM2.5 in these areas has negligible average contributions from local sources. PM2.5 behaves similarly in all urban and suburban areas, exhibiting a modest peak at 8:00 or 9:00 and then a nighttime peak at around 22:00. In most areas, these two peaks are similar in magnitude. The station in the high-restaurant-density area is a notable exception because its nighttime peak is at a concentration that is twice as much as the morning peak. The morning peaks in this warmer period are probably associated with the local traffic, while the evening peaks are the results of both traffic and cooking emissions. It is clear that in the high-restaurant-density area, the cooking emissions dominate in the evening. The concentrations in the center of the city are the highest of all other areas (excluding the Trion Navarchon station) throughout the day, a result consistent with the high traffic density in this part of the urban area. The morning PM2.5 peak at the center is approximately 3 μg m−3, suggesting that local traffic during the morning rush hour contributes approximately one-third of the fine particulate mass. The fractional contribution is probably less than this during the rest of the day.
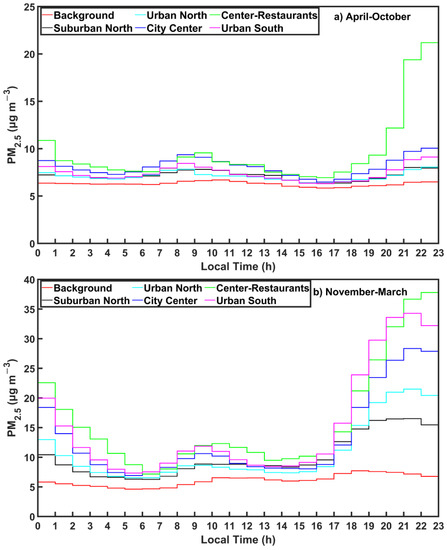
Figure 5.
Average diurnal profile of PM2.5 at the various examined areas during the (a) warm (April–October) and (b) colder (November–March) periods.
During the colder period, the diurnal profile of PM2.5 in the background sites remains relatively flat but does vary by approximately ±1.5 μg m−3, suggesting a small contribution of local sources. This also means that the actual background concentration is probably a little lower during this period than the 6 μg m−3 estimated. The major characteristic of the diurnal profiles in all urban and suburban sites during this period is the quite high concentrations in the evening peaking at 21:00–22:00 (Figure 5). There is a south-to-north gradient, with higher concentrations in the south during these winter nighttime periods with average peak concentrations exceeding 35 μg m−3. During the peak concentration period, the average concentration increases above the background from around 10 μg m−3 in the northern suburbs to approximately 30 μg m−3 in the south. The nighttime PM2.5 levels in the high-restaurant-density area are higher than those in the nearby city center stations by as much as 10 μg m−3 at 22:00, strongly supporting the importance of cooking emissions in this area during the colder period as well. The morning peak during traffic rush hour is still present; however, it is much smaller than the nighttime peak and just a few micrograms per cubic meter higher than the warmer period peak for most areas.
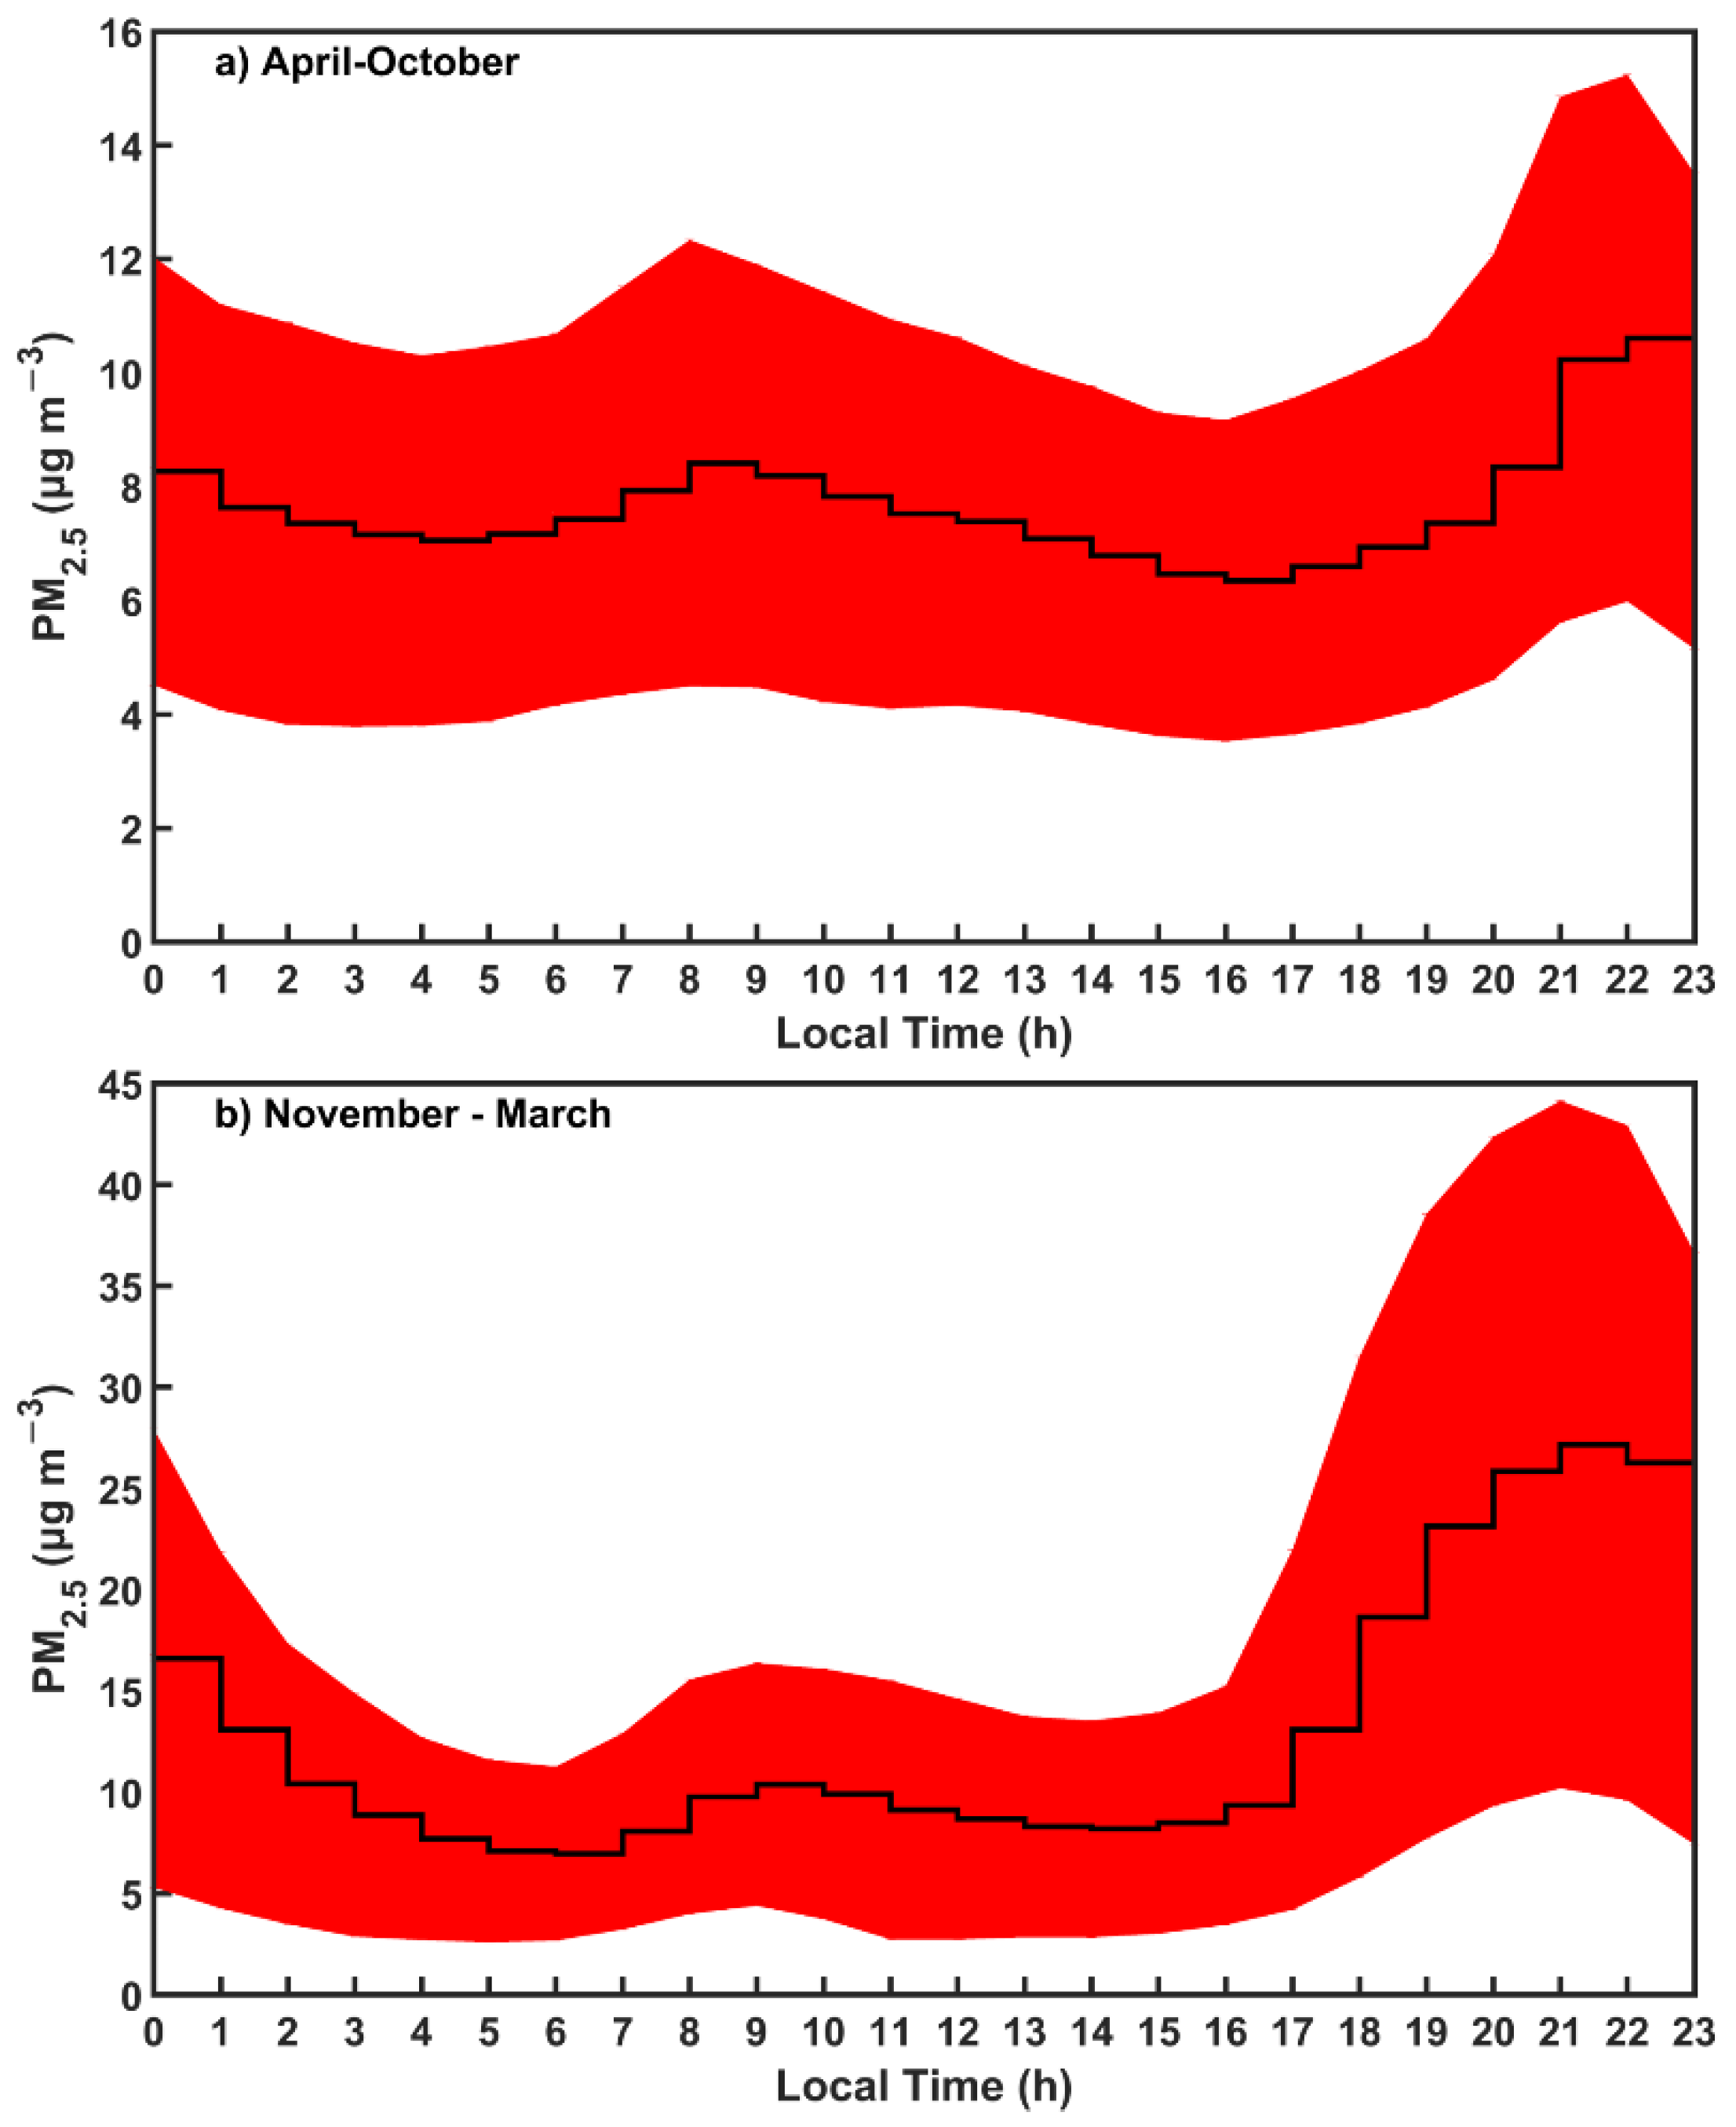
The average diurnal profile for all urban and suburban measurement sites is shown in Figure 6. During the warmer period, the PM2.5 diurnal average concentration for the city of Patras varies from 6.4 to 10.6 μg m−3, suggesting good air quality conditions on average throughout the day. There is a peak of 8.4 μg m−3 at 8:00 LT and a second one of 10.6 μg m−3 during 20:00–22:00 LT.

Figure 6.
Average diurnal profile of PM2.5 for all measurement stations in the city of Patras, not including the two background stations, during the (a) warmer (April–October) and (b) colder (November–March) periods. The standard deviation of the mean concentration is also shown as a shaded area.
The city’s average PM2.5 during the colder period exhibits increased diurnal amplitude (7–27.2 μg m−3). The morning peak is at 9:00 LT at 10.4 μg m−3 and is approximately 24% higher than the one recorded during the warmer period. A strong nighttime peak at 27.2 μg m−3 was observed at 21:00 LT.
4.5. Regional and Local Contributions to PM2.5
The regional contribution to the measured PM2.5 can be estimated assuming that the PM2.5 in the background area has a negligible contribution from local sources. Then, by definition in this approach, 100% of the PM2.5 is due to regional sources. In the rest of the stations, the local contribution can be estimated as the difference between the measured values and the assumed background concentrations. In this approach, the same background concentration is assumed for the whole area of interest. Diamantopoulou et al. [34] proposed an alternative approach for the determination of a site-specific monthly average background concentration when continuous measurements are available. This method assumes that the background concentration is equal to the minimum hourly concentration of the monthly diurnal PM2.5 profile in each site. Both approaches are used here to provide more robust estimates.
Estimates of the Regional Background PM2.5 Concentration
The regional background concentration for each month and each area, estimated by the two approaches, is shown in Figure 7. The Diamantopoulou et al. [34] algorithm provides a different estimate for each site during each month. These estimates vary in space as expected because the average background PM2.5 can be different for different parts of the urban area (e.g., for the south and the north). This variability is of the order of 1–2 μg m−3 for most months and sites and is, therefore, relatively low. Part of the variability may be real, but parts of it are due to the uncertainty of the Diamantopoulou et al. [34] approach. The algorithm based on the average measurements in the two background stations provides in our case a spatially uniform estimate of the background. The average estimate of the background concentration by the Diamantopoulou et al. [34] approach agrees with the measured concentrations in the background stations in almost all cases (Figure 7). This is an encouraging result because these approaches are based on different assumptions and measurements and, therefore, their agreement increases our confidence in the estimated background levels. It also supports the ability of the Diamantopoulou et al. [34] approach to provide good estimates of the background PM2.5 for an urban area like Patras even when measurements from only one low-cost sensor are available.
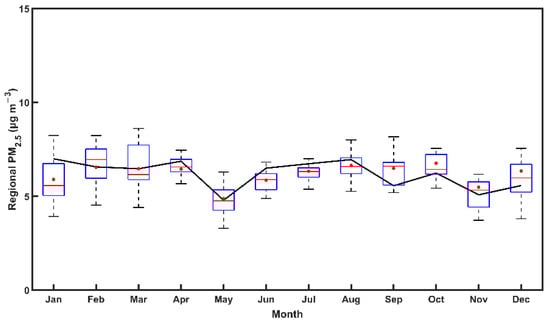
Figure 7.
Monthly averaged regional background PM2.5 concentrations for the city of Patras during the study period (2017–2019). The solid black line represents the background concentrations calculated as the average of the measurements in the two background stations (Platani and University of Patras). The bottom and top edges of the blue boxes indicate the 25th and 75th percentiles of the background PM2.5 values for the various stations calculated using the Diamantopoulou et al. [34] method, the red dots show the average concentrations, and the red lines show the median concentrations.
The monthly variability of the background PM2.5 around its average level of approximately 6 μg m−3 is small; however, there are months such as May during which the background is cleaner and its concentration appears to decrease to approximately 5 μg m−3.
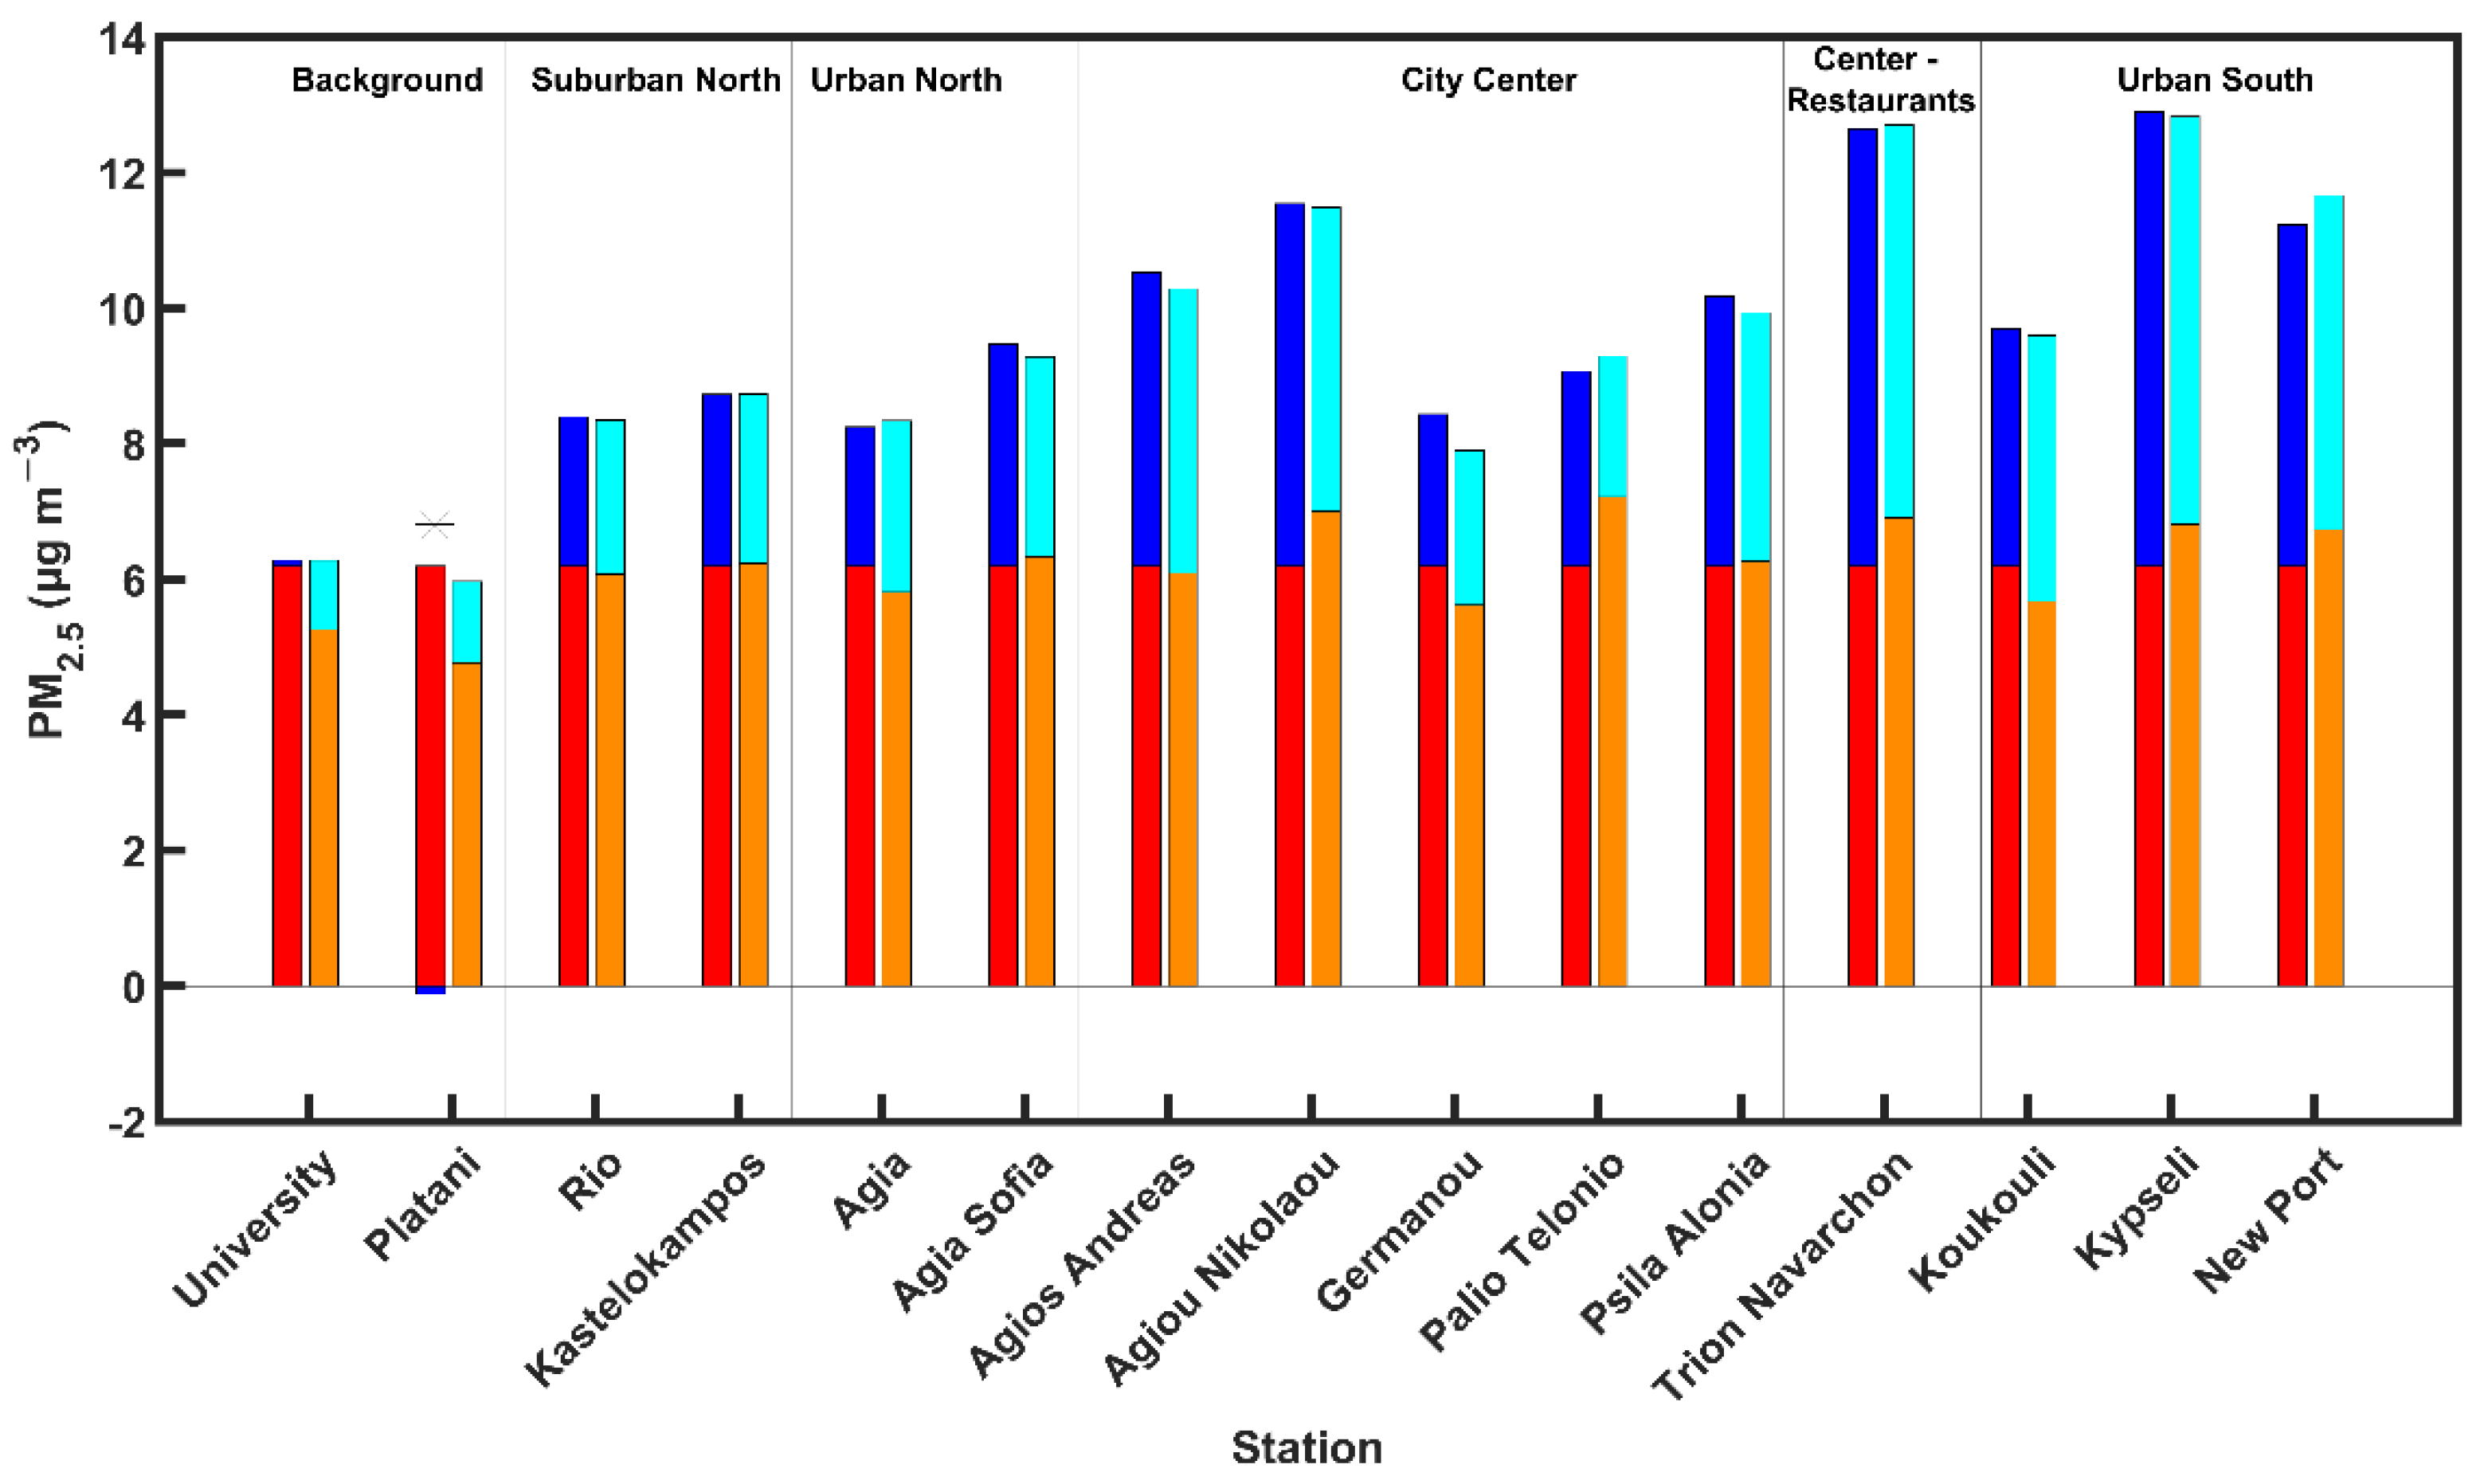
Using these background concentrations, the contribution of local sources to PM2.5 in each station can be estimated (Figure 8). On average, approximately 70% of the PM2.5 in the area is due to transport from other areas and only 30% is due to local emissions. The contribution of the local sources is quite variable in space, increasing from approximately 25% in the suburban north to around 35% in the city center and to 40–45% in the high-restaurant-density area of the city. The results of both approaches are quite consistent with each other.
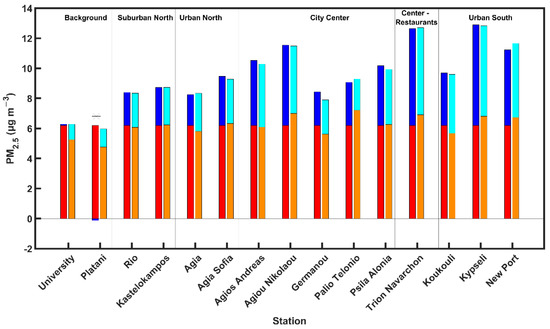
Figure 8.
Average estimated contributions of regional transport and local sources to the measured PM2.5 in all stations in Patras. The regional contribution using the difference approach is in red and using the Diamantopoulou et al. [34] approach is in orange. The local contribution using the difference approach is in dark blue and using the Diamantopoulou approach is in light blue.
The contribution of the local sources increases significantly during the colder period (Figure 9). During the warmer period, it varies from around 10–15% in the suburbs and the urban areas away from the city center to 20–25% in the city center and to 30–35% in the high-restaurant-density area. During the colder period, local sources are responsible for 50–60% of the PM2.5 in the city center and urban south and for 40–45% in the urban and suburban north. According to the Diamantopoulou [34] approach, local sources are also contributing a little to the PM2.5 in the background stations during that colder period.
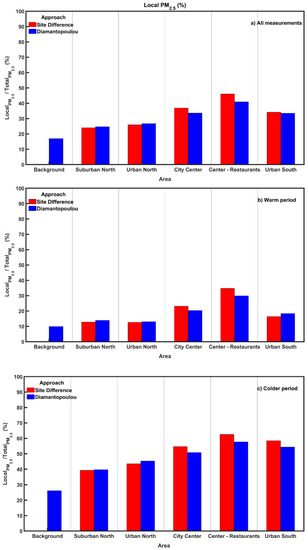
Figure 9.
Average percent contribution of the local sources to the measured PM2.5 in all areas in Patras during the (a) full study, (b) warm period, and (c) colder period.
The increase in the local contribution during the colder period strongly suggests the presence of an additional PM2.5 source during these months. The high contributions in all areas, even if some of them have low traffic density, and also the high nighttime concentrations are consistent with the measurements of Florou et al. [20], who reported that during the winters of 2012 and 2013 biomass burning was responsible for approximately 40% of the fine PM in a site in the urban south of the city. The Florou et al. [20] results were based on measurements of the chemical composition of the fine PM using an aerosol mass spectrometer.
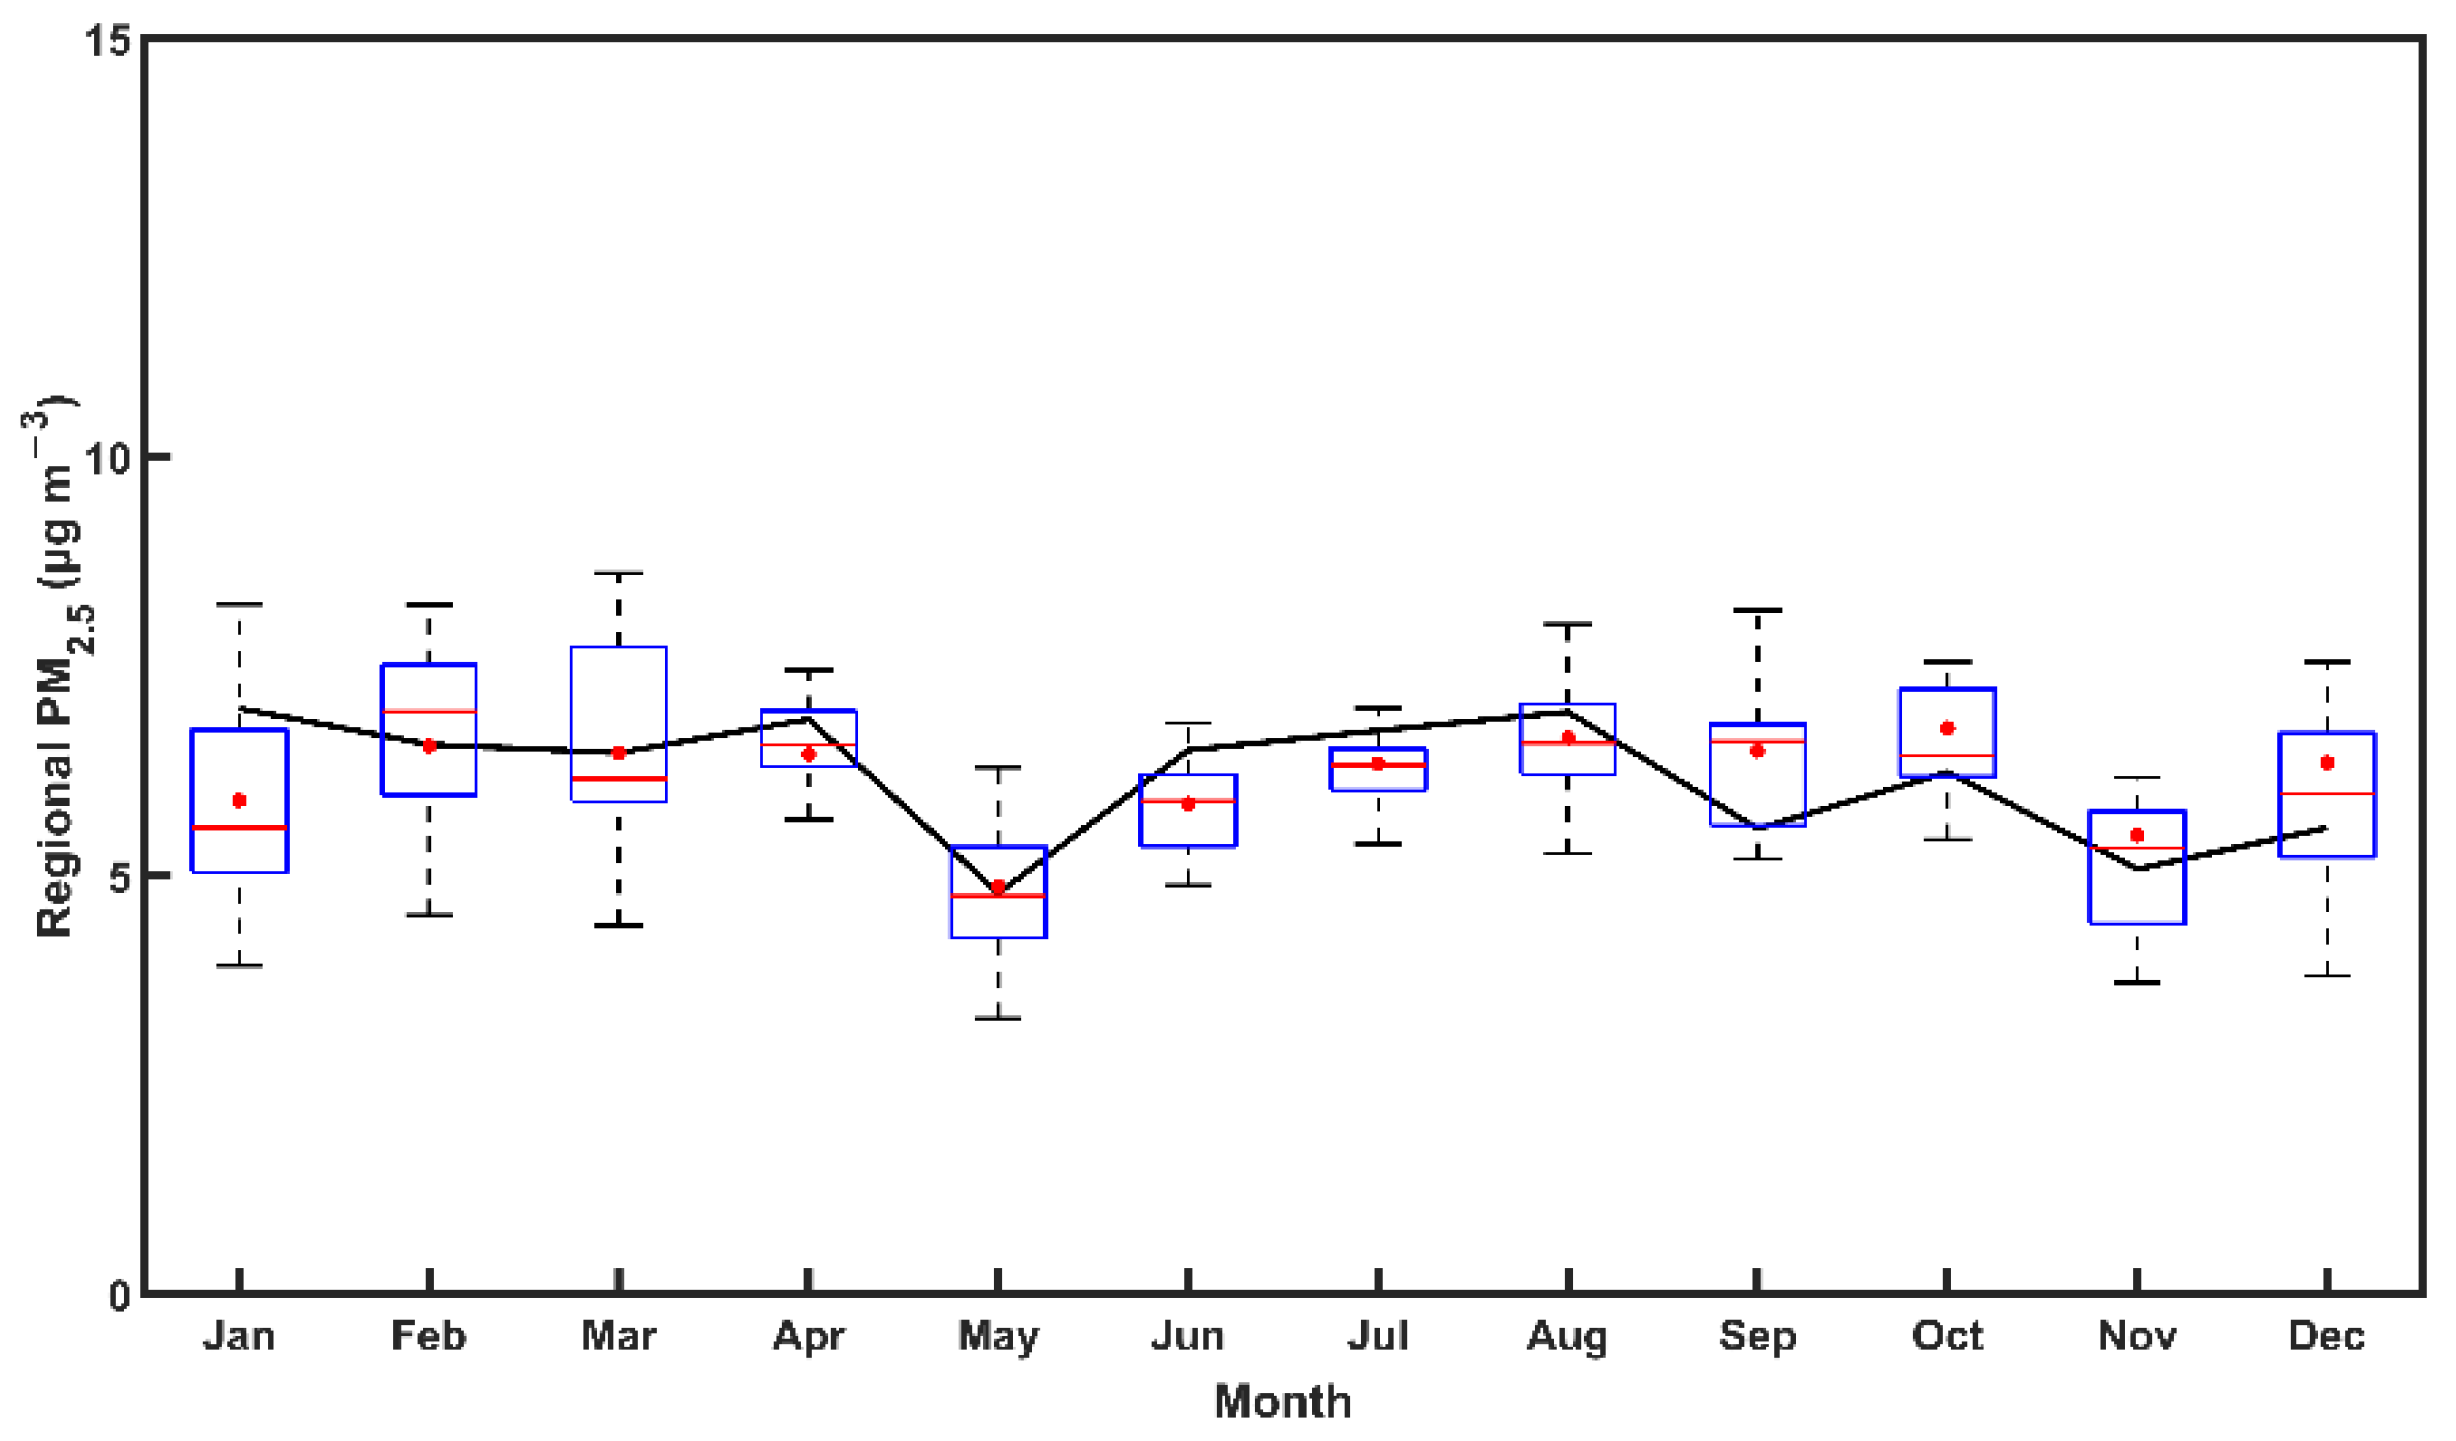
The importance of wood burning is evident in the citywide average monthly PM2.5 concentrations (Figure S2). The particulate concentrations during December, January, and February are approximately twice as high compared to the other months of the year.
5. Conclusions
A network of low-cost PM2.5 PurpleAir monitors (each with two sensors) was deployed in the city of Patras. It included sixteen stations covering the background, suburbs, city center, and other areas in the urban core. The network operated well during its first three years (2017–2019) with minimum need for maintenance and good data recovery (87% on average). Loss of data was mainly due to issues with the corresponding Wi-Fi connections and not the sensors themselves. The quality control protocol of the network included calibration against collocated reference PM2.5 monitors in the same area, intercomparison of the measurements of the 16 low-cost monitors during periods in which all of them reported practically the same value (almost all the PM2.5 was regional during these periods) and intercomparison of the values of the two sensors in each monitor.
The measurements of the network provided valuable insights about not only the spatial and temporal distribution of PM2.5 but also its sources in the city of Patras. The prevailing wisdom for such an urban area is that local transportation is the major source of PM2.5 and that the highest concentration levels are encountered in the city center in which the two regulatory monitors are located.
The analysis of the measurements of the low-cost sensor network indicated that the local sources are responsible for only 30% of the PM2.5 in the urban core, and the rest is transported to the city from other areas. The local contribution is even less (around 18%) during the warmer period extending from April to October but becomes a lot more important (around 52%) during the colder period and especially during the winter.
The second interesting finding from the network was that the highest PM2.5 concentrations are not found in the areas of the city center with the highest traffic density. During the warmer period, the highest levels are measured in an area of the city center with mostly pedestrian-only access but with the highest restaurant density in the city. This underlines the importance of cooking as a significant source of fine PM in this urban area. This finding is consistent with previous measurements in the same city (but in other locations) suggesting that cooking organic aerosol is a major component of fine PM both during the summer and during the winter. The peak average concentrations in this high-restaurant-density area (at around 20:00 LT) during the warmer period are more than twice the levels in all other areas of the city, suggesting that cooking is responsible for more than half of the peak PM2.5.
During the colder period, the highest PM2.5 levels were measured in stations in the southern urban and suburban parts of the city as well as in the high-restaurant-density area. This is consistent with biomass burning being the major local PM2.5 source during that period. The network suggests that the concentrations of biomass burning aerosol are highest in the south, probably because the emissions are higher in that area of the city.
Overall, the low-cost sensor network measurements suggested that the specific urban area has relatively low PM2.5 levels on average (9.4 μg m−3). However, there are significant problems during the winter nights in most of the city and especially the south due to wood burning and hot spots due to cooking emissions. While traffic emissions contribute to elevated PM2.5 levels, their contribution is 20% or less of the PM2.5 even in the city center where the highest traffic density can be found. This estimate is lower than the traffic contribution suggested in recent studies.
Our study demonstrates the utility of the establishment of such low-cost PM2.5 monitoring networks and suggests methods for quality control and quality assurance for the corresponding measurements as well as methods for the analysis and the interpretation of their measurements in an urban area. In the next step, the results of the measurement network will be combined with the predictions of a high-spatial-resolution chemical transport model.
Supplementary Materials
The following supporting information can be downloaded at: https://www.mdpi.com/article/10.3390/atmos13030440/s1, Figure S1: Average diurnal variation for each station during the colder (November–March) and warm period (April–October), Figure S2: Monthly average PM2.5 concentrations for the city of Patras, Greece during 02/2017–12/2019. These are calculated as the averages of all stations excluding the background measurements. Error bars correspond to one standard deviation of the daily average.
Author Contributions
Conceptualization, S.N.P. and A.K.; methodology, S.N.P., A.K., G.K. and V.S.; validation, S.N.P. and A.K.; data curation, G.K., V.S., A.M.; writing—original draft preparation, G.K. and V.S.; writing—review and editing, S.N.P., A.K.; supervision, S.N.P. and A.K.; funding acquisition, S.N.P. All authors have read and agreed to the published version of the manuscript.
Funding
We acknowledge the support of this work by the project “Smart Air Quality Monitoring (SmartAQM)”, funded by Western Greece’s Smart Specialisation Strategy (RIS3) 2014–2020, co-financed by Greece and the European Union and by the project “PANhellenic infrastructure for Atmospheric Composition and climatE change” (MIS 5021516) which is implemented under the Action “Reinforcement of the Research and Innovation Infrastructure”, funded by the Operational Programme “Competitiveness, Entrepreneurship and Innovation” (NSRF 2014–2020) and co-financed by Greece and the European Union (European Regional Development Fund).
Data Availability Statement
The data presented in this study are available on request from the corresponding author.
Conflicts of Interest
The authors declare no conflict of interest.
References
- Seinfeld, J.H.; Bretherton, C.; Carslaw, K.S.; Coe, H.; DeMott, P.J.; Dunlea, E.J.; Feingold, G.; Ghan, S.; Guenther, A.B.; Kahn, R.; et al. Improving our fundamental understanding of the role of aerosol-cloud interactions in the climate system. Proc. Natl. Acad. Sci. USA 2016, 113, 5781–5790. [Google Scholar] [CrossRef] [PubMed] [Green Version]
- Masson-Delmotte, V.; Zhai, P.; Pirani, A.; Connors, S.L.; Péan, C.; Berger, S.; Caud, N.; Chen, Y.; Goldfarb, L.; Gomis, M.I.; et al. Climate Change 2021: The Physical Science Basis; IPCC, 2021 Contribution of Working Group I to the Sixth Assessment Report of the Intergovernmental Panel on Climate Change Cambridge University Press; Cambridge University Press: Cambridge, UK, 2021; in press. [Google Scholar]
- Dominici, F.; Peng, R.D.; Bell, M.L.; Pham, L.; McDermott, A.; Zeger, S.L.; Samet, J.M. Fine particulate air pollution and hospital admission for cardiovascular and respiratory diseases. J. Am. Med. Assoc. 2006, 295, 1127–1134. [Google Scholar] [CrossRef] [PubMed] [Green Version]
- Pope, C.A.; Dockery, D.W. Health effects of fine particulate air pollution: Lines that connect. J. Air Waste Manag. Assoc. 2006, 56, 709–742. [Google Scholar] [CrossRef] [PubMed]
- Apte, J.S.; Marshall, J.D.; Cohen, A.J.; Brauer, M. Addressing global mortality from ambient PM2.5. Environ. Sci. Technol. 2015, 49, 8057–8066. [Google Scholar] [CrossRef] [PubMed]
- Kim, K.H.; Kabir, E.; Kabir, S. A review on the human health impact of airborne particulate matter. Environ. Int. 2015, 74, 136–143. [Google Scholar] [CrossRef] [PubMed]
- Song, C.; He, J.; Wu, L.; Jin, T.; Chen, X.; Li, R.; Ren, P.; Zhang, L.; Mao, H. Health burden attributable to ambient PM2.5 in China. Environ. Pollut. 2017, 223, 575–586. [Google Scholar] [CrossRef]
- Burnett, R.; Chen, H.; Szyszkowicz, M.; Fann, N.; Hubbell, B.; Pope, C.A.; Apte, J.S.; Brauer, M.; Cohen, A.; Weichenthal, S.; et al. Global estimates of mortality associated with longterm exposure to outdoor fine particulate matter. Proc. Natl. Acad. Sci. USA 2018, 115, 9592–9597. [Google Scholar] [CrossRef] [Green Version]
- Fu, P.; Guo, X.; Cheung, F.M.H.; Yung, K.K.L. The association between PM2.5 exposure and neurological disorders: A systematic review and meta-analysis. Sci. Total Environ. 2019, 655, 1240–1248. [Google Scholar] [CrossRef]
- Gao, M.; Cao, J.; Seto, E. A distributed network of low-cost continuous reading sensors to measure spatiotemporal variations of PM2.5 in Xi’an, China. Environ. Pollut. 2015, 199, 56–65. [Google Scholar] [CrossRef] [Green Version]
- Jiao, W.; Hagler, G.; Williams, R.; Sharpe, R.; Brown, R.; Garver, D.; Judge, R.; Caudill, M.; Rickard, J.; Davis, M.; et al. Community Air Sensor Network (CAIRSENSE) project: Evaluation of low-cost sensor performance in a suburban environment in the southeastern United States. Atmos. Meas. Tech. 2016, 9, 5281–5292. [Google Scholar] [CrossRef] [Green Version]
- Feinberg, S.N.; Williams, R.; Hagler, G.; Low, J.; Smith, L.; Brown, R.; Garver, D.; Davis, M.; Morton, M.; Schaefer, J.; et al. Examining spatiotemporal variability of urban particulate matter and application of high-time resolution data from a network of low-cost air pollution sensors. Atmos. Environ. 2019, 213, 579–584. [Google Scholar] [CrossRef] [PubMed]
- Johnston, S.J.; Basford, P.J.; Bulot, F.M.J.; Apetroaie-Cristea, M.; Easton, N.H.C.; Davenport, C.; Foster, G.L.; Loxham, M.; Morris, A.K.R.; Cox, S.J. City scale particulate matter monitoring using LoRaWAN based air quality IoT devices. Sensors 2019, 19, 209. [Google Scholar] [CrossRef] [PubMed] [Green Version]
- Lu, Y.; Giuliano, G.; Habre, R. Estimating hourly PM2.5 concentrations at the neighborhood scale using a low-cost air sensor network: A Los Angeles case study. Environ. Res. 2021, 195, 110653. [Google Scholar] [CrossRef] [PubMed]
- Giordano, M.R.; Malings, C.; Pandis, S.N.; Presto, A.A.; McNeill, V.F.; Westervelt, D.M.; Beekmann, M.; Subramanian, R. From low-cost sensors to high-quality data: A summary of challenges and best practices for effectively calibrating low-cost particulate matter mass sensors. J. Aerosol Sci. 2021, 158, 105833. [Google Scholar] [CrossRef]
- Pikridas, M.; Tasoglou, A.; Florou, K.; Pandis, S.N. Characterization of the origin of fine particulate matter in a medium size urban area in the Mediterranean. Atmos. Environ. 2013, 80, 264–274. [Google Scholar] [CrossRef]
- Manousakas, M.; Diapouli, E.; Papaefthymiou, H.; Kantarelou, V.; Zarkadas, C.; Kalogridis, A.C.; Karydas, A.G.; Eleftheriadis, K. XRF characterization and source apportionment of PM10 samples collected in a coastal city. X-ray Spectrom. 2018, 47, 190–200. [Google Scholar] [CrossRef]
- Merico, E.; Gambaro, A.; Argiriou, A.; Alebic-Juretic, A.; Barbaro, E.; Cesari, D.; Chasapidis, L.; Dimopoulos, S.; Dinoi, A.; Donateo, A.; et al. Atmospheric impact of ship traffic in four Adriatic-Ionian port-cities: Comparison and harmonization of different approaches. Transp. Res. Part D Transp. Environ. 2017, 50, 431–445. [Google Scholar] [CrossRef]
- Manousakas, M.I.; Florou, K.; Pandis, S.N. Source apportionment of fine organic and inorganic atmospheric aerosol in an urban background area in Greece. Atmosphere 2020, 11, 330. [Google Scholar] [CrossRef] [Green Version]
- Florou, K.; Papanastasiou, D.K.; Pikridas, M.; Kaltsonoudis, C.; Louvaris, E.; Gkatzelis, G.I.; Patoulias, D.; Mihalopoulos, N.; Pandis, S.N. The contribution of wood burning and other pollution sources to wintertime organic aerosol levels in two Greek cities. Atmos. Chem. Phys. 2017, 17, 3145–3163. [Google Scholar] [CrossRef] [Green Version]
- Kostenidou, E.; Kaltsonoudis, C.; Tsiflikiotou, M.; Louvaris, E.; Russell, L.M.; Pandis, S.N. Burning of olive tree branches: A major organic aerosol source in the Mediterranean. Atmos. Chem. Phys. 2013, 13, 8797–8811. [Google Scholar] [CrossRef] [Green Version]
- Papadakis, G.Z.; Megaritis, A.G.; Pandis, S.N. Effects of olive tree branches burning emissions on PM2.5 concentrations. Atmos. Environ. 2015, 112, 148–158. [Google Scholar] [CrossRef]
- Gerasopoulos, E.; Kouvarakis, G.; Babasakalis, P.; Vrekoussis, M.; Putaud, J.P.; Mihalopoulos, N. Origin and variability of particulate matter (PM10) mass concentrations over the Eastern Mediterranean. Atmos. Environ. 2006, 40, 4679–4690. [Google Scholar] [CrossRef]
- Dimitriou, K.; Kassomenos, P. Estimation of North African dust contribution on PM10 episodes at four continental Greek cities. Ecol. Indic. 2019, 106, 105530. [Google Scholar] [CrossRef]
- Argyropoulos, G.; Samara, C.; Diapouli, E.; Eleftheriadis, K.; Papaoikonomou, K.; Kungolos, A. Source apportionment of PM10 and PM2.5 in major urban Greek agglomerations using a hybrid source-receptor modeling process. Sci. Total Environ. 2017, 601, 906–917. [Google Scholar] [CrossRef]
- Kostenidou, E.; Florou, K.; Kaltsonoudis, C.; Tsiflikiotou, M.; Vratolis, S.; Eleftheriadis, K.; Pandis, S.N. Sources and chemical characterization of organic aerosol during the summer in the eastern Mediterranean. Atmos. Chem. Phys. 2015, 15, 11355–11371. [Google Scholar] [CrossRef] [Green Version]
- Siouti, E.; Skyllakou, K.; Kioutsioukis, I.; Ciarelli, G.; Pandis, S.N. Simulation of the cooking organic aerosol concentration variability in an urban area. Atmos. Environ. 2021, 265, 118710. [Google Scholar] [CrossRef]
- Zheng, T.; Bergin, M.H.; Johnson, K.K.; Tripathi, S.N.; Shirodkar, S.; Landis, M.S.; Sutaria, R.; Carlson, D.E. Field evaluation of low-cost particulate matter sensors in high-and low-concentration environments. Atmos. Meas. Tech. 2018, 11, 4823–4846. [Google Scholar] [CrossRef] [Green Version]
- Sayahi, T.; Butterfield, A.; Kelly, K.E. Long-term field evaluation of the Plantower PMS low-cost particulate matter sensors. Environ. Pollut. 2019, 245, 932–940. [Google Scholar] [CrossRef]
- Kosmopoulos, G.; Salamalikis, V.; Pandis, S.N.; Yannopoulos, P.; Bloutsos, A.A.; Kazantzidis, A. Low-cost sensors for measuring airborne particulate matter: Field evaluation and calibration at a South-Eastern European site. Sci. Total Environ. 2020, 748, 141396. [Google Scholar] [CrossRef]
- Stavroulas, I.; Grivas, G.; Michalopoulos, P.; Liakakou, E.; Bougiatioti, A.; Kalkavouras, P.; Fameli, K.M.; Hatzianastassiou, N.; Mihalopoulos, N.; Gerasopoulos, E. Field evaluation of low-cost PM Sensors (Purple Air PA-II) under variable urban air quality conditions, in Greece. Atmosphere 2020, 11, 926. [Google Scholar] [CrossRef]
- Wallace, L.; Bi, J.; Ott, W.R.; Sarnat, J.; Liu, Y. Calibration of low-cost PurpleAir outdoor monitors using an improved method of calculating PM2.5. Atmos. Environ. 2021, 256, 118432. [Google Scholar] [CrossRef]
- Levy Zamora, M.; Xiong, F.; Gentner, D.; Kerkez, B.; Kohrman-Glaser, J.; Koehler, K. Field and laboratory evaluations of the low-cost Plantower particulate matter sensor. Environ. Sci. Technol. 2019, 53, 838–849. [Google Scholar] [CrossRef] [PubMed]
- Diamantopoulou, M.; Skyllakou, K.; Pandis, S.N. Estimation of the local and long-range contributions to particulate matter levels using continuous measurements in a single urban background site. Atmos. Environ. 2016, 134, 1–9. [Google Scholar] [CrossRef]


Publisher’s Note: MDPI stays neutral with regard to jurisdictional claims in published maps and institutional affiliations. |
© 2022 by the authors. Licensee MDPI, Basel, Switzerland. This article is an open access article distributed under the terms and conditions of the Creative Commons Attribution (CC BY) license (https://creativecommons.org/licenses/by/4.0/).