
The Spatio-Temporal Influence of Atmospheric Circulations on Monthly Precipitation in Great Britain


Abstract
:1. Introduction
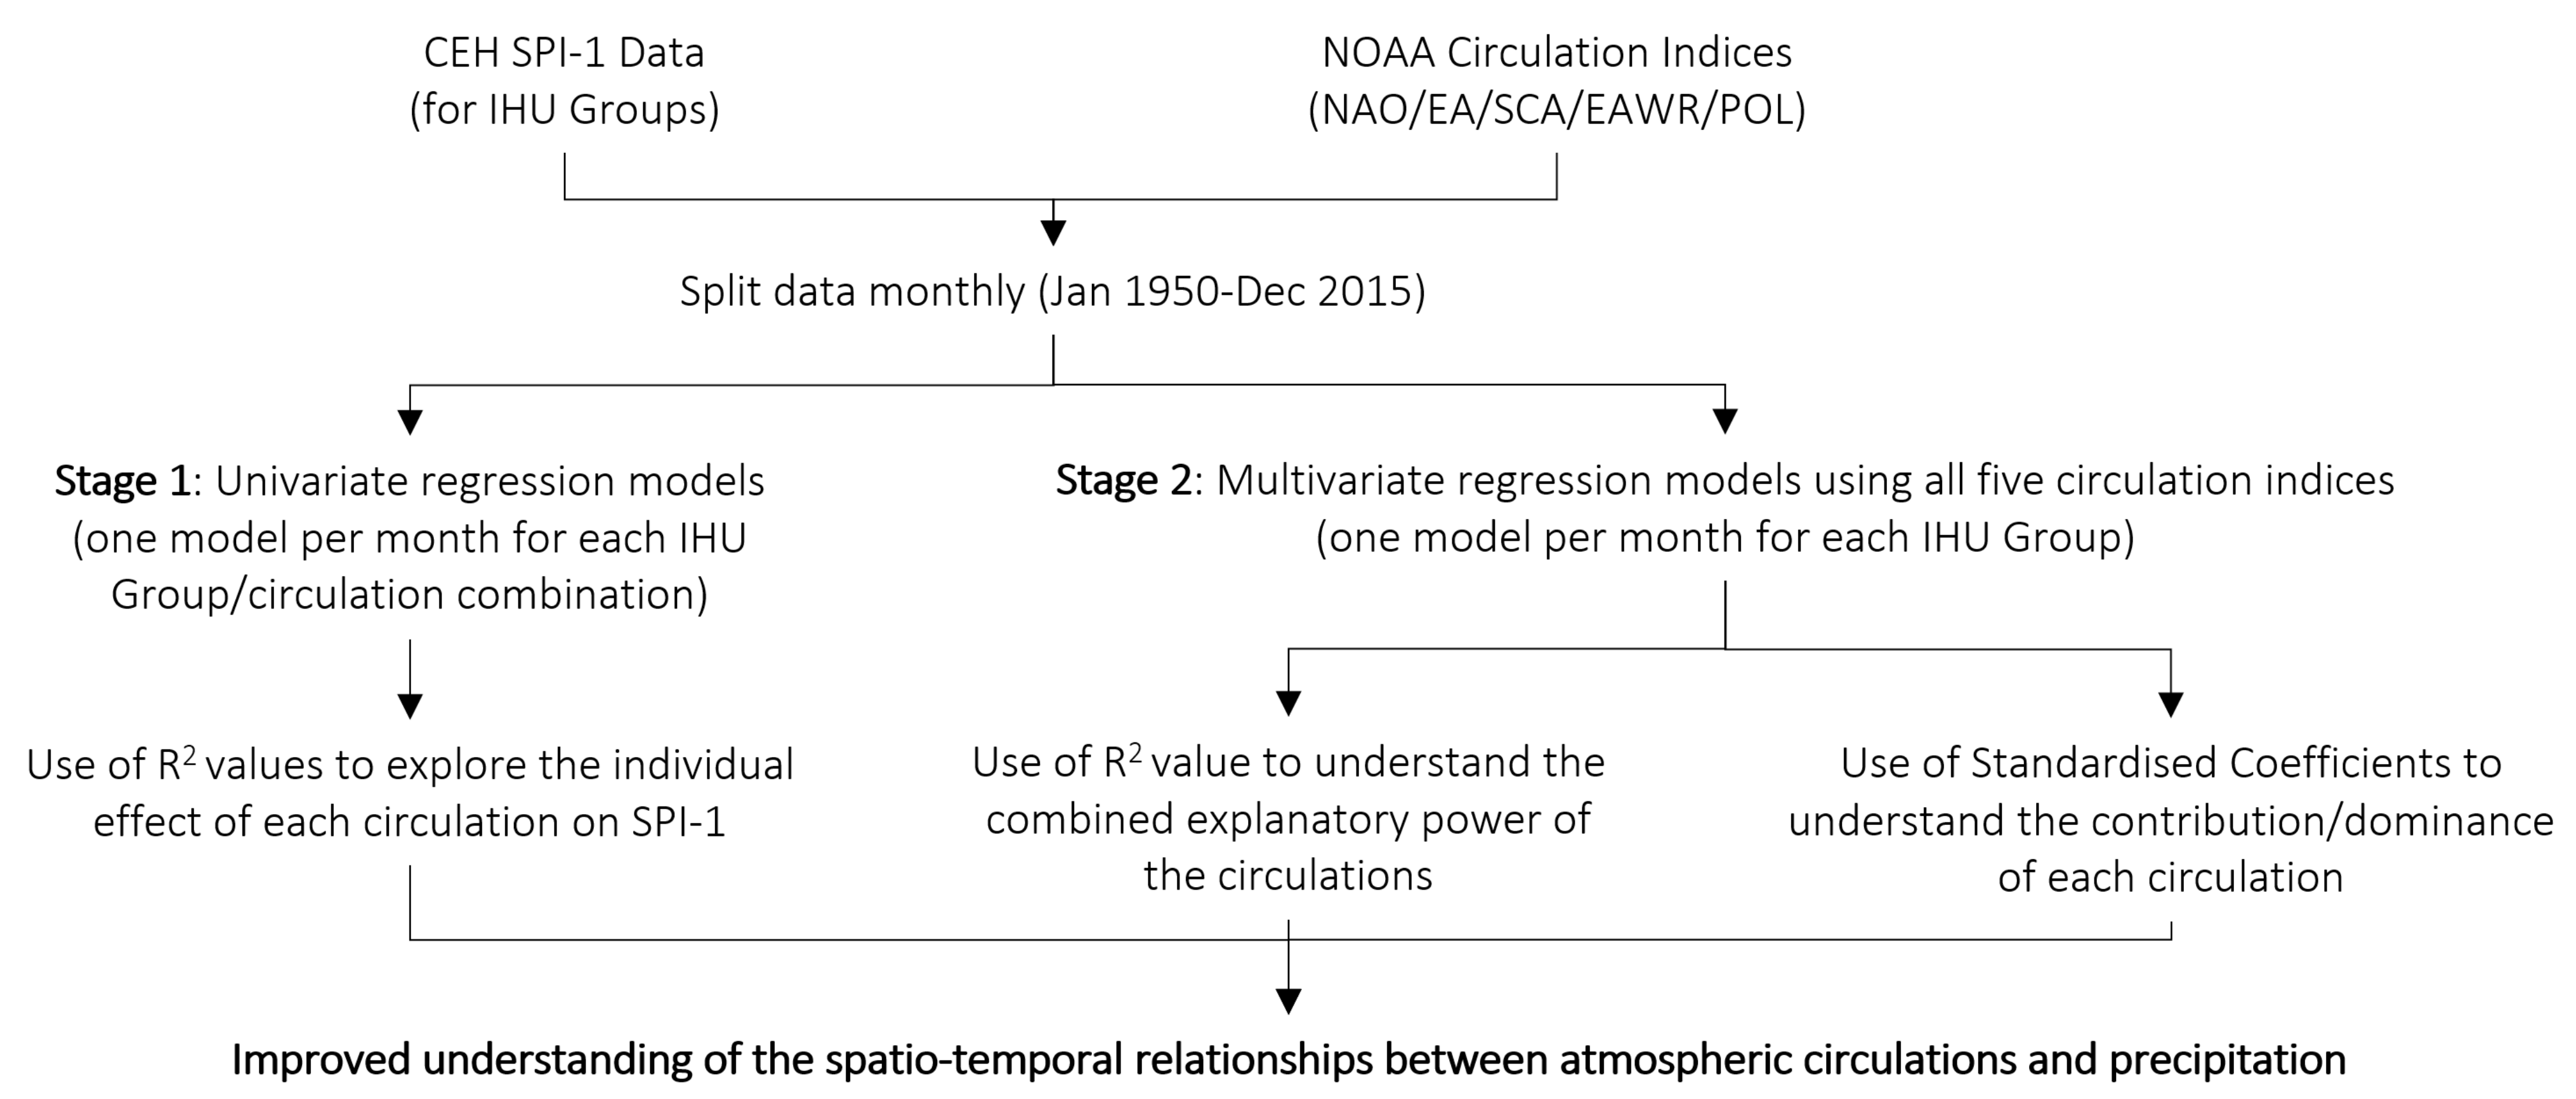
2. Methods
2.1. Data
2.2. Regression Analysis
3. Results
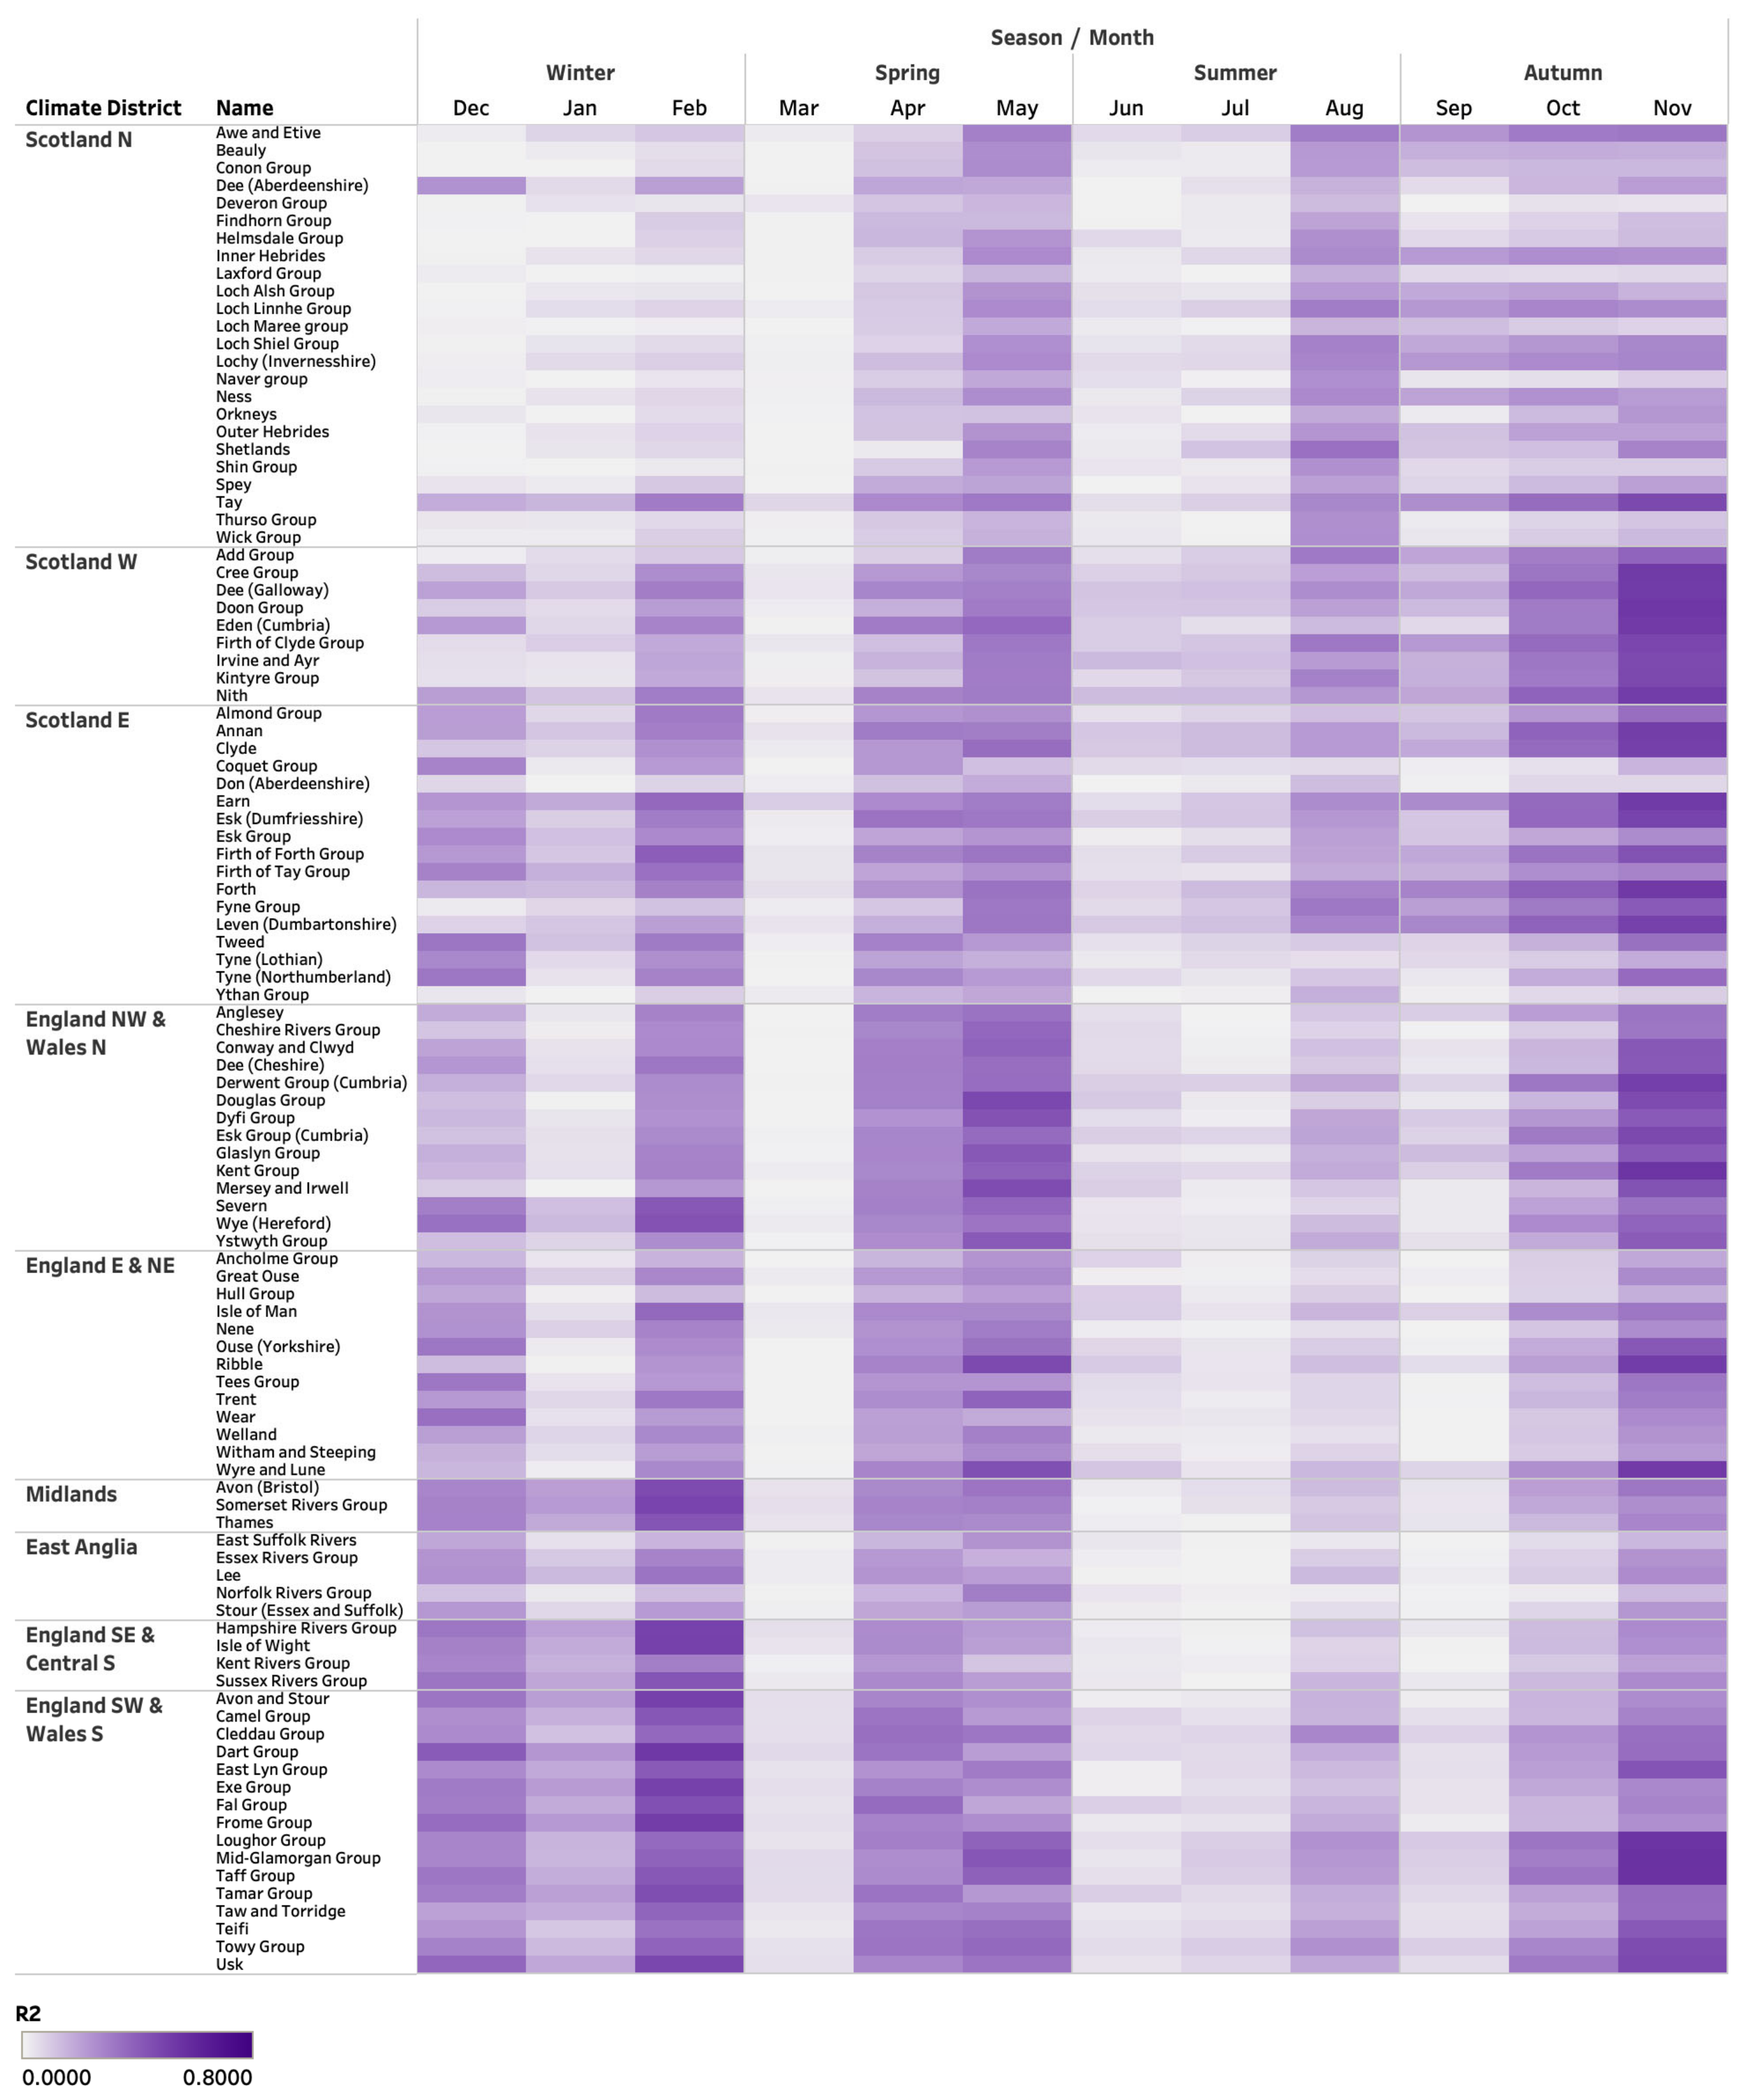
3.1. Univariate Regression Models
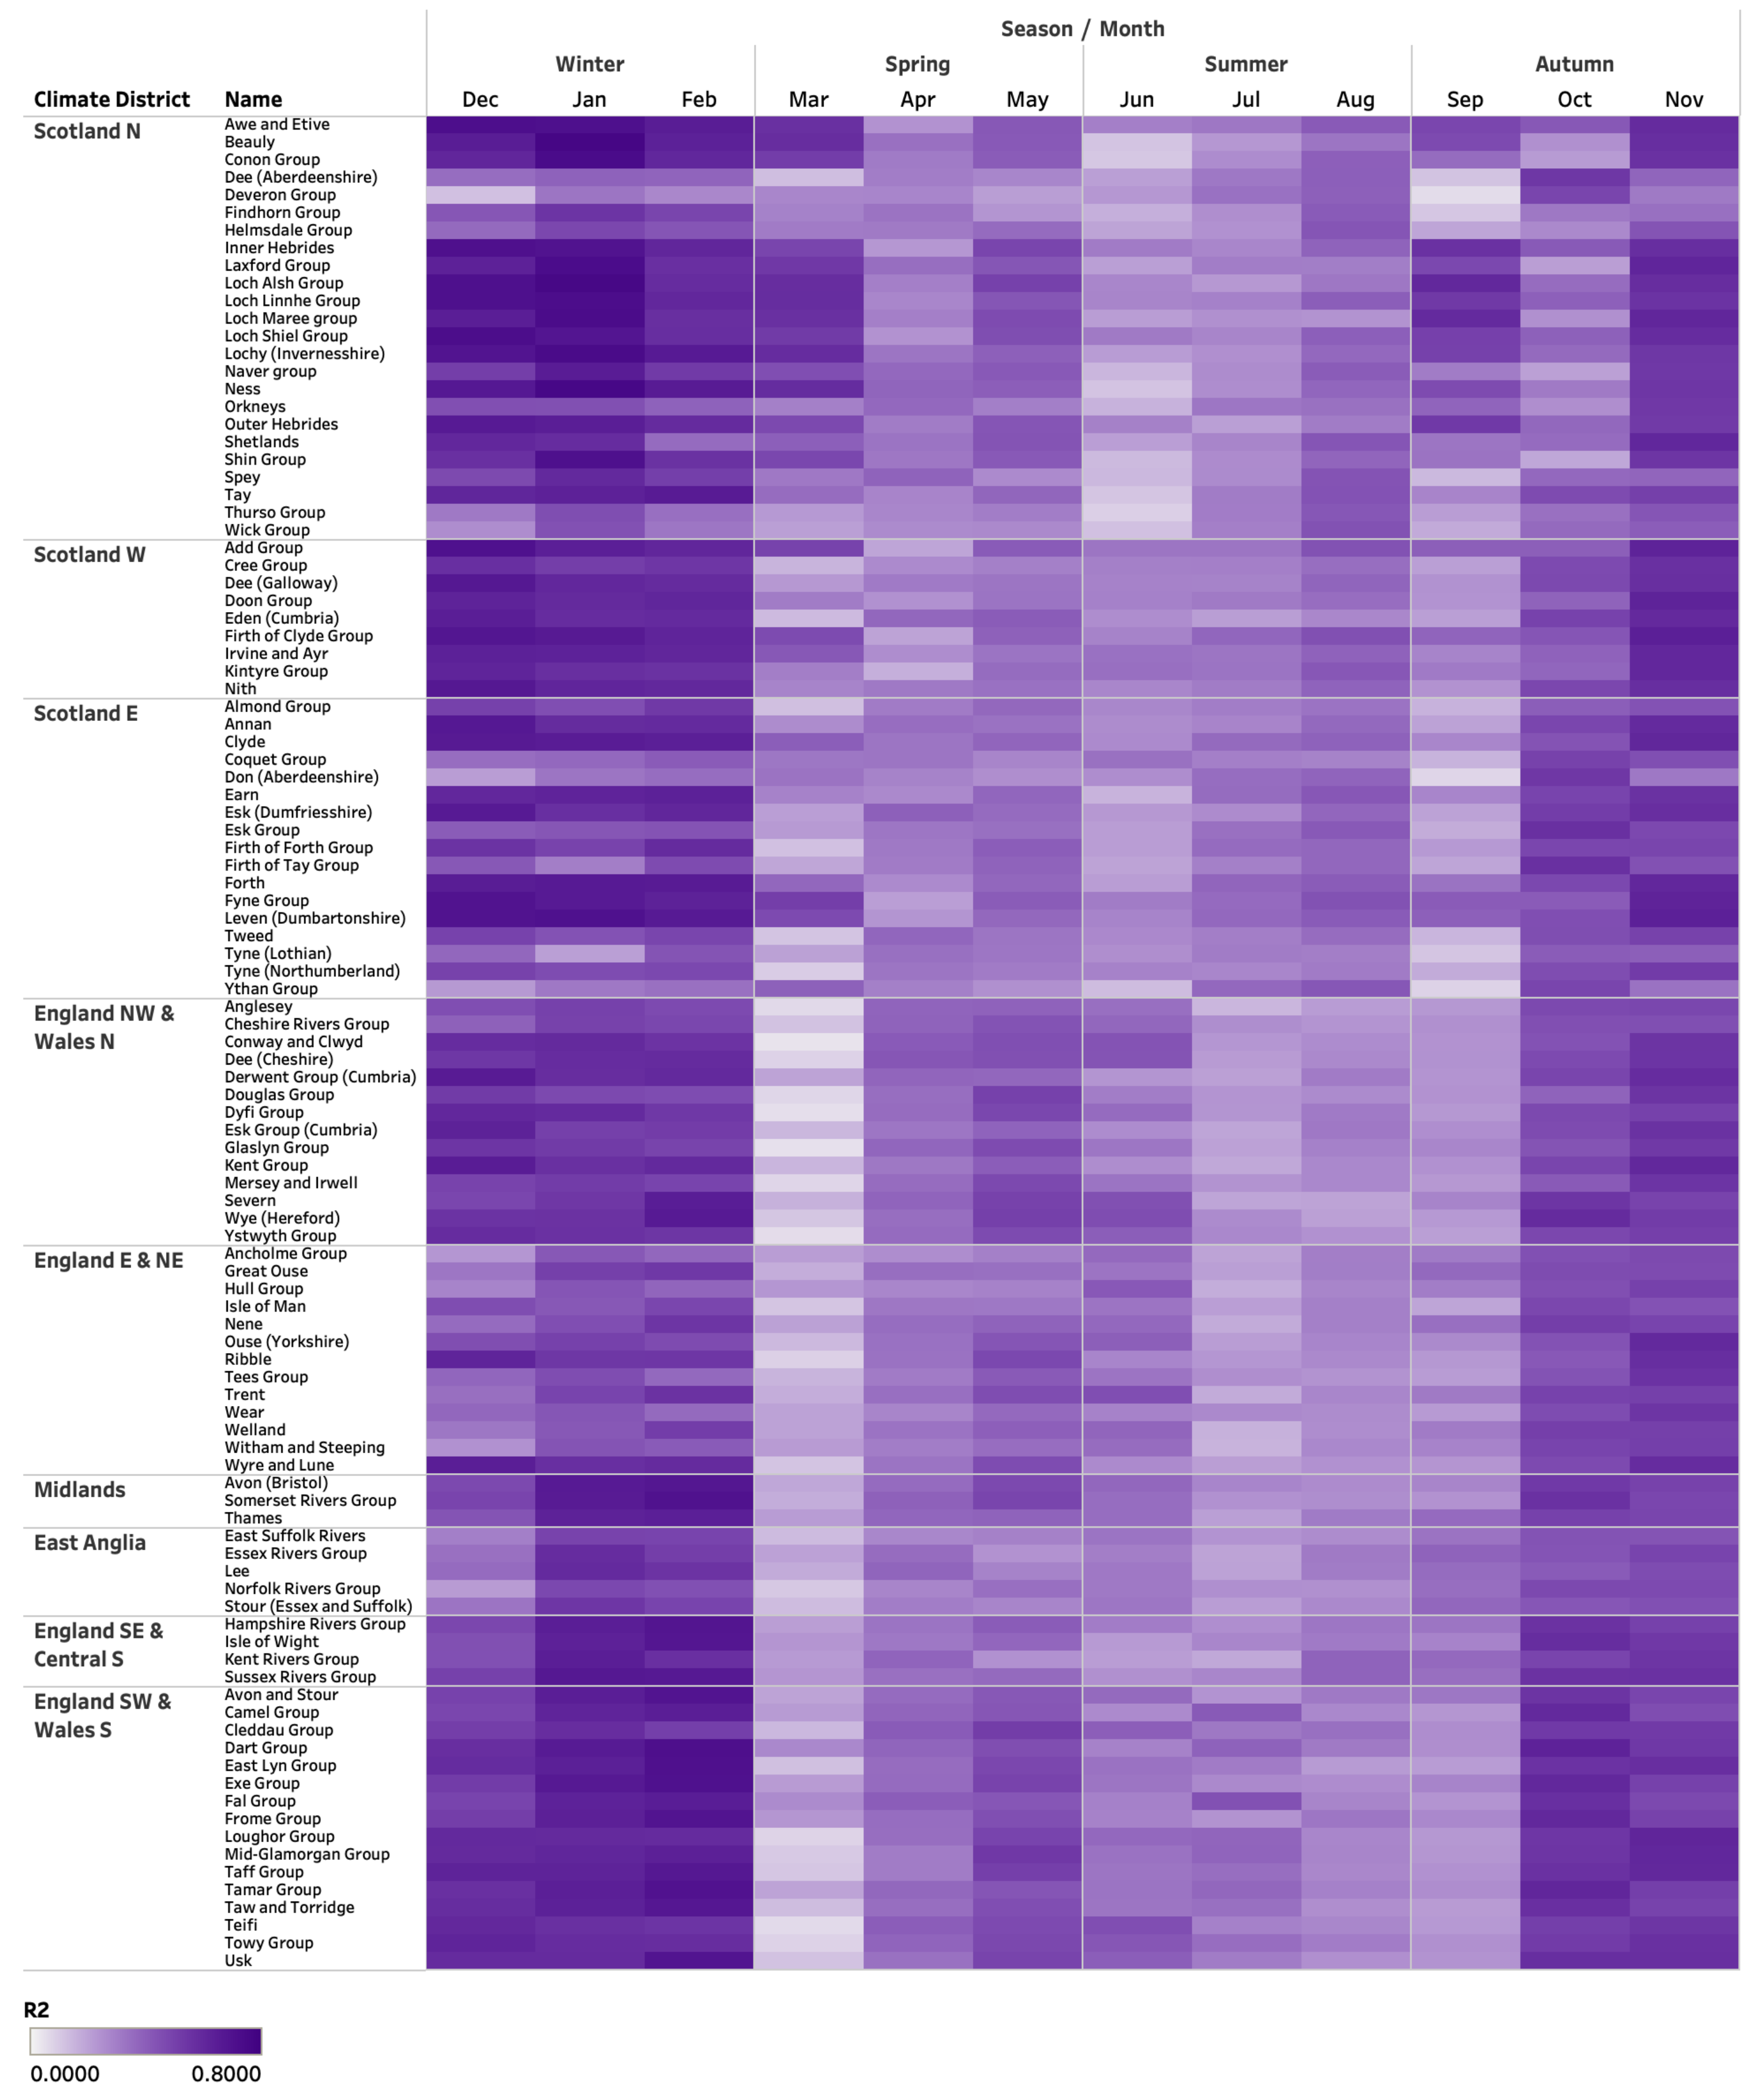
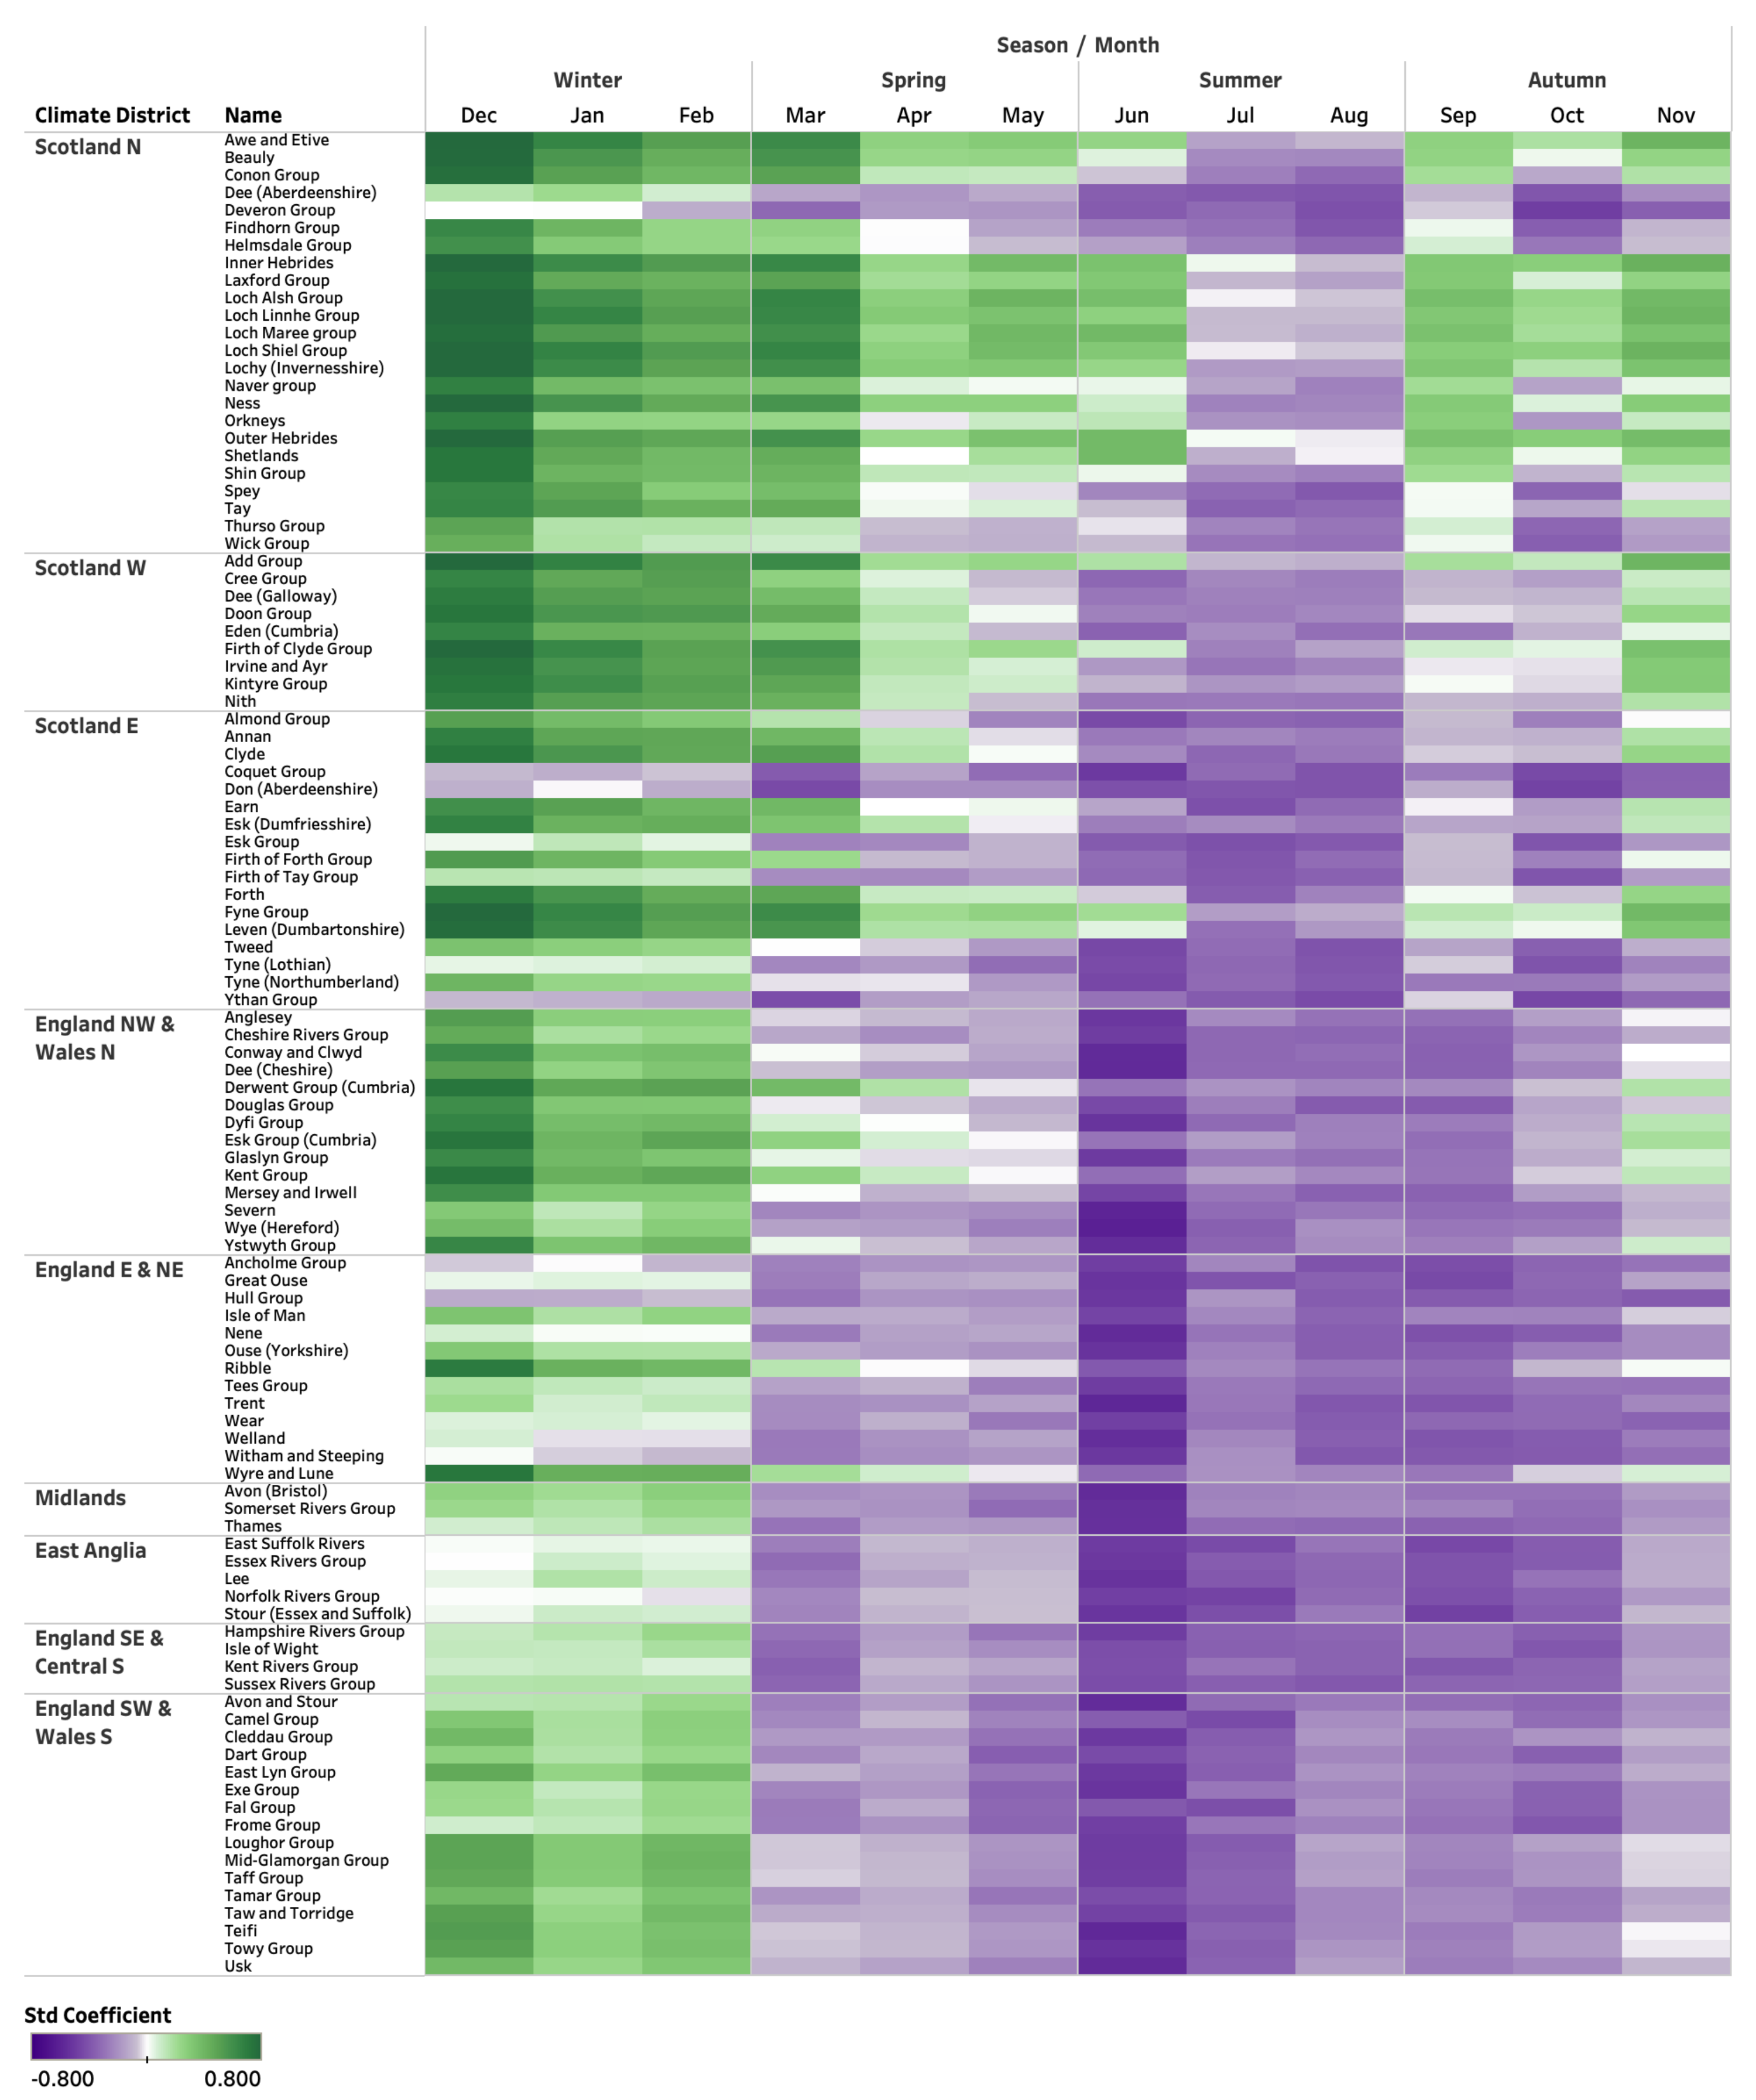
3.2. Mutlivariate Regression Model
4. Discussion
5. Conclusions
Author Contributions
Funding
Institutional Review Board Statement
Informed Consent Statement
Acknowledgments
Conflicts of Interest
Appendix A


References
- Barnston, A.G.; Livezey, R.E. Classification, seasonality and persistence of low-frequency atmospheric circulation patterns. Mon. Weather Rev. 1987, 115, 1083–1126. [Google Scholar] [CrossRef]
- Hurrell, J.W.; Van Loon, H. Decadal variations in climate associated with the North Atlantic Oscillation. Clim. Change 1997, 36, 301–326. [Google Scholar] [CrossRef]
- Rodwell, M.J.; Rowell, D.P.; Folland, C.K. Oceanic forcing of the wintertime North Atlantic Oscillation and European climate. Nature 1999, 398, 320–323. [Google Scholar] [CrossRef]
- Wilby, R.L.; O’Hare, G.; Barnsley, N. The North Atlantic Oscillation and British Isles climate variability. Weather 1997, 52, 266–276. [Google Scholar] [CrossRef]
- Folwer, H.J.; Kilsby, C.G. Precipitation and the North Atlantic Oscillation: A study of climate variability in Northern England. Int. J. Climatol. 2002, 22, 843–866. [Google Scholar]
- Rust, W.; Holman, I.; Corstanje, R.; Bloomfield, J.; Cuthbert, M. A conceptual model for climatic teleconnection signal control on groundwater variability in Europe. Earth-Sci. Rev. 2018, 177, 164–174. [Google Scholar] [CrossRef]
- Hurrell, J.W.; Kushnir, Y.; Ottersen, G.; Visbeck, M. (Eds.) An overview of the North Atlantic Oscillation. In The North Atlantic Oscillation: Climate Significance and Environmental Impact; AGU Physical Monograph Series: Washington, DC, USA, 2003; Volume 134. [Google Scholar]
- West, H.; Quinn, N.; Horswell, M. Regional rainfall response to the North Atlantic Oscillation (NAO) across Great Britain. Hydrol. Res. 2019, 50, 1549–1563. [Google Scholar] [CrossRef] [Green Version]
- Simpson, I.R.; Jones, P.D. Analysis of UK precipitation extremes derived from Met Office Gridded Data. Int. J. Climatol. 2014, 34, 2438–2449. [Google Scholar] [CrossRef]
- Hall, R.J.; Hanna, E. North Atlantic circulation indices: Links with summer and winter temperature and precipitation and implications for seasonal forecasting. Int. J. Climatol. 2018, 38, 660–667. [Google Scholar] [CrossRef]
- Folland, C.K.; Knight, J.; Linderholm, H.W.; Fereday, D.; Ineson, S.; Hurrell, J.W. The summer North Atlantic Oscillation: Past, present and future. J. Clim. 2009, 22, 1082–1103. [Google Scholar] [CrossRef]
- Kingston, D.G.; Lawler, M.; McGregor, G.R. Linkages between atmospheric circulation, climate and streamflow in the North Atlantic: Research prospects. Prog. Phys. Geogr. 2006, 30, 143–174. [Google Scholar] [CrossRef]
- Kingston, D.G.; Hannah, D.M.; Lawler, M.; McGregor, G.R. Climate-river flow relationships across montane and lowland environments in northern Europe. Hydrol. Process. 2009, 23, 985–996. [Google Scholar] [CrossRef]
- Wrzesinski, D.; Paluszkiewicz, R. Spatial differences in the impact of the North Atlantic Oscillation on the flow of rivers in Europe. Hydrol. Res. 2011, 42, 30–39. [Google Scholar] [CrossRef]
- Burt, T.; Howden, N. North Atlantic Oscillation amplifies orographic precipitation and river flow in upland Britain. Water Resour. Res. 2013, 49, 3504–3515. [Google Scholar] [CrossRef]
- Rust, W.; Cuthbert, M.; Bloomfield, J.; Corstanje, R.; Howden, N.; Holman, I. Exploring the role of hydrological pathways in modulating multi-annual climate teleconnection periodicities from UK rainfall to streamflow. Hydrol. Earth Syst. Sci. 2021, 25, 2233–2237. [Google Scholar] [CrossRef]
- West, H.; Quinn, N.; Horswell, M. Spatio-temporal propagation of North Atlantic Oscillation (NAO) rainfall deviations to streamflow in British catchments. Hydrol. Sci. J. 2022. [Google Scholar] [CrossRef]
- Lavers, D.; Hannah, D.M.; Bradley, C. Connecting large-scale atmospheric circulation, river flow and groundwater levels in a chalk catchment in southern England. J. Hydrol. 2015, 523, 179–189. [Google Scholar] [CrossRef]
- Rust, W.; Holman, I.; Bloomfield, J.; Cuthbert, M.; Corstanje, R. Understanding the potential of climate teleconnections to project future groundwater drought. Hydrol. Earth Syst. Sci. 2019, 23, 3233–3245. [Google Scholar] [CrossRef] [Green Version]
- Wilby, R.L.; Johnson, M.F. Climate Variability and Implications for Keeping Rivers Cool in England. Clim. Risk Manag. 2020, 30, 100259. [Google Scholar] [CrossRef]
- UK Hydrological Outlook. December 2020. Available online: http://www.hydoutuk.net/files/2816/0743/4122/2020_12_HO_Complete.pdf (accessed on 14 December 2020).
- Donegan, S.; Murphy, C.; Harrigan, S.; Broderick, C.; Golian, S.; Knight, J.; Matthews, T.; Prudhomme, C.; Quinn, D.F.; Scaife, A.A.; et al. Conditioning Ensemble Streamflow Prediction with the North Atlantic Oscillation improves skill at longer lead times. Hydrol. Earth Syst. Sci. 2021, 25, 4159–4183. [Google Scholar] [CrossRef]
- West, H.; Quinn, N.; Horswell, M. Spatio-Temporal Variability in North Atlantic Oscillation (NAO) Monthly Rainfall Signatures in Great Britain. Atmosphere 2021, 12, 763. [Google Scholar] [CrossRef]
- Smith, D.M.; Scaife, A.A.; Eade, R.; Athanasiadis, P.; Bellucci, A.; Bethke, I.; Bilbao, R.; Borchert, L.F.; Caron, L.-P.; Counillon, F.; et al. North Atlantic climate far more predictable than models imply. Nature 2020, 583, 796–800. [Google Scholar] [CrossRef] [PubMed]
- Athanasiadis, P.J.; Yeager, S.; Kwon, Y.-O.; Bellucci, A.; Smith, D.W.; Tibaldi, S. Decadal predictability of North Atlantic blocking and the NAO. NPJ Clim. Atmos. Sci. 2020, 3, 20. [Google Scholar] [CrossRef]
- Rust, W.; Bloomfield, J.; Cuthbert, M.; Corstanje, R.; Holman, I. Non-stationary control of the NAO on European rainfall and its implications for water resource management. Hydrol. Process. 2021, 35, e14099. [Google Scholar] [CrossRef]
- NOAA Climate Prediction Centre—Northern Hemisphere Teleconnections. Available online: https://www.cpc.ncep.noaa.gov/data/teledoc/telecontents.shtml (accessed on 16 January 2022).
- Casanueva, A.; Rodríguez-Puebla, C.; Frías, M.D.; González-Reviriego, N. Variability of extreme precipitation over Europe and its relationships with teleconnections patterns. Hydrol. Earth Syst. Sci. 2014, 18, 709–725. [Google Scholar] [CrossRef] [Green Version]
- Irannezhad, M.; Haghihgi, A.T.; Chen, D.; Kløve, B. Variability in dryness and wetness in central Finland and the role of teleconnection patterns. Theor. Appl. Climatol. 2015, 122, 471–486. [Google Scholar] [CrossRef]
- Bednorz, E.; Czernecki, B.; Tomczyk, A.M.; Półrolniczak, M. If not NAO then what? Regional circulation patterns governing summer air temperatures in Poland. Theor. Appl. Climatol. 2018, 136, 1325–1337. [Google Scholar] [CrossRef] [Green Version]
- Bednorz, E.; Tomczyk, A.M. Influence of macroscale and regional circulation patterns on low- and high-frequency sea level variability in the Baltic Sea. Theor. Appl. Climatol. 2021, 144, 115–125. [Google Scholar] [CrossRef]
- Amini, M.; Ghadami, M.; Fathian, F.; Modarres, R. Teleconnections between oceanic-atmospheric indices over Iran using quantile regressions. Hydrol. Sci. J. 2020, 65, 2286–2295. [Google Scholar] [CrossRef]
- Uvo, C.B.; Foster, K.; Olsson, J. The spatio-temporal influence of atmospheric teleconnection patterns on hydrology in Sweden. J. Hydrol. Reg. Stud. 2021, 34, 100782. [Google Scholar] [CrossRef]
- Moore, G.W.K.; Renfrew, I.A. Cold European winters: Interplay between the NAO and the East Atlantic mode. Atmos. Sci. Lett. 2012, 13, 1–8. [Google Scholar] [CrossRef]
- Mellado-Cano, J.; Barriopedro, D.; Garcia-Herrera, R.; Trigo, R.M.; Hernandez, A. Examining the North Atlantic Oscillation, East Atlantic Pattern jet variability since 1685. J. Clim. 2019, 32, 6285–6298. [Google Scholar] [CrossRef]
- Mikhailova, N.V.; Yurovsky, A.V. The East Atlantic Oscillation: Mechanism and Impact on the European Climate in Winter. Phys. Oceanogr. 2016, 2016, 25–33. [Google Scholar] [CrossRef] [Green Version]
- Maidens, A.; Knight, J.R.; Scaife, A.A. Tropical and stratospheric influences in winter atmospheric circulation patterns in the North Atlantic sector. Environ. Res. Lett. 2021, 16, 024035. [Google Scholar] [CrossRef]
- West, H.; Quinn, N.; Horswell, M. Monthly rainfall signatures of the North Atlantic Oscillation and East Atlantic Pattern in Great Britain. Atmosphere 2021, 12, 1533. [Google Scholar] [CrossRef]
- Moore, G.W.K.; Pikart, R.S.; Renfrew, I.A. Complexities in the climate of the subpolar North Atlantic: A case study from the winter of 2007. Q. J. R. Meteorol. Soc. 2011, 137, 757–767. [Google Scholar] [CrossRef]
- Moore, G.W.K.; Renfrew, I.A.; Pickart, R.S. Multidecadal mobility of the North Atlantic Oscillation. J. Clim. 2013, 26, 2453–2466. [Google Scholar] [CrossRef] [Green Version]
- Rodrigo, F.S. Exploring combined influences of seasonal East Atlantic (EA) and North Atlantic Oscillation (NAO) on the temperature-precipitation relationship in the Iberian Peninsula. Geosciences 2021, 11, 211. [Google Scholar] [CrossRef]
- Chen, M.; Papadikis, K.; Jun, C. An investigation on the non-stationarity of flood frequency across the UK. J. Hydrol. 2021, 597, 126309. [Google Scholar] [CrossRef]
- West, H.; Quinn, N.; Horswell, M. The Influence of the North Atlantic Oscillation & East Atlantic Pattern on Drought in British Catchments. Front. Environ. Sci. 2022. [Google Scholar] [CrossRef]
- Comas-Bru, L.; McDermott, F. Impacts of the EA and SCA patterns on the European twentieth century NAO–winter climate relationship. Q. J. R. Meteorol. Soc. 2014, 140, 354–363. [Google Scholar] [CrossRef]
- Bueh, C.; Nakamura, H. Scandinavian pattern and its climatic impact. Q. J. R. Meteorol. Soc. 2007, 133, 2117–2131. [Google Scholar] [CrossRef]
- Zubiate, L.; McDermott, F.; Sweeney, C.; O’Malley, M. Spatial variability in winter NAO-wind speed relationships in western Europe linked to concomitant states of the East Atlantic and Scandinavian Patterns. Q. J. R. Meteorol. Soc. 2017, 143, 552–562. [Google Scholar] [CrossRef] [Green Version]
- Krichak, S.O.; Alpert, P. Decadal trends of main Eurasian oscillations and the Mediterranean precipitation. Theor. Appl. Climatol. 2002, 72, 209–220. [Google Scholar] [CrossRef]
- Krichak, S.O.; Alpert, P. Decadal trends in the East Atlantic-West Russia Pattern and Mediterranean precipitation. Int. J. Climatol. 2005, 25, 183–192. [Google Scholar] [CrossRef]
- Caroletti, G.N.; Coscarelli, R.; Caloiero, T. A sub-regional approach to the influence analysis of teleconnection patterns on precipitation in Calabria (southern Italy). Int. J. Climatol. 2021, 41, 4574–4586. [Google Scholar] [CrossRef]
- Ionita, M. The impact of the East Atlantic/Western Russia Pattern on the hydroclimatology of Europe from mid-winter to late spring. Climate 2014, 2, 296–309. [Google Scholar] [CrossRef] [Green Version]
- Gao, N.; Bueh, C.; Xie, Z.; Gong, Y. A novel identification of the Polar/Eurasia Pattern and its weather impact in May. J. Meteorol. Res. 2019, 33, 810–825. [Google Scholar] [CrossRef]
- Balling, R.C., Jr.; Goodrich, G.B. Interannual variations in the local spatial autocorrelation of tropospheric temperatures. Theor. Appl. Climatol. 2011, 103, 451–457. [Google Scholar] [CrossRef]
- Pokorna, L.; Huth, R. Climate impacts of the NAO are sensitive to how the NAO is defined. Theor. Appl. Climatol. 2015, 119, 639652. [Google Scholar] [CrossRef]
- Tanguy, M.; Fry, M.; Svensson, C.; Hannaford, J. Historic Standardised Precipitation Index time series for IHU Groups (1862–2015). NERC Environ. Inf. Cent. 2017. [Google Scholar] [CrossRef]
- Chun, K.P.; Dieppois, B.; Qing, H.; Sidibe, M.; Eden, J.; Paturel, J.-E.; Mahe, G.; Rouche, N.; Klaus, J.; Conway, D. Identifying drivers of streamflow extremes in West Africa to inform a nonstationary prediction model. Weather Clim. Extrem. 2021, 33, 100346. [Google Scholar] [CrossRef]
- Spencer, M.; Essery, R. Scottish snow cover dependence on the North Atlantic Oscillation index. Hydrol. Res. 2016, 47, 619–629. [Google Scholar] [CrossRef] [Green Version]


Publisher’s Note: MDPI stays neutral with regard to jurisdictional claims in published maps and institutional affiliations. |
© 2022 by the authors. Licensee MDPI, Basel, Switzerland. This article is an open access article distributed under the terms and conditions of the Creative Commons Attribution (CC BY) license (https://creativecommons.org/licenses/by/4.0/).
Share and Cite
West, H.; White, P.; Quinn, N.; Horswell, M. The Spatio-Temporal Influence of Atmospheric Circulations on Monthly Precipitation in Great Britain. Atmosphere 2022, 13, 429. https://doi.org/10.3390/atmos13030429
West H, White P, Quinn N, Horswell M. The Spatio-Temporal Influence of Atmospheric Circulations on Monthly Precipitation in Great Britain. Atmosphere. 2022; 13(3):429. https://doi.org/10.3390/atmos13030429
Chicago/Turabian StyleWest, Harry, Paul White, Nevil Quinn, and Michael Horswell. 2022. "The Spatio-Temporal Influence of Atmospheric Circulations on Monthly Precipitation in Great Britain" Atmosphere 13, no. 3: 429. https://doi.org/10.3390/atmos13030429
APA StyleWest, H., White, P., Quinn, N., & Horswell, M. (2022). The Spatio-Temporal Influence of Atmospheric Circulations on Monthly Precipitation in Great Britain. Atmosphere, 13(3), 429. https://doi.org/10.3390/atmos13030429