Article

Assessment of Climate-Driven Variations in Malaria Transmission in Senegal Using the VECTRI Model

1
Laboratoire des Sciences de l’Atmosphère et de l’Océan, Unité de Formation et de Recherche de Sciences Appliquées et de Technologie, Université Gaston Berger de Saint-Louis, BP 234, Saint-Louis 32000, Senegal
2
Laboratoire de Physique de l’Atmosphère et de l’Océan–Siméon Fongang, Ecole Supérieure Polytechnique de l’Université Cheikh Anta Diop (UCAD), BP 5085 Dakar-Fann, Dakar 10700, Senegal
3
Programme National de Lutte contre le Paludisme (PNLP), BP 25 270 Dakar-Fann, Dakar 10700, Senegal
*
Author to whom correspondence should be addressed.
Atmosphere 2022, 13(3), 418; https://doi.org/10.3390/atmos13030418
Submission received: 28 December 2021 / Revised: 10 February 2022 / Accepted: 26 February 2022 / Published: 3 March 2022
(This article belongs to the Special Issue Extreme Weather, Air Pollution, and Human Health)

Abstract

:
Several vector-borne diseases, such as malaria, are sensitive to climate and weather conditions. When unusual conditions prevail, for example, during periods of heavy rainfall, mosquito populations can multiply and trigger epidemics. This study, which consists of better understanding the link between malaria transmission and climate factors at a national level, aims to validate the VECTRI model (VECtor borne disease community model of ICTP, TRIeste) in Senegal. The VECTRI model is a grid-distributed dynamical model that couples a biological model for the vector and parasite life cycles to a simple compartmental Susceptible-Exposed-Infectious-Recovered (SEIR) representation of the disease progression in the human host. In this study, a VECTRI model driven by reanalysis data (ERA-5) was used to simulate malaria parameters, such as the entomological inoculation rate (EIR) in Senegal. In addition to the ERA5-Land daily reanalysis rainfall, other daily rainfall data come from different meteorological products, including the CPC Global Unified Gauge-Based Analysis of Daily Precipitation (CPC for Climate Prediction Center), satellite data from the African Rainfall Climatology 2.0 (ARC2), and the Climate Hazards InfraRed Precipitation with Station data (CHIRPS). Observed malaria data from the National Malaria Control Program in Senegal (PNLP/Programme National de Lutte contre le Paludisme au Senegal) and outputs from the climate data used in this study were compared. The findings highlight the unimodal shape of temporal malaria occurrence, and the seasonal malaria transmission contrast is closely linked to the latitudinal variation of the rainfall, showing a south–north gradient over Senegal. This study showed that the peak of malaria takes place from September to October, with a lag of about one month from the peak of rainfall in Senegal. There is an agreement between observations and simulations about decreasing malaria cases on time. These results indicate that the southern area of Senegal is at the highest risk of malaria spread outbreaks. The findings in the paper are expected to guide community-based early-warning systems and adaptation strategies in Senegal, which will feed into the national malaria prevention, response, and care strategies adapted to the needs of local communities.

1. Introduction

Studies have highlighted the impact of climate variability and change on malaria transmission. Malaria is a disease that is constantly changing. Malaria affects the health and wealth of nations and individuals. In Africa today, malaria is understood to be a disease of poverty and a cause of poverty [1]. Malaria has significant measurable direct and indirect costs and has been shown to be a major constraint to economic development [2]. This means the gap in prosperity between countries with malaria and countries without malaria has become wider every year. Climate variables can affect the malaria incidences by affecting the life cycle of mosquito development and the parasite in the mosquitoes. Changes in temperature and precipitation patterns lead to variations in many diseases that are very sensitive to meteorological parameters [3]. The existence and spread of many human and animal diseases are determined by climate change. Scientific studies have supported that the global warming phenomena observed over the past twenty years have anthropogenic origins [4,5]. Therefore, this anthropogenic climate change will have significant consequences, especially on humans, whose lives are partly influenced by the climate [6]. Environmental factors appear to cause effects on vectors, such as mosquitoes and pathogens. Female mosquitoes are Anopheles species (hereafter An. spp.). Precipitation sets the transmission season based on the breeding sites provided for mosquito vectors of the disease, while temperature impacts the life cycles of larval vectors and adults [3]. The leading players responsible for the transmission of parasites are sensitive to climatic variables, as is the plasmodium parasite, which causes the disease [7]. Climatic factors are an important determinant of various vector-borne diseases. The epidemiology of vector-borne diseases, including malaria, is impacted by climate change. A potential change in the transmission season of some major vector-borne diseases and their geographic distribution caused by climate change is expected in the coming years [8]. It is a disease with distinct environmental factors that make it susceptible to climate change. The link between climate and malaria transmission is essential in Africa more precisely in Senegal, which is classified among the countries of Sub-Saharan Africa (SSA) where malaria is endemic.
Malaria, a vector-borne disease, is closely linked to the climate. Carried by the anopheles mosquito, despite great developments in human healthcare, malaria still cause significant morbidity and mortality in sub-Saharan Africa and worldwid. This disease is one of the leading causes of infant mortality [3,9]. Nowadays, malaria is only rife in the tropics and subtropics. In developing countries, populations without immunity are more prone to epidemics when malaria transmission is favored by weather conditions (WHO, 2004) [10]. Malaria is a significant health problem. Beyond health, malaria has an economic, social, and environmental impact. The WHO, in its 2018 report, estimated that in 2016, 90% of the 200 million infections and 91% of the 455,000-annual malaria-related deaths are found in sub-Saharan Africa, mainly amongst children under five years old (WHO, 2018). Additionally, 25% of household income and 40% of public health expenditures are attributed to malaria. Climate change can influence malaria outbreaks by favoring the abundance of mosquitoes’ vectors and the survival of pathogens outside the host, as well as the migration of people implied by social-economic issues [7]. Knowledge of this link becomes imperative since malaria, being a vector-borne disease, sees its existence and transmission ensured by the parasite (Plasmodium), the vector (Anopheles female), and the human host (Man). Malaria is a vector-borne disease, which refers most commonly to infections transmitted by the bite of blood-sucking arthropods, such as mosquitoes or ticks, and requires three essential factors for its existence and transmission: Plasmodium parasites, mosquito vectors, and human hosts [5,6]. Further, an understanding of the link between each of these components and climate and climate variability becomes crucial.
Climate and biological models are generally needed to make historical studies and projections in the climate–health field. Some climatic conditions favor the survival and reproduction of vectors, pathogens, and hosts. These dynamic mathematical models based on the climate process use equations. These equations, explained by scientific papers and research, show the relationship between climatic variables and biological parameters, i.e., the reproduction, survival, and biting rates of the vector, and the incubation rate of the parasite (WHO, 2004) [10,11,12]. Some case studies have already focused on climate-dependent pathologies, namely malaria. These models provide a better understanding of the relative roles of climate variability and the population effects in malaria transmission. In recent years, the results obtained by malaria models on the disease, such as the Liverpool Malaria Model (LMM, [13]) and the Hydrology, Entomology, and Malaria Transmission Simulator (HYDREMATS, [14,15]), thanks to large-scale research projects, have made it possible to review the understanding of climatic and environmental conditions from emergence to their modeling [16,17,18]. These models reflect how climate variables will affect the biology of the vector and the parasite and, therefore, the transmission of the disease. In addition, previous works that examined the impact of climatic and environmental factors on seasonal malaria transmission in sub-Saharan Africa using EIR as a metric are scarce. The authors of [19] came close to this subject but used a seasonality index [20] that is deficient in irrigated and bimodal rainfall areas. Moreover, they used EIR data from different climate settings in their analysis without decoupling their effect. Conversely, malaria cases or prevalence data are unsuitable for linking factors of climate and environment to seasonal malaria since they are aggregates of different temporal transmission windows [21]. Further, humans’ health-seeking behavior and health policies differ [22]. However, unlike in clinical cases, EIR directly quantifies parasite-infected mosquitoes and their propensity to transmit the parasites to humans. Similarly, EIR determinants (i.e., human-biting rate (HBR) and circumsporozoite protein rate (CSPR)) are dependent on conditions of the climate and environment [23,24,25]. EIR estimates, therefore, can directly relate the human-biting activity of Anopheles vectors and the risk to humans of malaria infections to the climate and environment [26]. The added value of the VECtor borne disease community model of ICTP, TRIeste (VECTRI) compared to LMM is that the VECTRI calibration takes into account hydrology, evaporation, infiltration, and population migration. There is also the fact that this is a dynamic biological model, unlike the simple statistical approaches that other authors sometimes use to simulate malaria transmission.
This study enhances our understanding of the link between malaria transmission and climate at the national level and validates the VECTRI model over Senegal. Although several studies have been published on the relationship between climate parameters and malaria transmission using the VECTRI model, the potential of this biological model remains unexplored in SSA, mainly in Senegal, especially with validation. This model is a research tool for understanding the causes of malaria transmission. It is a malaria model that is available and that considers the climate and population density to simulate malaria transmission on a regional scale. The VECTRI model is a dynamic model distributed by a grid. It couples a biological model for the vector and parasite life cycles to a Susceptible-Exposed-Infectious-Coated (SEIR) simple compartmental representation of disease progression in the human host.
The present work is organized as follows: Section 2 outlines the malaria surveillance data, the climatic data used, and the applied methods. Section 3 investigates the spatio-temporal variability of climate variables, including confirmed malaria cases, simulation data (EIR) with the VECTRI model, and, finally, data from comparing observations and data from the VECTRI model. Lastly, a summary and discussion of the main findings are provided in Section 4.

2. Materials and Methods

2.1. Study Area

This study focuses on Senegal, located between the latitudes 12°–17° N and the longitudes 18°–11° W (Figure 1). Senegal is the westernmost African country with an estimated 196,712 km2. Senegalese territory is limited to the north by Mauritania, to the east by Mali, and to the south by Guinea Conakry and Guinea Bissau. The Republic of Gambia, which occupies the entire lower course of the river of the same name, constitutes an enclave 25 km wide and nearly 300 km deep within Senegalese territory. Senegal is a country in sub-Saharan Africa with a Sudano-Sahelian climate. The climate is tropical in the south and semi-desert in the north; it is characterized by the alternation of a dry season from November to mid-June and a humid and hot season from mid-June to October. The annual average rainfall follows a decreasing gradient from the south to the north of the country. It goes from 1200 mm in the south to 300 mm in the north, with variations from year to year. The two distinct seasons, known as the wet and dry seasons, result from the interaction of two migrating air masses: the hot, dry tropical continental air mass and the moisture-laden, tropical maritime or equatorial air mass. Malaria is one of the leading public health burdens thanks to the ambient environment created by the uniform high sunshine, high temperatures, and rainfall that characterize the region all year round. The area of study is shown in Figure 1. Table 1 summarizes the different climatic and health datasets used in this study.

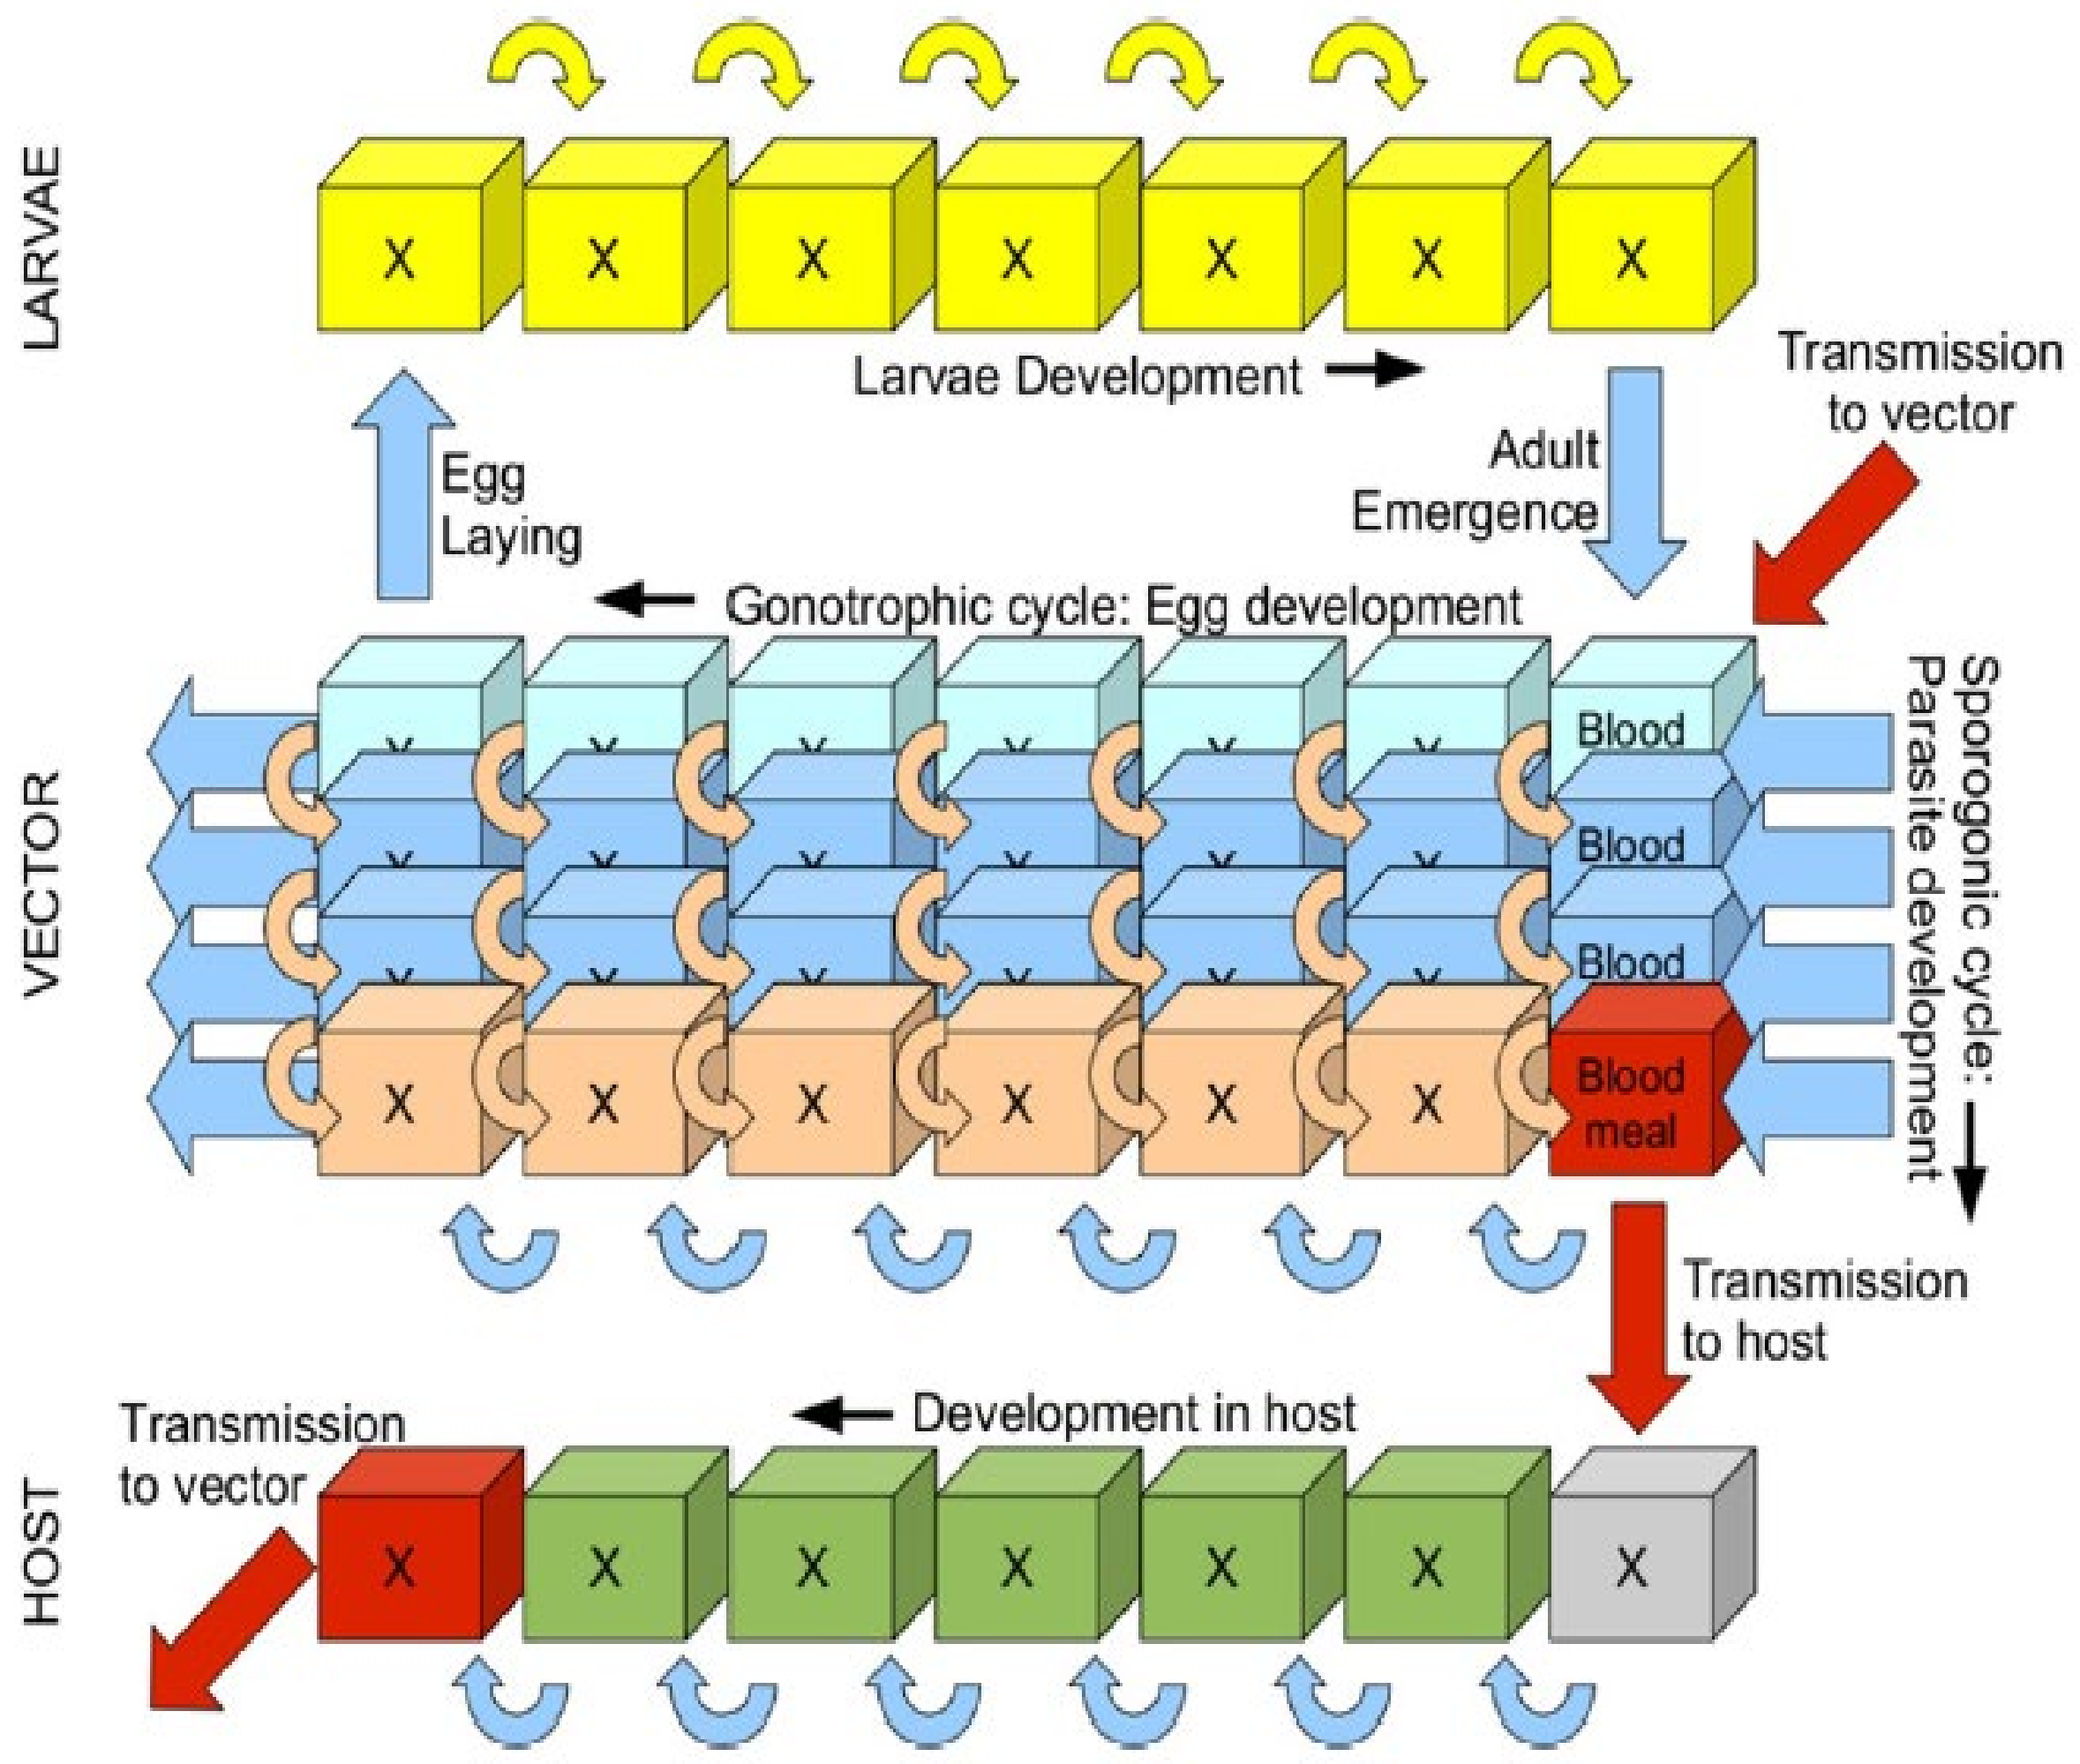
2.2. VECTRI Malaria Model

VECTRI (VECtor Borne Disease Community Model of ICTP, TRIeste), developed by the Abdus Salam International Centre for Theoretical Physics (ICTP), is an open-source dynamic mathematical model distributed by grid points that simulate the transmission of malaria with a daily integration time step. The VECTRI_v1.6 version is used in this study (Figure 2). VECTRI couples a biological model for the vector and parasite life cycles to a simple compartmental Susceptible-Exposed-Infectious-Recovered (SEIR) representation of the disease progression in the human host. It considers the impact of temperature and rainfall variability on the development cycles of the malaria vector in the larval and adult stages and the parasite itself. VECTRI presents specific dynamic equations for temperature sensitive cycles in malaria transmission. Each cycle (sporogonic and gonotrophic cycle) is divided into bins to solve the respective processes to model the lag of the malaria season relative to the precipitation cycle (Figure 2). The effects of rainfall on transmission are represented by a simple physical model of surface pool hydrology. Low rainfall rates tend to increase the mosquitoes’ likelihood available in the breeding sites, while heavy rains reduce larvas at their early stage by flushing. At the same time, heavy rains reduce the rate of rainfall larvae at an early stage by flushing [7]. The VECTRI considers human population density when calculating bite rates. Higher population densities result in a dilution effect resulting in lower parasite ratios (PR) in urban and peri-urban areas compared to nearby rural areas. In this regard, the model can replicate the reduction in entomological inoculation rates (EIR) and prevalence (PR) with increasing population density, which has been widely observed in field observations in Africa [27]. The model is designed for regional to continental scales with high spatial resolutions ranging from 5 to 10 km. VECTRI has the particularity to incorporate interactions between the human host (H) and vectors using the human-biting rate (hbr), which can be expressed as follows in Equation (1) [28]:
hbr = 1 exp H τ zoo j = 1 N sporo V 1 , j H
where the factor 1 exp H τ zoo represents the level of vector zoophily. The exponential factor reflects this, with the e-folding population density for effect set to τzoo = 50 km−2. The vector status is also bin resolved, consisting of two properties: the gonotrophic and sporogonic cycles. It is thus represented as a two-dimensional array V(Ngono, Nsporo). All vectors in the first gonotrophic bin j = 1 N sporo V 1 , j are in meal-searching mode.
The probability of transmission for an infectious vector to the host after a single bite is noted as Pvh. If its value is assumed constant, then the probability of transmission for an individual receiving n infectious bites is given by 1 − (1 − Pvh)n. The daily overall transmission probability per person is then expressed as follows [28]:
P v h = n = 1 G EIR 1   1 P vh n
where GEIR is the Poisson distribution for the mean EIR. EIR is the daily number of infectious bites by infectious vectors and is calculated as the product of the human-biting rate (hbr) and the circumsporozoite protein rate (CSPR). Equation (2) is likely to be modified if one considers factors, such as bed nets usage, that fluctuate with the biting rate. Generally, the population host must assume the infective status about 20 days after infection [29]. The calculation of PR and EIR relies both on Equations (1) and (2) of the VECTRI model. For more details on the mathematical framework of the model and its evaluation, see [28].
Studies on climate and health have widely used VECTRI simulations in many African countries, including Kenya [30], Uganda [31], and elsewhere, such as in Greece [32]. More recently, the VECRTRI model was used in India by Shweta Chaturvedi and Suneet Dwivedi in 2021 [33].

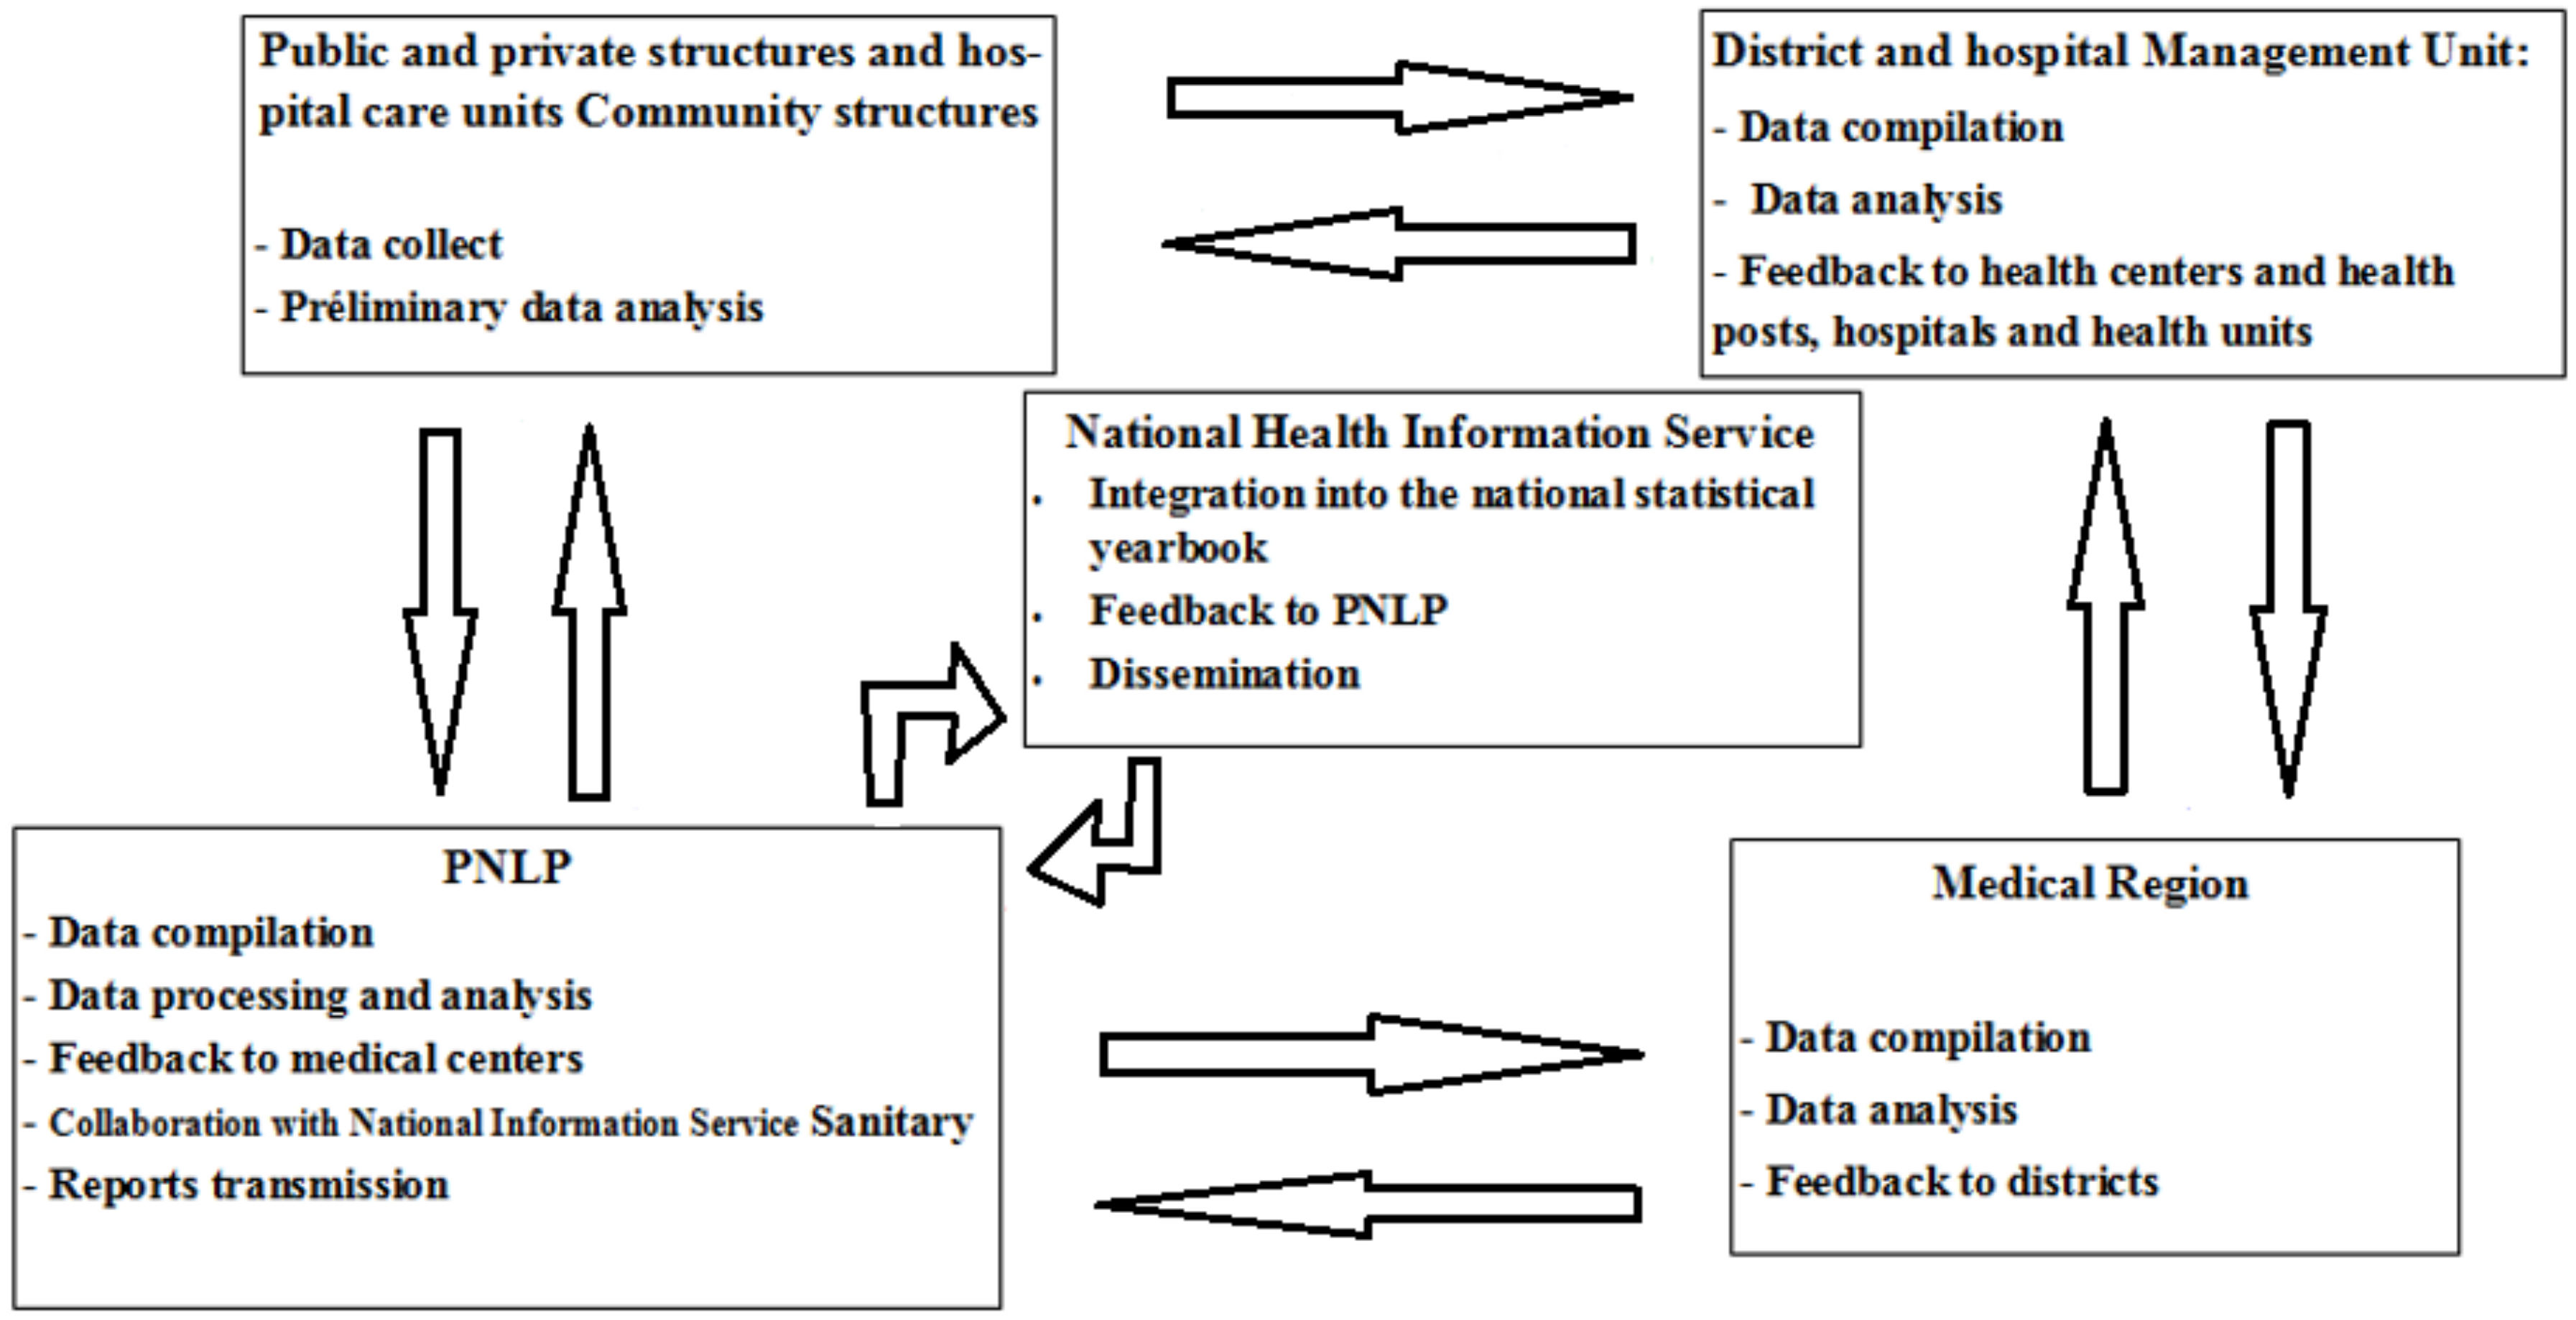
2.3. Malaria Data Surveillance

The clinical data correspond to the number of observed malaria cases obtained from the PNLP (Programme National de Lutte contre le Paludisme au Senegal; NMCP/National Malaria Control Programme in Senegal in English). The PNLP records malaria cases in the framework field surveys in Senegal. The description of the PNLP network in Senegal is shown in Scheme 1, adapted from [34]. All age groups are screened in the PNLP data set. The observed numbers of malaria cases used in this study are collected from various health districts in Senegal for the period 2009–2019. These malaria data are recorded for all health districts and hospitals to derive a monthly time series for 14 administrative regions (Dakar, Diourbel, Fatick, Kaffrine, Kaolack, Kedougou, Kolda, Louga, Matam, Saint-Louis, Sedhiou, Tambacounda, Thies, and Ziguinchor). These sentinel sites provide a good representation of malaria transmission in the different climatic zones of Senegal.
We use malaria cases confirmed with TDR (Test de diagnostic Rapide/Rapid diagnostic test) covering the period 2009–2019. In addition, for a generalized study in Senegal, 2009–2019 was chosen as the validation period to integrate new admiratives regions, such as Kaffrine, Kedougou, and Sedhiou, which became regions in 2008 (ANDS). The data census on malaria cases in these regions began in 2009 (PNLP). In addition, this period includes the year of the advent of RDTs, which provide more reliable data.

2.4. Climate Dataset

As VECTRI is run on a daily time-step by two meteorological variables (temperature and rainfall), this section presents the available data for the purpose of the present study. Due to the lack of recent continuous observed weather station datasets from African countries (notably Senegal), satellite and reanalysis climate datasets are used. Reanalysis is a systematic approach to produce consistent datasets for climate monitoring and research with a single model version and data assimilation method. If, in addition, the reanalysis can be continued close to real-time, then it can be used to monitor changes in the climate and its variability on long time scales. The VECTRI model is fed with meteorological data. The temperature data commonly used in the simulations are obtained from ERA5-Land daily reanalysis datasets. In addition to the ERA5-Land daily reanalysis rainfall, other daily rainfall data come from different meteorological products, including the CPC Global Unified Gauge-Based Analysis of Daily Precipitation (CPC for Climate Prediction Center), satellite data from the African Rainfall Climatology 2.0 (ARC2), and the Climate Hazards InfraRed Precipitation with Station data (CHIRPS). A summary of the different types of data is given in Table 1

2.4.1. ERA5-Land

ERA5-Land is a consistent repeat of the terrestrial component of atmospheric data from the ERA5 reanalysis from 1979 to the present day [35]. Its’ resolution improved (9 km against 31 km in ERA5). The temporal frequency of the output is hourly. The fields are masked for all the oceans, unlike ERA5, which includes both the land and the oceans. ERA5 is the fifth generation of atmospheric reanalysis produced by the Copernicus Climate Change (C3S) service of the ECMWF. ERA5 provides hourly estimates on many climatic, atmospheric, terrestrial, and oceanic parameters, as well as uncertainty estimates. The data covers the Earth on a 30 km grid and resolves the atmosphere using 137 levels from the surface to a height of 80 km. ERA5 data is available on regular latitude–longitude grids at 0.25° × 0.25° (25 km × 25 km) resolution.

2.4.2. CHIRPS

The Climate Hazards InfraRed Precipitation with Station data (CHIRPS) group is a near-global rainfall dataset. The CHIRPS data combines data from real-time observing weather stations with infrared data to estimate rainfall—the dataset spans from 1981 to the present day. CHIRPS integrates satellite imagery at 0.05° resolution within situ station data to create gridded precipitation time series for trend analysis and seasonal drought monitoring. Since 1999, scientists from the USGS (US Geological Survey), supported by funding from USAID (US Agency for International Development), NASA (National Aeronautics and Space Administration), and NOAA (Oceanic and Atmospheric Administration), have developed techniques to produce precipitation maps, especially when surface data are scarce. The creation of CHIRPS supported drought monitoring efforts by USAID’s Famine Early Warning Systems Network. The second covers Africa and parts of the Middle East. It covers the area from 40° N to 40° S and from 20° W to 55° E. The global dataset contains data on a 0.05° grid at monthly, pentad, and daily time-steps. This is equivalent to 31 km2. The “Africa” dataset also includes data on a 0.10° grid at a 6-h time-step.

2.4.3. ARC2

The African Rainfall Climatology 2.0 (ARC2) is a revision of the first version of ARC [36]. Following the Operational Precipitation Estimation Algorithm Version 2, ARC2 uses input from two sources: (1) geostationary infrared (IR) data every 3 h centered on Africa from the European Organization for the Exploitation of Meteorological Satellites (EUMETSAT) and (2) quality-controlled Global Telecommunication System (GTS) gauge observations reporting 24-h rainfall accumulations over Africa. The main difference with ARC1 is the recalibration of all IR data from Meteosat First Generation (MFG) (1983–2005). The results show that ARC2 is a significant improvement over ARC1. It is consistent with other long-term datasets, such as the Global Precipitation Climatology Project (GPCP) and the Climate Prediction Center (CPC) Merged Analysis of Precipitation (CMAP). However, a marginal summer drought bias over West and East Africa is examined. Daily and monthly validations suggest that the ARC2 underestimations can be attributed to the unavailability of daily real-time GTS gauge reports and gaps in the satellite estimate associated with precipitation processes over coastal and orographic areas. However, ARC2 is expected to provide users with real-time monitoring of the daily evolution of precipitation, which is instrumental in improved decision making in famine early warning systems.

2.4.4. CPC

Climate Prediction Center (CPC) data from NOAA (National Oceanic and Atmospheric Administration), or, more precisely, CPC’s Unified Gauge-Based Analysis, are a set of gridded precipitation and temperature data (0.5° resolution) available from 1979 [37]. It uses the optimal interpolation (OI) technique to obtain gridded station data. The OI technique defines the analyzed value at a grid point by modifying a first guess field with the weighted average of the differences between observed values and first guess values at station locations within a search distance. The weighting factor is determined from the variance and covariance structure of the target precipitation fields. The creation of the daily precipitation analysis is done in three steps. First, the analyzed fields of daily precipitation climatology are defined from historical gauge observations collected at the CPC. Gridded fields of the ratio between the daily precipitation and the daily climatology are then calculated by interpolating the corresponding values at the gauge locations by the OI technique. The daily precipitation analysis is finally defined by multiplying the fields of daily climatology and daily ratio. By interpolating the ratio of total precipitation to climatology, instead of total precipitation itself, the IO can better represent the spatial distribution of precipitation, especially over regions with strong orographic effects.

3. Results and Discussion

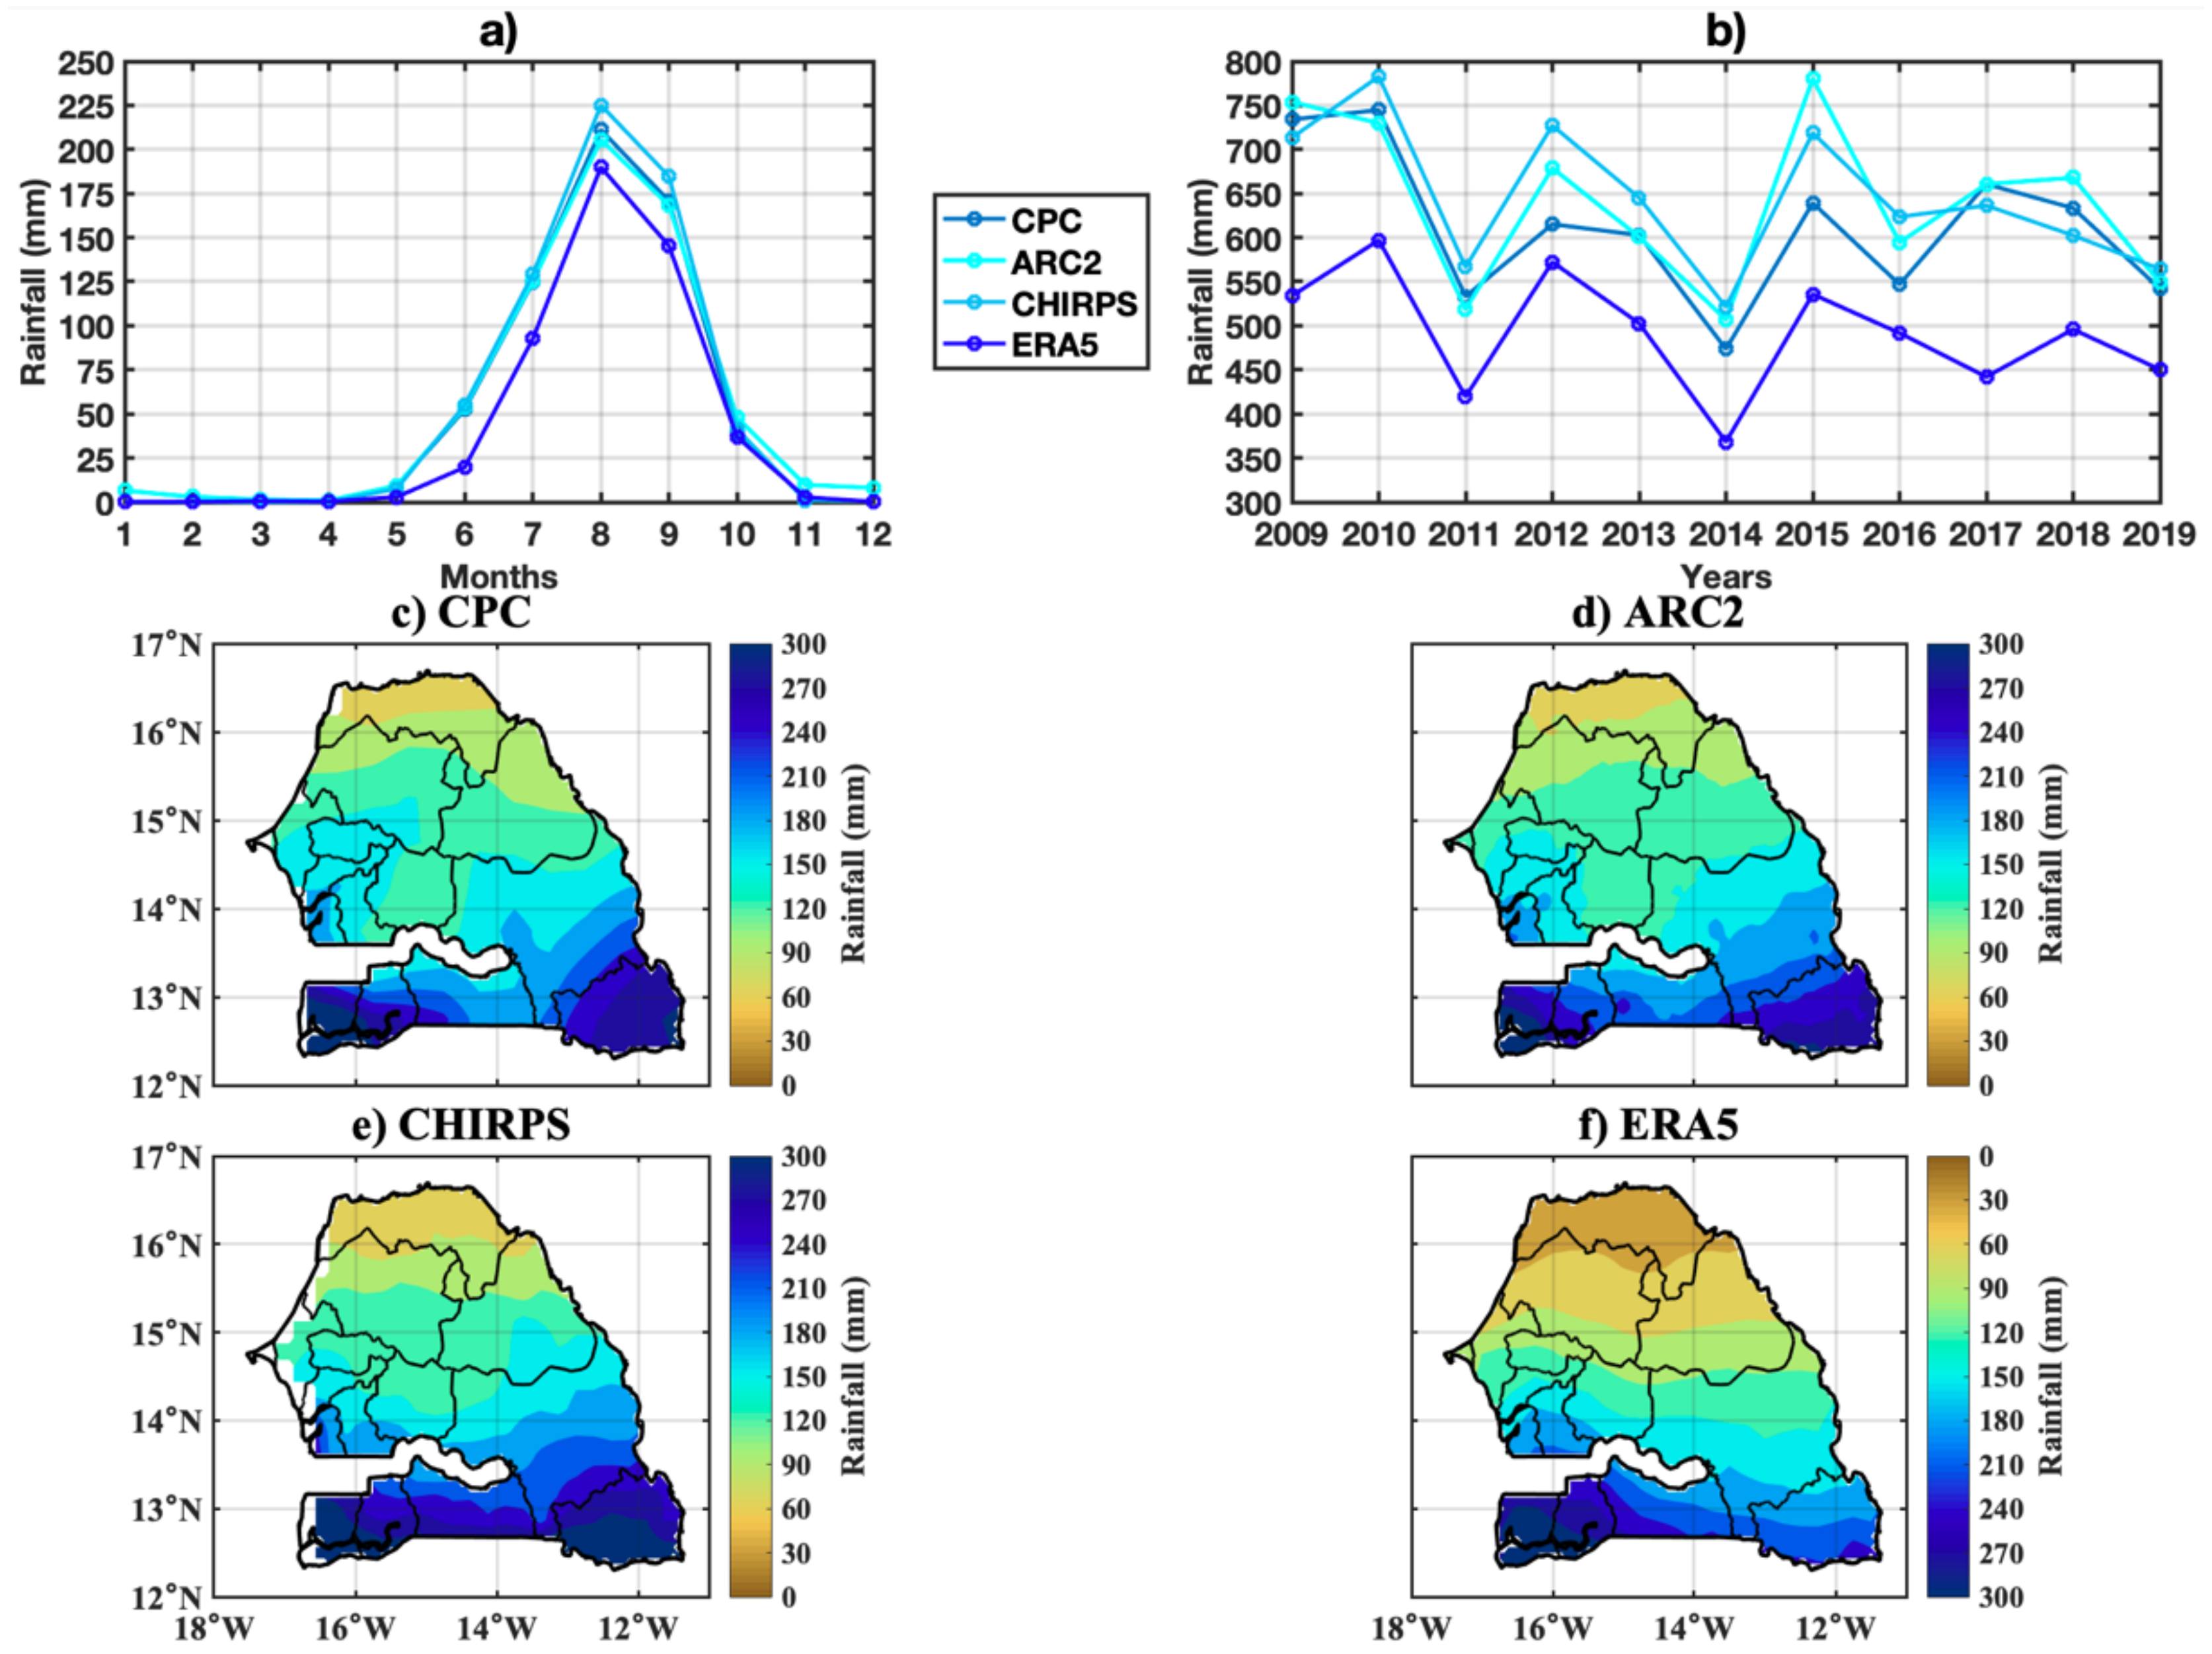
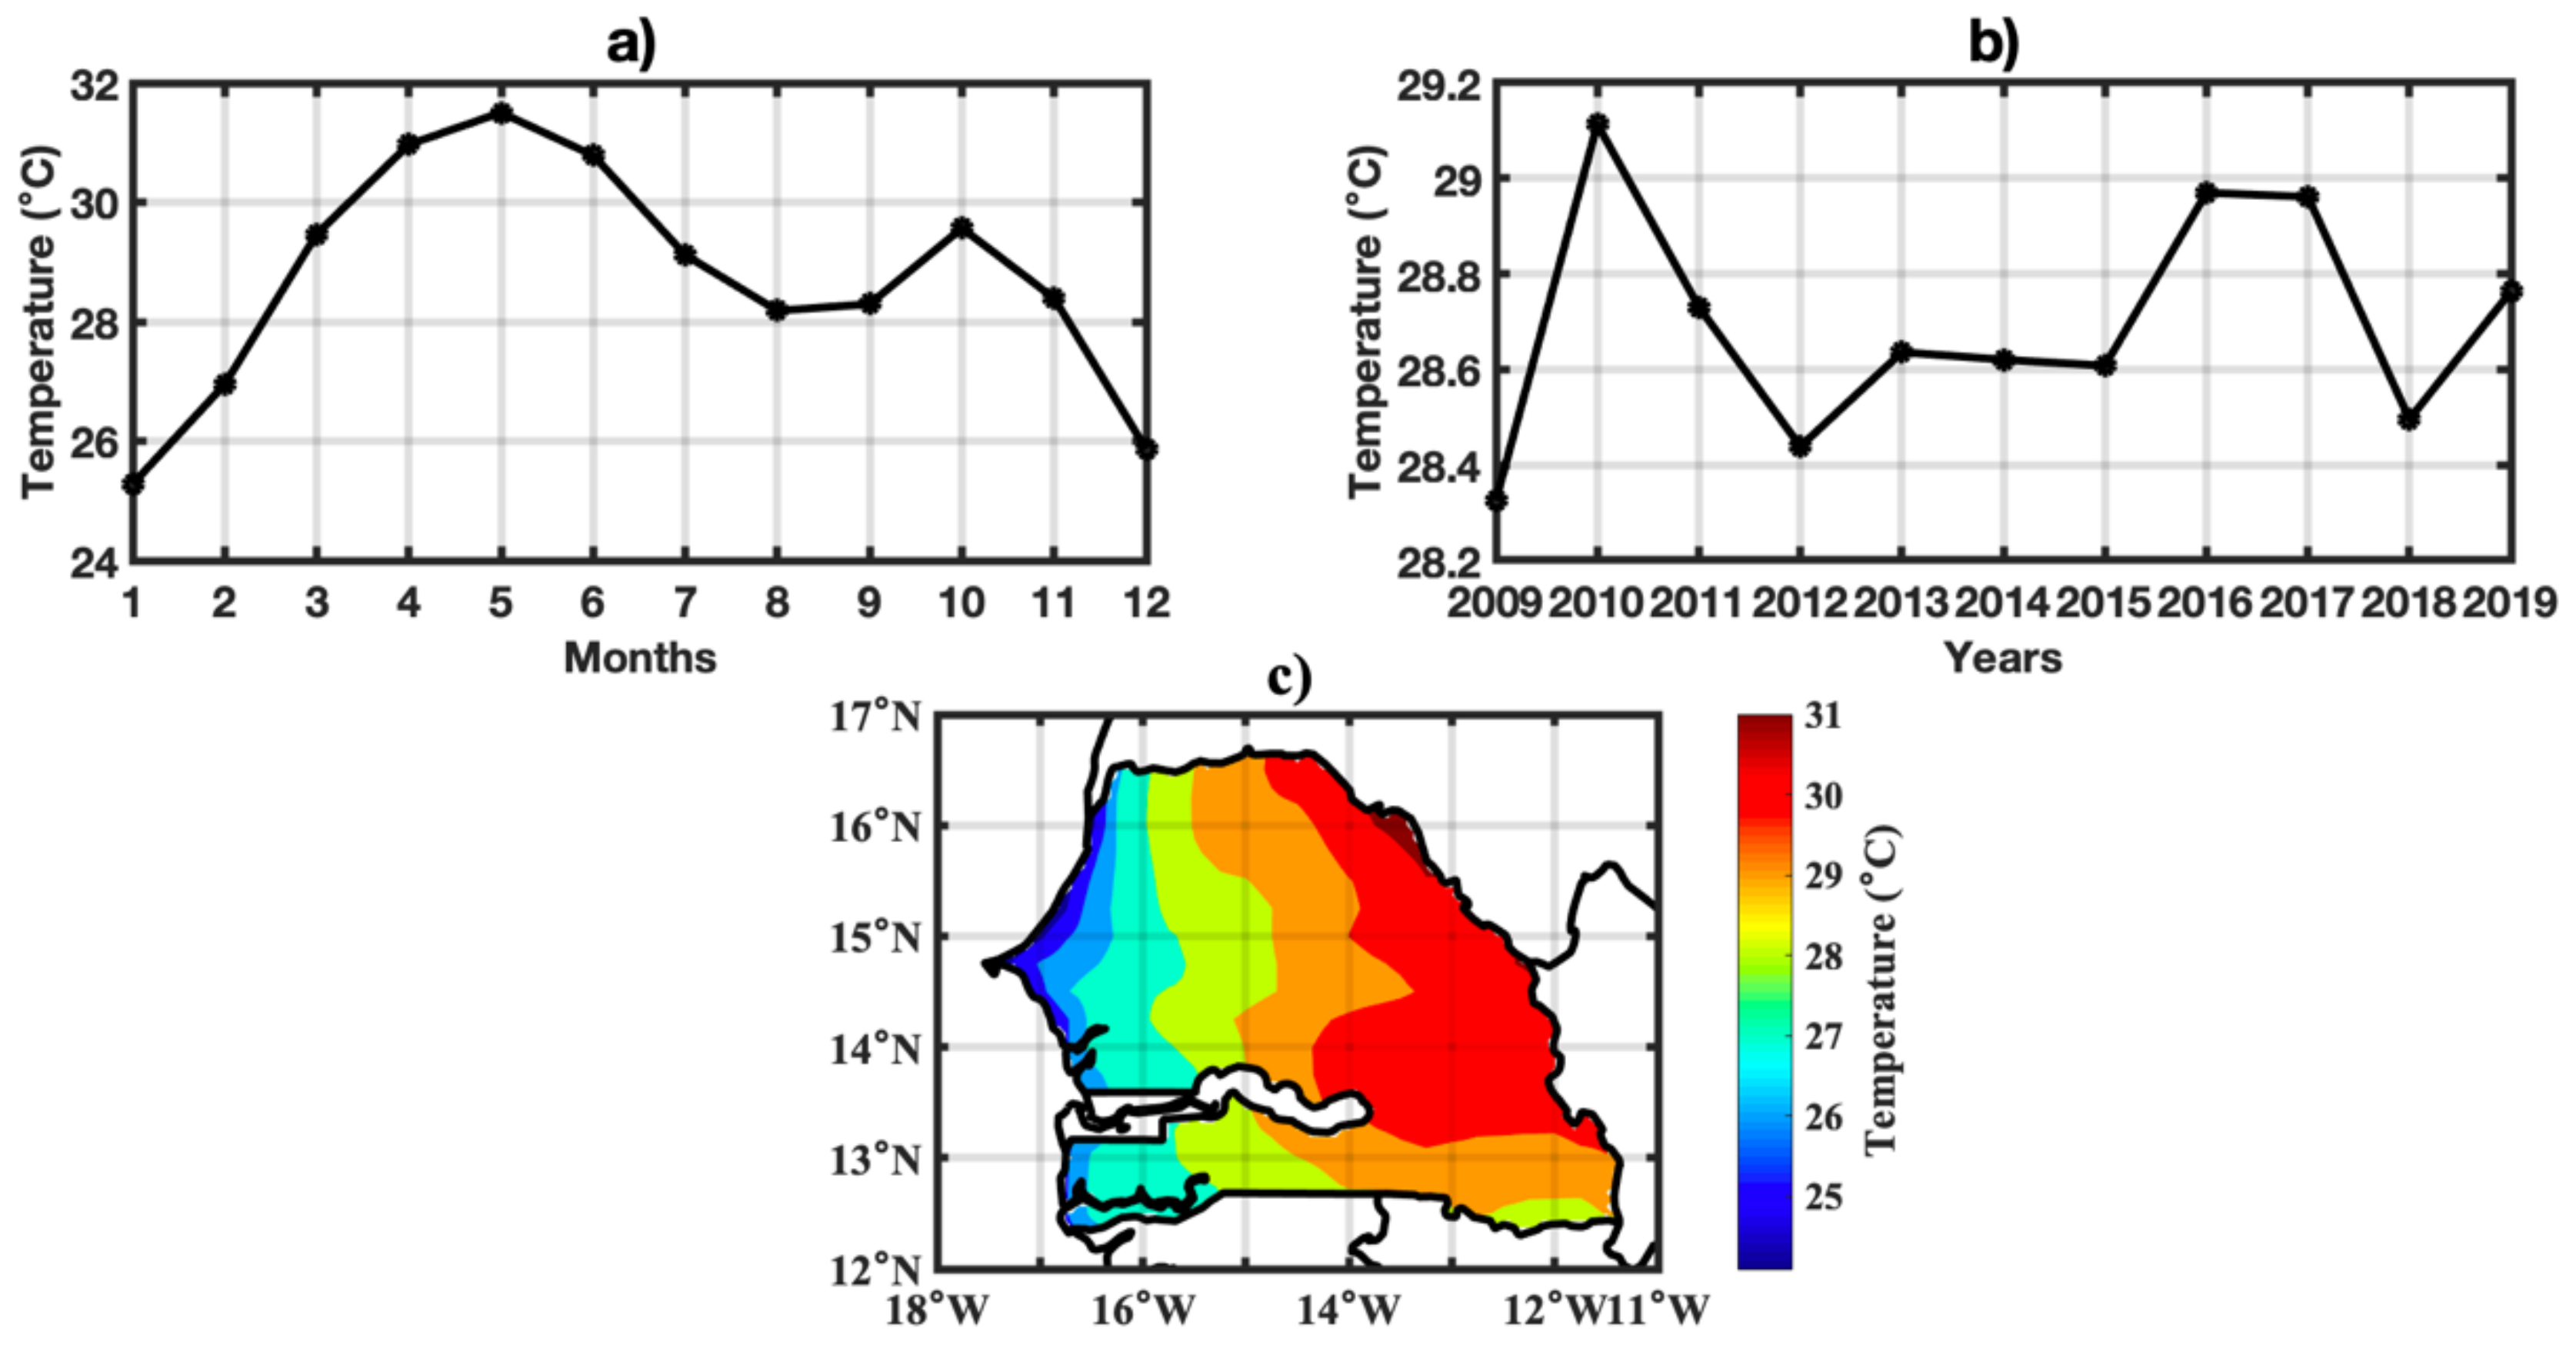
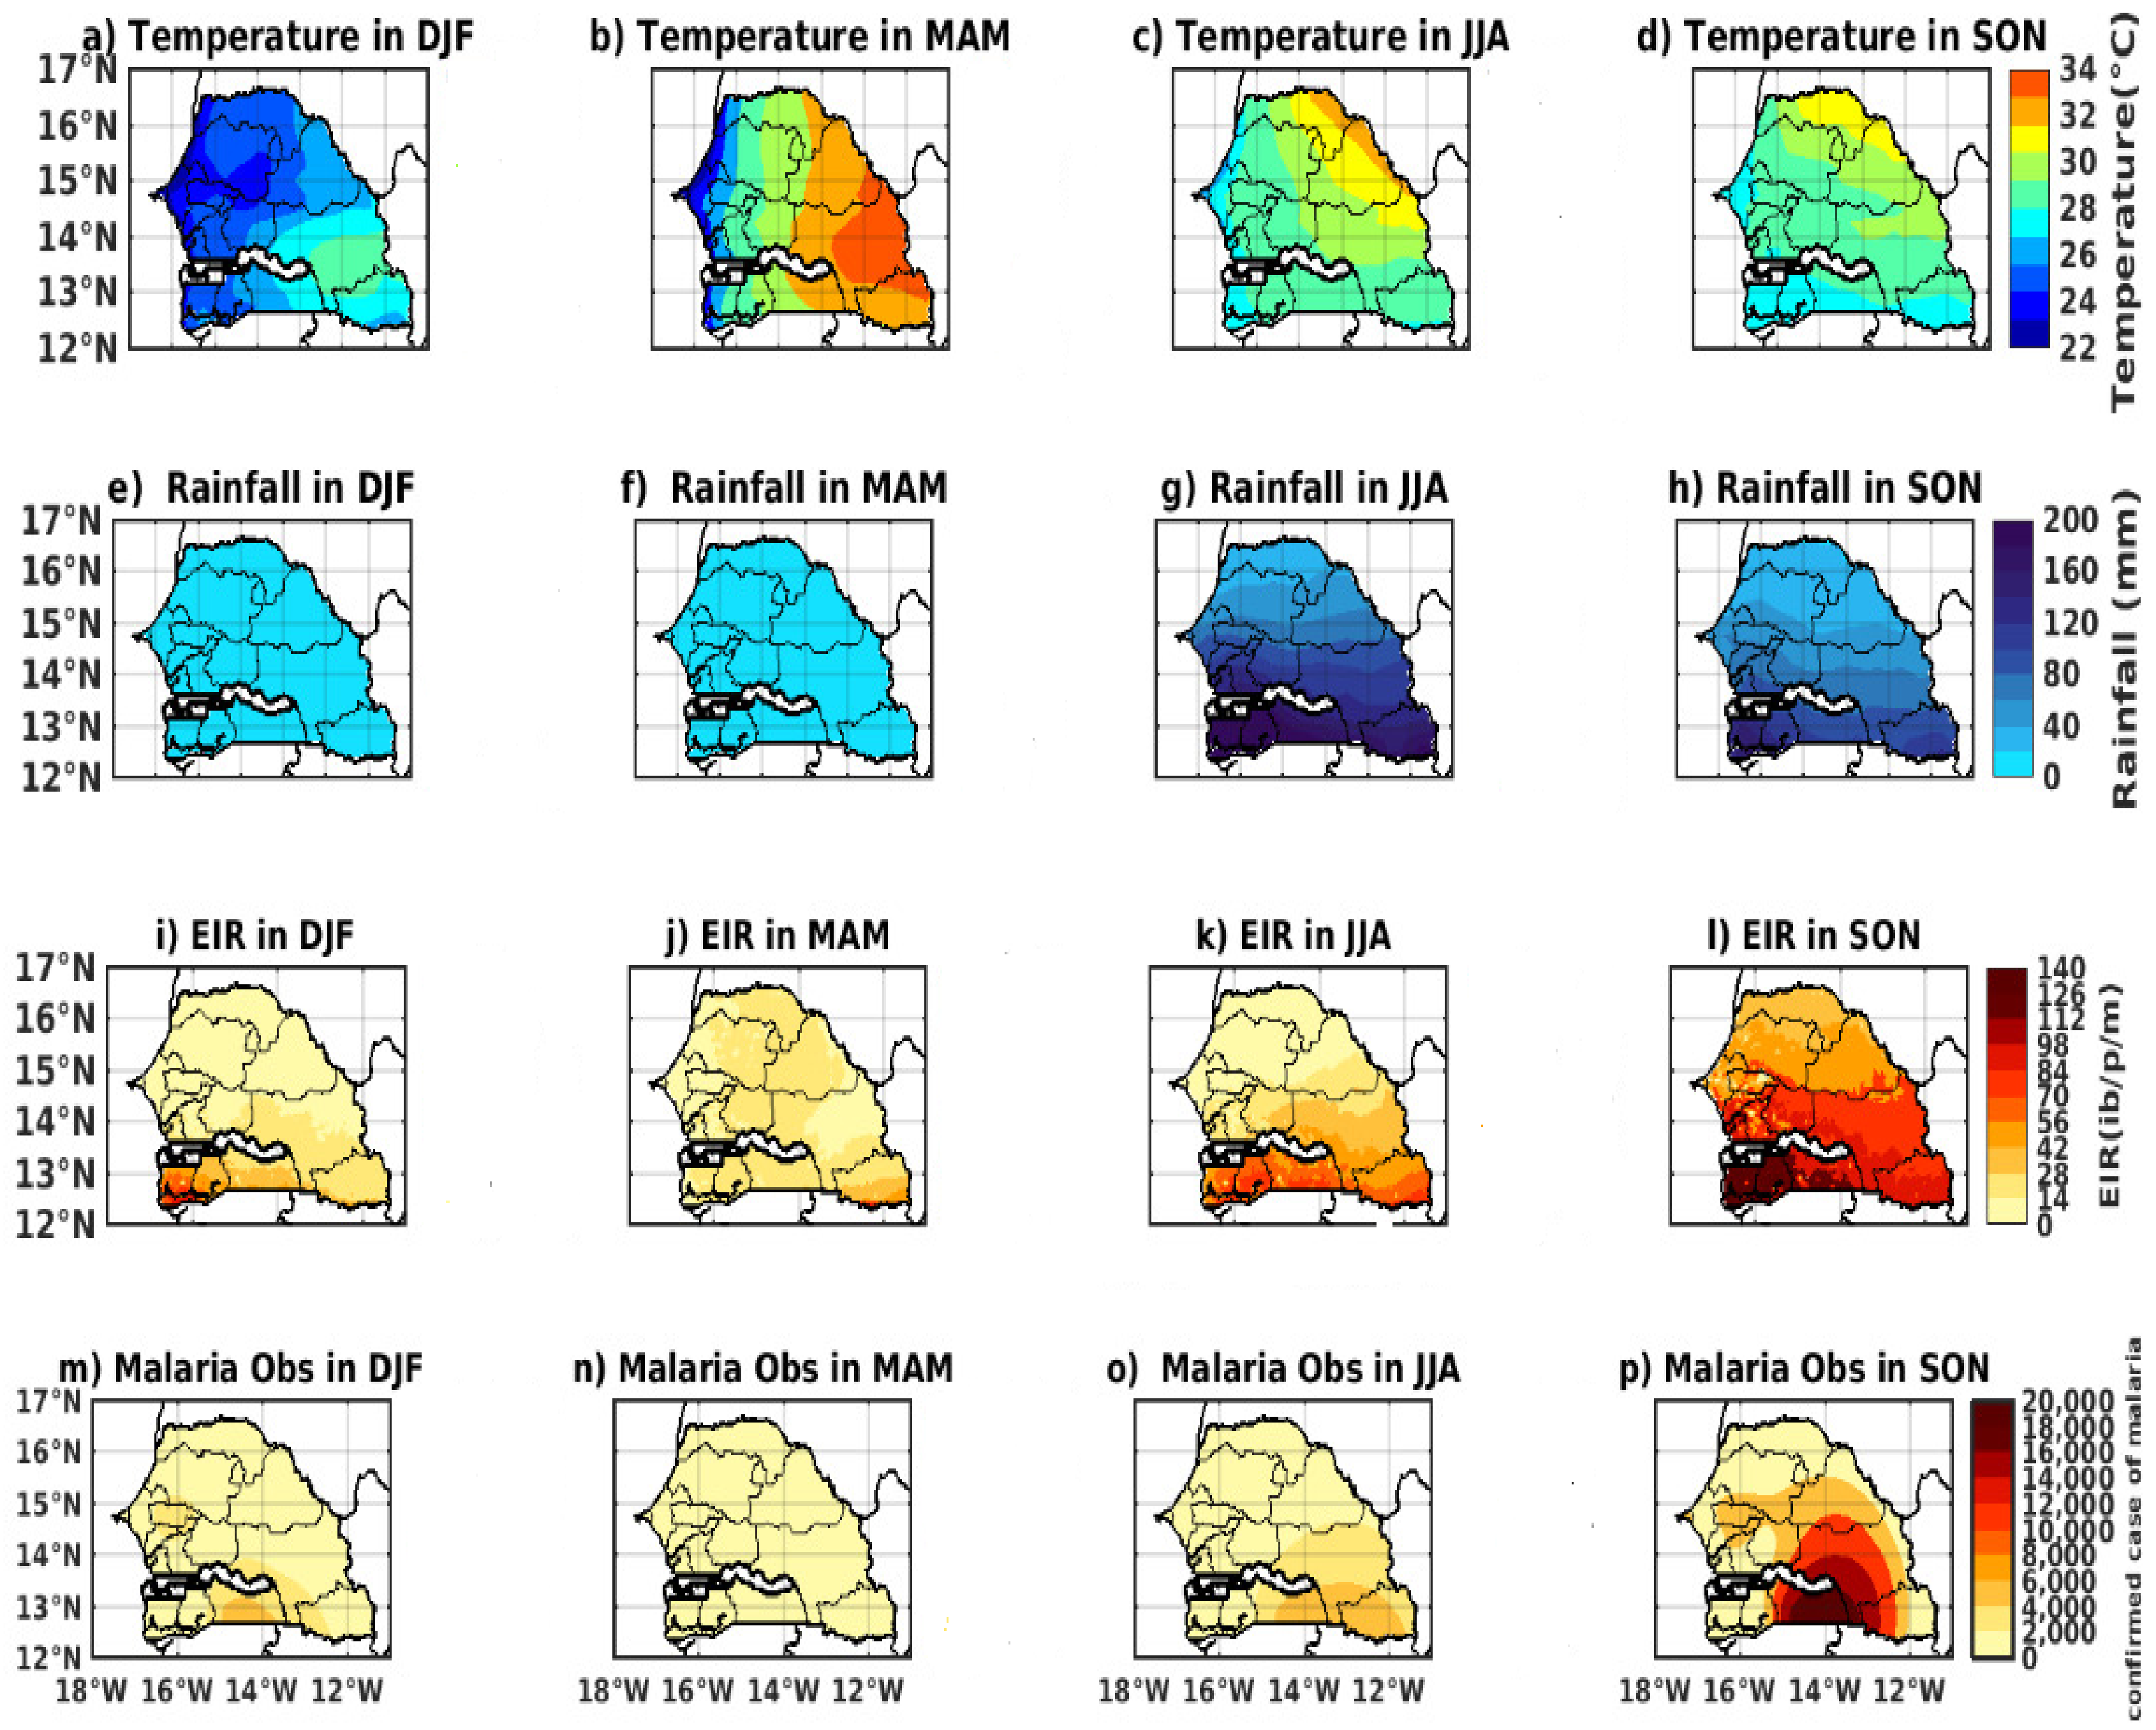
3.1. Spatio-Temporal Variability of Rainfall and Temperature over Senegal

Figure 3a,b represent the annual and interannual cycles of precipitation for CPC (cobalt blue), ARC2 (cyan), CHIRPS (light azure), and ERA5 (blue) in Senegal over the period 2009–2019. Alternatively, Figure 3c–f, respectively, show the spatial distributions of the different data types mentioned previously. The maximum rainfall amount is obtained in August (Figure 3c), and this is also found, for example, by [38,39]. Figure 3b, showing the interannual variation of precipitation, highlights that 2010 has the maximum amount of rainfall for CPC (over 750 mm), CHIRPS (over 800 mm), and ERA5 (over 600 mm) but not for ARC2, during which 2015 records the maximum amount (over 800 mm). Otherwise, minimum rainfall was obtained in 2014 for all four CPCs (around 475mm), ARC2 (around 500 mm), CHIRPS (around 575 mm), and ERA5 (about 390 mm). The rainfall trend is slightly downward for the period 2009–2019. For the spatial distribution, a latitudinal precipitation gradient is observed (Figure 3c–f). The amount of precipitation decreases along the south–north direction due to the arrival of the West African Monsoon (WAM), which moves into the country through the southern part of Senegal. The largest amount of rainfall prevails over the southern part of the country, including Ziguinchor, Sedhiou, and Kolda.
In Figure 4, the spatio-temporal temperature variability of ERA5 has been plotted for the period 2009–2019 in Senegal. Figure 4a shows a bimodal evolution of temperature and temperature peaks in May and October. The first peak coincides with the start of the rainy season, and the second coincides with the end, as found in [33,40,41,42]. Concerning the interannual temperature variation (Figure 4b), 2010 still records the highest value (above 29 °C). The result obtained with the spatial distribution of temperature (Figure 4c) shows an increasing variation from the coastline towards the country’s interior, with the highest temperatures in the eastern part of the country. The lowest temperature values caused by sea breeze effect, are found in Dakar, located at the western part of Senegal.

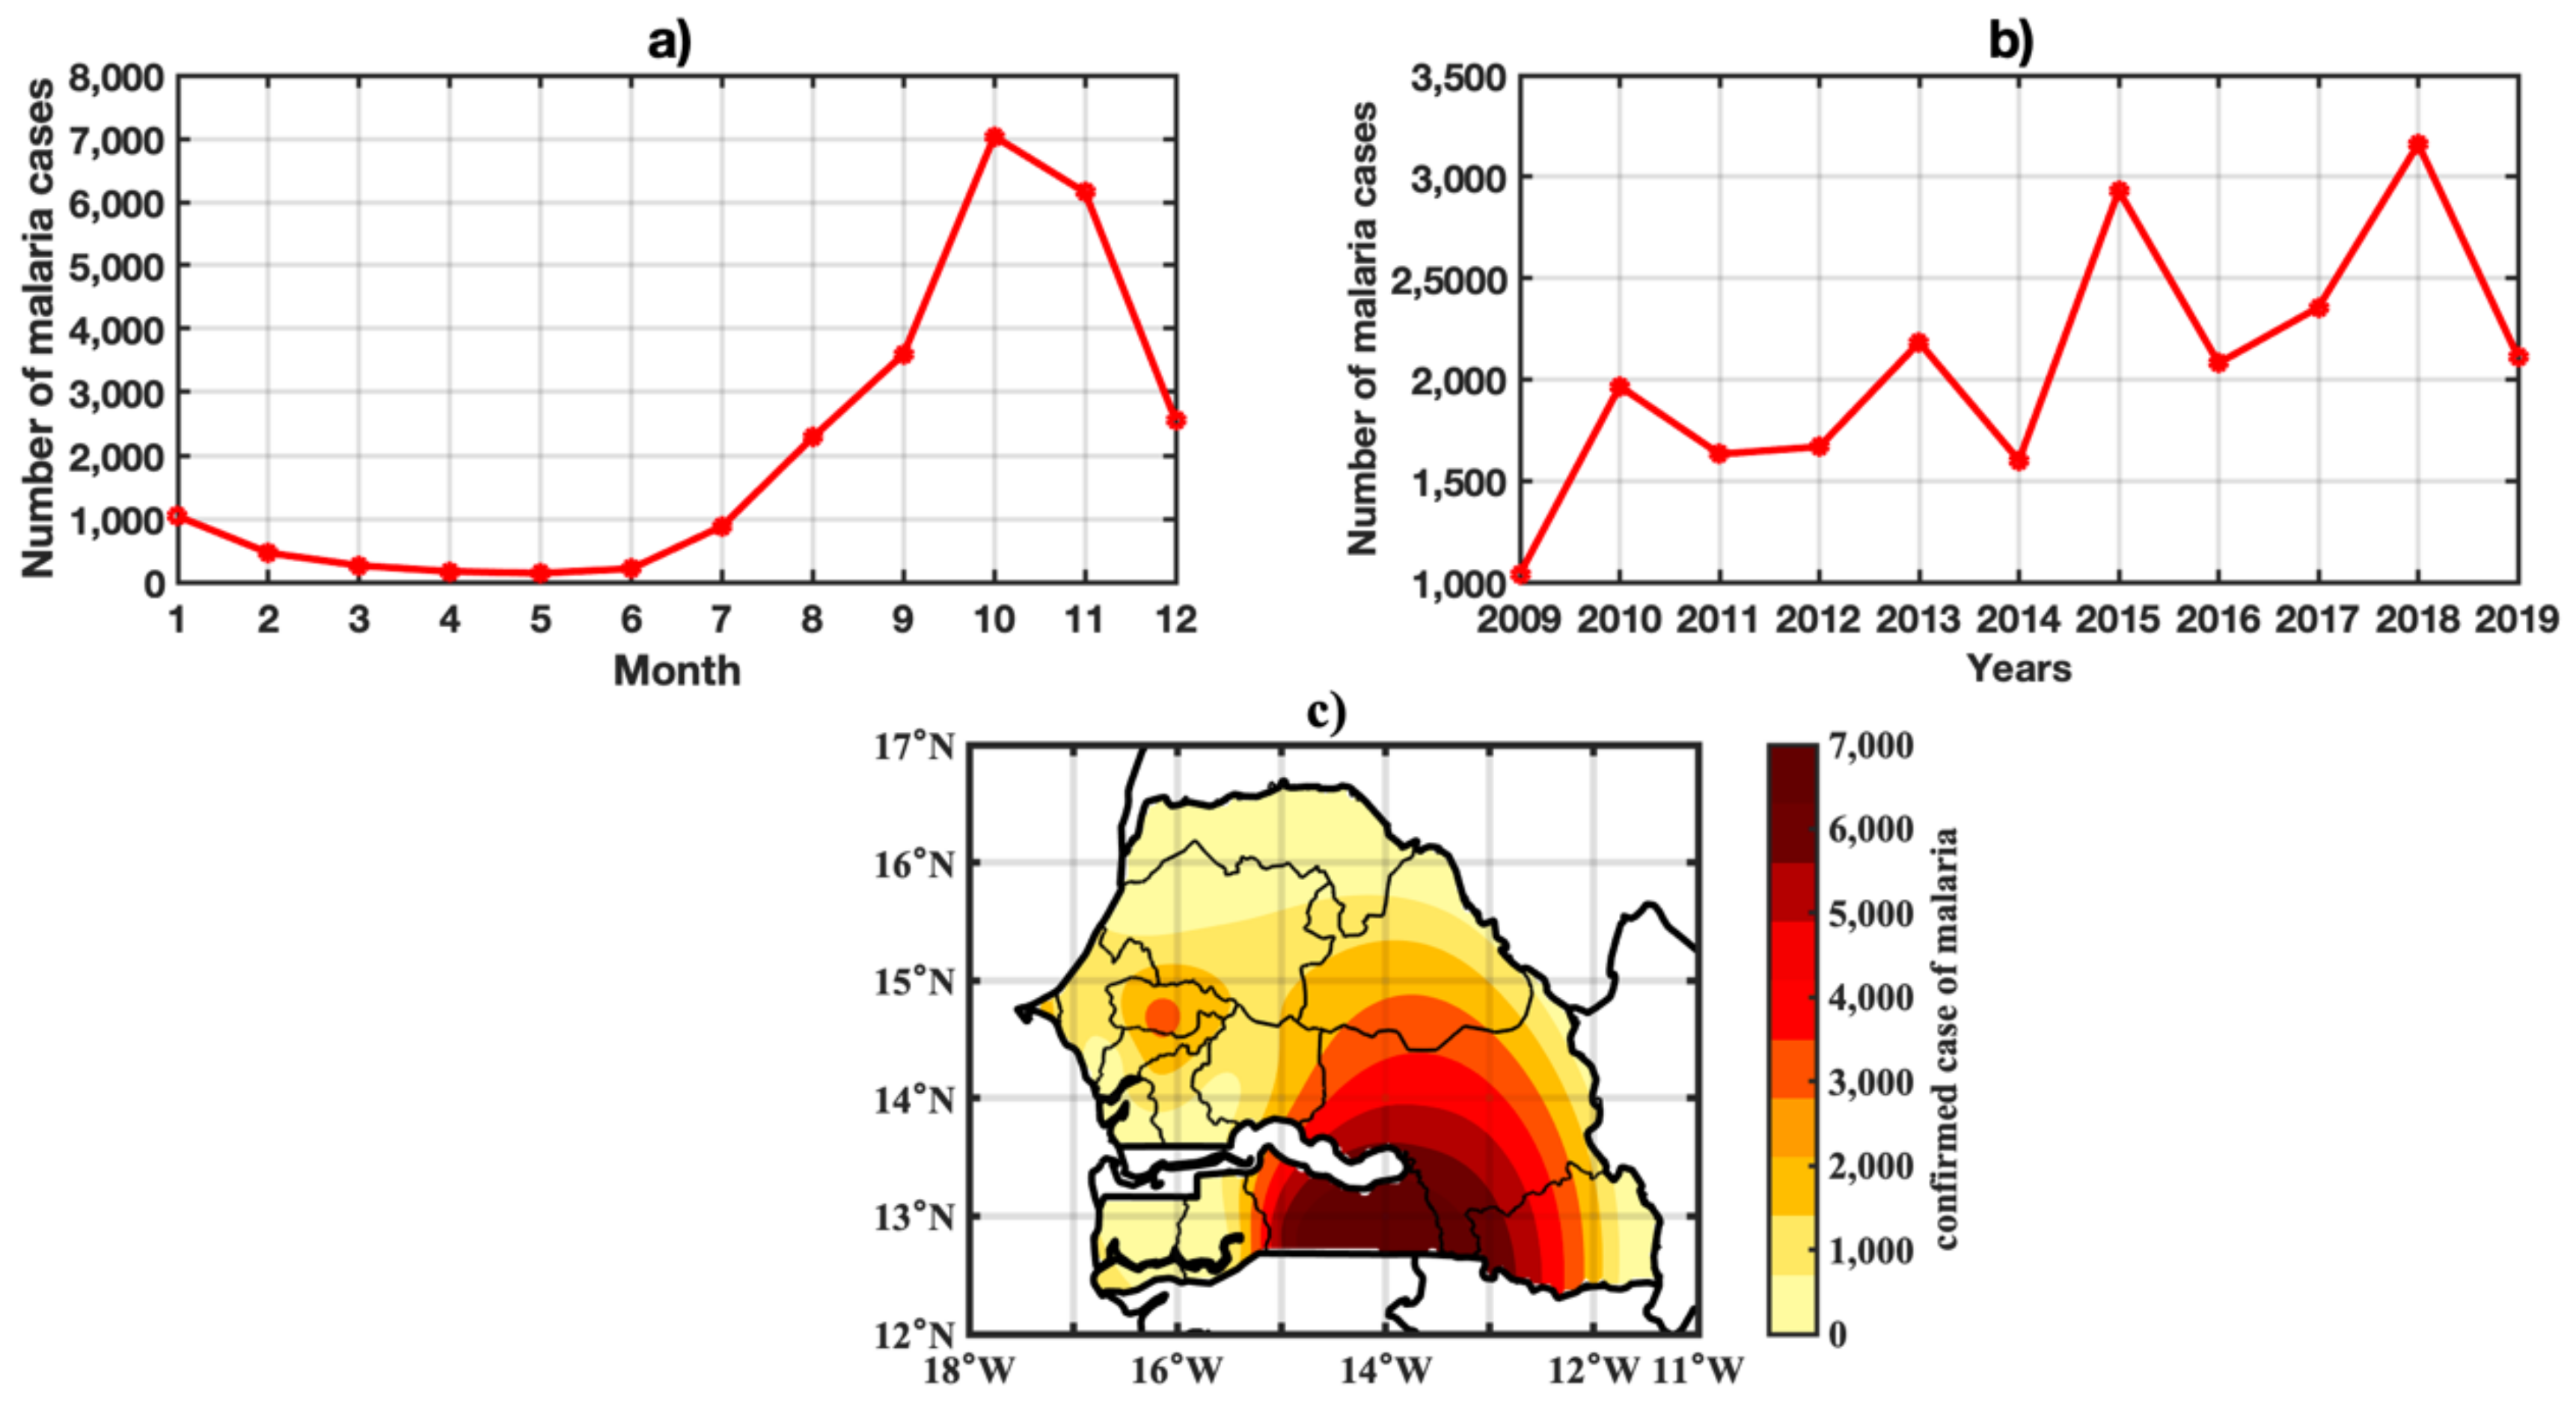
3.2. Spatio-Temporal Variability of Observed Malaria Cases

Figure 5a–c represents the annual cycle, interannual variability, and spatial distribution pattern of the malaria surveillance data, i.e., several confirmed malaria cases. As shown in the yearly cycle, malaria cases grow gradually from the dry to the rainy season and decrease toward the end of the year (Figure 5a). The maximum in malaria cases is shown in October due to the large hatching of mosquitoes following the heavy rains in August [16]. Despite the upward trend during this period, malaria transmission has been declining for some years. This decrease in transmission coincides with both a decrease in precipitation and an increase in temperature. A large data set on the risk of malaria transmission in Africa validates both the 25 °C optimum and the decline above 28°C. [12]. The years 2010, 2011, 2016, 2017, and 2019 perfectly show this hypothesis.
Regarding inter-annual variation in the number of cases, the trend increases between 2015 and 2018 (Figure 5b). Figure 5c shows that confirmed malaria cases increase gradually from June, and decrease toward the end of the year (December). The wettest areas, such as the southern and southeastern parts of Senegal, are most affected by malaria (Figure 5c). These results, shown in Figure 4, illustrate the critical role that rainfall plays in malaria transmission. The risk of malaria transmission is strongly related to rainfall, with very few malaria cases reported during the dry season.

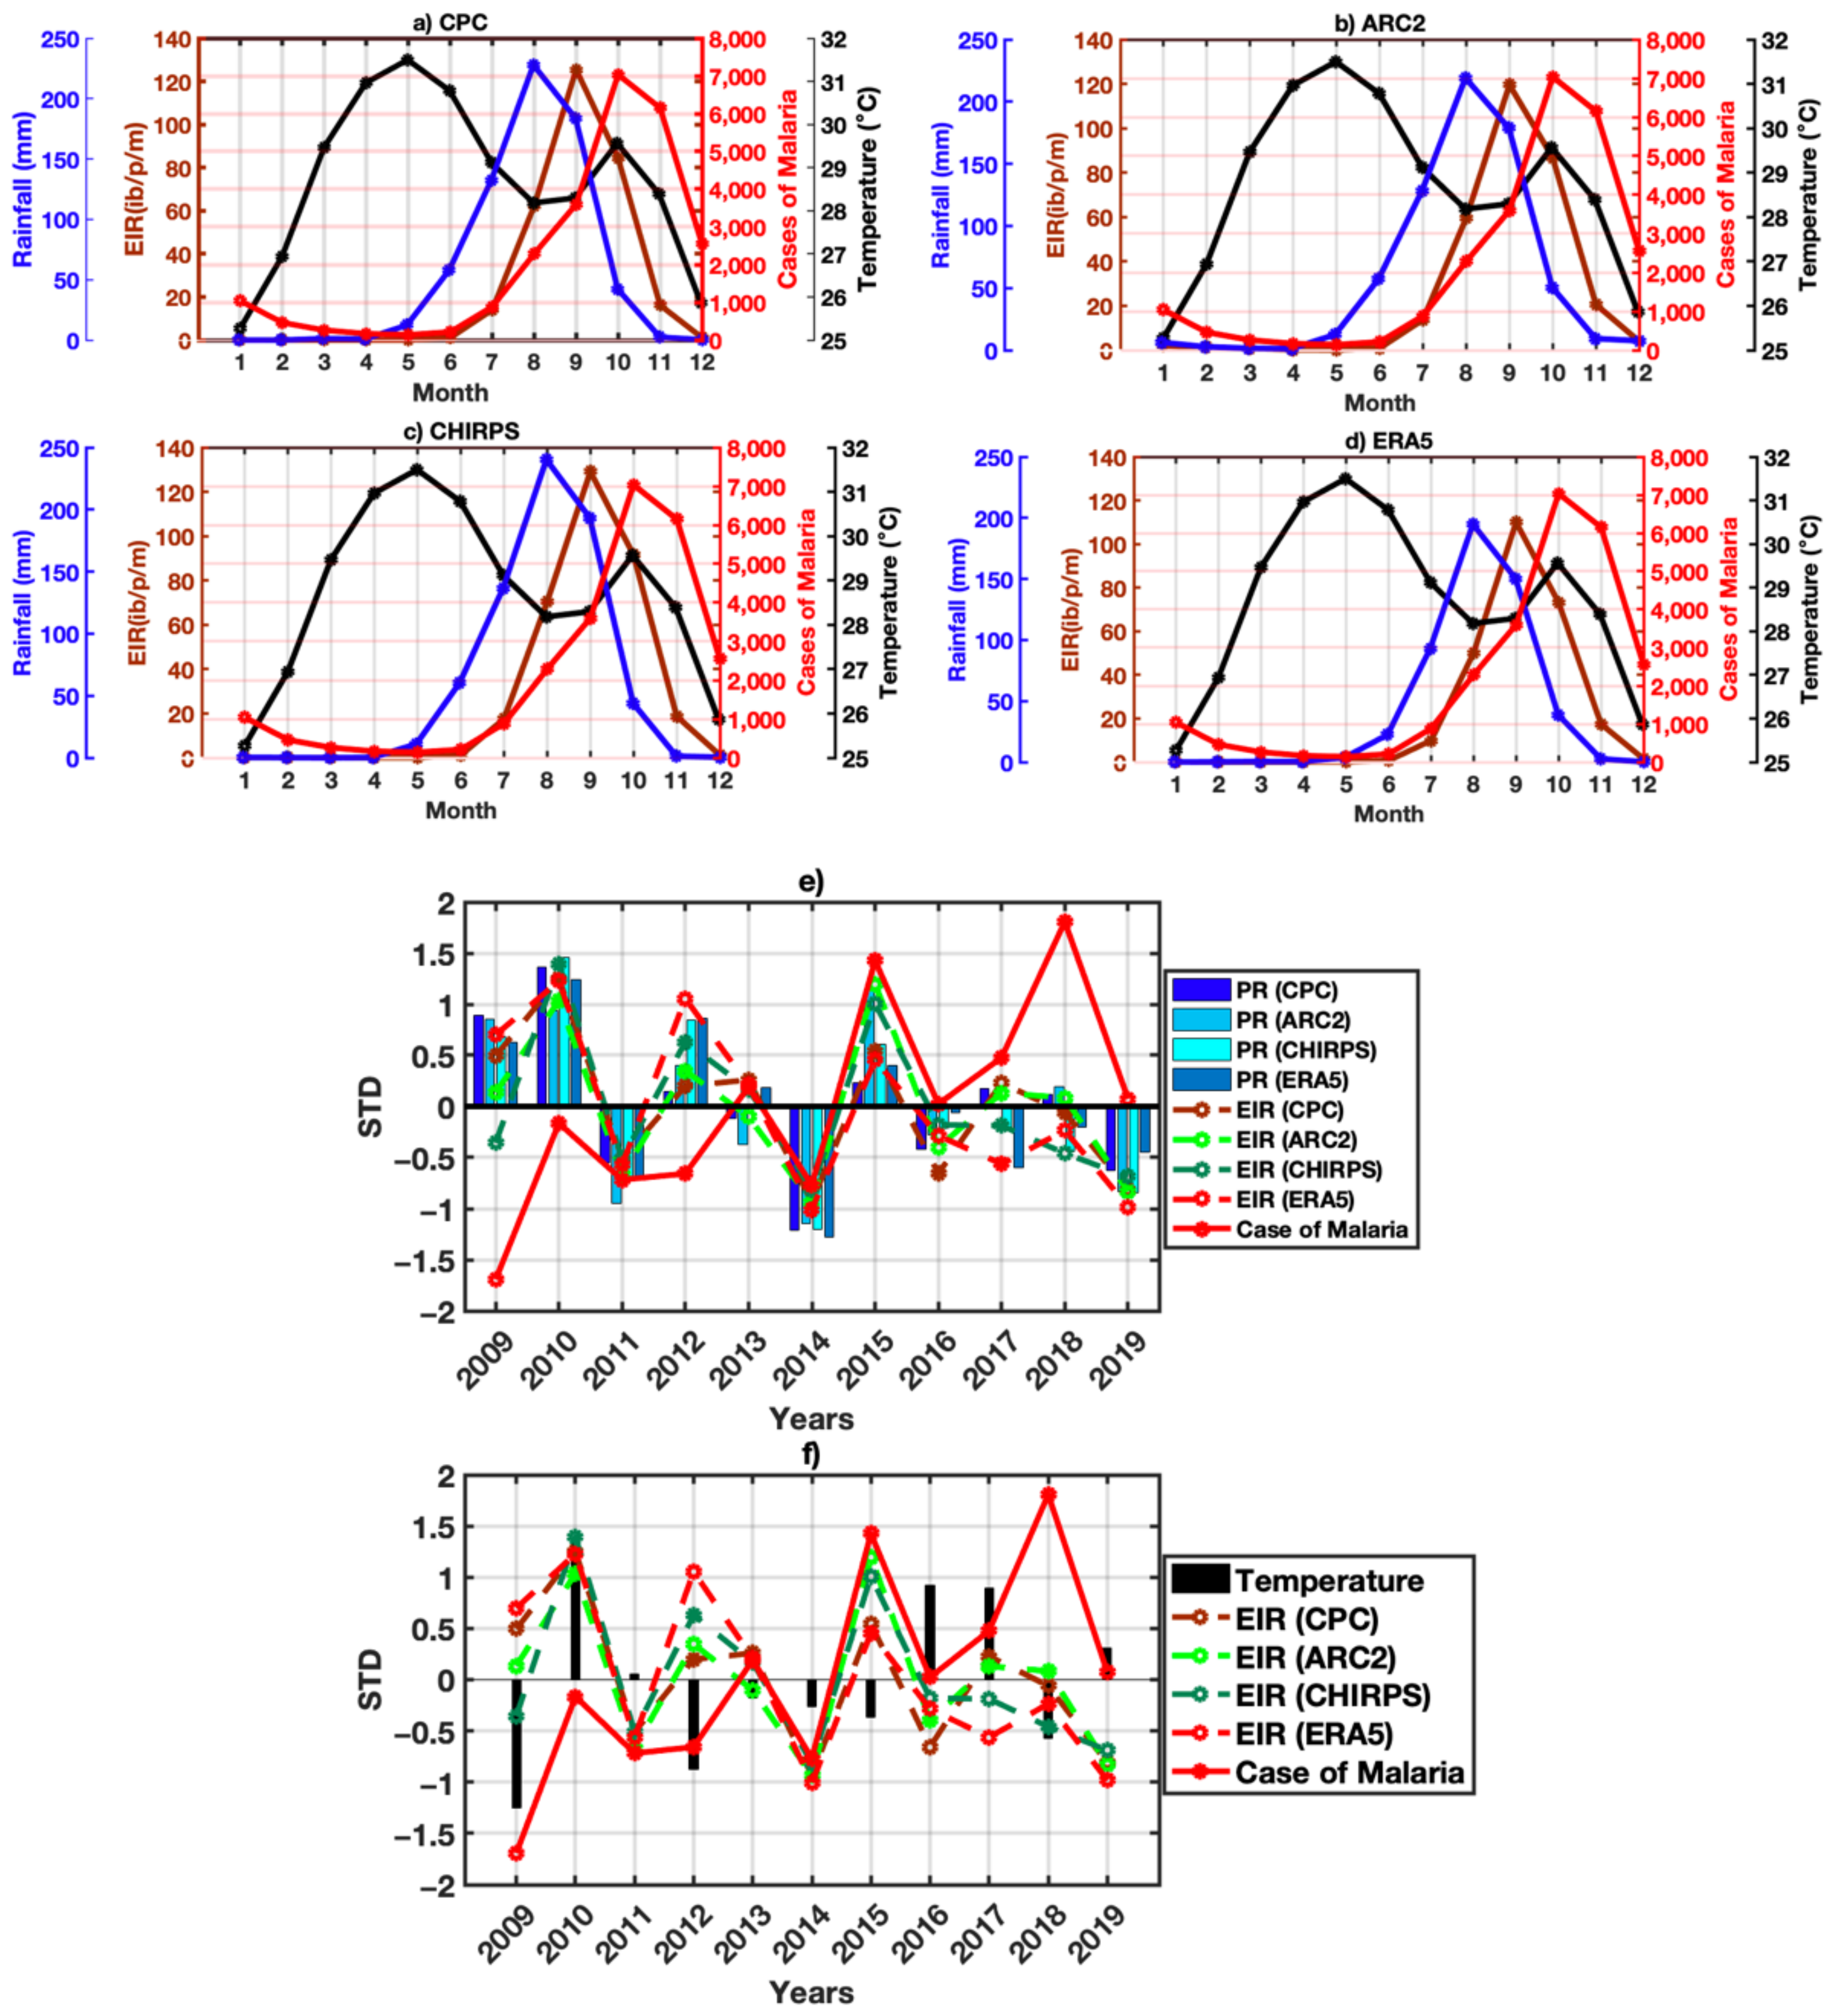
3.3. Relationship between Malaria and Climate Parameters

Figure 6 presents the annual, interannual and spatial distribution of the EIR in Senegal for the period 2009–2019 for CPC data (red curve), ARC2 (lime green curve), CHIRPS (green curve), and ERA5 (brown curve). We can note that for the annual cycle (Figure 6a), all four datasets show the peak of the EIR in September, i.e., one month after the rainfall peak represented in August [43]. Concerning the interannual cycle, the results in Figure 6b reveal that the EIR shows significant values throughout the year, ranging between 22 and ~31 ib/p/m for CPC and ARC2, 24 and ~34 ib/p/m for CHIRPS, and 18 and ~27 lb/p/m for ER45 with some seasonal peaks. The highest EIR values are obtained in 2010 which, at the same time, records both the highest temperature values and the highest precipitation amounts (see Figure 3b and Figure 4b in Section 3.1). This shows the influence of climate on malaria as simulated by the model. Only ARC2 has the maximum amount of precipitation in 2015. The spatial distribution (Figure 6c–f) shows a clear difference in the strength of the EIR signal between the northern and southern regions of Senegal. As already established with the observed malaria data, the southern areas are more affected by the most significant EIR values than other areas in the country. The most important EIR values are recorded from 12°N (at the extreme south of Senegal) and extend up to ~14°N.The difference in decreasing rainfall distribution implies this according to the south–north direction. This disparity in the rain is reproduced in the epidemiological profile of malaria, as wetlands are usually the areas with the most malaria cases [28]. This result was shown by the four products used, namely CPC, ARC2, CHIRPS, and ERA5. The results of these four data corroborate that the VECTRI model simulates well the seasonal cycle of malaria transmission in Senegal. These results also show, more or less, the ability of the model to simulate the interannual transmission of malaria. This makes it different from some of the SEIRs, which fail to simulate the inter-annual variability of malaria transmission [44].

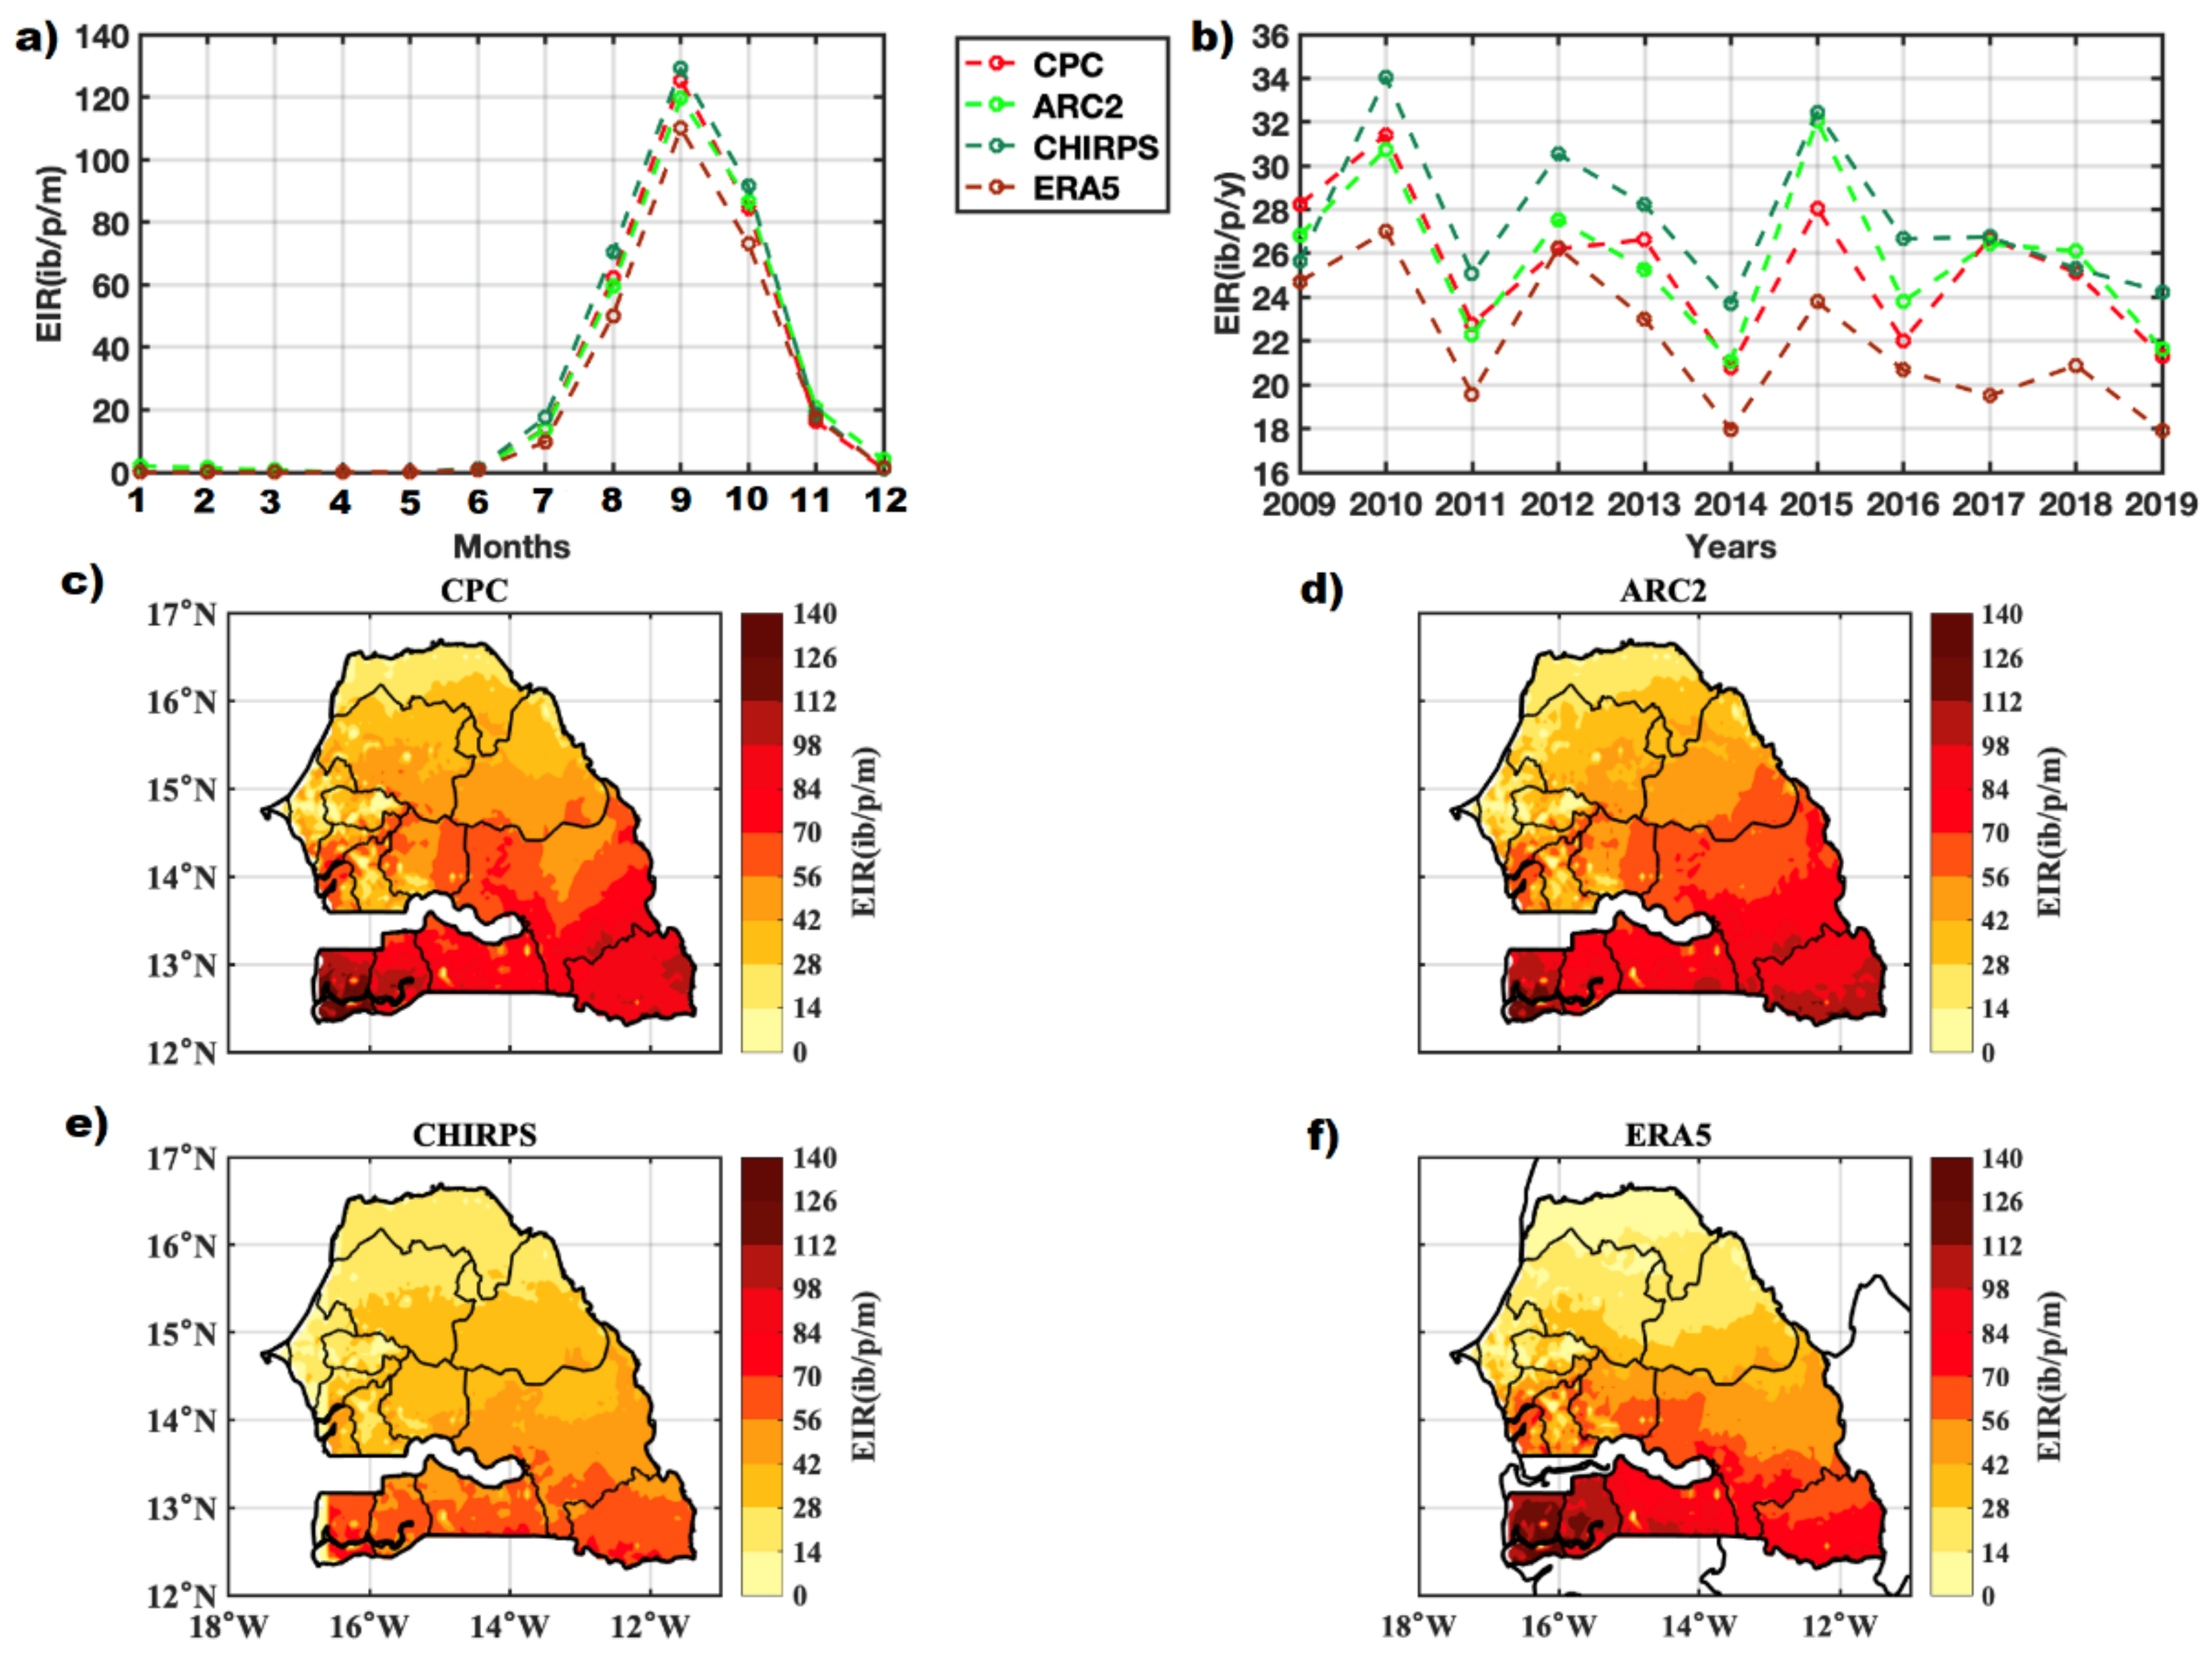
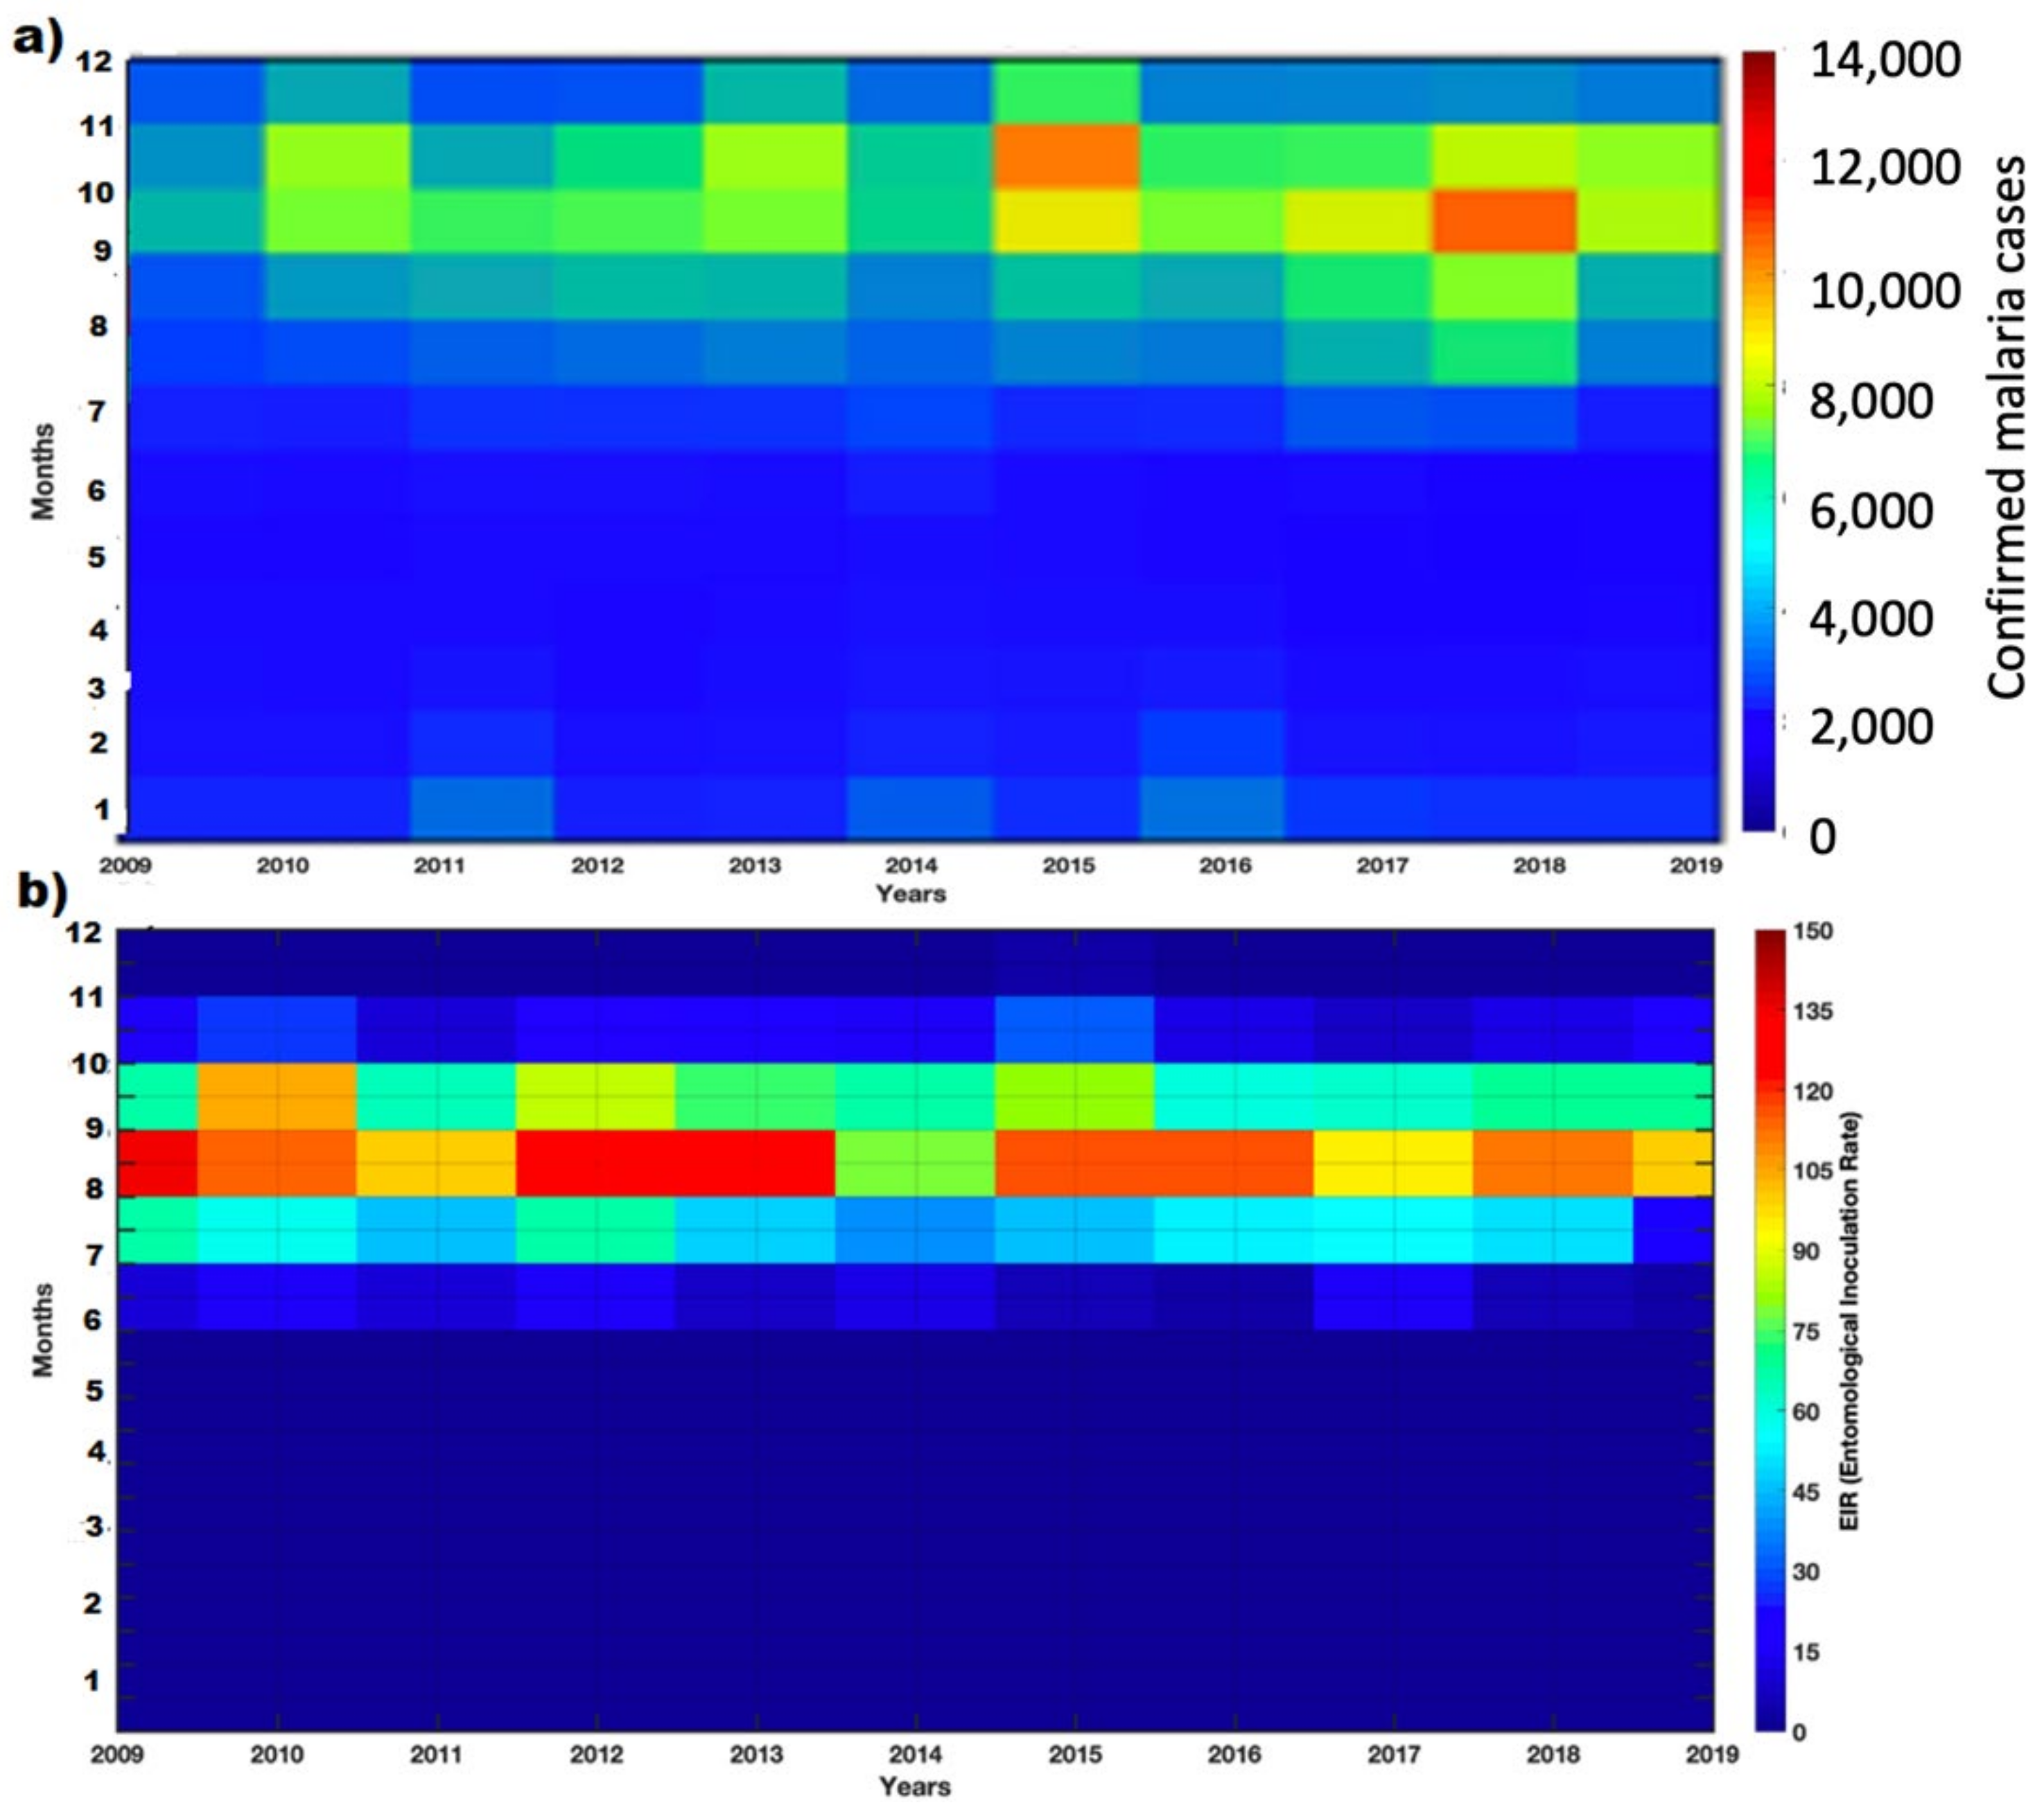
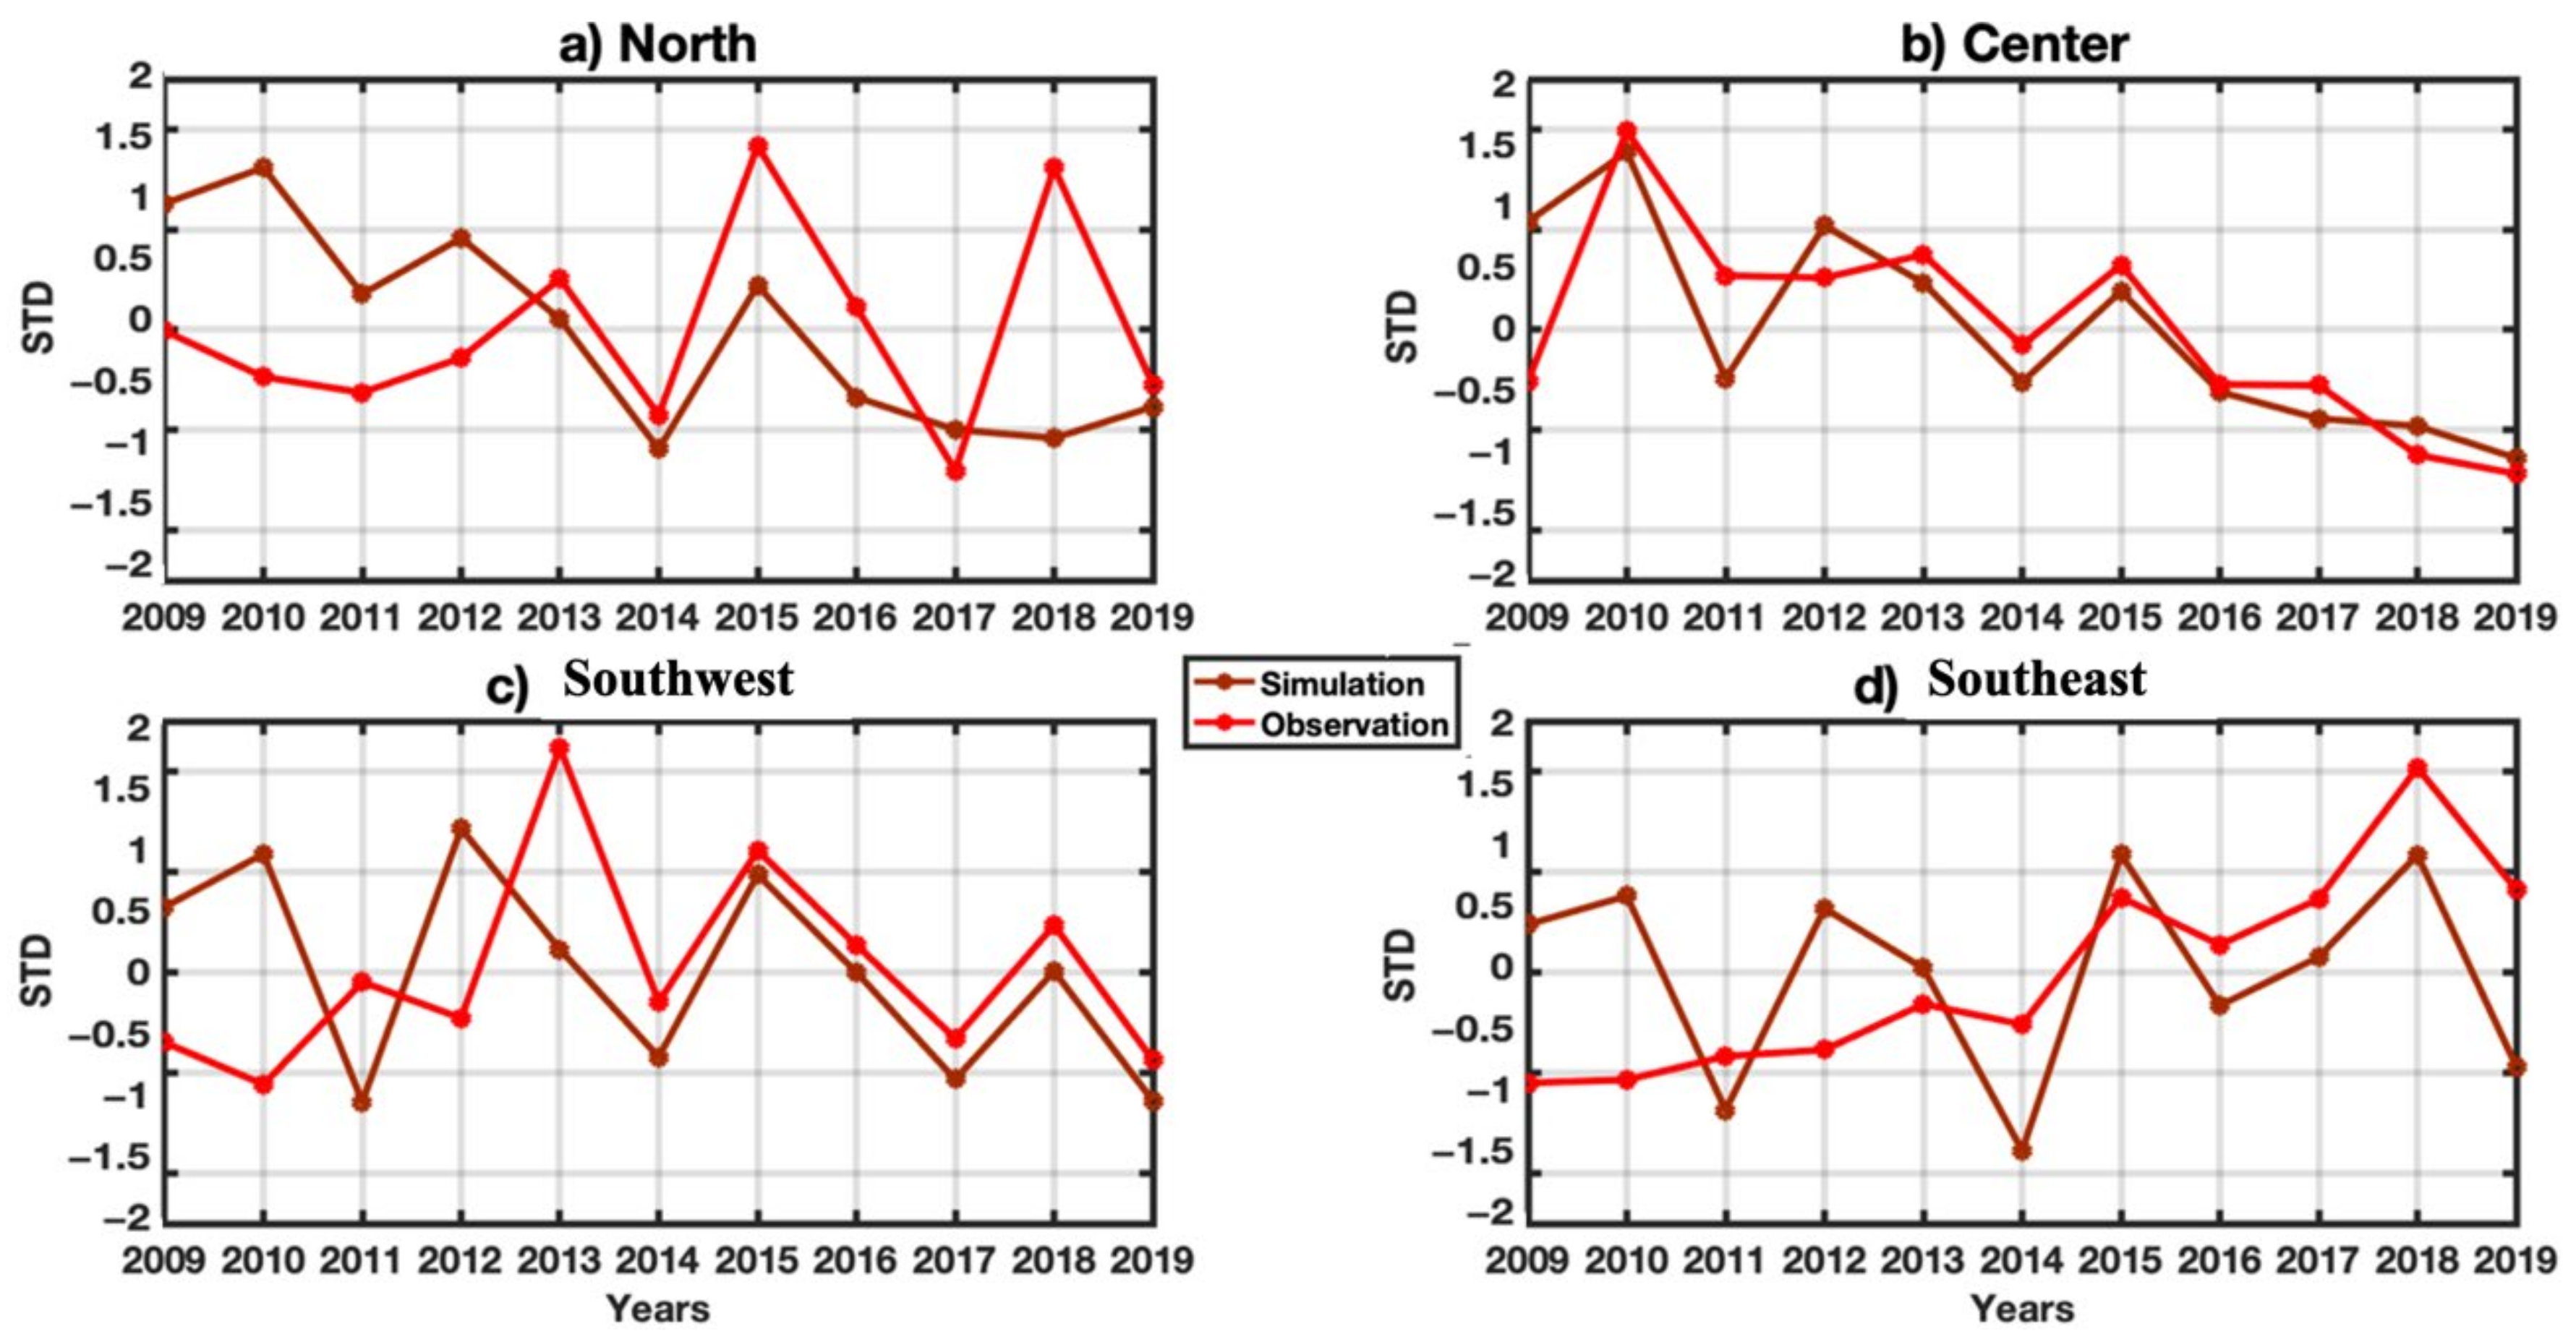
3.4. VECTRI Performance with Observed Malaria Cases

Links of observed malaria data from the National Malaria Control Program in Senegal (PNLP/Programme National de Lutte contre le Paludisme au Senegal) and outputs from the climate data used and the EIR are presented in Figure 7 for the average period 2009–2019. In Figure 7a–d, the peak of the observed malaria cases (red line) appears two months after the peak of rainfall (blue line). This corresponds to the second peak of temperature, which occurs in October. Concerning the EIR parameter (dotted line) for the four data (CPC, ARC2, CHIRPS and ERA5), the peak is observed in September. This peak would appear one month earlier before the peak of observed malaria cases obtained in October, and one month after the peak rainfall obtained in August A high amount of rainfall, reaching hundreds of mm, is observed from July to September, with the peak in August (221 mm for CPC, 220 mm for ARC2, 225 mm for CHIRPS, and 200 mm for ERA5). Even though there is a one-month lag between the peak of the EIR and that of observed malaria cases, the model appears to simulate the overall malaria transmission. Thus, the shift between the two peaks (EIR and observed cases) can be explained because the number of infectious bites is observed instantly, while malaria is confirmed when the test is done. In addition, in tropical Africa, people are used to malaria and, therefore, have a degree of immunity in the body, giving the antibodies time to fight the parasite for a while before the person falls ill [45]. Studies from [46] support that the frequency of malaria follows the co-occurrence of high temperature and rainfall after 30 days. One of the facts that justifies this one-month lag of the EIR’s peak is that the sporogonic development of Plasmodium varies according to climatic conditions. For P. falciparum, the duration is between 9 and 20 days (between 30 °C and 20 °C); it is a little faster for P. vivax at equivalent temperatures and is longer for P. malariae. In addition, among tropical pathogens, malaria thermal optima is below 25 and 26 °C [47]. Further research by [48] confirms the coincidence between the peak in the number of hospitalized patients with malaria appearing in September in its results.
In Figure 7e,f, the anomalies of the mean annual values of malaria cases, EIR and climatic data (precipitation and temperature) have been represented. Corresponding years of positive (negative) malaria case anomalies and EIR anomalies during positive (negative) rainfall anomalies are observed (Figure 7e). In 2010, 2012, and 2015, high malaria transmission was observed in both observed malaria cases and the simulated malaria parameter (EIR). A decrease in malaria prevailed in 2009, 2011, 2014, 2016, and 2019. Figure 7f shows that temperature plays a role in the annual variability of malaria. On the other hand, the role that rainfall plays in the transmission of malaria is predominant for a variation from one year to another. It is also important to note that the warm temperatures can impact the adult mosquito survival scheme by starting to kill lots of adult mosquitoes in the model, which can imply a decrease in malaria transmission. The model well reproduced the interannual variability of transmission.
In Figure 8a,b, the high malaria transmission period extends to three months in observation and simulation. For the observed malaria cases, the period September–October–November is marked by an increased occurrence of malaria, with the maximum intensity of signal prevailing in October. For the EIR, the substantial transmission period is August–September–October with a maximum in September. The model performs healthy simulations of the high malaria transmission period, but discrepancies are not observed, and the modeling peaks. Even the comparison of the annual cycle, the interannual variability, and the period of high transmission between the observed cases and the EIR show the model’s performance in simulating the temporal variation of malaria.
It is also essential to see the spatial distribution of the disease in the territory. A clear difference in the intensity of EIR’s signal and the cases observed between Senegal’s north and south regions is well found (see Figure 9a,b). Rainfall combined with high temperatures and suitable vegetation promotes mosquito proliferation and transmission of malaria parasites. The eggs remain latent in moist soil and are drought resistant [15,49]. In addition, aridity also limits the survival and ability of adult Anopheles vectors to contribute to parasite transmission. Slight discrepancies between observed malaria cases and EIR are noticed in the south of Senegal, with respectively high values in the southwest for observed malaria (Figure 9a) and in the southeast for EIR (Figure 9b). One of the explanations for the difference between the observed case and the EIR of the south zone is that certain socio-economic and environmental factors of these areas were not considered in the simulations. The climatic aspect (rainfall and temperature) was the only factor considered for the simulation of the transmission of malaria in the VECTRI model.

3.5. Malaria and Climate Parameters by Agro-Climatic Zones
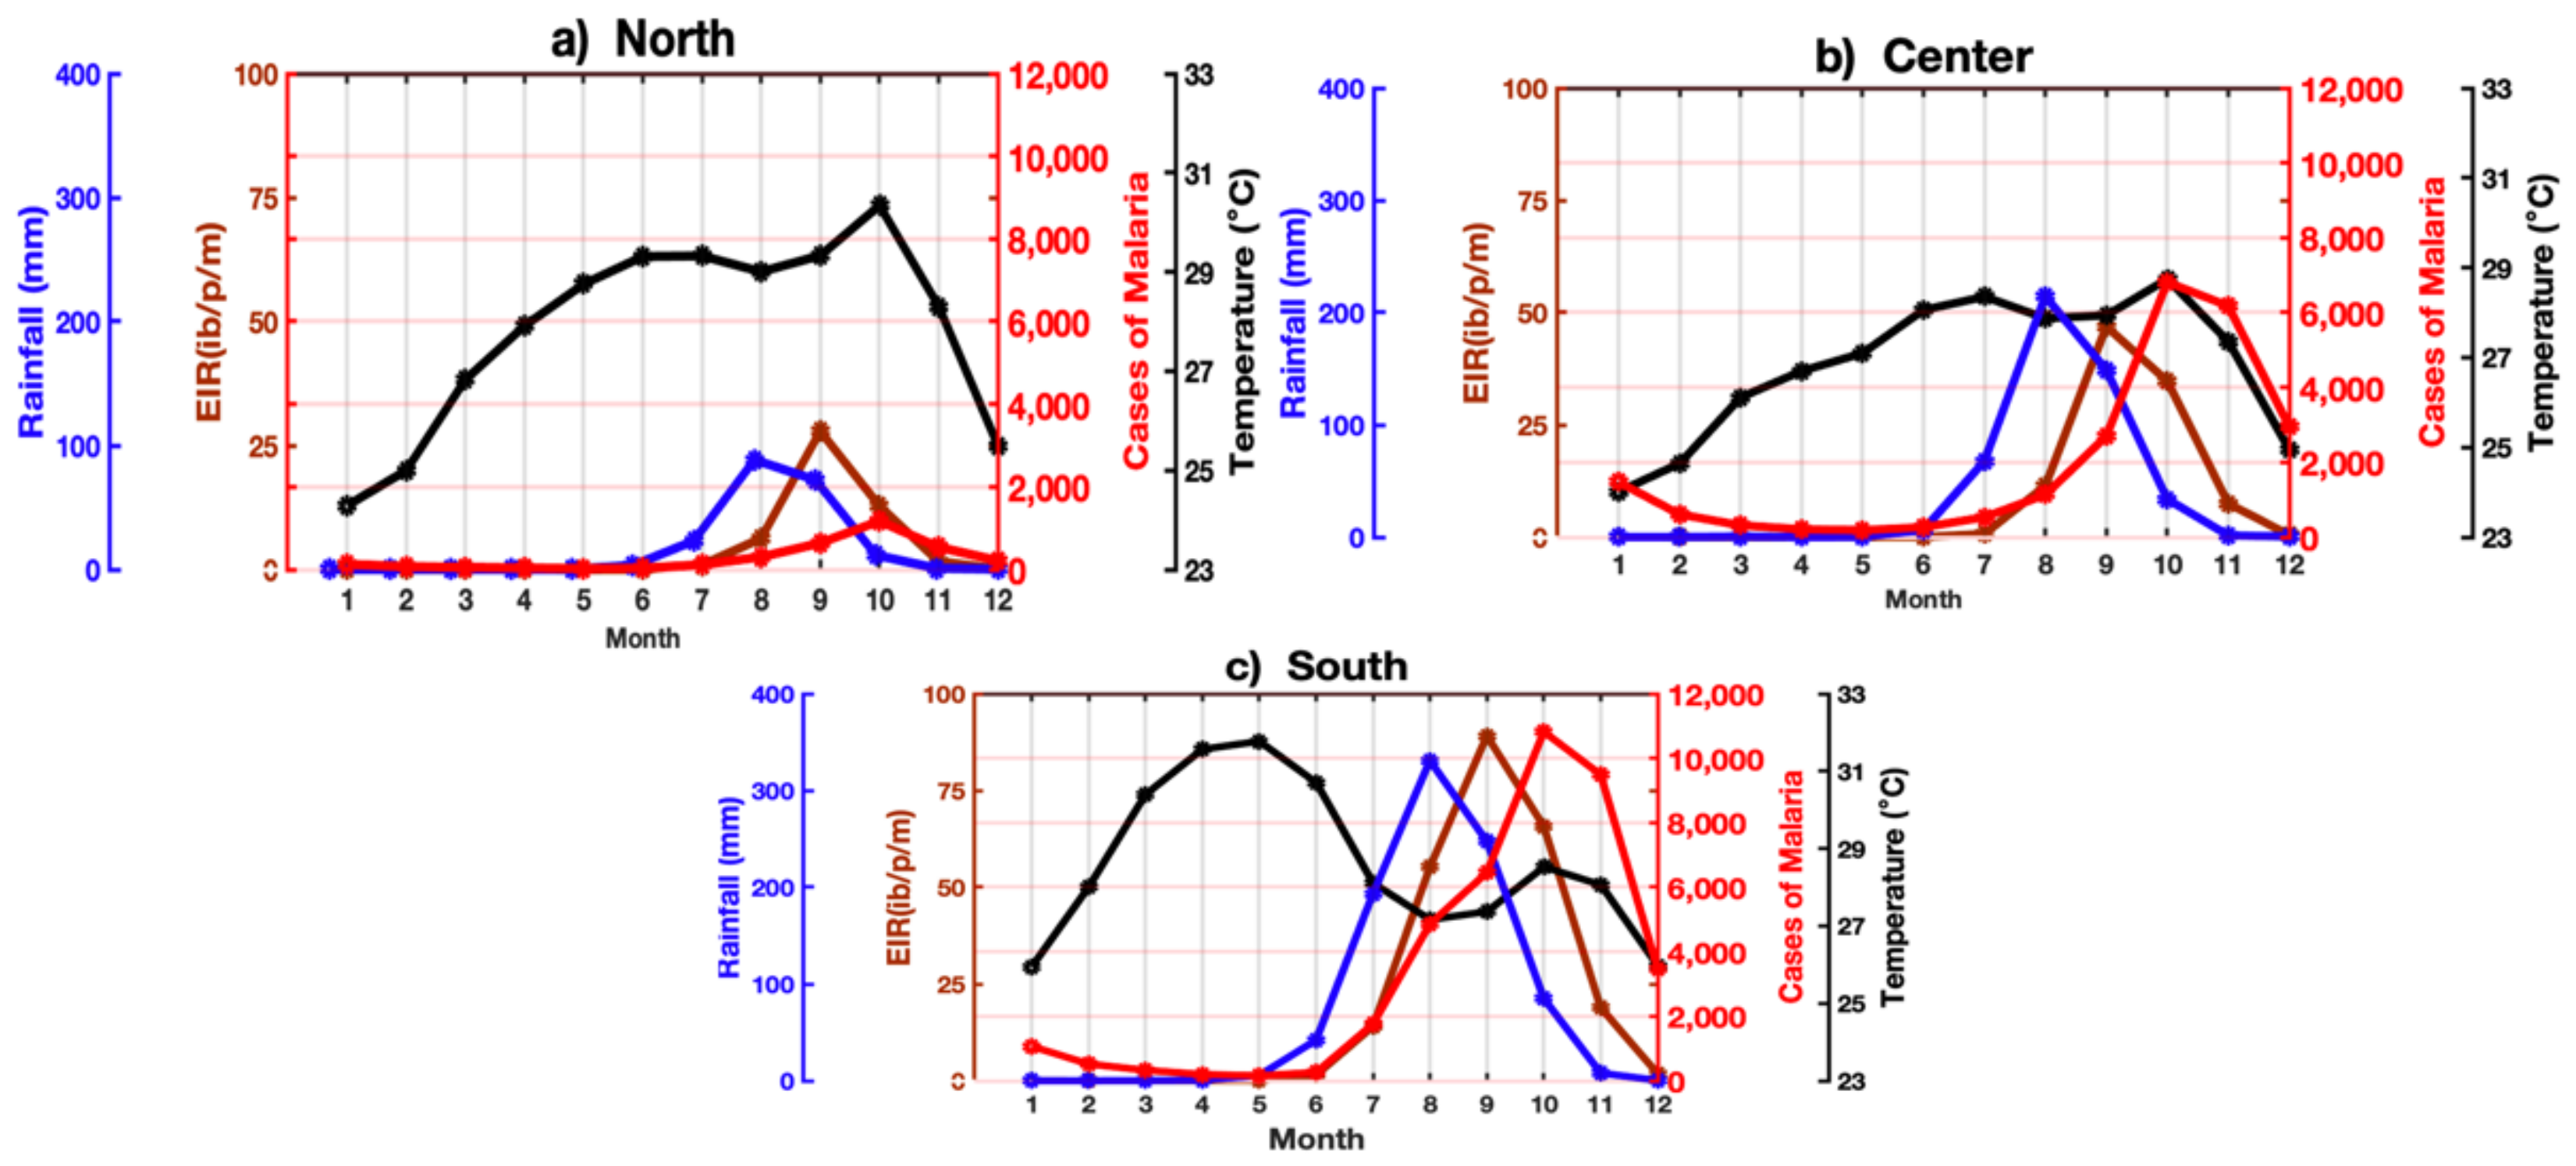
It is well known that West Africa’s rainfall is controlled by the north–south movement of the Inter-Tropical Convergence Zone (ITCZ), which is concurrent with the progression of the West African Monsoon [16,50]. Senegal is located in the westernmost part of the Sahel and has its seasonal rainfall from May to October controlled by these factors. Accordingly, three types of climates can be distinguished in Senegal: a Sahelian climate, a Sudano-Sahelian climate, and a Sudano-Guinean climate. From the climate, the territory can be divided into three zones: the north zone (semi-arid zone), center zone (wooded area), and south zone (forest zone) [16]. Malaria prevalence maps have been constructed, showing that they overlap with climate maps. We can note a spatial heterogeneity of malaria cases within an endemic area. The climate is, therefore, the main element in the division of endemic zones for regional or national malaria [51] studies. Because of these climatic differences, malaria transmission is unevenly distributed over the territory and will be considered by agroclimatic zones for the next section.

3.5.1. Annual Cycle

Figure 10 shows the annual cycle of temperature (black line), rainfall (blue line), confirmed cases of malaria (red line), and EIR (brown line) in the three zones: north (Figure 10a), center (Figure 10c) and south (Figure 10c). High malaria data (observed cases and EIR) associated with high climatic parameters (rainfall and temperature) are noticed in the south zone (Figure 10c). Inversely, low malaria data associated with low rainfall are observed in the north zone (Figure 10a). Increasing temperatures in the north zone seem to reduce the activity of Anopheles larvae and thus the transmission of malaria during the rainy season.
Finally, moderate malaria data associated with moderate rainfall are depicted in the central zone (Figure 10b). These results show that the malaria transmission rate mainly depends on rainfall.
Figure 11 compares the interannual variability anomaly for the simulation and observation of agro-climatic zones: the north zone (Figure 11a), central zone (Figure 11b), and south zone (Figure 11c,d). To better see the variability in the south, where southeasterly monsoon flow is associated with rainfall, two zones are considered: the southwest and southeast. The model correctly simulates the trends of observed malaria cases in the central area of Senegal through EIR (Figure 11b). Further, the observed malaria cases in the north and southwest zones are relatively well captured by VECTRI (Figure 11a,c) during the first years of the period. Finally, VECTRI does not accurately simulate the interannual malaria variations over Senegal’s southeast during 2009–2019.

3.5.2. Seasonal Study of Malaria

Figure 12 shows the seasonal patterns of climate parameters, including temperature (Figure 12a–d) and rainfall (Figure 12e–h), as well as malaria occurrence in terms of modeling (Figure 12i–l) and observations (Figure 12m–p) in Senegal. The different seasons considered later are summer (JJA), autumn (SON), winter (DJF), and spring (MMA), which well document the WAM annual cycle. Malaria is one of the seasonal diseases as highlighted by [52]. The preceding autumn–summer (rainy season in Senegal) has the most malaria cases. This result can be seen in Figure 12l,p with observation and modeling. A robust seasonal temperature regime (with higher temperature values during JJA and lower temperature values during DJF) is observed. Comparing the seasonal patterns of climate parameters across the different seasons (i.e., during DJF, MAM, JJA, and SON), the highest temperature values are located over the eastern part of Senegal during summer (Figure 12b).
In contrast, the lowest values are found over the western part of the country (Figure 12a). The low amount of rainfall and related malaria outbreaks are in the northern area up to the central part of Senegal (Figure 12e–p). Low rainfall amounts are observed in the northern area compared to the southern part, with a wetter period in summer (JJA) associated with the northward shift of the main tropical rainfall band. Over the northern region, a well-marked remarkable period is observed during DJF and is associated with a drastic decrease in rainfall. These seasonal climate conditions contribute differently to enhancing/reducing malaria transmission across the different regions of Senegal.
This work initially explores the relationship between climate and malaria in Senegal using the VECTRI dynamical model. The relationship between climatic parameters (rainfall and temperature), observed malaria cases, and malaria index, such as EIR, was evaluated in this study using meteorological data. The temperature data commonly used in the simulations are obtained from ERA5-Land daily reanalysis datasets. In addition to the ERA5-Land daily reanalysis rainfall, other daily rainfall data comes from different meteorological products, including the Unified Gauge-Based Analysis of Gridded Precipitation from the Climate Prediction Center (CPC), satellite data from the African Rainfall Climatology 2.0 (ARC2), and the Climate Hazards InfraRed Precipitation with Station data (CHIRPS). The results demonstrated a close relationship between rainfall, temperature, and malaria transmission in Senegal. Studies carried out with VECTRI and LMM, HYDREMATS by [34,50,51,52,53,54], respectively, in Ghana, Senegal and Niger have shown that the transmission of malaria generally follows the regimes of precipitation. As found in this study, the difference in transmission between the north and the south was confirmed with the LMM model in the results of [28,34] and those of [53] with VECTRI. Indeed, the malaria patterns follow the climate characteristics, which are very diverse across Senegal, ranging from a Sahelian to a Sudano-Sahelian and a Sudano-Guinean climate. In the northern part of Senegal, the climate is Sahelian, with moderate rainfall occurring during a short rainy season (August–September). Due to its northernmost position, regions including Saint-Louis and Matam are characterized by a dry climate and unfavorable development of mosquitoes.
In contrast, the southern part of the country records the largest amount of rainfall in Senegal, promoting mosquitoes’ development for several months. The modeled annual cycle and the spatial malaria transmission by the VECTRI are well performed. Although representation of the malaria seasonal cycle differs when comparing the different meteorological products, the trends and timing are consistent. While an agreement is found in the seasonal cycles of EIR, discrepancies are mainly found in the magnitude of the interannual cycles, and they are related to different biases in the representation of rainfall in the meteorological datasets. Indeed, the year-to-year malaria variability is simulated, indicating strong interannual fluctuations as also found in the climate parameters. The malaria transmission from one year to another is lacking for many statistical models. The results show that the model reproduces, to a lesser extent, the downward trend in transmission very well. This fact is most visible in the central area of Senegal (Figure 11). This is important because the model only considers the climate trend and not the interventions. These results show that, in this region, the decrease in malaria transmission is mainly attributed to climate conditions. However, even if the climate impact appears to be key for the trends found significant in the occurrences of malaria, it is also necessary to take into account the socio-economic factors and the early and strong public health measures taken by the governments.
Despite the concordance between the observed malaria indicator and the simulated indicator (EIR), some critical discrepancies are also noted. Thus, it could be important to integrate the socio-economic and environmental factors into the VECTRI model. Malaria is one of the most important vector-borne diseases in the tropics and subtropics, whose migration of already infected people will contribute to the proliferation and relapse of this disease. Thus, otherwise, the large-scale migration of populations from areas where malaria is endemic into receptive regions will play an essential role in the dynamics of the disease (WHO 1974). However, population mobility and effective malaria intervention strategies will likely enhance VECTRI if implemented. The health impacts of climate change will not be distributed evenly [54]. The distribution of the most severe health burdens is almost opposite from the global distribution of greenhouse gas emissions.

4. Conclusions

Malaria transmission is linked to seasonal rainfall with one to two months lag. While the rainfall season peaks in July–August–September in Senegal, the malaria outbreak season peaks in September–October–November. Another important climate variable that influences malaria is temperature.
This study evaluated the ability and performance of the VECTRI model to simulate climate-influenced malaria transmission. With the annual cycle, the model performs well to reproduce a reasonable period of one month between the peak of EIR (September) and rainfall (August). The year-to-year variation showed a coherence in years of high and low malaria transmission between EIR and observed malaria cases. In other words, the VECTRI, to a lesser extent, simulates the interannual variability of malaria. In addition, as found with the observation data, the spatial distribution, which is unevenly distributed along the south–north direction of Senegal, was shown with the EIR. The breakdown into the north, center and south zones further highlighted this result.
Regarding the seasonality, the simulation depicted almost the exact representation of the observations in September–October–November, with high malaria transmission. Even if there are some discrepancies, the model displayed malaria’s spatial and temporal distribution in Senegal. The model performance showed satisfactory results, making it a tool that can study the impact of climate on the spread and transmission of malaria. The VECTRI, a simulation tool for climate-modulated malaria transmission, can help improve early health warning systems related to vector-borne epidemics. The next step in this work would use the VECTRI model and evaluate the ability of CORDEX-driven simulations to reproduce historical malaria features over the Senegal domain and to quantify projected changes under two RCPs, namely RCP.45 and RCP8.5. We plan to examine individual regional climate models’ downscaling and the multi-model ensemble coupled with the biological model (VECTRI) to improve our understanding of the timing and magnitude of regional malaria change over West Africa and Senegal. Bias corrected datasets of the Coupled Model Intercomparison Project (CMIP5) would be used as input to the VECTRI model for simulations of malaria parameters for different representative concentration pathway (RCP) scenarios and other periods. In the context of climate change, these results are expected to be useful for decision-makers who plan public health measures in affected countries, in Senegal, and elsewhere. These results can be helpful for stakeholders to develop mitigation and vector control strategies.

Author Contributions

P.F., assisted by I.D., performed the experimental activities, analyzed the data, and wrote the initial manuscript. A.D. conceived of and designed the study. A.D., I.D. and D.S. supervised the study, conducted discussions related to the clinical and climatic data availability and access, and improved the draft. All authors have read and agreed to the published version of the manuscript.

Funding

This study is part of the ANR project ACASIS (2014–2018, grant: ANR-13-SENV-0007) and of the JEAI IRD program through JEAI-CLISAS (Jeune Equipe Associée à l’IRD Climat et santé au Sénégal). The funders played no role in determining the study design, data collection or analysis methods employed, decision to publish, or preparing the paper.

Institutional Review Board Statement

Not applicable.

Informed Consent Statement

Not applicable.

Data Availability Statement

The reanalysis data used in this work were obtained from the Climate Data Store (CDS) of the European Centre for Medium-Range Weather Forecasts (ECMWF), i.e., this link https://cds.climate.copernicus.eu/cdsapp#!/dataset/reanalysis-era5-single-levels?tab=form (28 January 2020). Data are downloaded using a CDS API (python script). The observed malaria cases are available in the National Malaria Control Program (PNLP). The data processing is done using a Matlab language that includes several functions for mapping NetCDF data and organizing time.

Acknowledgments

We thank the PNLP who provided us with the observational data that was difficult to obtain. Further, the authors of this study thank the International Centre for Theoretical Physics (ICTP), where the VECTRI model is developed.

Conflicts of Interest

The authors declare no conflict of interest.

References

  1. Gomez-Elipe, A.; Otero, A.; van Herp, M.; Aguirre-Jaime, A. Forecasting Malaria Incidence Based on Monthly Case Reports and Environmental Factors in Karuzi, Burundi, 1997–2003. Malar. J. 2007, 6, 129. [Google Scholar] [CrossRef] [PubMed] [Green Version]
  2. Sachs, J.; Malaney, P. The Economic and Social Burden of Malaria. Nature 2002, 415, 680–685. [Google Scholar] [CrossRef] [PubMed]
  3. Carnevale, P.; Robert, V. (Eds.) Les Anophèles: Biologie, Transmission du Plasmodium et Lutte Antivectorielle; Didactiques, IRD Éditions: Marseille, France, 2017; ISBN 978-2-7099-2283-8. [Google Scholar]
  4. Laporta, G.Z.; Linton, Y.-M.; Wilkerson, R.C.; Bergo, E.S.; Nagaki, S.S.; Sant’Ana, D.C.; Sallum, M.A.M. Malaria Vectors in South America: Current and Future Scenarios. Parasites Vectors 2015, 8, 426. [Google Scholar] [CrossRef] [PubMed] [Green Version]
  5. Diouf, I.; Rodriguez Fonseca, B.; Caminade, C.; Thiaw, W.M.; Deme, A.; Morse, A.P.; Ndione, J.-A.; Gaye, A.T.; Diaw, A.; Ndiaye, M.K.N. Climate Variability and Malaria over West Africa. Am. J. Trop. Med. Hyg. 2020, 102, 1037–1047. [Google Scholar] [CrossRef] [PubMed]
  6. Metcalf, C.J.E.; Walter, K.S.; Wesolowski, A.; Buckee, C.O.; Shevliakova, E.; Tatem, A.J.; Boos, W.R.; Weinberger, D.M.; Pitzer, V.E. Identifying Climate Drivers of Infectious Disease Dynamics: Recent Advances and Challenges Ahead. Proc. R. Soc. B. 2017, 284, 20170901. [Google Scholar] [CrossRef]
  7. Patz, J.A.; Campbell-Lendrum, D.; Holloway, T.; Foley, J.A. Impact of Regional Climate Change on Human Health. Nature 2005, 438, 310–317. [Google Scholar] [CrossRef] [PubMed]
  8. Githeko, A.K.; Lindsay, S.W.; Confalonieri, U.E. Changement climatique et maladies à transmission vectorielle: Une analyse régionale. Bull. De L’Organ. Mond. De La Santé La Rev. Int. De Santé Publique Recl. D’Artic. 2001, 4, 62–72. [Google Scholar]
  9. Tantchou, J.C.; Ndoye, T. Ndoye Tidiane, 2009, La société sénégalaise face au paludisme. Politiques, savoirs et acteurs. Dakar-Paris, Crepos & Karthala. J. Afr. 2011, 245–247. [Google Scholar] [CrossRef]
  10. World Meteorological Organization; United Nations Environment Programme; Swiatowa Organizacja Zdrowia. Changement Climatique et Santé Humaine—Risques et Mesures à Prendre: Résumé; Organisation Mondiale de la Santé Genève: Geneva Switzerland, 2004; ISBN 978-92-4-259081-4. [Google Scholar]
  11. Pierrat, C. Risque palustre: Appréhender la vulnérabilité des individus à l’échelle locale (Sud du Bénin). VertigO-La Rev. Électronique En Sci. De L’environ. 2012, 11. [Google Scholar] [CrossRef]
  12. Mordecai, E.A.; Paaijmans, K.P.; Johnson, L.R.; Balzer, C.; Ben-Horin, T.; de Moor, E.; McNally, A.; Pawar, S.; Ryan, S.J.; Smith, T.C.; et al. Optimal Temperature for Malaria Transmission Is Dramatically Lower than Previously Predicted. Ecol. Lett. 2013, 16, 22–30. [Google Scholar] [CrossRef]
  13. Smith, D.L.; Ellis McKenzie, F. Statics and Dynamics of Malaria Infection in Anopheles Mosquitoes. Malar. J. 2004, 3, 13. [Google Scholar] [CrossRef] [Green Version]
  14. Hoshen, M.B.; Morse, A.P. A Weather-Driven Model of Malaria Transmission. Malar. J. 2004, 3, 32. [Google Scholar] [CrossRef] [Green Version]
  15. Yamana, T.K.; Eltahir, E.A. Early Warnings of the Potential for Malaria Transmission in Rural Africa Using the Hydrology, Entomology and Malaria Transmission Simulator (HYDREMATS). Malar. J. 2010, 9, 323. [Google Scholar] [CrossRef] [PubMed] [Green Version]
  16. Ndiaye, O.; Goddard, L.; Ward, M.N. Using Regional Wind Fields to Improve General Circulation Model Forecasts of July-September Sahel Rainfall. Int. J. Climatol. 2009, 29, 1262–1275. [Google Scholar] [CrossRef]
  17. Ngom, D.; Fall, T.; Sarr, O.; Diatta, S.; Akpo, L.E. Caractéristiques écologiques du peuplement ligneux de la réserve de biosphère du Ferlo (Nord Sénégal). J. App. Biosci. 2013, 65. [Google Scholar] [CrossRef] [Green Version]
  18. Besancenot, J.-P.; Handschumacher, P.; Ndione, J.-A.; Mbaye, I.; Laaidi, K. Climat, eau et santé au Sahel ouest-africain. Sci. Et Changements Planétaires/Sécheresse 2004, 15, 233–241. [Google Scholar]
  19. Mabaso, M.L.H.; Smith, T.; Ross, A.; Craig, M. Environmental predictors of the seasonality of malaria transmission in africa: The challenge. Am. J. Trop. Med. Hyg. 2007, 76, 33–38. [Google Scholar] [CrossRef] [PubMed] [Green Version]
  20. Markham, C.G. Seasonality of precipitation in the United States. Ann. Assoc. Am. Geogr. 1970, 60, 593–597. [Google Scholar] [CrossRef]
  21. Reiner, R.C., Jr.; Le Menach, A.; Kunene, S.; Ntshalintshali, N.; Hsiang, M.S.; Perkins, T.A.; Greenhouse, B.; Tatem, A.J.; Cohen, J.M.; Smith, D.L. Mapping Residual Transmission for Malaria Elimination. eLife 2015, 4, e09520. [Google Scholar] [CrossRef] [PubMed]
  22. Afrane, Y.A.; Githeko, A.K.; Yan, G. The Ecology of Anopheles Mosquitoes under Climate Change: Case Studies from the Effects of Environmental Changes in East Africa Highlands. Ann. N. Y. Acad. Sci. 2012, 1249, 204–210. [Google Scholar] [CrossRef]
  23. Appawu, M.; Owusu-Agyei, S.; Dadzie, S.; Asoala, V.; Anto, F.; Koram, K.; Rogers, W.; Nkrumah, F.; Hoffman, S.L.; Fryauff, D.J. Malaria Transmission Dynamics at a Site in Northern Ghana Proposed for Testing Malaria Vaccines. Trop. Med. Int. Health 2004, 9, 164–170. [Google Scholar] [CrossRef] [PubMed]
  24. Fontenille, D.; Lochouarn, L.; Diatta, M.; Sokhna, C.; Dia, I.; Diagne, N.; Lemasson, J.-J.; Ba, K.; Tall, A.; Rogier, C.; et al. Four Years’ Entomological Study of the Transmission of Seasonal Malaria in Senegal and the Bionomics of Anopheles Gambiae and A. Arabiensis. Trans. R. Soc. Trop. Med. Hyg. 1997, 91, 647–652. [Google Scholar] [CrossRef]
  25. Shililu, J.; Ghebremeskel, T.; Mengistu, S.; Fekadu, H.; Zerom, M.; Mbogo, C.; Githure, J.; Novak, R.; Brantly, E.; Beier, J.C. High Seasonal Variation in Entomologic Inoculation Rates in Eritrea, a Semi-Arid Region of Unstable Malaria in Africa. Am. J. Trop. Med. Hyg. 2003, 69, 607–613. [Google Scholar] [CrossRef]
  26. Gilman, R.H.; Tielsch, J.; Glass, G.; Shields, T.; Vittor, A.Y.; Lozano, W.S.; Pinedo-Cancino, V.; Patz, J.A. The effect of deforestation on the human-biting rate of anopheles darlingi, the primary vector of falciparum malaria in the peruvian amazon. Am. J. Trop. Med. Hyg. 2006, 74, 3–11. [Google Scholar] [CrossRef] [Green Version]
  27. Kelly-Hope, L.A.; McKenzie, F.E. The Multiplicity of Malaria Transmission: A Review of Entomological Inoculation Rate Measurements and Methods across Sub-Saharan Africa. Malar. J. 2009, 8, 19. [Google Scholar] [CrossRef] [PubMed] [Green Version]
  28. Tompkins, A.M.; Ermert, V. A Regional-Scale, High Resolution Dynamical Malaria Model That Accounts for Population Density, Climate and Surface Hydrology. Malar. J. 2013, 12, 65. [Google Scholar] [CrossRef] [PubMed] [Green Version]
  29. Craig, M.H.; Snow, R.W.; le Sueur, D. A Climate-Based Distribution Model of Malaria Transmission in Sub-Saharan Africa. Parasitol. Today 1999, 15, 105–111. [Google Scholar] [CrossRef]
  30. Tompkins, A.M.; Thomson, M.C. Uncertainty in Malaria Simulations in the Highlands of Kenya: Relative Contributions of Model Parameter Setting, Driving Climate and Initial Condition Errors. PLoS ONE 2018, 13, e0200638. [Google Scholar] [CrossRef] [PubMed]
  31. Tompkins, A.M.; Colón-González, F.J.; Di Giuseppe, F.; Namanya, D.B. Dynamical Malaria Forecasts Are Skillful at Regional and Local Scales in Uganda up to 4 Months Ahead. GeoHealth 2019, 3, 58–66. [Google Scholar] [CrossRef]
  32. Karypidou, M.C.; Almpanidou, V.; Tompkins, A.M.; Mazaris, A.D.; Gewehr, S.; Mourelatos, S.; Katragkou, E. Projected Shifts in the Distribution of Malaria Vectors Due to Climate Change. Clim. Chang. 2020, 163, 2117–2133. [Google Scholar] [CrossRef]
  33. Chaturvedi, S.; Dwivedi, S. Understanding the Effect of Climate Change in the Distribution and Intensity of Malaria Transmission over India Using a Dynamical Malaria Model. Int. J. Biometeorol. 2021, 65, 1161–1175. [Google Scholar] [CrossRef] [PubMed]
  34. Diouf, I.; Rodriguez-Fonseca, B.; Deme, A.; Caminade, C.; Morse, A.; Cisse, M.; Sy, I.; Dia, I.; Ermert, V.; Ndione, J.-A.; et al. Comparison of Malaria Simulations Driven by Meteorological Observations and Reanalysis Products in Senegal. Ijerph 2017, 14, 1119. [Google Scholar] [CrossRef] [PubMed] [Green Version]
  35. Hersbach, H.; Bell, B.; Berrisford, P.; Hirahara, S.; Horányi, A.; Muñoz-Sabater, J.; Nicolas, J.; Peubey, C.; Radu, R.; Schepers, D.; et al. The ERA5 Global Reanalysis. Q. J. R. Meteorol. Soc. 2020, 146, 1999–2049. [Google Scholar] [CrossRef]
  36. Novella, N.S.; Thiaw, W.M. African Rainfall Climatology Version 2 for Famine Early Warning Systems. J. Appl. Meteorol. Climatol. 2013, 52, 588–606. [Google Scholar] [CrossRef]
  37. Chen, M.; Shi, W.; Xie, P.; Silva, V.B.S.; Kousky, V.E.; Wayne Higgins, R.; Janowiak, J.E. Assessing Objective Techniques for Gauge-Based Analyses of Global Daily Precipitation. J. Geophys. Res. 2008, 113, D04110. [Google Scholar] [CrossRef]
  38. Bodian, A.; Diop, L.; Panthou, G.; Dacosta, H.; Deme, A.; Dezetter, A.; Ndiaye, P.M.; Diouf, I.; Vischel, T. Recent Trend in Hydroclimatic Conditions in the Senegal River Basin. Water 2020, 12, 436. [Google Scholar] [CrossRef] [Green Version]
  39. Caminade, C.; Jones, A.E. Malaria in a Warmer West Africa. Nat. Clim. Chang. 2016, 6, 984–985. [Google Scholar] [CrossRef]
  40. Deme, A.; Gaye, A.T.; Hourdin, F. Chapter 3. Climate Projections in West Africa: The Obvious and the Uncertain. In Rural Societies in the Face of Climatic and Environmental Changes in West Africa; Sultan, B., Lalou, R., Sanni, M.A., Oumarou, A., Arame Soumaré, M., Eds.; IRD Éditions: Marseille, France, 2017; pp. 61–86. ISBN 978-2-7099-2424-5. Available online: https://books.openedition.org/irdeditions/12325 (accessed on 27 December 2021).
  41. Barbier, J.; Guichard, F.; Bouniol, D.; Couvreux, F.; Roehrig, R. Detection of Intraseasonal Large-Scale Heat Waves: Characteristics and Historical Trends during the Sahelian Spring. J. Clim. 2018, 31, 61–80. [Google Scholar] [CrossRef]
  42. Diouf, I.; Deme, A.; Ndione, J.-A.; Gaye, A.T.; Rodríguez-Fonseca, B.; Cissé, M. Climate and Health: Observation and Modeling of Malaria in the Ferlo (Senegal). Comptes Rendus Biol. 2013, 336, 253–260. [Google Scholar] [CrossRef]
  43. M’Bra, R.K.; Kone, B.; Soro, D.P.; N’krumah, R.T.A.S.; Soro, N.; Ndione, J.A.; Sy, I.; Ceccato, P.; Ebi, K.L.; Utzinger, J.; et al. Impact of Climate Variability on the Transmission Risk of Malaria in Northern Côte d’Ivoire. PLoS ONE 2018, 13, e0182304. [Google Scholar] [CrossRef]
  44. Laneri, K.; Bhadra, A.; Ionides, E.L.; Bouma, M.; Dhiman, R.C.; Yadav, R.S.; Pascual, M. Forcing Versus Feedback: Epidemic Malaria and Monsoon Rains in Northwest India. PLoS Comput. Biol. 2010, 6, e1000898. [Google Scholar] [CrossRef] [PubMed]
  45. Gupta, S.; Hill, A.V.S. Dynamic Interactions in Malaria: Host Heterogeneity Meets Parasite Polymorphism. Proc. R. Soc. Lond. Ser. B Biol. Sci. 1995, 261, 271–277. [Google Scholar] [CrossRef]
  46. Kapwata, T.; Wright, C.Y.; du Preez, D.J.; Kunene, Z.; Mathee, A.; Ikeda, T.; Landman, W.; Maharaj, R.; Sweijd, N.; Minakawa, N.; et al. Exploring Rural Hospital Admissions for Diarrhoeal Disease, Malaria, Pneumonia, and Asthma in Relation to Temperature, Rainfall and Air Pollution Using Wavelet Transform Analysis. Sci. Total Environ. 2021, 791, 148307. [Google Scholar] [CrossRef] [PubMed]
  47. Mordecai, E.A.; Caldwell, J.M.; Grossman, M.K.; Lippi, C.A.; Johnson, L.R.; Neira, M.; Rohr, J.R.; Ryan, S.J.; Savage, V.; Shocket, M.S.; et al. Thermal Biology of Mosquito-borne Disease. Ecol. Lett. 2019, 22, 1690–1708. [Google Scholar] [CrossRef] [Green Version]
  48. Adewi, E. Variabilité Climatique et Paludisme a Kara, une Ville du Nord-Togo. 2012, p. 7. Available online: https://halshs.archives-ouvertes.fr/halshs-00730728 (accessed on 27 December 2021).
  49. Abiodun, G.J.; Maharaj, R.; Witbooi, P.; Okosun, K.O. Modelling the Influence of Temperature and Rainfall on the Population Dynamics of Anopheles Arabiensis. Malar. J. 2016, 15, 364. [Google Scholar] [CrossRef] [Green Version]
  50. Sultan, B.; Janicot, S. The West African Monsoon Dynamics. Part II: The “Preonset” and “Onset” of the Summer Monsoon. J. Clim. 2003, 16, 3407–3427. [Google Scholar] [CrossRef]
  51. Ryan, S.J.; McNally, A.; Johnson, L.R.; Mordecai, E.A.; Ben-Horin, T.; Paaijmans, K.; Lafferty, K.D. Mapping Physiological Suitability Limits for Malaria in Africa Under Climate Change. Vector Borne Zoonotic Dis. 2015, 15, 718–725. [Google Scholar] [CrossRef] [Green Version]
  52. Altizer, S.; Dobson, A.; Hosseini, P.; Hudson, P.; Pascual, M.; Rohani, P. Seasonality and the Dynamics of Infectious Diseases. Ecol. Lett. 2006, 9, 467–484. [Google Scholar] [CrossRef] [Green Version]
  53. Asare, E.; Amekudzi, L. Assessing Climate Driven Malaria Variability in Ghana Using a Regional Scale Dynamical Model. Climate 2017, 5, 20. [Google Scholar] [CrossRef] [Green Version]
  54. The Lancet A Commission on Climate Change. Lancet 2009, 373, 1659. Available online: https://www.thelancet.com/journals/lancet/article/PIIS0140-6736(09)60922-3/fulltext#articleInformation (accessed on 27 December 2021). [CrossRef]
Figure 1. Map of Senegal with its fourteen administrative regions (at left): located in the far west of the African continent, Senegal is between latitudes 12°–17° N and longitudes 18°–11° W.
Atmosphere 13 00418 g001
Figure 2. Schematic of the VECTRI model: The top row shows the status of the larvae divided into a series of trays representing stage development. The “X” represents the density of larvae in a specific fractional growth stage. The middle block represents the state vector in two dimensions: the development of the egg in women and the infectious state. The lower row models the infection state of the host. The curved arrows represent the direction of the larva, the vector, and the host state, while the straight red arrows indicate the parasite transmission pathways between the host and the vector (Tompkins and Ermert, 2013).
Atmosphere 13 00418 g002
Scheme 1. Description of the National Malaria Control Program (PNLP) network covering the public health centers in Senegal: The various steps consist of collecting and processing the data, analyzing the results, and disseminating governmental reports.
Atmosphere 13 00418 sch001
Figure 3. Spatio-temporal variability of rainfall in Senegal from 2009–2019: the annual cycle of rainfall (a), interannual variability of rainfall (b), and spatial distribution of rainfall for CPC (c), ARC2 (d), CHIRPS (e), and ERA5 (f).
Atmosphere 13 00418 g003
Figure 4. Spatio-temporal variability of temperature in Senegal from 2009–2019: spatial distribution temperature (a), annual cycle temperature (b), and interannual variability of temperature (c).
Atmosphere 13 00418 g004
Figure 5. Spatio-temporal variability in the number of confirmed malaria cases in Senegal from 2009–2019: annual cycle (a), interannual variability (b), and spatial distribution of confirmed malaria cases (c).
Atmosphere 13 00418 g005
Figure 6. Spatio-temporal variability of the EIR (entomological inoculation rate) in Senegal for the period 2009–2019: annual cycle (a), interannual variability (b), and spatial distribution for CPC (c), ARC2 (d), CHIRPS (e), and ERA5 (f).
Atmosphere 13 00418 g006
Figure 7. Comparison of the intra- and interannual variability of temperature, rainfall, number of confirmed cases of malaria, and EIR in Senegal from 2009–2019: the annual cycle of CPC (a), ARC2 (b), CHIRPS (c), ERA5 (d), and interannual variability of rainfall (e) and temperature (f).
Atmosphere 13 00418 g007
Figure 8. Intra- and interannual variability of malaria cases and simulated malaria parameter (EIR in ib/p/m) in Senegal from 2009–2019: malaria case (a) and EIR (ib/p/m) (b) for ERA5.
Atmosphere 13 00418 g008
Figure 9. Comparison of the spatial distribution of malaria cases and simulated malaria parameter (EIR in ib/p/m) in Senegal from 2009–2019: malaria case (a) and EIR (ib/p/m) (b) for ERA5.
Atmosphere 13 00418 g009
Figure 10. Comparison of the mean annual cycle between observed malaria cases and the EIR by agro-climatic zones in Senegal for 2009–2019: north zone (a), center zone (b), and south zone (c).
Atmosphere 13 00418 g010
Figure 11. Comparison of the interannual variability between the number of confirmed malaria cases and the EIR parameter in the agro-climatic zones of Senegal for the period 2009–2019: north zone (a), center zone (b), southwest (c), and southeast (d).
Atmosphere 13 00418 g011
Figure 12. Comparison of the spatial variability between the data of the number of confirmed cases of malaria and EIR in agro-climatic zones in Senegal from 2009–2019: temperature in DJF (a), MAM (b), JJA (c), SON (d); rainfall in DJF (e), MAM (f), JJA (g), SON (h); EIR in DJF (i), MAM (j), JJA (k), SON (l); and malaria cases in DJF (m), MAM (n), JJA (o), SON (p).
Atmosphere 13 00418 g012
Table 1. Datasets and stations: this table summarizes the available datasets, periods, and spatial resolution of gridded data.
Clinical DatasetsPeriodRegion
Malaria Cases (observations)2009–20191. Dakar, 2. Diourbel, 3. Fatick, 4. Kaffrine, 5. Kaolack, 6. Kedougou, 7. Kolda, 8. Louga, 9. Matam, 10. Saint-Louis, 11. Sedhiou, 12. Tambacounda, 13. Thiès, 14. Ziguinchor
Climate DatasetsPeriodGrid
ERA5
(rainfall and temperature)
2009–20190.25° × 0.25° (25 km × 25 km)
CHIRPS
(rainfall)
2009–20190.05° × 0.05° (5 km × 5 km)
ARC2
(rainfall)
2009–20190.1° × 0.1° (10 km × 10 km)
CPC
(rainfall)
2009–20190.25° × 0.25° (25 km × 25 km)
Publisher’s Note: MDPI stays neutral with regard to jurisdictional claims in published maps and institutional affiliations.

