Article

Emission from Internal Combustion Engines and Battery Electric Vehicles: Case Study for Poland

by
Magdalena Zimakowska-Laskowska
1,* and
Piotr Laskowski
2
1
The National Centre for Emissions Management, Institute of Environmental Protection—National Research Institute, Chmielna 132/134, 00-805 Warsaw, Poland
2
Faculty of Automotive and Construction Machinery Engineering, Warsaw University of Technology, Narbutta 84, 02-524 Warsaw, Poland
*
Author to whom correspondence should be addressed.
Atmosphere 2022, 13(3), 401; https://doi.org/10.3390/atmos13030401
Submission received: 25 January 2022 / Revised: 17 February 2022 / Accepted: 25 February 2022 / Published: 28 February 2022
(This article belongs to the Special Issue Air Quality in Poland)

Abstract

:
The paper compares the emissions from vehicles including ICEVs (internal combustion engine vehicles) with equivalent emissions from BEVs (battery electric vehicles). Additionally, it analyzes the available source research and the specific energy mix for Poland based on carbon. Mathematical calculations estimate air pollutant emissions. To carry out the analysis and calculations, data were provided by the manufacturers of electricity consumption in the case of vehicles equipped with electric motors and the COPERT model for internal combustion engines. Air pollutants are considered: CO2, NOx, SOx, CO, and Total Suspended Particles (TSP). In addition to exhaust emissions, all solids emissions from road abrasion and tire and brake wear are also considered. The emission of pollutants is estimated based on the emission factors using the average mileage in Polish conditions. The paper compares emissions for three scenarios considering electric vehicles, combustion engine cars, and hybrid cars. Analyses show that introducing cars with electric engines into traffic at the expense of withdrawing vehicles with internal combustion engines is not favorable in Polish conditions. The analysis indicates that CO, CO2, and TSP emissions have decreased, while NOx and SOx emissions have increased.

1. Introduction

Air pollution is one of the major environmental risk factors for health globally, including in Poland. The transport sector, in particular, road transport, is the main source of this health burden [1,2]. The European Union and its member states are taking several measures to reduce the negative impact of transport on the environment and health. The transport sector in Europe has achieved major reductions in some air pollutants emissions, mainly due to emission standards, financial measures, alternative fuels, and transport avoidance measures [3]. However, emissions from the EU (European Union) transport sector are not declining enough to reduce its environmental and climate impacts in Europe. Greenhouse gas (GHGs) emissions from the transport sector have grown over the last three years; it is also the main source of dust, nitrogen dioxide, and noise emissions [4].
Recent efforts to reduce air pollutant emissions from ICEVs (internal combustion engine vehicles) are essential to the attention that needs to be given to reducing carbon dioxide emissions from road transport. Improvements in exhaust emission control technologies introduced by each new Euro standard in Europe, including Poland, significantly reduced NOx (nitrogen oxides) and PM (particulate matter) emissions from the rise in the 1990s [5,6]. Despite these reductions, emissions from Euro 5 and 6 diesel PCs (passenger cars) and ICELDVs (light commercial vehicles) remained well above the regulated NOx limit under real conditions [5,6,7,8]. However, the latest Euro standards are based on an RDE (Real Driving Test), resulting in manufacturers introducing previously available and effective NOx control technologies to new diesel vehicles. The latest Euro standard could finally deliver “the desired real performance required to improve urban air quality in Europe” [9]. This current improvement in real NOx emissions was used in this study to predict how future ICE vehicle improvements in the fleet may perform compared to the fleet with the introduction of electric vehicles. It is worth noting that the use of alternative fuels also contributes to the reduction of NOx and PM (particulate matter–treated as TSP–Total Suspended Particles) emissions [9,10].
This urgent need to tackle air pollution is also evident in efforts to mitigate climate change, with attention recently focused on achieving net ‘zero’ greenhouse gas emissions by 2050 [5] through the implementation of fit55. The assumptions of the European Green Deal and the pursuit of climate neutrality influence the development of BEVs. [11,12]. Reducing road transport emissions is a major factor in meeting air pollution and climate goals. The promise of new technologies such as electric vehicles (EVs) can help meet these goals. However, this decarbonization pathway with electric vehicles needs to consider the resulting impacts on air quality.
The number of BEVs, primarily electric passenger cars, has increased significantly in recent years as the policies of many governments continue to encourage the electrification of the vehicle fleet [12,13]. Vehicle electrification has been recognized as an air pollution solution that offers zero emissions and promises cleaner urban air [13]. In Poland in 2020, 18,875 electric vehicles were registered from a total of 23,880,164 of all registered vehicles [14,15]. Will the pursuit of electromobility improve air quality and reduce CO2 (carbon dioxide) and pollution emissions? Electric vehicles do not emit from the exhaust pipe but can you say that they provide locally zero emissions? Additionally, they need a source powered in Poland for BEVs to drive.
It should be noted that apart from poor local air quality, in Poland, almost 80% of electricity comes from hard coal and lignite [16]. The production of electricity from natural gas accounts for 8%. The share of energy from renewable sources (RES) in the final energy consumption in Poland in 2020 was 16.13% [17].
It should also be remembered that the source of emissions from vehicles is not just the exhaust pipe. However, supporters of electro-climate often neglect particulate matter (PM) emissions from non-exhaust emissions, including brake wear, tire wear, road wear, and re-suspension of road dust. Non-exhaust emissions have been identified as a key factor for PM in the environment as the tailpipe emissions standards for ICEVs become more stringent [13,18,19]. Emissions without exhaust gases, particulate matter emissions resulting from abrasion of brakes, tires, and road surfaces currently exceed exhaust emissions for PM2.5 and PM10 in Europe [5,20]. This is due to improvements in the exhaust system of control technology in ICEVs which has coincided with the growing interest in zero-emissions vehicles, i.e., BEVs. The increased importance of clean emissions and the increasing number of BEVs have led to a discussion in the literature comparing the exhaust and zero emissions rates of individual BEVs and ICEVs. The difference in exhaust emissions for electric vehicles is based on the relationship between the vehicle’s curb weight and the exhaust emission values [5,19,20,21]. Such a relationship would increase tire and road emissions for electric vehicles as they have a higher curb weight than ICEVs, mainly due to the electric vehicle battery. However, regenerative braking can reduce the wear emissions of electric vehicles’ brakes. Numerous studies have shown how a fleet of electrified passenger cars can significantly improve air quality [5,7,22].
Analyzing the existing literature [13,22] on non-exhaust emissions from different vehicle categories, this review concluded a positive relationship between mass and non-exhaust PM emission factors. In addition, BEVs were found to be 24% heavier than equivalent ICEVs. As a result, the total PM10 emissions from electric vehicles were found to be equal to those from modern ICEVs. PM2.5 emissions were only 1–3% lower for BEVs compared to modern ICEVs. It can therefore be concluded that the increased popularity of electric vehicles is not likely to have a large impact on the levels of PM. Non-exhaust emissions already account for over 90% of PM10 emissions and 85% of PM2.5 emissions from road traffic. These proportions will continue to increase as emission standards improve and the average vehicle weight increases. Future policy should consequently focus on setting emission standards and encouraging the reduction of the weight of all vehicles in order to significantly reduce particulate emissions from road traffic.

2. Materials and Methods

The article compares the emission of harmful substances caused by ICEVs and BEVs. Based on the sets of parameters that affect fuel consumption and, consequently, the emission of harmful substances (described in three criteria, as below), pairs of vehicles (fuel-powered vs. electric) are compiled together. To compare emissions with ICEV PCs and LDVs with BEVs, we selected the vehicles in pairs corresponding to the vehicle category: Mini, Small, Medium, and Large-SUV-Executive. The classification criteria were chosen based on: maximum power output, geometrical dimensions, and similar rolling resistance and hence a similar energy consumption and emissions [23]. The methodology of selecting vehicle pairs is presented in the article [23].
Based on the various traffic situations in Polish cities, the authors want to check the impact of the type and Euro standards on emissions. The simulations were performed in three scenarios for CO2 CO (carbon monoxide), NOx, TSP, and SOx (Sulfur oxide):
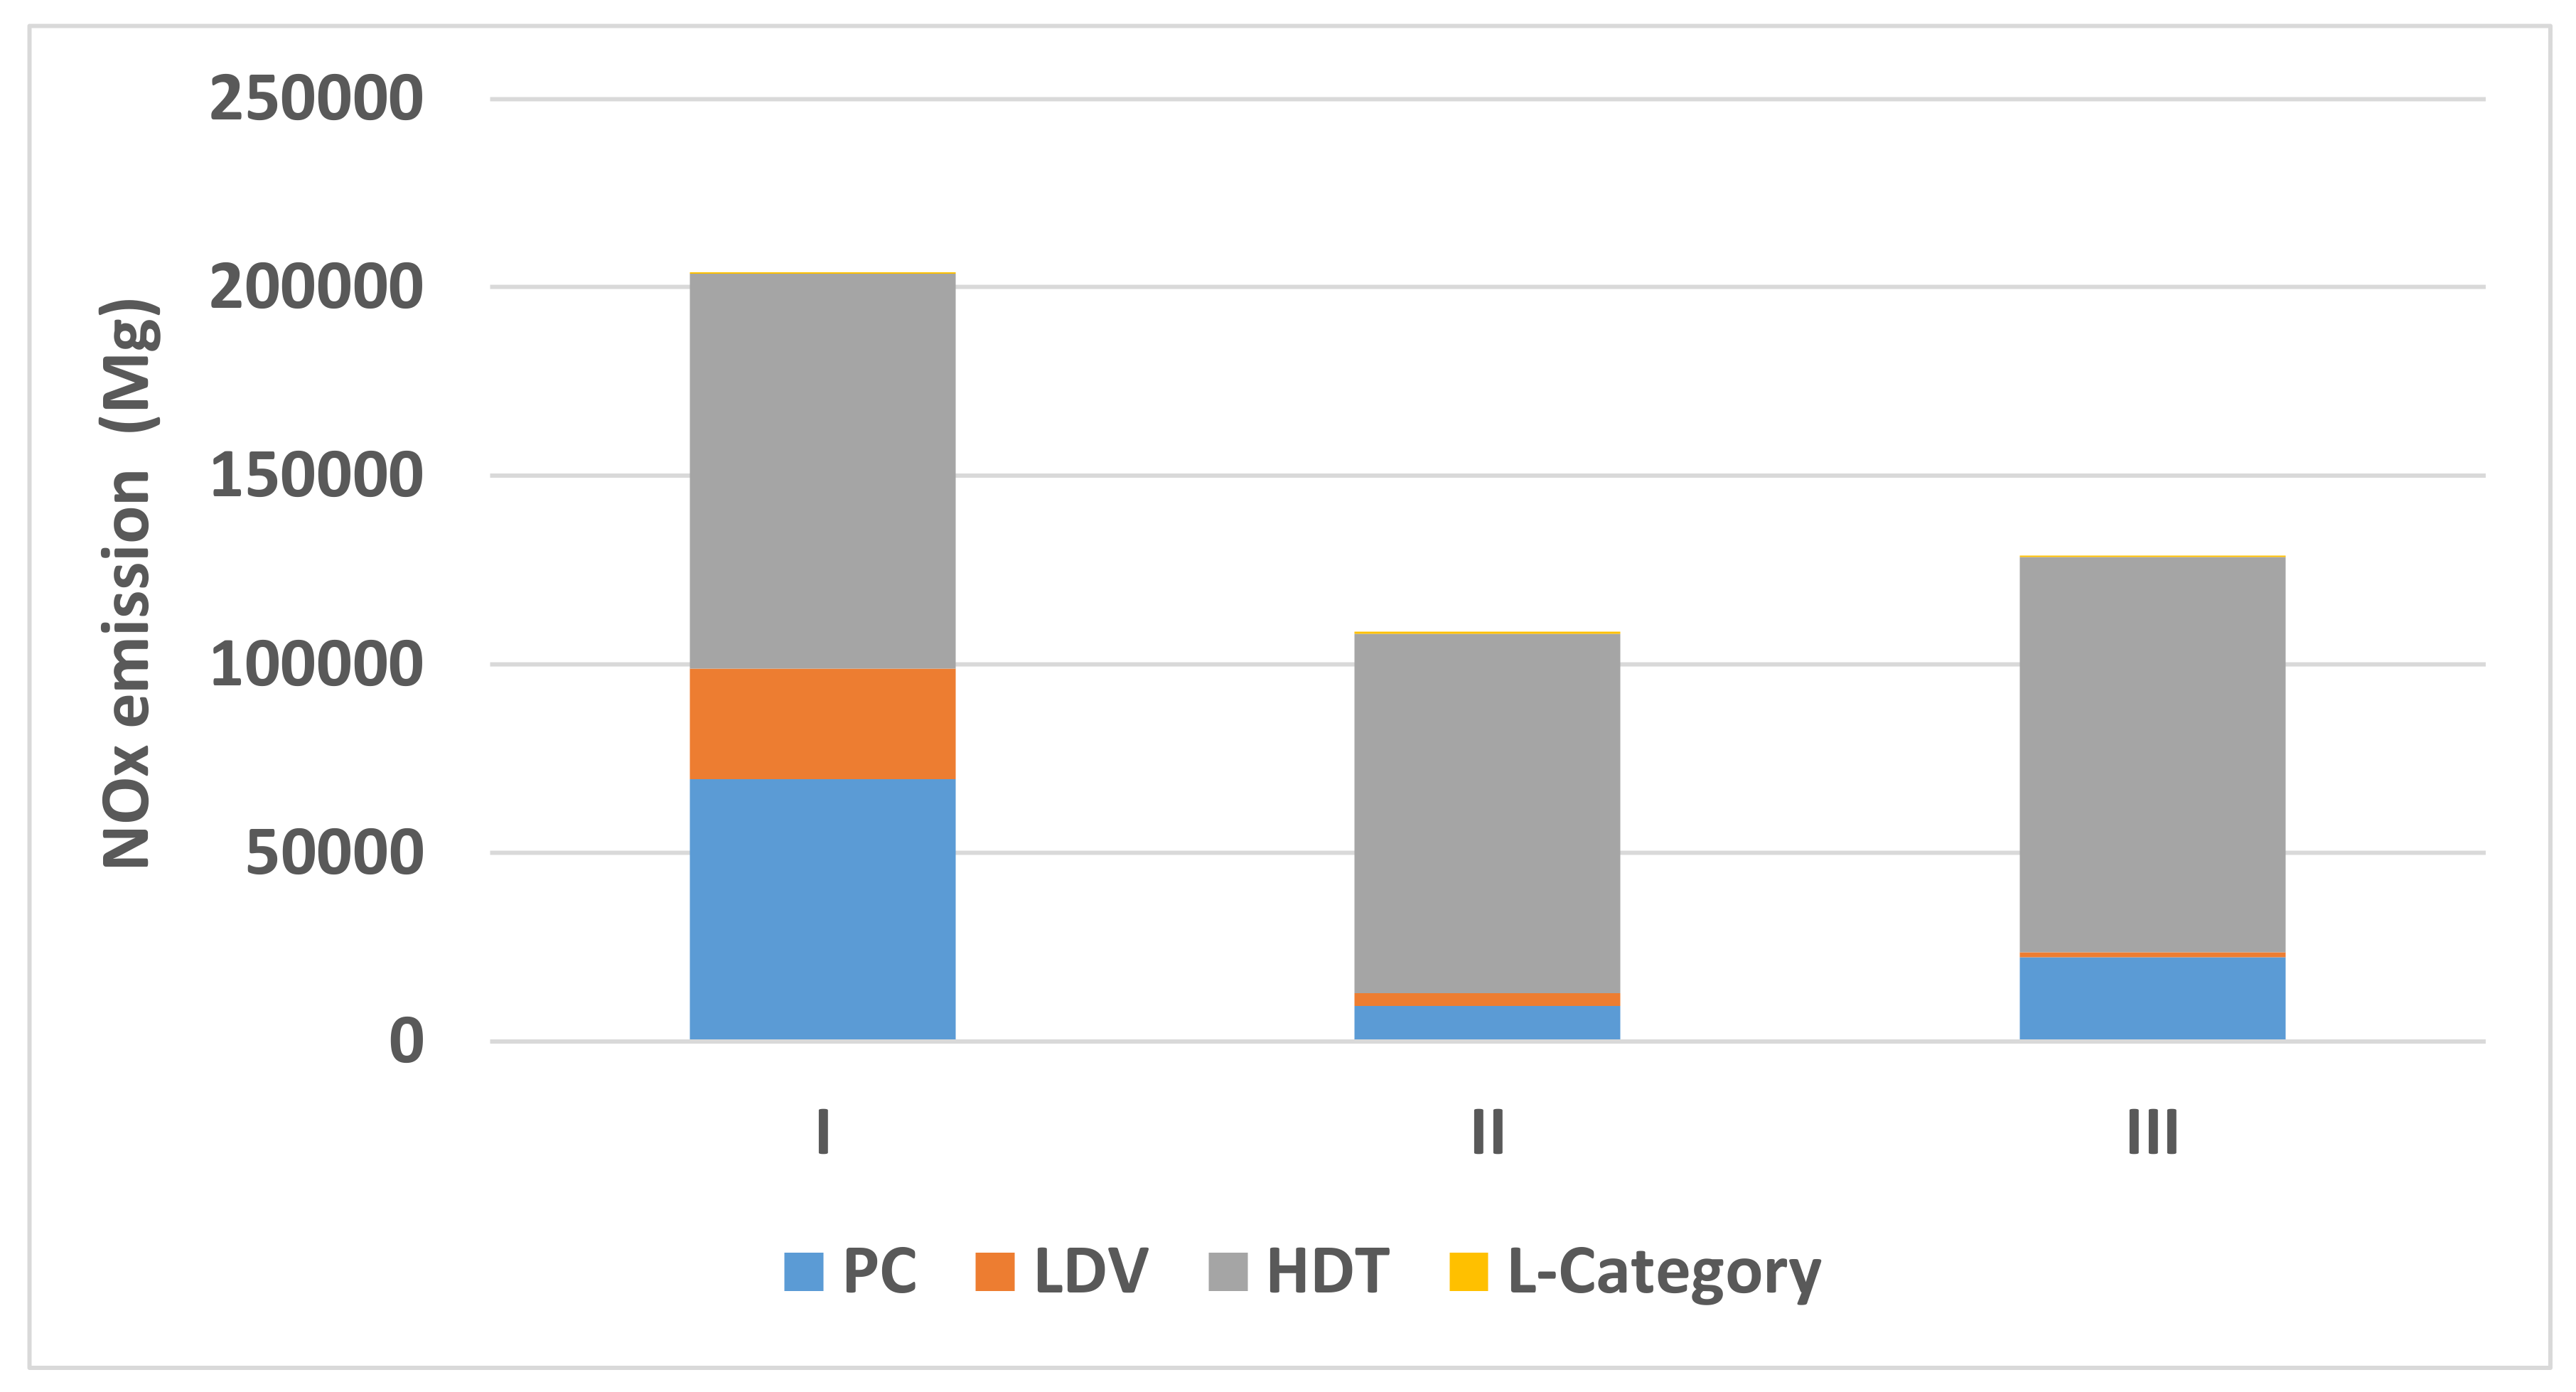
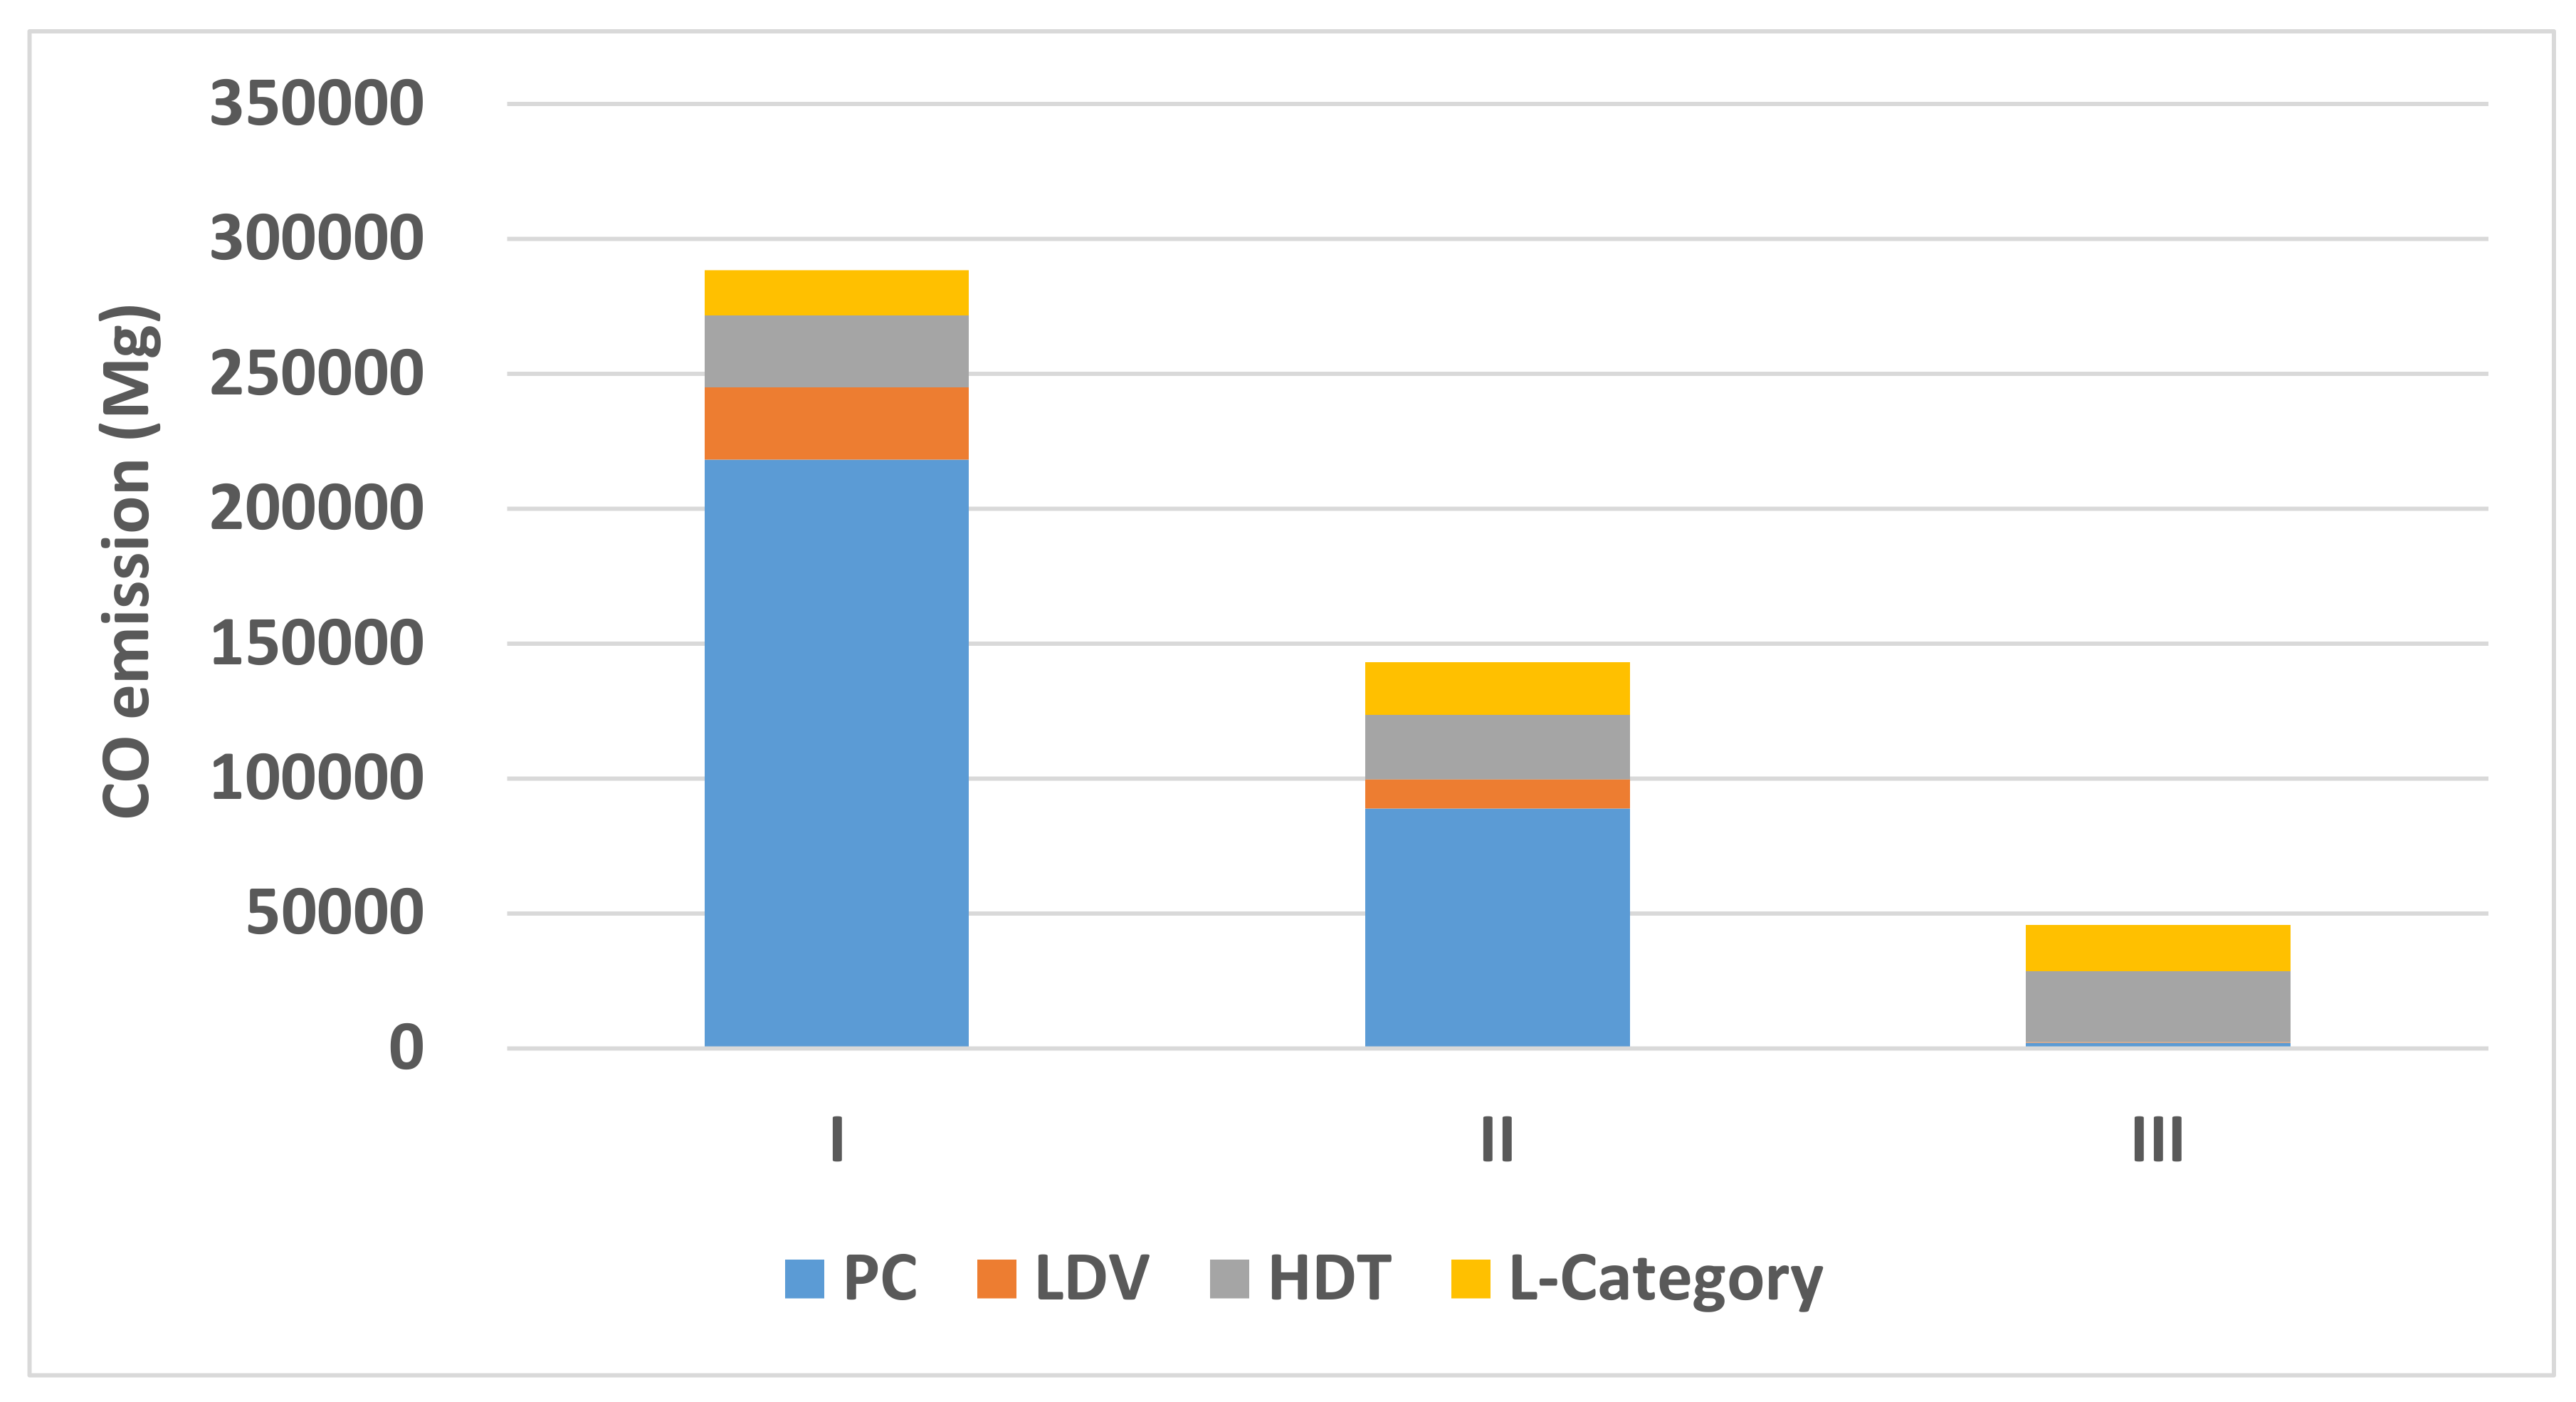
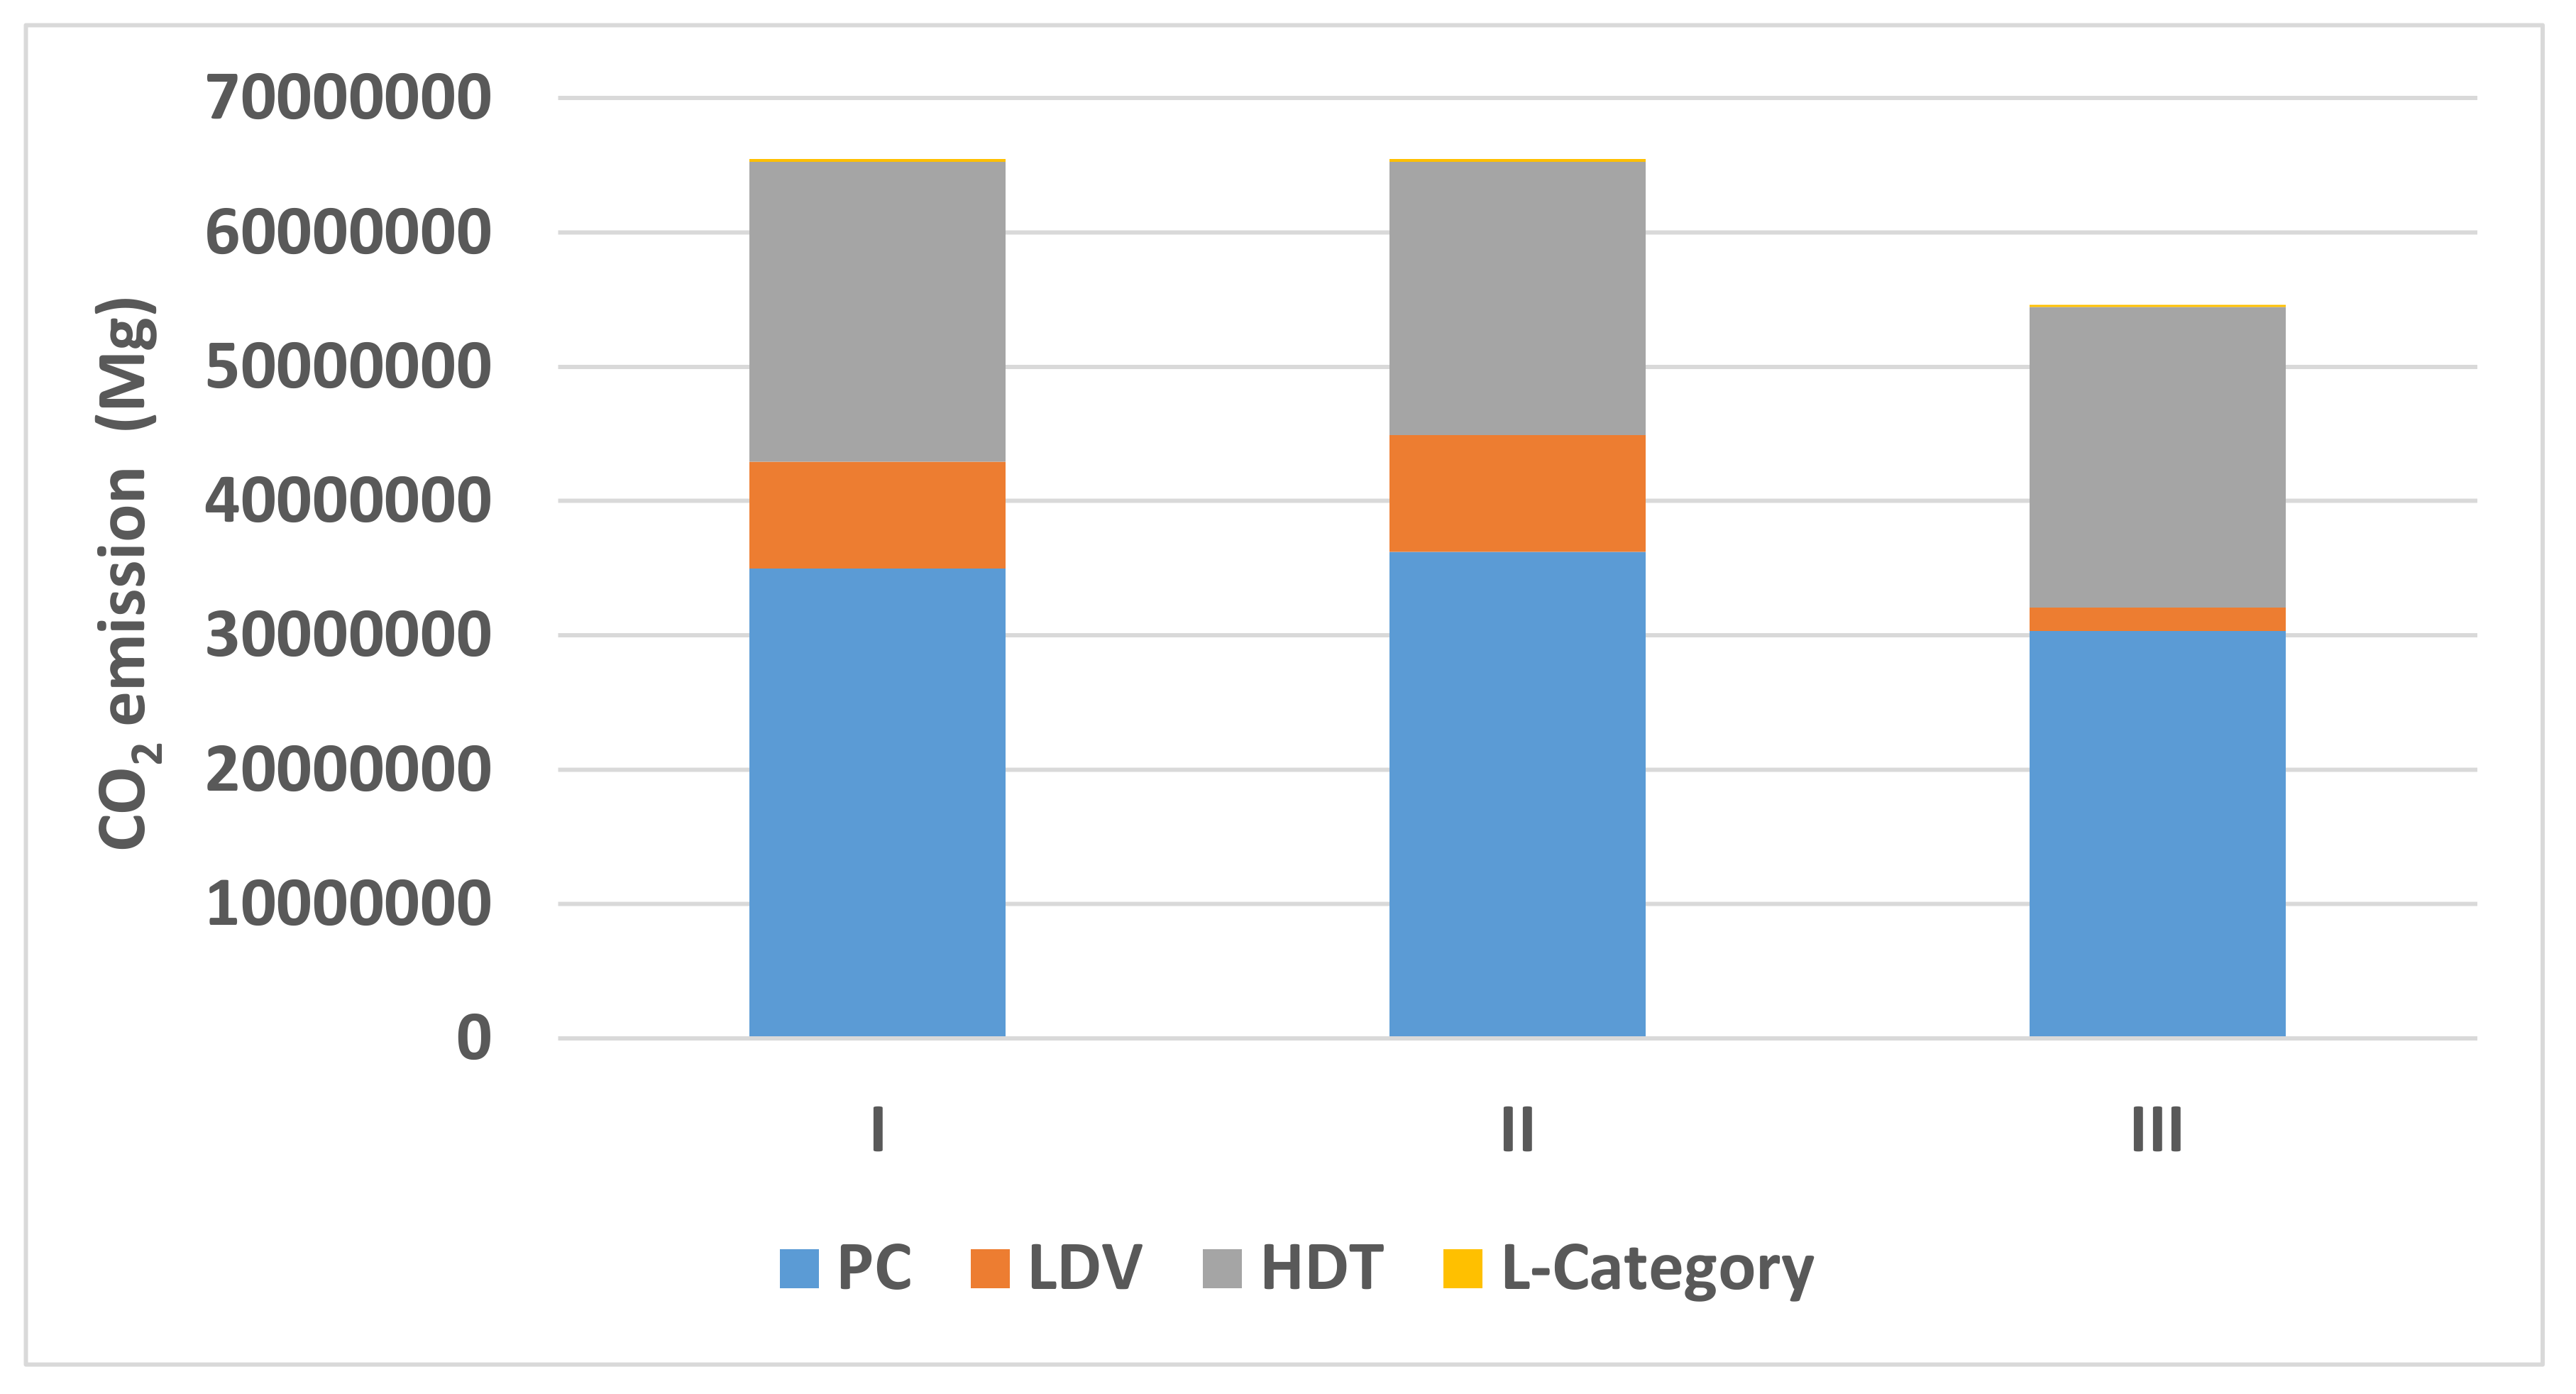
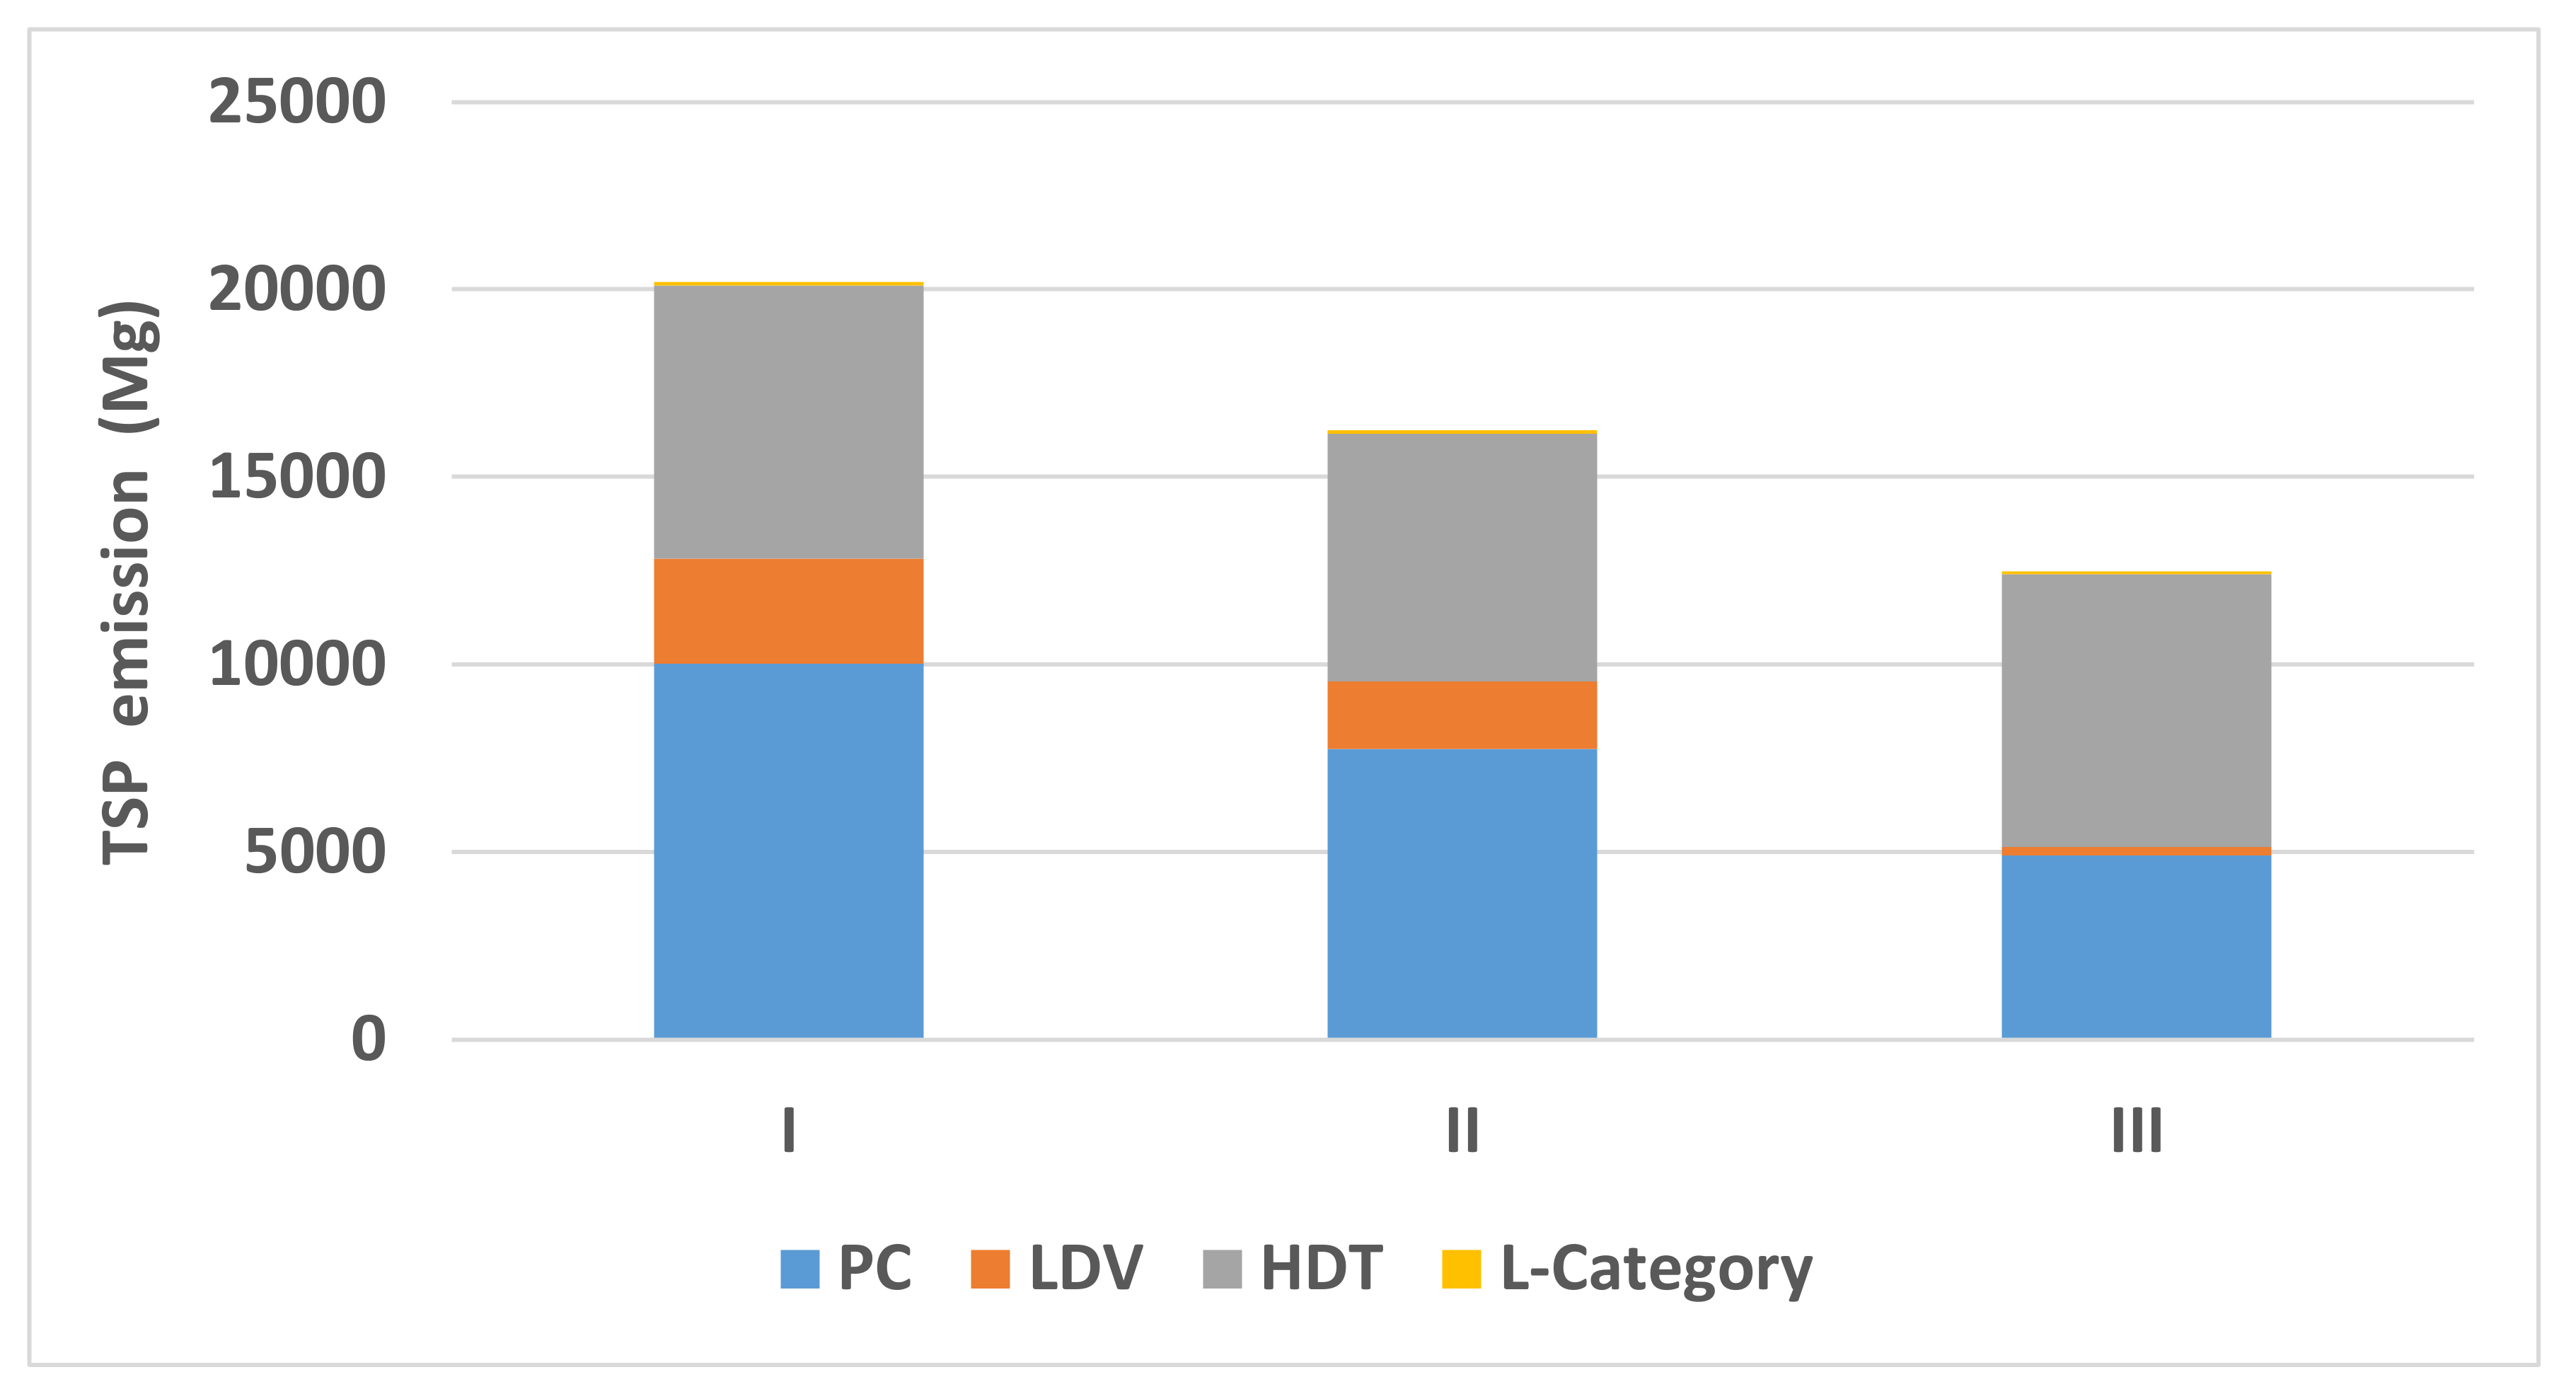
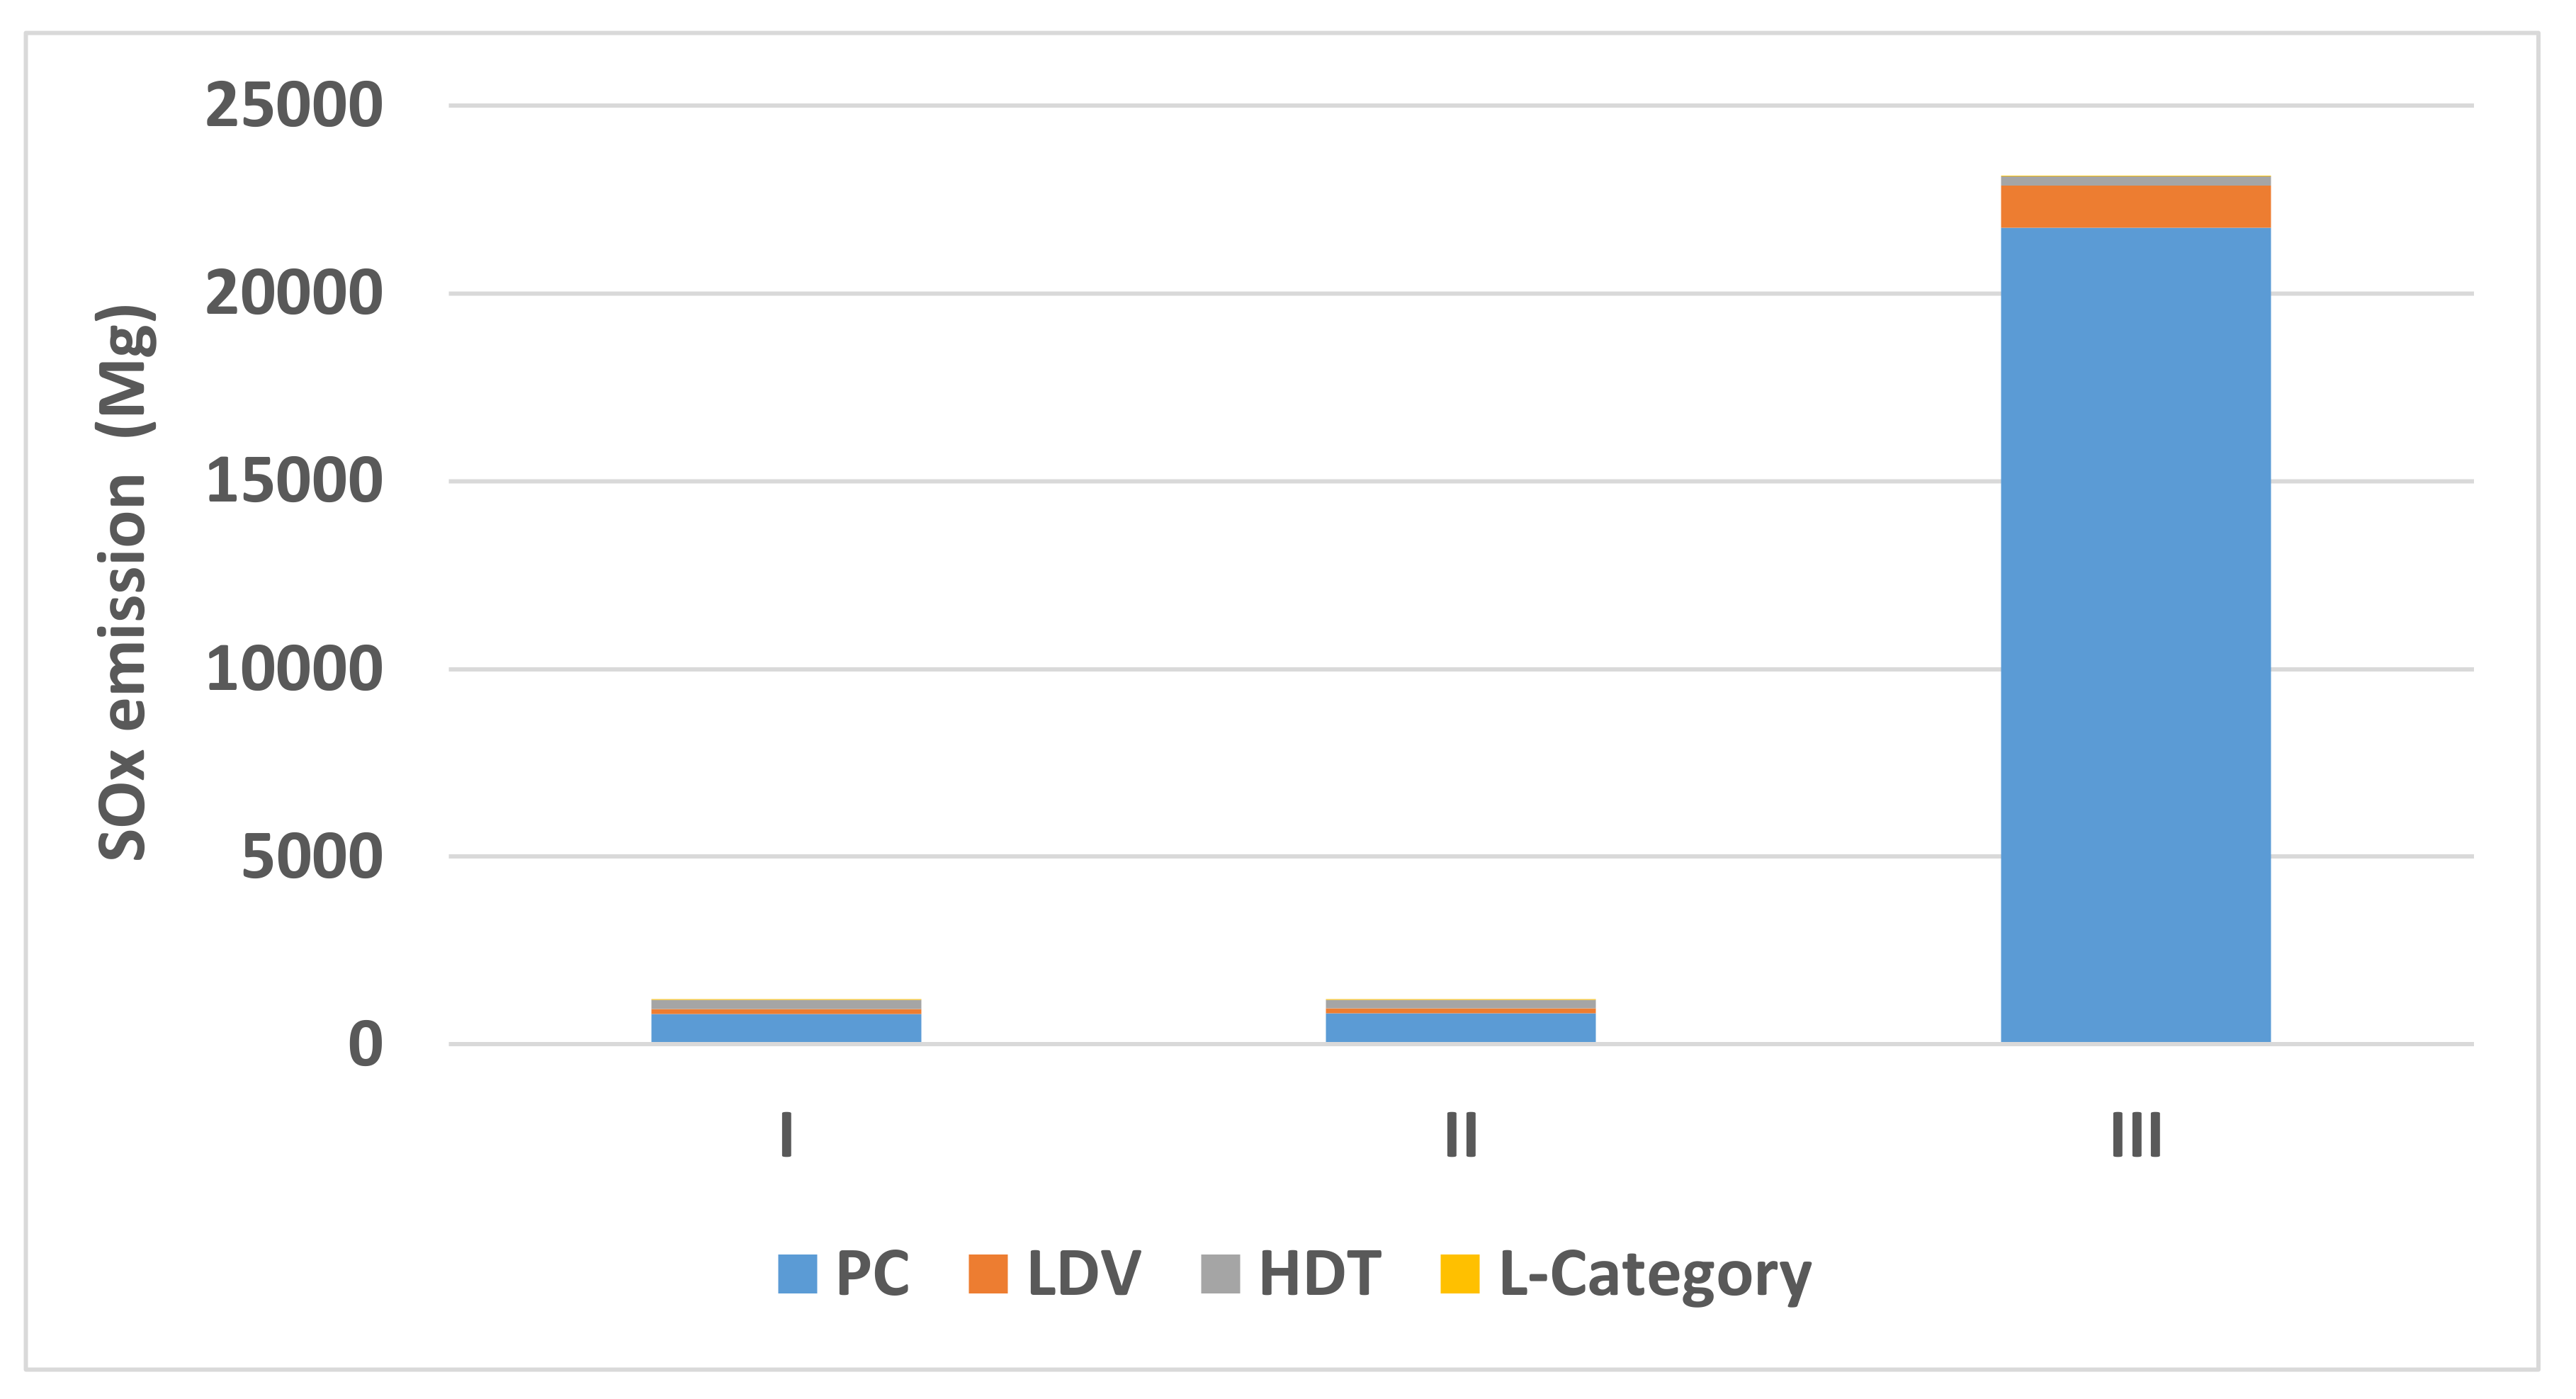
Scenario I—presenting the current emissions for Poland in 2020.
Scenario II—all PCs and LDVs meeting the PreEruro-Euro 5 numbers have been replaced with Euro 6 passenger cars, including hybrids and plug-ins. The assumption was that the vehicle structure remains the same, i.e., old cars will be assigned to the same subcategory only to meet the newer Euro standard. The principle of fuel balance will also be preserved here to balance the mileage of vehicles.
Scenario III—Passenger cars with electric motors will replace all PCs and LDVs with the PreEuro up to Euro 5 standard. The mileage will be maintained as for the already existing Euro 6 cars. The figures for electric vehicles will be taken to match the corresponding electric vehicles as a criterion. It was assumed that all vehicles are charged from the electric network, the indicators for electricity are used for the emission calculations [24].
The equivalent emission from BEVs is calculated from Formula (1):
E i = E c × E F i × M
where:
  • Ei—emission of pollutant i [g],
  • Ec—consumption of the electric energy [Wh] based on average data from the ev-database],
  • EFi—emission factor of pollutant i for electricity produced by installations for combustion of fuels [g/Wh] based on [25],
For simulation emission for ICEVs, the authors used the COPERT software for the emission calculation. The applied methodology followed the IPPC guidelines [26] and the EMEP Guidebook 2019 [27], which are the basic sets of guidance for GHGs’ (greenhouse gases) and air pollutants’ emission inventories.
Calculations using the COPERT software were based on the actual input data used to compile the Polish national emission inventory for 2020 [27]. The estimations for the basic assumptions were based on the following:
Total number of vehicles was 23,880,164. (Number of PCs-18,587,297 and LDVs-2,184,094), and the fleet structure,
Polish fuels mix consumed by vehicles in 2020,
Share per road class (urban, rural, and highways),
Vehicles’ average velocities [22],
Minimum and maximum temperatures occurring in Poland in 2020 based on [7].
The subject of analysis is associated with the assessment of air emissions generated by the transport sector on the regional (country) level.
For the purposes of the Polish national emission inventories of pollutant and GHG emissions, the share of PCs and LDVs in urban traffic is over 35%, in rural traffic, it is about 50%, and driving in urban areas is at an average speed of about 30 km/h, and in rural areas, it is 70 and 65 km/h. Most of the HDTs (heavy-duty trucks) and coaches travel at an average speed of 55 km/h in rural areas. L-category (includes: motorcycles and mopeds) operates mainly in urban and rural areas. The share of all categories of vehicles on highways is relatively small, amounting to about 15%, and on highways, these vehicles travel at the highest average speed. In line with the methodology for determining emissions from motor vehicles included in the COPERT model, the emissions also depend on the ambient temperature.

3. Results

The result of the simulations for CO, CO2, NOx, TSP, and SOx depending on scenarios are shown in Figure 1, Figure 2, Figure 3, Figure 4 and Figure 5.
The analysis shows that CO, CO2, and TSP emissions have decreased, while NOx and SO2 emissions have increased.
The analyses also show that replacing PCs and LDVs to meet the PreEuro-Euro 5 standards with Euro 6 will reduce emissions compared to scenario I.I.

4. Discussion and Conclusions

The calculations and information collected in this article show that the emissions of carbon dioxide and harmful substances from BEVs and ICEVs mainly depend on such factors as:
the type of internal combustion engine and its displacement,
consumption of the electric energy by the BEV,
energy mix.
After conducting a comparative analysis, it can be concluded that introducing BEVs into circulation at the expense of withdrawing ICEVs is not unequivocally positive in Polish conditions. In the article [28], the impact of the electrification of the fleet of a single company located in Poland was presented on reducing carbon dioxide emissions. It showed that, depending on the energy mix, the impact of BEVs on CO2 emissions will be different. Although the Polish electricity system is based on fossil fuels, the electrification of the fleet may contribute to the reduction of carbon dioxide emissions by 24%. However, in considering the Polish fuel mix in 2019, the use of data published by vehicles manufacturers shows that electrification of the fleet would increase emissions of carbon dioxide in this company by 14%. This means that from the perspective of the initial assumptions, policymakers, regulators, scientists, or other interest groups may draw different conclusions.
The analysis shows that CO, CO2, and TSP emissions have decreased, while NOx and SOx emissions have increased. It is also worth noting that the local emission of pollutants from vehicles will be 0, except for the emissions from brake wear which were also considered [13]. As noted by [5] in their work, the introduction of electric cars will result in a local reduction in the emission of pollutants and CO2.
It is also worth noting that the increasing share of BEVs will not contribute to the reduction of PM emissions, a comprehensive case report can be found in [22], where it determined that future policy should consequently focus on setting emission standards and encouraging the reduction of the weight of all vehicles to reduce particulate emissions from road traffic significantly.
Additionally, [1] in their research drew the same conclusion. The application of BEVs brings about the effects of a local improvement in air quality. However, it is worth remembering that the emissions caused by the BEVs, in the case of electricity based on carbon, will not be reduced to zero.

Author Contributions

Conceptualization, M.Z.-L. and P.L.; methodology, M.Z.-L.; software, M.Z.-L.; validation, M.Z.-L. and P.L.; formal analysis, M.Z.-L. and P.L.; investigation, M.Z.-L. and P.L.; resources, M.Z.-L. and P.L.; data curation, M.Z.-L. and P.L.; writing—original draft preparation, M.Z.-L. and P.L.; writing—review and editing, M.Z.-L. and P.L.; visualization, M.Z.-L. and P.L.; supervision, M.Z.-L. and P.L.; project administration, M.Z.-L. and P.L. All authors have read and agreed to the published version of the manuscript.

Funding

This research received no external funding.

Institutional Review Board Statement

Not applicable.

Informed Consent Statement

Not applicable.

Data Availability Statement

Not applicable.

Conflicts of Interest

The authors declare no conflict of interest.

References

  1. Pietrzak, K.; Pietrzak, O. Environmental Effects of Electromobility in a Sustainable Urban Public Transport. Sustainability 2020, 12, 1052. [Google Scholar] [CrossRef] [Green Version]
  2. Anenberg, S.; Miller, J.; Henze, D.; Minjares, R. A Global Snapshot of the Air Pollution-Related Health Impacts of Transportation Sector Emissions in 2010 and 2015. Available online: https://theicct.org/sites/default/files/publications/Global_health_impacts_transport_emissions_2010-2015_20190226.pdf (accessed on 30 November 2019).
  3. European Environment Agency. Transport and Public Health. Available online: https://www.eea.europa.eu/signals/signals-2016/articles/transport-and-public-health (accessed on 30 November 2019).
  4. European Environment Agency. Climate Change Mitigation. Available online: https://www.eea.europa.eu/themes/climate/eu-greenhouse-gas-inventory (accessed on 30 November 2019).
  5. Mehlig, D.; Woodward, H.; Oxley, T.; Holland, M.; ApSimon, H. Electrification of Road Transport and the Impacts on Air Quality and Health in the UK. Atmosphere 2021, 12, 1491. [Google Scholar] [CrossRef]
  6. National Atmospheric Emissions Inventory (NAEI). 2018. Available online: https://naei.beis.gov.uk/ (accessed on 1 November 2021).
  7. Hooftman, N.; Messagie, M.; van Mierlo, J.; Coosemans, T. A review of the European passenger car regulations—Real driving emissions vs. local air quality. Renew. Sustain. Energy Rev. 2018, 86, 1–21. [Google Scholar] [CrossRef]
  8. O’Driscoll, R.; Stettler, M.E.J.; Molden, N.; Oxley, T.; ApSimon, H.M. Real world CO2 and NOx emissions from 149 Euro 5 and 6 diesel, gasoline and hybrid passenger cars. Sci. Total Environ. 2018, 621, 282–290. [Google Scholar] [CrossRef] [PubMed]
  9. Owczuk, M.; Matuszewska, A.; Wojs, M.K.; Orliński, P. The effect of fuel type used in the spark-ignition engine on the chemical composition of exhaust gases. Przem. Chem. 2018, 97, 1910–1915. [Google Scholar] [CrossRef]
  10. Owczuk, M.; Matuszewska, A.; Wojs, M.K.; Orliński, P.; Kruczyński, S.W. Effect of biogas composition on performance of the engine. Przem. Chem. 2016, 95, 2249–2253. [Google Scholar] [CrossRef]
  11. The European Green Deal. Communication from the Commission to the European Parliament, the Council, the European Economic and Social Committee and the Committee of the Regions. 2019. Available online: https://eur-lex.europa.eu/legal-content/EN/TXT/PDF/?uri=CELEX:52012DC0673&from=EN (accessed on 30 December 2021).
  12. Li, J.; Jiao, J.; Tang, Y. An evolutionary analysis on the effect of government policies on electric vehicle diffusion in complex network. Energy Policy 2019, 129, 1–12. [Google Scholar] [CrossRef]
  13. Liu, Y.; Chen, H.; Gao, J.; Li, Y.; Dave, K.; Chen, J.; Federici, M.; Perricone, G. Comparative analysis of non-exhaust airborne particles from electric and internal combustion engine vehicles. J. Hazard. Mater. 2021, 420, 126626. [Google Scholar] [CrossRef] [PubMed]
  14. Licznik Elektromobilności. Available online: https://www.pzpm.org.pl/pl/Rynek-motoryzacyjny/Licznik-elektromobilnosci/Rok-2020/Grudzien-2020 (accessed on 30 December 2021).
  15. Database of the Central Vehicle Register. Available online: http://www.cepik.gov.pl/ (accessed on 30 December 2021).
  16. PSE-Operator. Polish Power System—Report 2019. Summary of Quantitative Data on Functioning of Polish Power System in 2020; PSE-Operator: Warsaw, Poland, 2020; Available online: https://www.pse.pl/dane-systemowe/funkcjonowanie-kse/raporty-roczne-z-funkcjonowania-kse-za-rok/raporty-za-rok-2020#t1_1 (accessed on 30 December 2021). (In Polish)
  17. Główny Urząd Statystyczny (GUS). Energy from Renewable Sources in 2020; Statistics Poland: Warsaw, Poland, 2019. Available online: https://stat.gov.pl/obszary-tematyczne/srodowisko-energia/energia/energia-ze-zrodel-odnawialnych-w-2020-roku,10,4.html (accessed on 30 December 2020). (In Polish)
  18. Amato, F.; Cassee, F.R.; van der Gon HA, D.; Gehrig, R.; Gustafsson, M.; Hafner, W.; Harrison, R.M.; Jozwicka, M.; Kelly, F.J.; Moreno, T.; et al. Urban air quality: The challenge of traffic non-exhaust emissions. J. Hazard. Mater. 2014, 275, 31–36. [Google Scholar] [CrossRef] [PubMed]
  19. Hong, N.; Guan, Y.; Yang, B.; Zhong, J.; Zhu, P.; Ok, Y.S.; Hou, D.; Tsang, D.C.W.; Guan, Y.; Liu, A. Quantitative source tracking of heavy metals contained in urban road deposited sediments. J. Hazard. Mater. 2020, 393, 122362. [Google Scholar] [CrossRef] [PubMed]
  20. Van der Gon, H.D.; Hulskotte, J.; Jozwicka, M.; Kranenburg, R.; Kuenen, J.; Visschedijk, A. European Emission Inventories and Projections for Road Transport Non-Exhaust Emissions: Analysis of Consistency and Gaps in Emission Inventories from EU Member States. In Non-Exhaust Emissions; Academic Press: Cambridge, MA, USA, 2018; pp. 101–121. [Google Scholar]
  21. Organisation for Economic Cooperation and Development (OECD). Non-Exhaust Particulate Emissions from Road Transport; OECD: Paris, France, 2020. [Google Scholar]
  22. Timmers, V.R.J.H.; Achten, P.A.J. Non-exhaust PM emissions from electric vehicles. Atmos. Environ. 2016, 134, 10–17. [Google Scholar] [CrossRef]
  23. Laskowski, P.; Zimakowska-Laskowska, M.; Zasina, D.K.; Wiatrak, M. Comparative analysis of the emissions of carbon dioxide and toxic substances emitted by vehicles with ICE compared to the equivalent emissions of BEV. Combust. Engines 2021, 187, 102–105. [Google Scholar] [CrossRef]
  24. Ministry of Climate and Environment. Poland’s National Inventory Report 2020 Greenhouse Gas Inventory for 1988–2020 Submission under the United Nations Framework Convention on Climate Change and the Kyoto Protocol. 2021. Available online: https://unfccc.int/documents/274762 (accessed on 30 December 2021).
  25. Wskaźniki Emisyjności CO2, SO2, NOx, CO i Pyłu Całkowitego dla Energii Elektrycznej, na Podstawie Informacji Zawartych w Krajowej Bazie o Emisjach Gazów Cieplarnianych i Innych Substancji za 2020 Rok; Instytut Ochrony Środowiska Państwowy Instytut Badawczy: Warsaw, Poland, 2021; Available online: https://kobize.pl/uploads/materialy/materialy_do_pobrania/wskazniki_emisyjnosci/Wskazniki_emisyjnosci_grudzien_2021.pdf (accessed on 30 December 2021).
  26. Davies Waldron, C.; Harnisch, J.; Lucon, O.; Scott Mckibbon, R.; Saile, S.B.; Wagner, F.; Walsh, M.P. Mobile Combustion. In 2006 IPCC Guidelines for National Greenhouse Gas Inventories, Prepared by the National Greenhouse Gas Inventories Programme; Eggleston, H.S., Buendia, L., Miwa, K., Ngara, T., Tanabe, K., Eds.; Intergovernmental Panel on Climate Change (IPCC): Geneva, Switzerland, 2006; Available online: https://www.ipcc-nggip.iges.or.jp/public/2006gl/index.html (accessed on 30 December 2021).
  27. Ntziachristos, L.; Samaras, Z. Road transport. In EMEP/EEA Air Pollutant Emission Inventory Guidebook 2019; European Environment Agency (EPA): Copenhagen, Denmark, 2019. [Google Scholar] [CrossRef]
  28. Zamasz, K.; Stęchły, J.; Komorowska, A.; Kaszyński, P. The Impact of Fleet Electrification on Carbon Emissions: A Case Study from Poland. Energies 2021, 14, 6595. [Google Scholar] [CrossRef]
Figure 1. Comparison of CO emissions for three scenarios.
Atmosphere 13 00401 g001
Figure 2. Emissions for three scenarios.
Atmosphere 13 00401 g002
Figure 3. Comparison of Total Suspended Particles (TSP) emissions for three scenarios.
Atmosphere 13 00401 g003
Figure 4. Comparison of SOx emissions for three scenarios.
Atmosphere 13 00401 g004
Figure 5. Comparison of NOx emissions for three scenarios.
Atmosphere 13 00401 g005
Publisher’s Note: MDPI stays neutral with regard to jurisdictional claims in published maps and institutional affiliations.

