Article

Climate Trends and Extremes in the Indus River Basin, Pakistan: Implications for Agricultural Production

1
Food and Agriculture Organization (FAO) of the United Nations, Headquarters, 00153 Rome, Italy
2
Meteorology Group, Departamento de Matemática Aplicada y Ciencias de la Computación, Universidad de Cantabria, 39005 Santander, Spain
3
Food and Agriculture Organization (FAO) of the United Nations, Pakistan Office, Islamabad 1476, Pakistan
4
Pakistan Meteorological Department, Islamabad 1214, Pakistan
5
School of Earth and Environmental Science, Seoul National University, Seoul 08826, Korea
6
Food and Agriculture Organization (FAO) of the United Nations, Regional Office for Asia and the Pacific, Bangkok 10200, Thailand
7
Meteorology Group, Instituto de Física de Cantabria, CSIC-Universidad de Cantabria, 39005 Santander, Spain
*
Author to whom correspondence should be addressed.
These authors contributed equally to this work.
Atmosphere 2022, 13(3), 378; https://doi.org/10.3390/atmos13030378
Submission received: 19 January 2022 / Revised: 14 February 2022 / Accepted: 16 February 2022 / Published: 24 February 2022

Abstract

:
Historical and future projected changes in climatic patterns over the largest irrigated basin in the world, the Indus River Basin (IRB), threaten agricultural production and food security in Pakistan, in particular for vulnerable farming communities. To build a more detailed understanding of the impacts of climate change on agriculture s in the IRB, the present study analyzes (1) observed trends in average temperature, precipitation and related extreme indicators, as well as seasonal shifts over a recent historical period (1997–2016); and (2) statistically downscaled future projections (up to 2100) from a set of climate models in conjunction with crop-specific information for the four main crops of the IRB: wheat, cotton, rice and sugarcane. Key findings show an increasing trend of about over 0.1 °C/year in observed minimum temperature across the study area over the historical period, but no significant trend in maximum temperature. Historical precipitation shows a positive annual increase driven mainly by changes in August and September. Future projections highlight continued warming resulting in critical heat thresholds for the four crops analyzed being increasingly exceeded into the future, in particular in the Kharif season. Concurrently, inter-annual rainfall variability is projected to increase up to 10–20% by the end of the 21st century, augmenting uncertainty of water availability in the basin. These findings provide insight into the nature of recent climatic shifts in the IRB and emphasize the importance of using climate impact assessments to develop targeted investments and efficient adaptation measures to ensure resilience of agriculture in Pakistan into the future.

1. Introduction

The agricultural sector in Pakistan accounts for 18.5% of the Gross Domestic Product and employs 38.5% of the workforce nationally. Within the country, the Indus River Basin (IRB) is the primary agricultural region, contributing to more than 90% of the country’s food production [1]. Pakistan is among the countries most affected by climate change and extreme weather events over the last two centuries [2], having documented a succession of climate related disasters including glacial lake outburst floods, droughts, heat waves, pest infestations and changing monsoon patterns [3]. The impacts of climate on agricultural production are often compounded by the high degree of vulnerability of small-scale farmers and the limited adaptive capacity of livelihoods and institutions [4,5,6]. As a result, changes in climate pose a serious threat to Pakistan’s food security and the sustainability of future agricultural production [7,8,9].
The IRB hosts the world’s largest contiguous irrigation system [10] that sustains approximately 90% of agricultural production in the country [11], which in turn puts significant pressure on water resources. Changing climatic conditions threaten to exacerbate future pressure on water availability, in particular increasing temperature, associated evaporation rates and more irregular precipitation patterns. According to national surveys, one of the main factors driving the recent decline in crop productivity along the IRB is the more frequent extreme weather events and shifts in seasonal rainfall [12].
Uncertainty in the timing and extent of water availability and extreme events in the IRB makes the adaptation of the vulnerable agriculture sector essential for the future [13]. Previous studies found that water sources to the IRB are expected to shift, including increases in the upstream sub-basins of Hunza, Shigar and Shyok, and decreases in the lower altitude sub-basins [13,14]. Likewise, increased precipitation and intensification of heavy rainfall events is likely to exacerbate river flow variability [15]. In conjunction with increases in glacial and snow-melt runoff, this suggests a higher risk of flooding and damage to cropping systems during this season [13]. For instance, in 2010, floods in the Sindh province resulted in a decline of almost 30% in rice production [16]. Recently, August 2020 has been documented as the wettest month on record for Pakistan, affecting 77,000 hectares of agricultural land predominantly along the Sindh province [17].
Previous works have reported that maximum and minimum temperatures have increased between 0.5 and 1 °C, on average for Pakistan, over the period 1960–2007 [7,18,19]. However, these studies have also demonstrated a high degree of heterogeneity both spatially and temporally. With respect to precipitation, historical trends highlight an average annual increase, with the frequency of extreme precipitation events also increasing across the country over the period 1965 to 2009 [15].
Future projections of temperature in Pakistan show an continued increase in average temperature, ranging between 3 and 9 °C by 2100 [11]. Overall annual rainfall in the IRB is projected to increase, however, rainfall projections exhibit significant temporal and spatial variability over the 21st century [20], with a decrease in the number of rainy days accompanied by an increase in rainfall intensity over shorter periods [20,21,22].
From the crop perspective, previous studies have investigated the impacts of climate on crop production in the region. Ali et al. [23] found that net production for cotton and wheat increased in Southern Punjab, while yield declined in correlation with temperature extremes. This study, however, was limited to a small region in the IRB over the historical period and did not investigate trends into the future using climate projections.
To build a more detailed analysis of the past and future climate and its related impacts on the agriculture sector in the IRB, the present study employs national records of daily temperature and precipitation to assess the trends of observed extreme indicators during a recent historical period (1997–2016) and statistically downscaled future projections from climate models to identify some of the key risks (related to heat stress) that are expected to limit crop productivity in the region along the entire 21st century. We focus on the two main provinces within the IRB, Punjab and Sindh—which account for over 90% of the country’s food production and 75% of the country’s export revenues [1]—and analyze four key crops: wheat, cotton, rice and sugarcane.
The paper is organized as follows: Section 2 describes the area of study, data and methods used for the analyses performed. The results obtained are presented and discussed in Section 3. Finally, Section 4 summarizes the implications of our key findings for the agricultural sector.

2. Materials and Methods
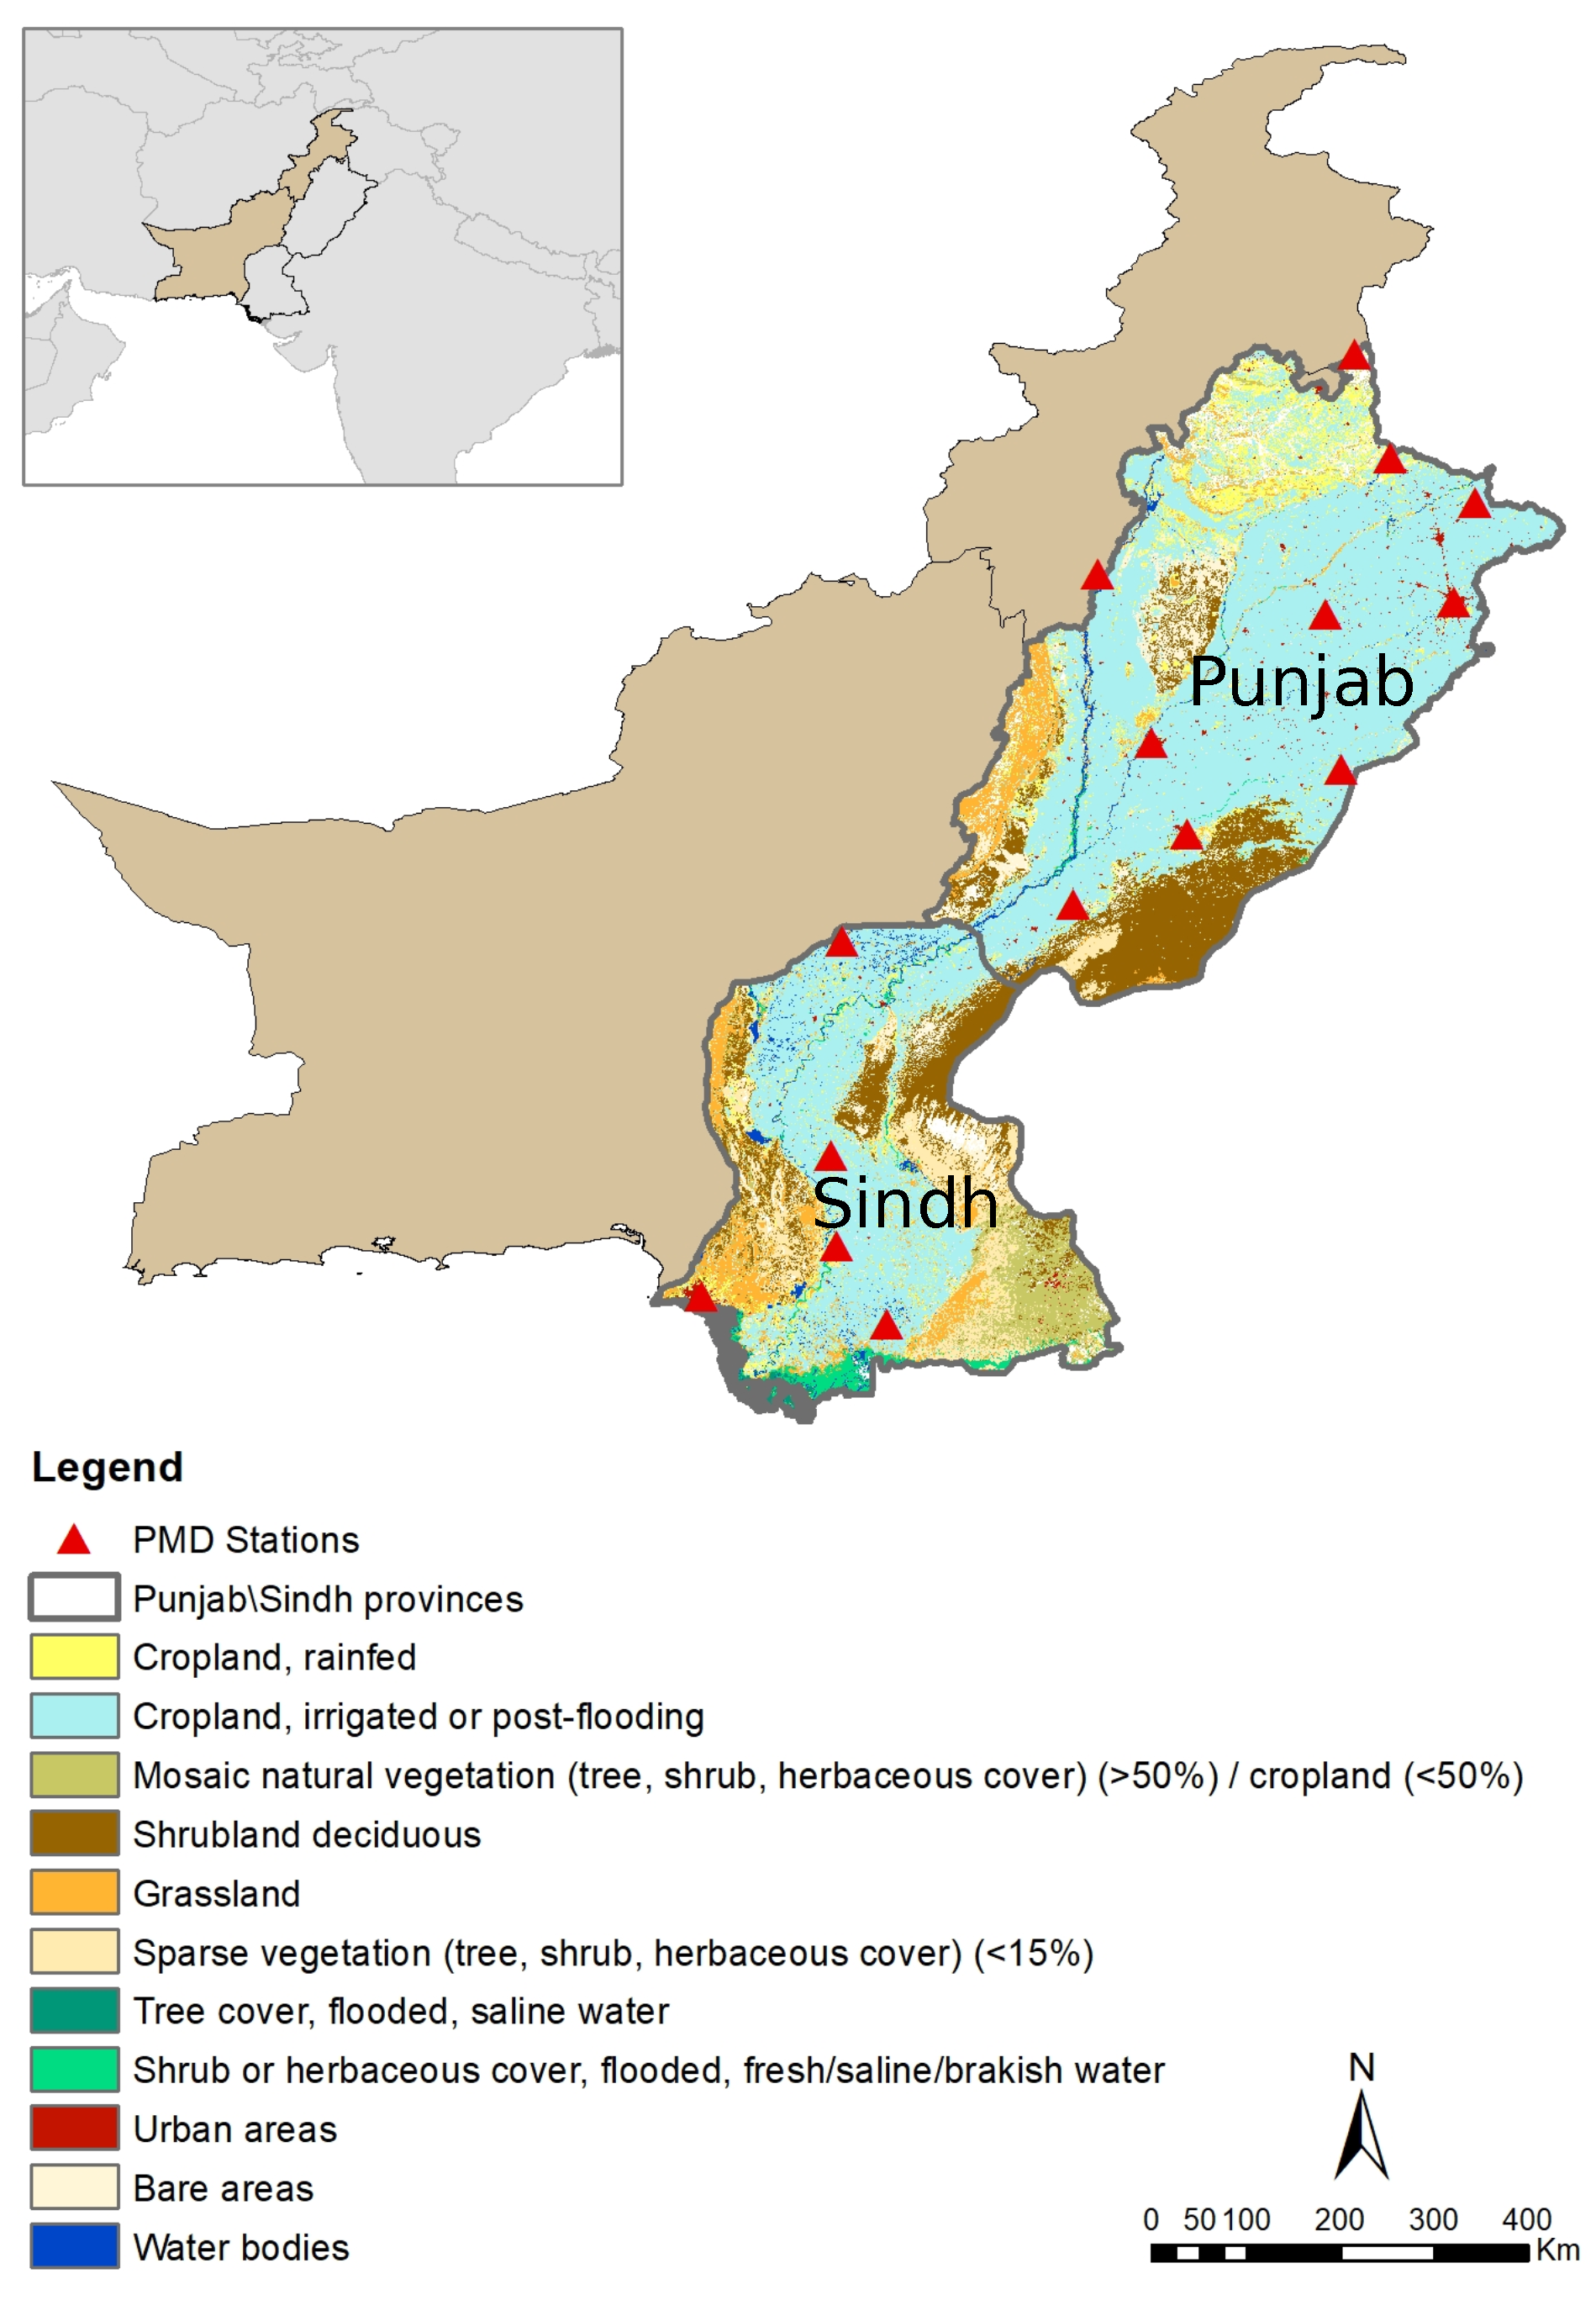
2.1. Area of Study

The climate in Pakistan varies from arid to semiarid with a range of annual rainfall from 250 mm/year to up to 2000 mm/year in the southern slopes of the Himalaya and sub-mountain northern regions. Heavy monsoons in summer months account for approximately 60% of the total annual precipitation nationally and define precipitation patterns in the south-eastern regions. The north-western regions of the country receive rains mainly during winter months (December to March) through western weather disturbances [11].
The alluvial plain of the Indus River has an area of approximately 207,200 km 2 , covering nearly 65% of Pakistan’s territory. The basin is the country’s main center of agricultural production, the source of over 90% of the country’s food and agriculture commodities [1]. Of the total cropped area in Pakistan (23.4 million ha), 77% is located in the Punjab province and 14% in the Sindh province [24], which are shown in Figure 1. The present study targets these two provinces central to agricultural production.

2.2. Observational Data

Daily precipitation, maximum and minimum temperature records for 15 weather stations across Punjab and Sindh provinces (red triangles in Figure 1; details in Table 1) were provided by the Pakistan Meteorological Department (PMD) for the period 1997–2016. PMD data was used (i) to compute the climate indicators described in Section 2.2 and their corresponding trends (Section 2.4), and (ii) to calibrate the statistical models used to obtain the local projections of climate change (Section 3.2.1).
Figure 2 shows the observed mean climatology for precipitation, maximum and minimum temperature (in rows) for the 15 PMD stations considered for the period 1997–2016, for the entire year and two seasons of particular interest, Kharif (May–October) and Rabi (November–April), which cover the growth cycles of the four main crops in the IRB: wheat, cotton, rice and sugarcane (see Table 2).

2.3. Extreme Climate and Crop-Specific Indicators

To assess the implications of climate variability on crops during the recent historical period, this work uses the precipitation- and temperature-based indicators described in Table 3.
With the exception of ETR, all these indicators have been defined by the Expert Team for Climate Change Detection and Indices (ETCCDI: http://etccdi.pacificclimate.org/list_27_indices.shtml (accessed on 14 February 2021). In addition, the indicator summer days (SU) has been modified for this study to represent the agro-climatic conditions of Pakistan. In particular, we have increased the 25 °C threshold defined in ETCCDI to 35 °C to account for the optimal growth of wheat, cotton, rice and sugarcane have been empirically determined to occur at 30, 32, 36 and 34 °C, respectively, [25,26,27,28,29].

2.4. Trend Analysis

In this study, we analyze the observed annual trends over the 1997–2016 period. Note that, although a longer period would be more appropriate for a robust computation of trends, we are using for this study the longest observational records available from the national meteorological authority of the country. For the trend analysis the following climatic variables were selected: (i) precipitation, maximum and minimum temperature and (ii) precipitation- and temperature-based extreme indicators as shown in Table 3. In all cases, trends were calculated as the slope of the straight line that best fit (based on least squares) to a given set of data. This line responds to the equation y = a x + b , where the slope a can be computed as:
a = n i = 1 n x i y i i = 1 n x i i = 1 n y i n i = 1 n x i 2 i = 1 n x i 2
Moreover, the non-parametric Mann–Kendall (MK) test [30,31] was applied to assess whether or not the trends were statistically significant. MK is based on the number of positive differences minus the number of negative differences that take place in a time-series, S:
S = k 1 n 1 j k + 1 n s i g n ( x j x k )
where j and k denote different times (from 1 to n). For n > 10 , the variance of S can be obtained according to the following Equation [32]:
V a r ( S ) = 1 18 n ( n 1 ) ( 2 n + 5 ) p T p ( T p 1 ) ( 2 T p + 5 )
where p varies over the set of tied groups and T p is the number of observations in the p t h group. Then the statistic of the test, Z M K , can be computed as
Z M K = S 1 V a r ( S ) , i f S > 0 0 , i f S = 0 S + 1 V a r ( S ) , i f S < 0
The null hypothesis of no trend in the data can be rejected if Z M K > = Z 1 α , where Z 1 α is the 100 ( 1 α ) t h percentile of the standard normal distribution. In this study, a confidence level of 95% ( α = 0.05) was considered.
Note that previous works targeting the assessment of trends from gauge data across the globe have used the same approach followed here [33,34,35,36,37,38].

2.5. Statistical Downscaling

Local daily projections (up to 2100) of precipitation, maximum and minimum temperature for the 15 PMD stations analyzed were obtained by means of statistical downscaling as explained in Section 2.2.1 of [39] (the interested reader is referred to the latter reference for further technical details on the downscaling process). As described therein, the four Earth System Models (ESMs) from the Coupled Model Intercomparison Project–Phase 5 (CMIP5) listed in Table 4 were downscaled under two Representative Concentration Pathways (RCPs) representing different socio-economic and emission scenarios, the moderate RCP4.5 [40] and the extreme RCP8.5 [41].

3. Results and Discussion

3.1. Observed Historical Climate

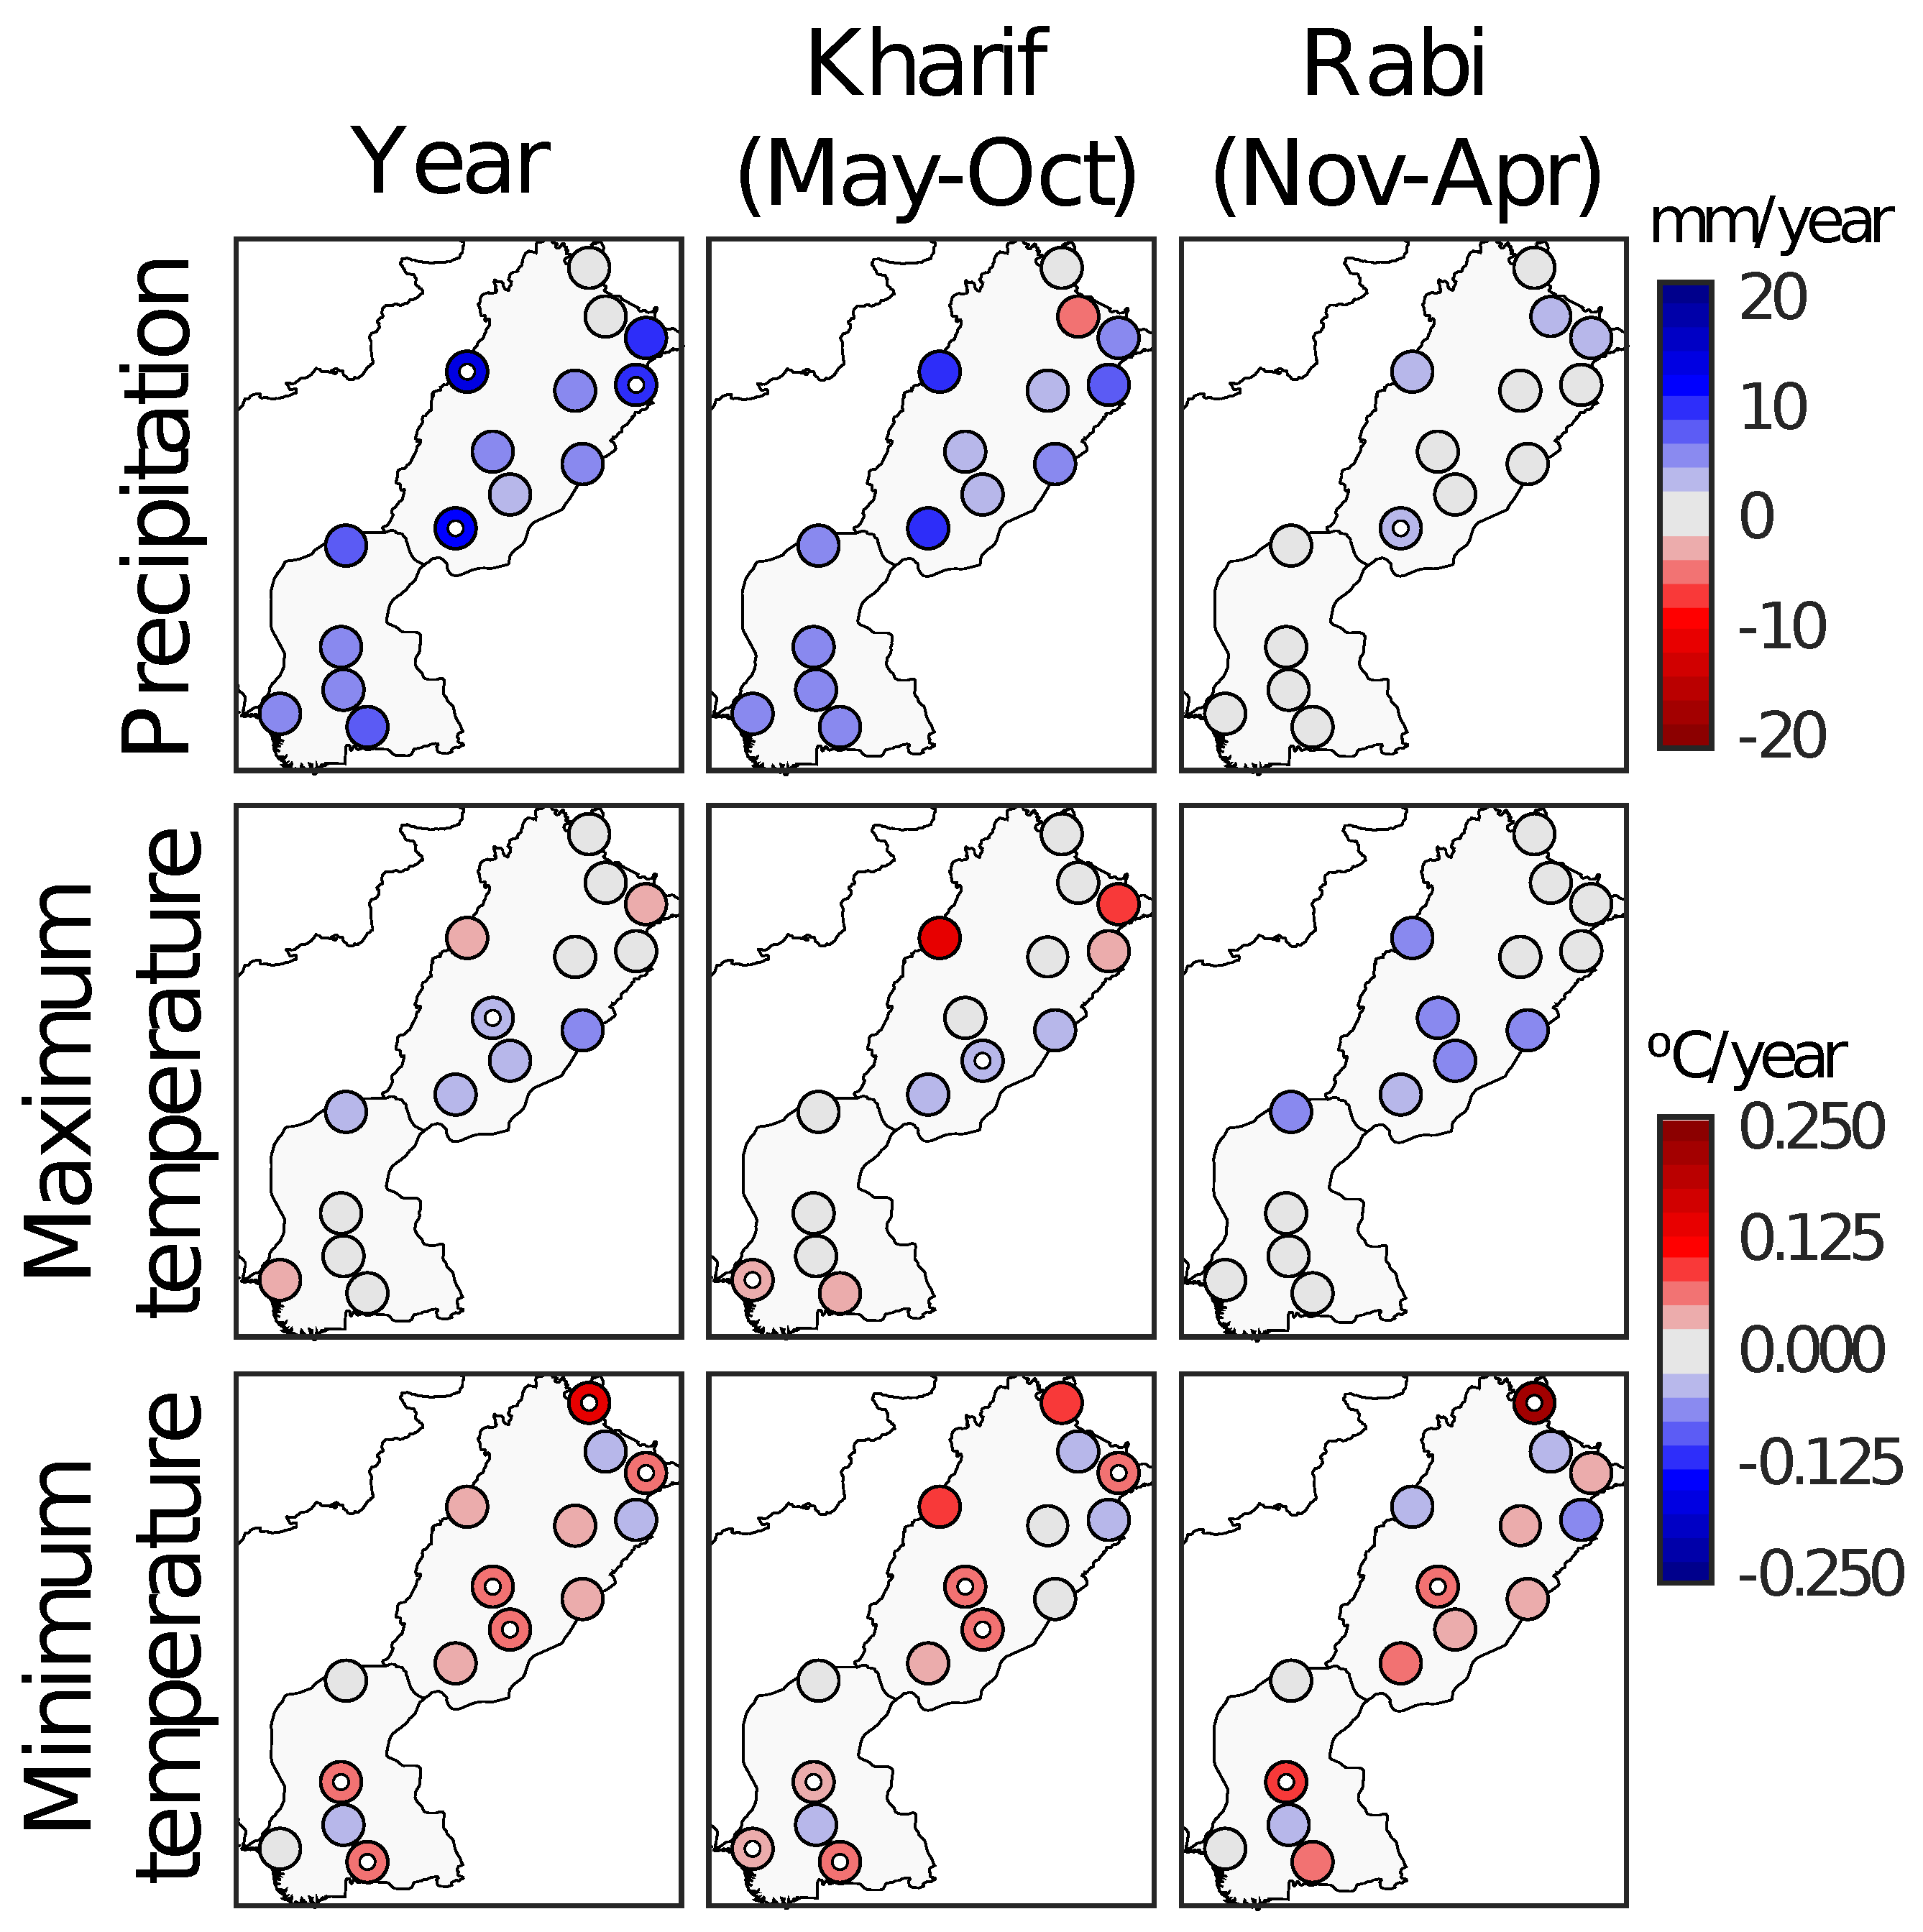
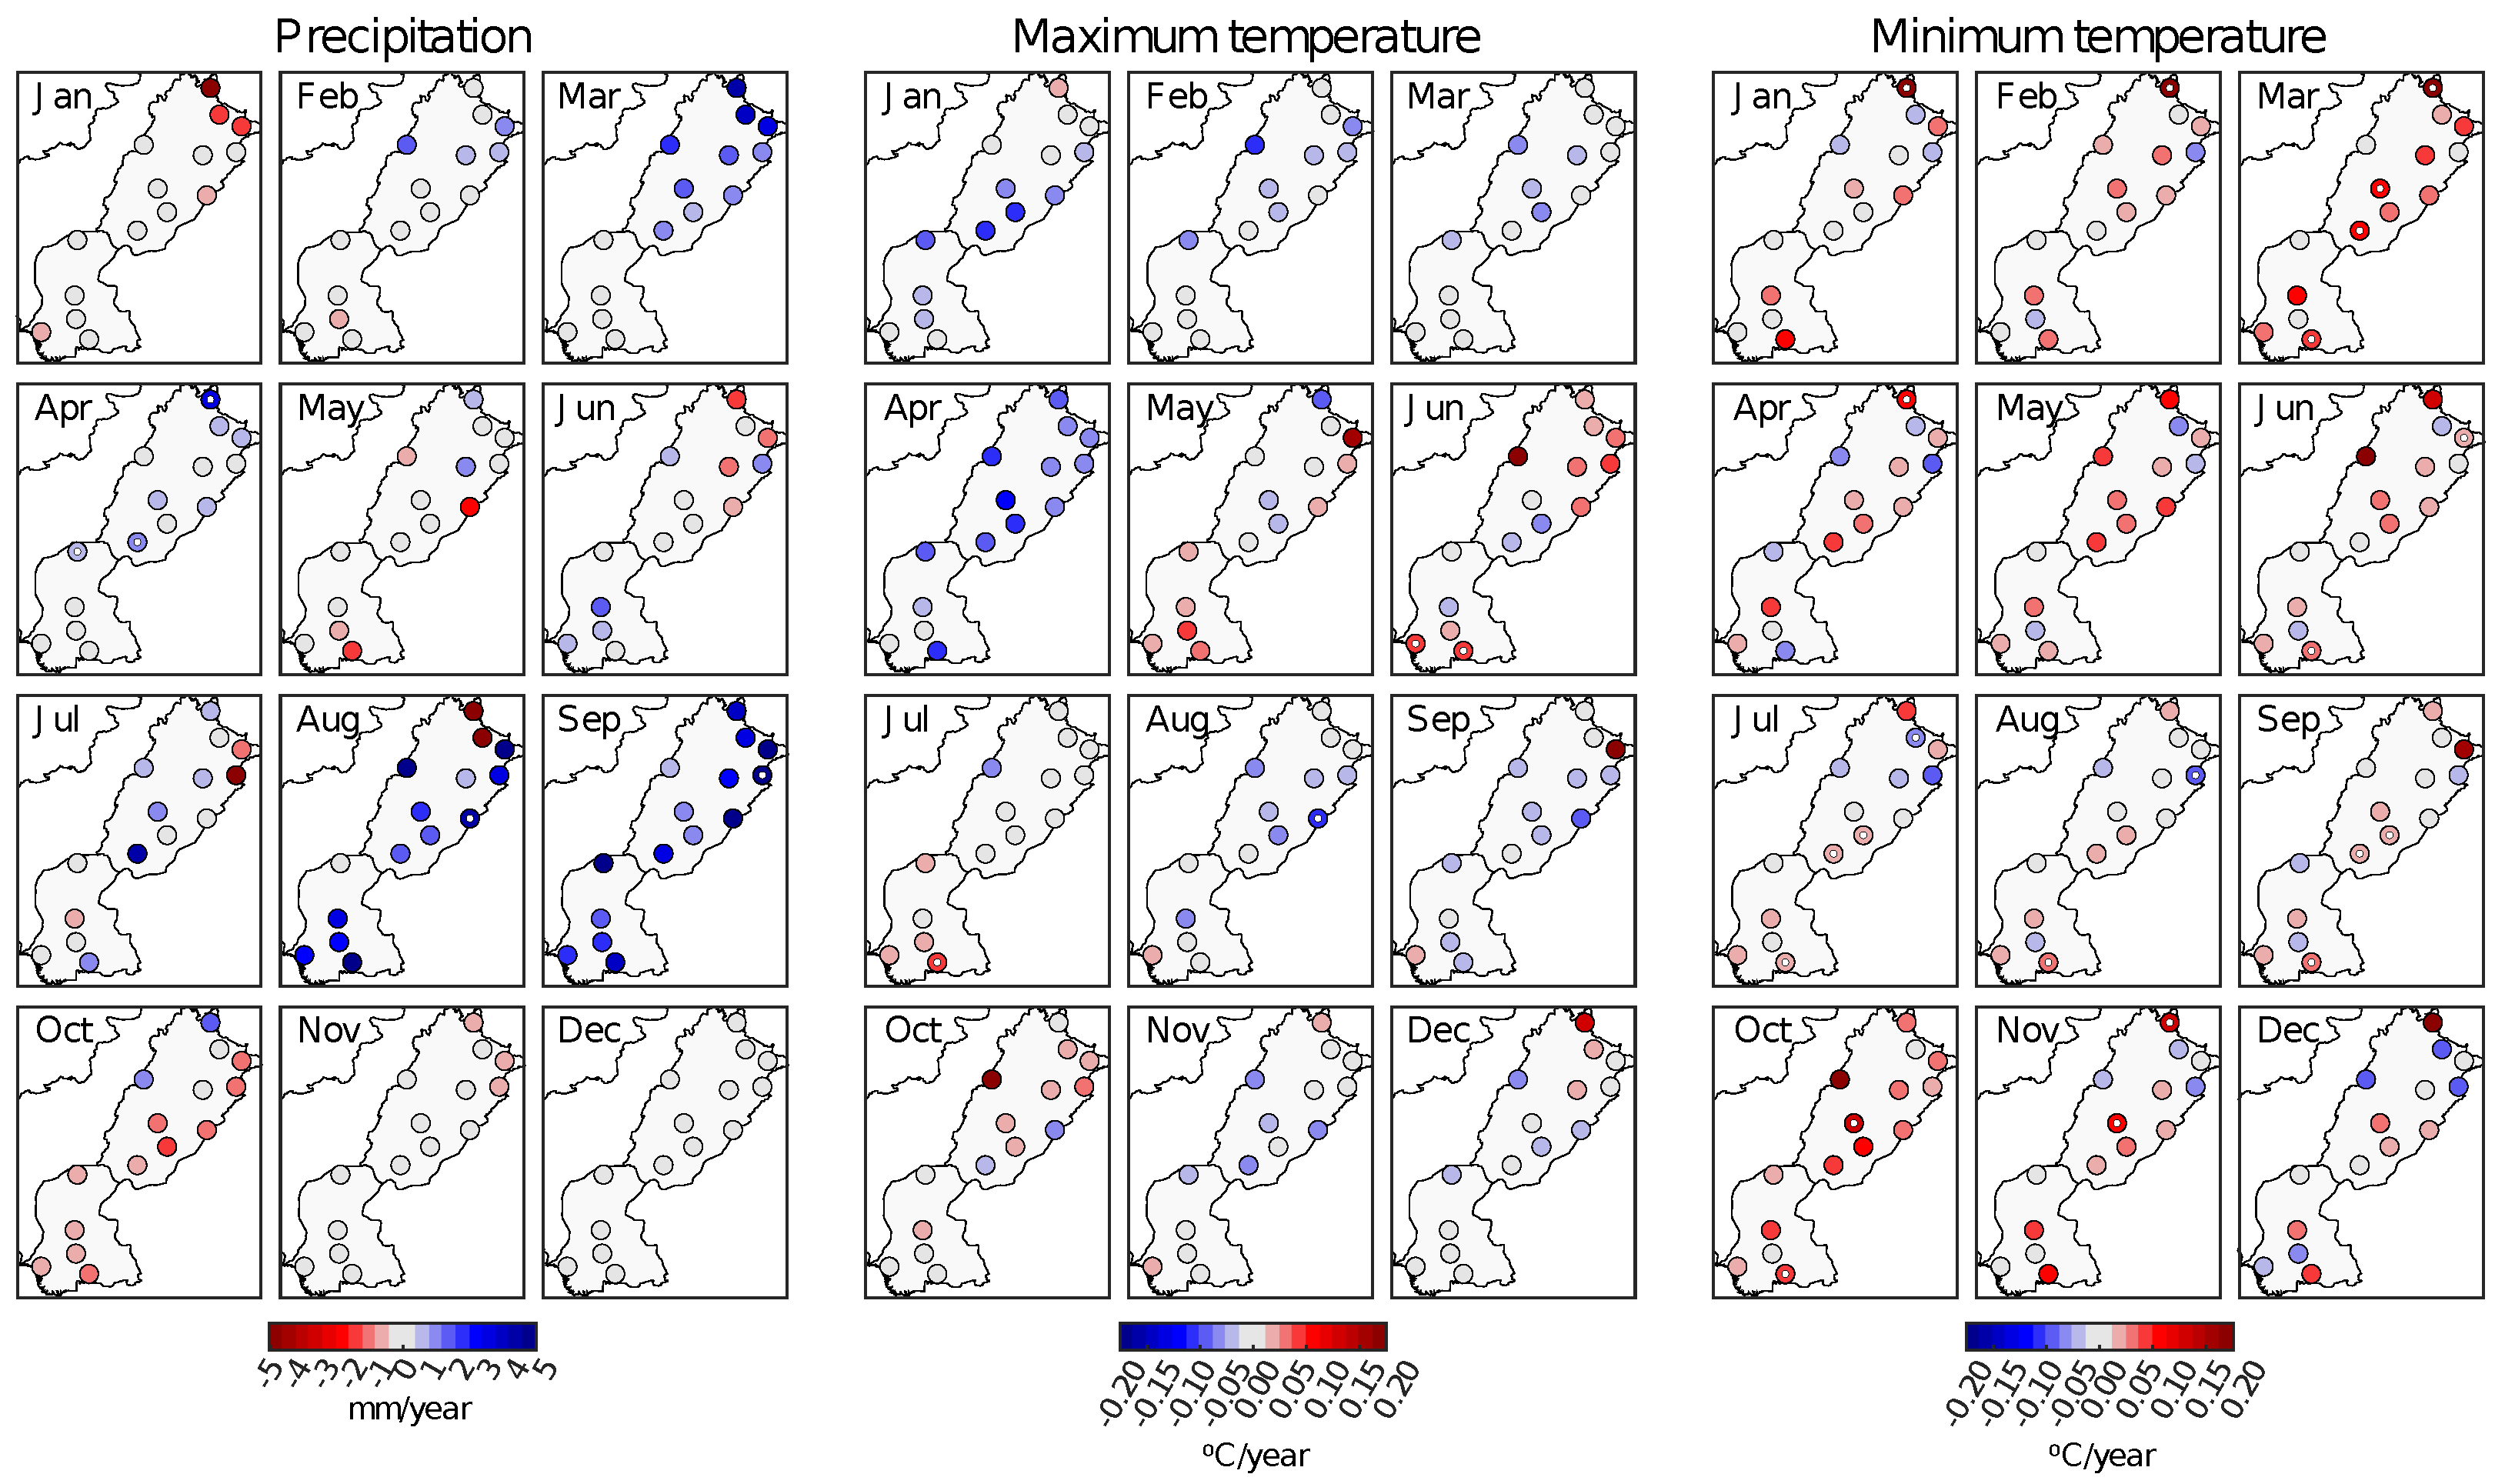
3.1.1. Trends in Precipitation and Temperatures

Precipitation exhibits high spatial variability, with the northernmost parts of the country recording the largest values, especially in the summer season. Very low precipitation is received across the basin during winter. On the other hand, maximum and minimum temperatures vary up to 15 °C and 10 °C across the basin, respectively. The present study presents results over the entire year as well as disaggregated by the two cropping seasons in the IRB, Kharif season (May–October) and Rabi season (November–April).
Figure 3 shows the observed trends in annual precipitation, maximum and minimum temperature (in rows) over the 15 PMD stations considered, for the entire year, the Kharif and the Rabi seasons (in columns). Significant (95% confidence level) trends are marked with a white dot.
The results in Figure 3 show a general increasing trend for precipitation (with values above 10 mm/year in some locations), supporting trends identified by [7] for the Punjab province. However, the latter study finds a decreasing trend in precipitation over the Sindh province for the period 1910–2007, while the present work shows an increasing trend, although with a smaller magnitude and without statistical significance. The different signal found in [7] can be explained by the difference in time periods analyzed. Here, trends are presented for the two main cropping seasons elucidating the fact that increased precipitation is driven almost entirely by an increase in the Kharif season (May–October) while near to zero trends are found over the Rabi season (November–April).
With respect to temperatures, there is not a clear spatial pattern of observed trends, neither for maximum nor for minimum values, while no significant changes are found in general for maximum temperature, significant increasing trends of more than 0.1 °C/year are encountered for minimum temperature in many locations, with both Kharif and Rabi seasons contributing to a similar extent to this warming. These results are in partial agreement with those from previous studies (see, e.g., [7]), which identified non-significant changes of up to 0.35 °C in maximum temperature in Sindh and slightly decreasing (almost zero) change in maximum temperature in Punjab over the period 1910–2007. With regards to annual minimum temperature, an increase over the country, including the Punjab and Sindh provinces, has been found in previous works [7]. Although the period analyzed in the present study differs, the warming tendency is consistent between the two studies.
To give further insight into the temporal distribution of precipitation, maximum and minimum temperature throughout the year of the trends shown in Figure 3 and Figure 4 presents a detailed analysis of annual trends, separately for each calendar month, over the period 1997–2016. Figure 4 reveals that the positive trends observed in yearly precipitation are mainly driven by increases in August and September, and also in March (to a lesser degree), particularly in the Punjab province. It also shows a slight decreasing trend in October and no substantial changes in the other months. These results suggest a shift in the wet season to end slightly earlier, and therefore receive increased total rainfall over a shorter period.
Regarding maximum temperature, monthly trends exhibit great variability, both temporally and spatially. Particularly in the Sindh province, Figure 4 shows a weak signal of warming in June, July and October. To the contrary, a cooling trend emerges from January to April particularly in the Punjab province. Minimum temperatures in the region, however, are increasing throughout the entire year, with the highest warming in October and March, which suggests the elongation of the Kharif season and general shifts in the warm periods throughout the year.

3.1.2. Trends in Extreme Climate Indicators

Figure 5 shows the observed annual trends for the precipitation and temperature-based extreme indicators listed in Table 3 (left and right panel, respectively). In agreement with the results from Figure 3 and Figure 4, the analysis of precipitation-based indicators reveals an overall decrease in the number of consecutive dry days (CDD), driven by a negative shift in the Kharif season. During the Rabi season, the number of CDD is increasing in some parts of the basin, which points out to increased periods without rain during the winter months. Over the basin, there is a slight increase in the number of consecutive wet days (CWD) during the Kharif season, however no change during Rabi. The Simple Daily Intensity Index (SDII) shows a slight increase in Kharif and no change during the Rabi season. The analysis also finds an increase in the number of very heavy precipitation days (R20) over the period analyzed driven by changes in the Kharif season. The results support previous discussion of increasing intensity of rain during the wet summer season, however extended dry periods during the already dry winter season. This decrease in dry days may impact non-irrigated Rabi crops, in particular wheat and sugarcane, which will be in critical growth phases during this period [7,39].
Temperature-based indicators show overall large spatial variability. The indicator exhibiting the most significant trend is TR, defined as the number of days with minimum temperatures above 20 °C. Analysis of seasonal trends show that the increase is driven by changes mainly during the Kharif season in the basin. The temperature indicators such as the 90th percentile of maximum temperature (TX90p) and the number of days with temperature above 35 °C (SU), both indicate decreases in maximum temperature driven by a decrease during the Rabi or winter season. SU shows increasing values in some stations in the Kharif season, suggesting increases in high temperature in the hot summer season. The extreme diurnal temperature range (ETR) exhibit mostly significant decreasing trends in the north during Rabi and in the central regions during Kharif. This finding highlights that different regions experience increased night-time temperatures during different cropping seasons, and therefore crop’s exposure to heat-stress conditions will vary spatially. Changes in the diurnal temperature range (ETR) exhibit a significant decrease driven by changes in the Rabi season. These results suggest that Kharif crops (sugarcane, rice and cotton) might likely be more negatively impacted than Rabi ones due to the compounding impacts of heat stress and increased water-loss. This finding is supported by the results [39], who found that potential increases in temperature will have minimal impact on the performance of wheat, most likely due to a shortening of the growing cycle.

3.2. Projected Future Climate

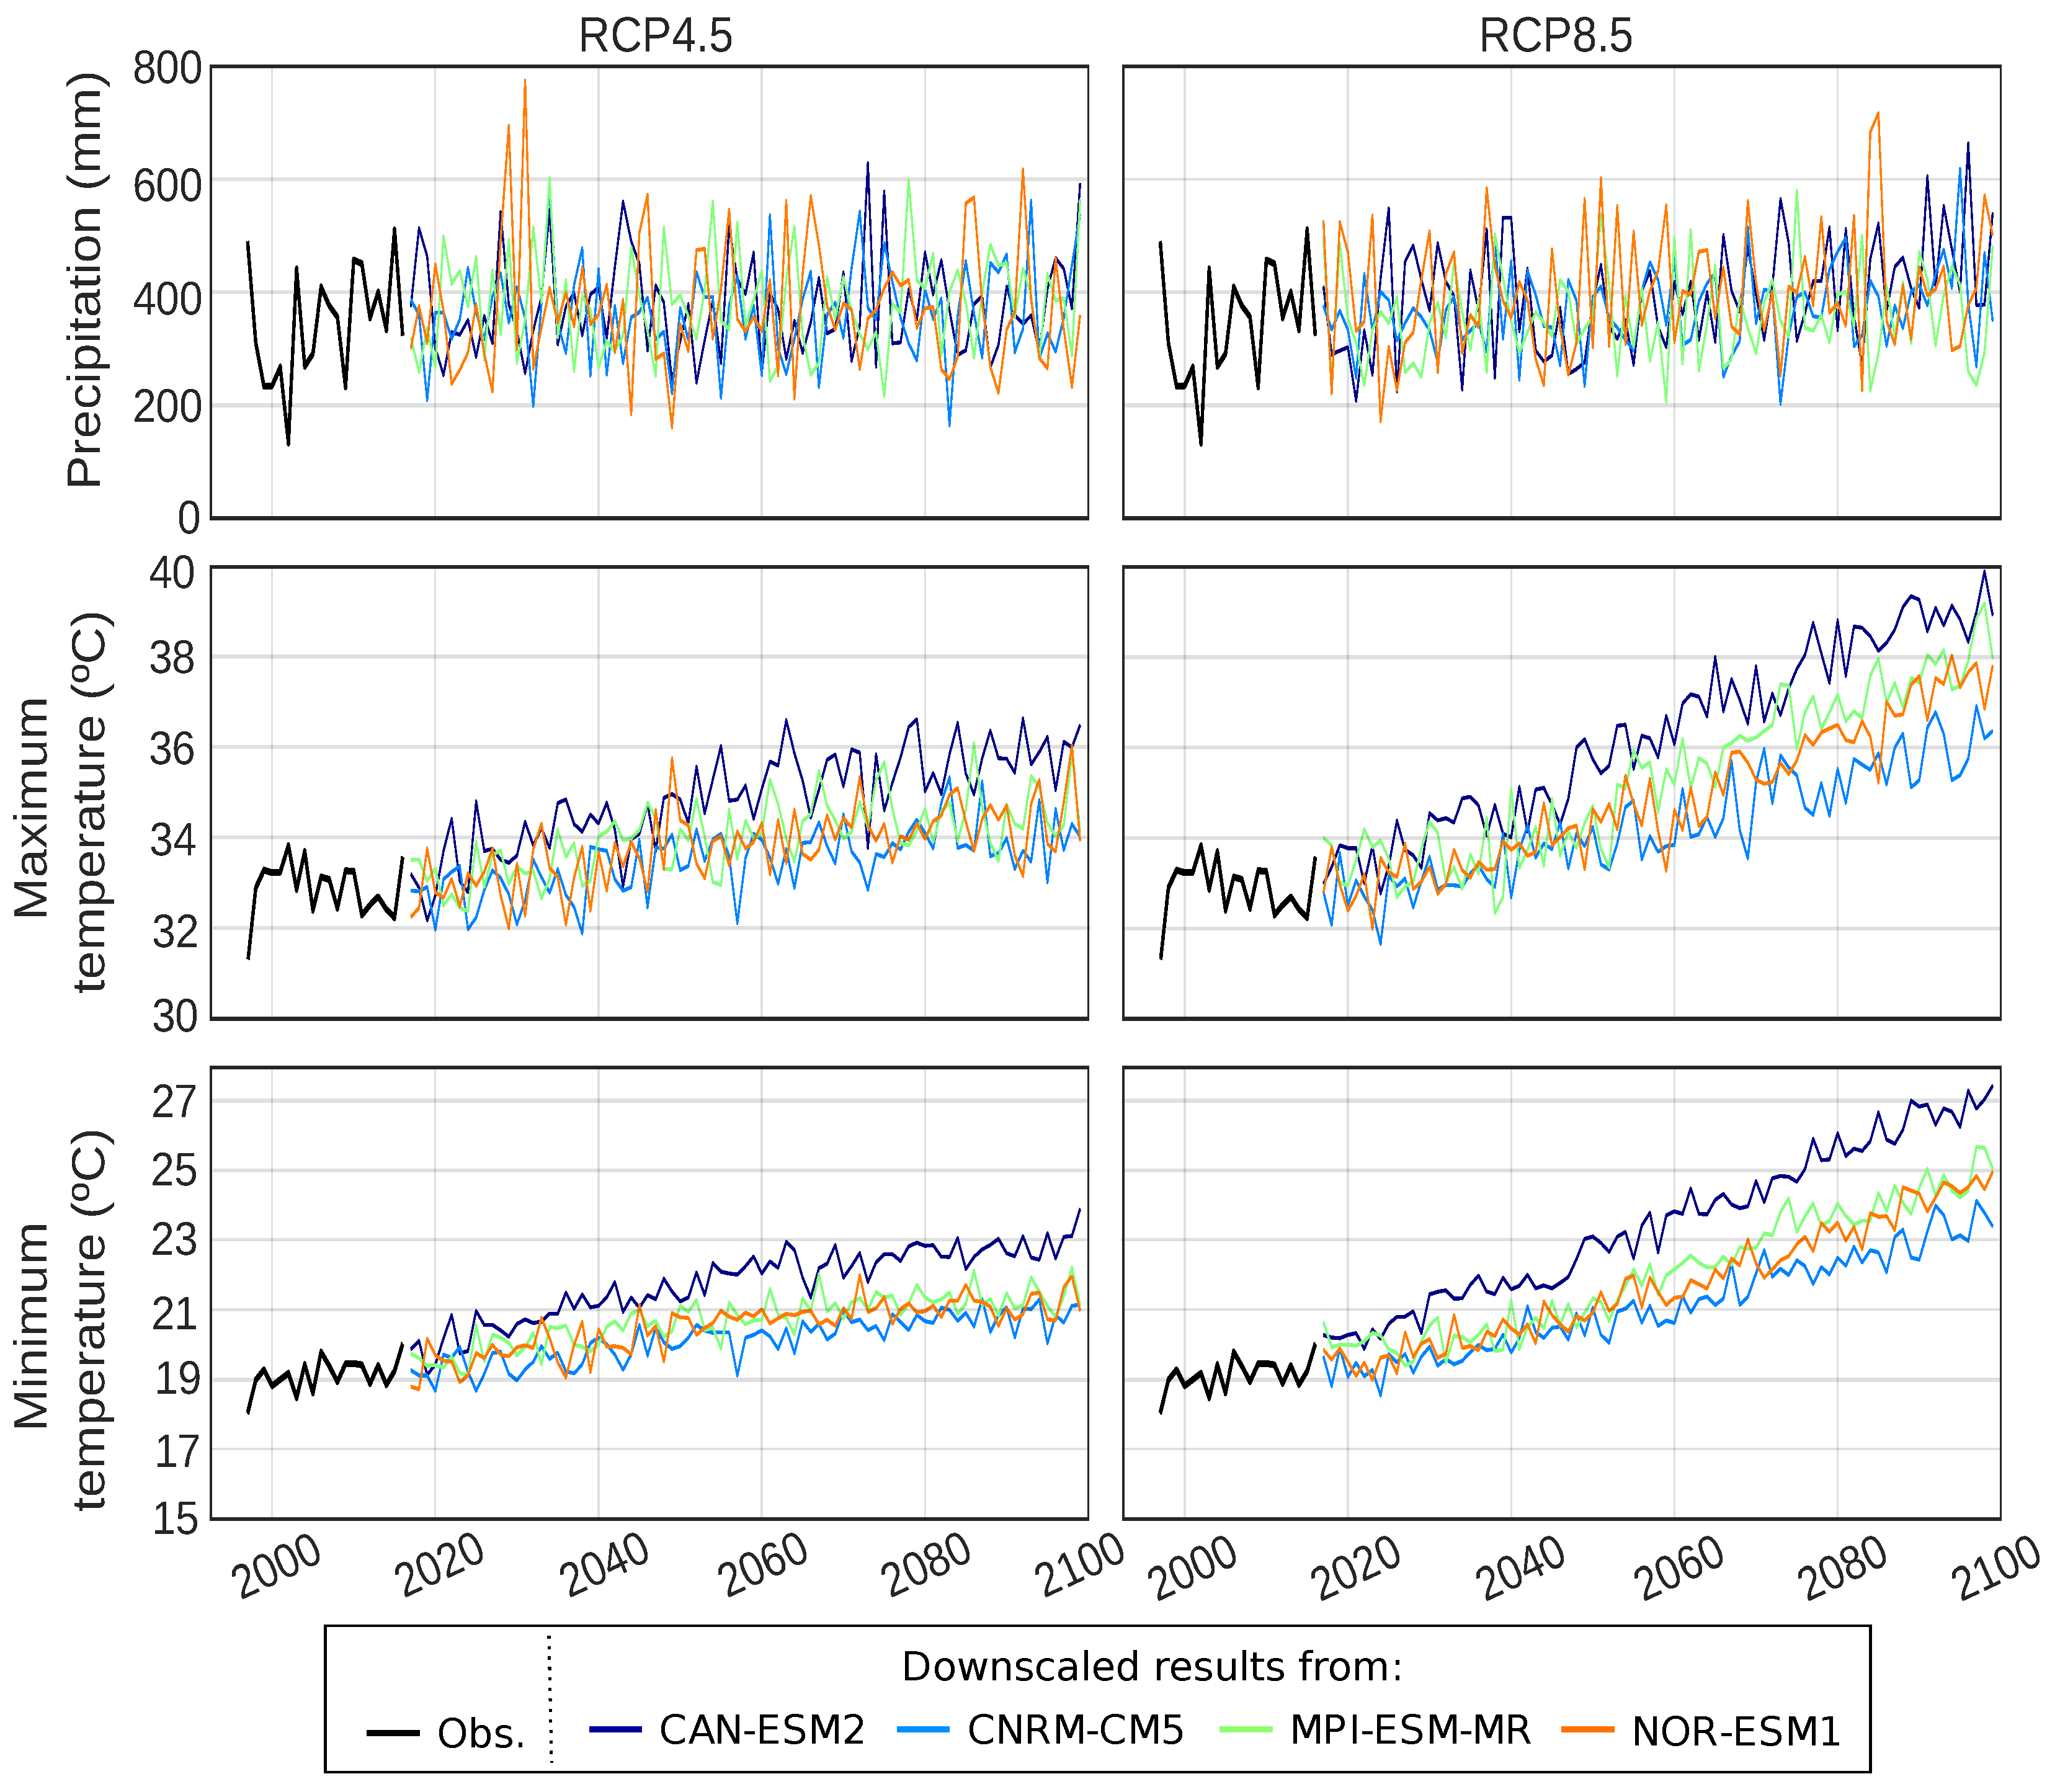
3.2.1. Changes in Precipitation and Temperatures

Figure 6 shows the projected annual precipitation, maximum and minimum temperature averaged along the 15 PMD stations up to 2100, as obtained from statistical downscaling. On the one hand, projected precipitation exhibits large inter-annual variability, with an average increase of about 10–20% for the end of the century (with respect to the historical period). On the other hand, beyond the uncertainty due to the choice of ESM, projected maximum (minimum) temperature exhibits an average increase of about 2 °C/5 °C (2 °C/6 °C) for the end of the century under the RCP4.5/RCP8.5, respectively. All these results are in agreement with previous studies (see, e.g., [11]).
Note that increasing temperatures, in particular minimum values, will exacerbate challenges for farmers, particularly in the warm Kharif season, as plant water requirements will rise and certain temperature thresholds which are crucial for the development of crops will be increasingly exceeded (see Section 3.2.2). Moreover, rising maximum and minimum temperatures will increase the accumulated heat or growing degree days, resulting in shorter growing periods and earlier harvest.

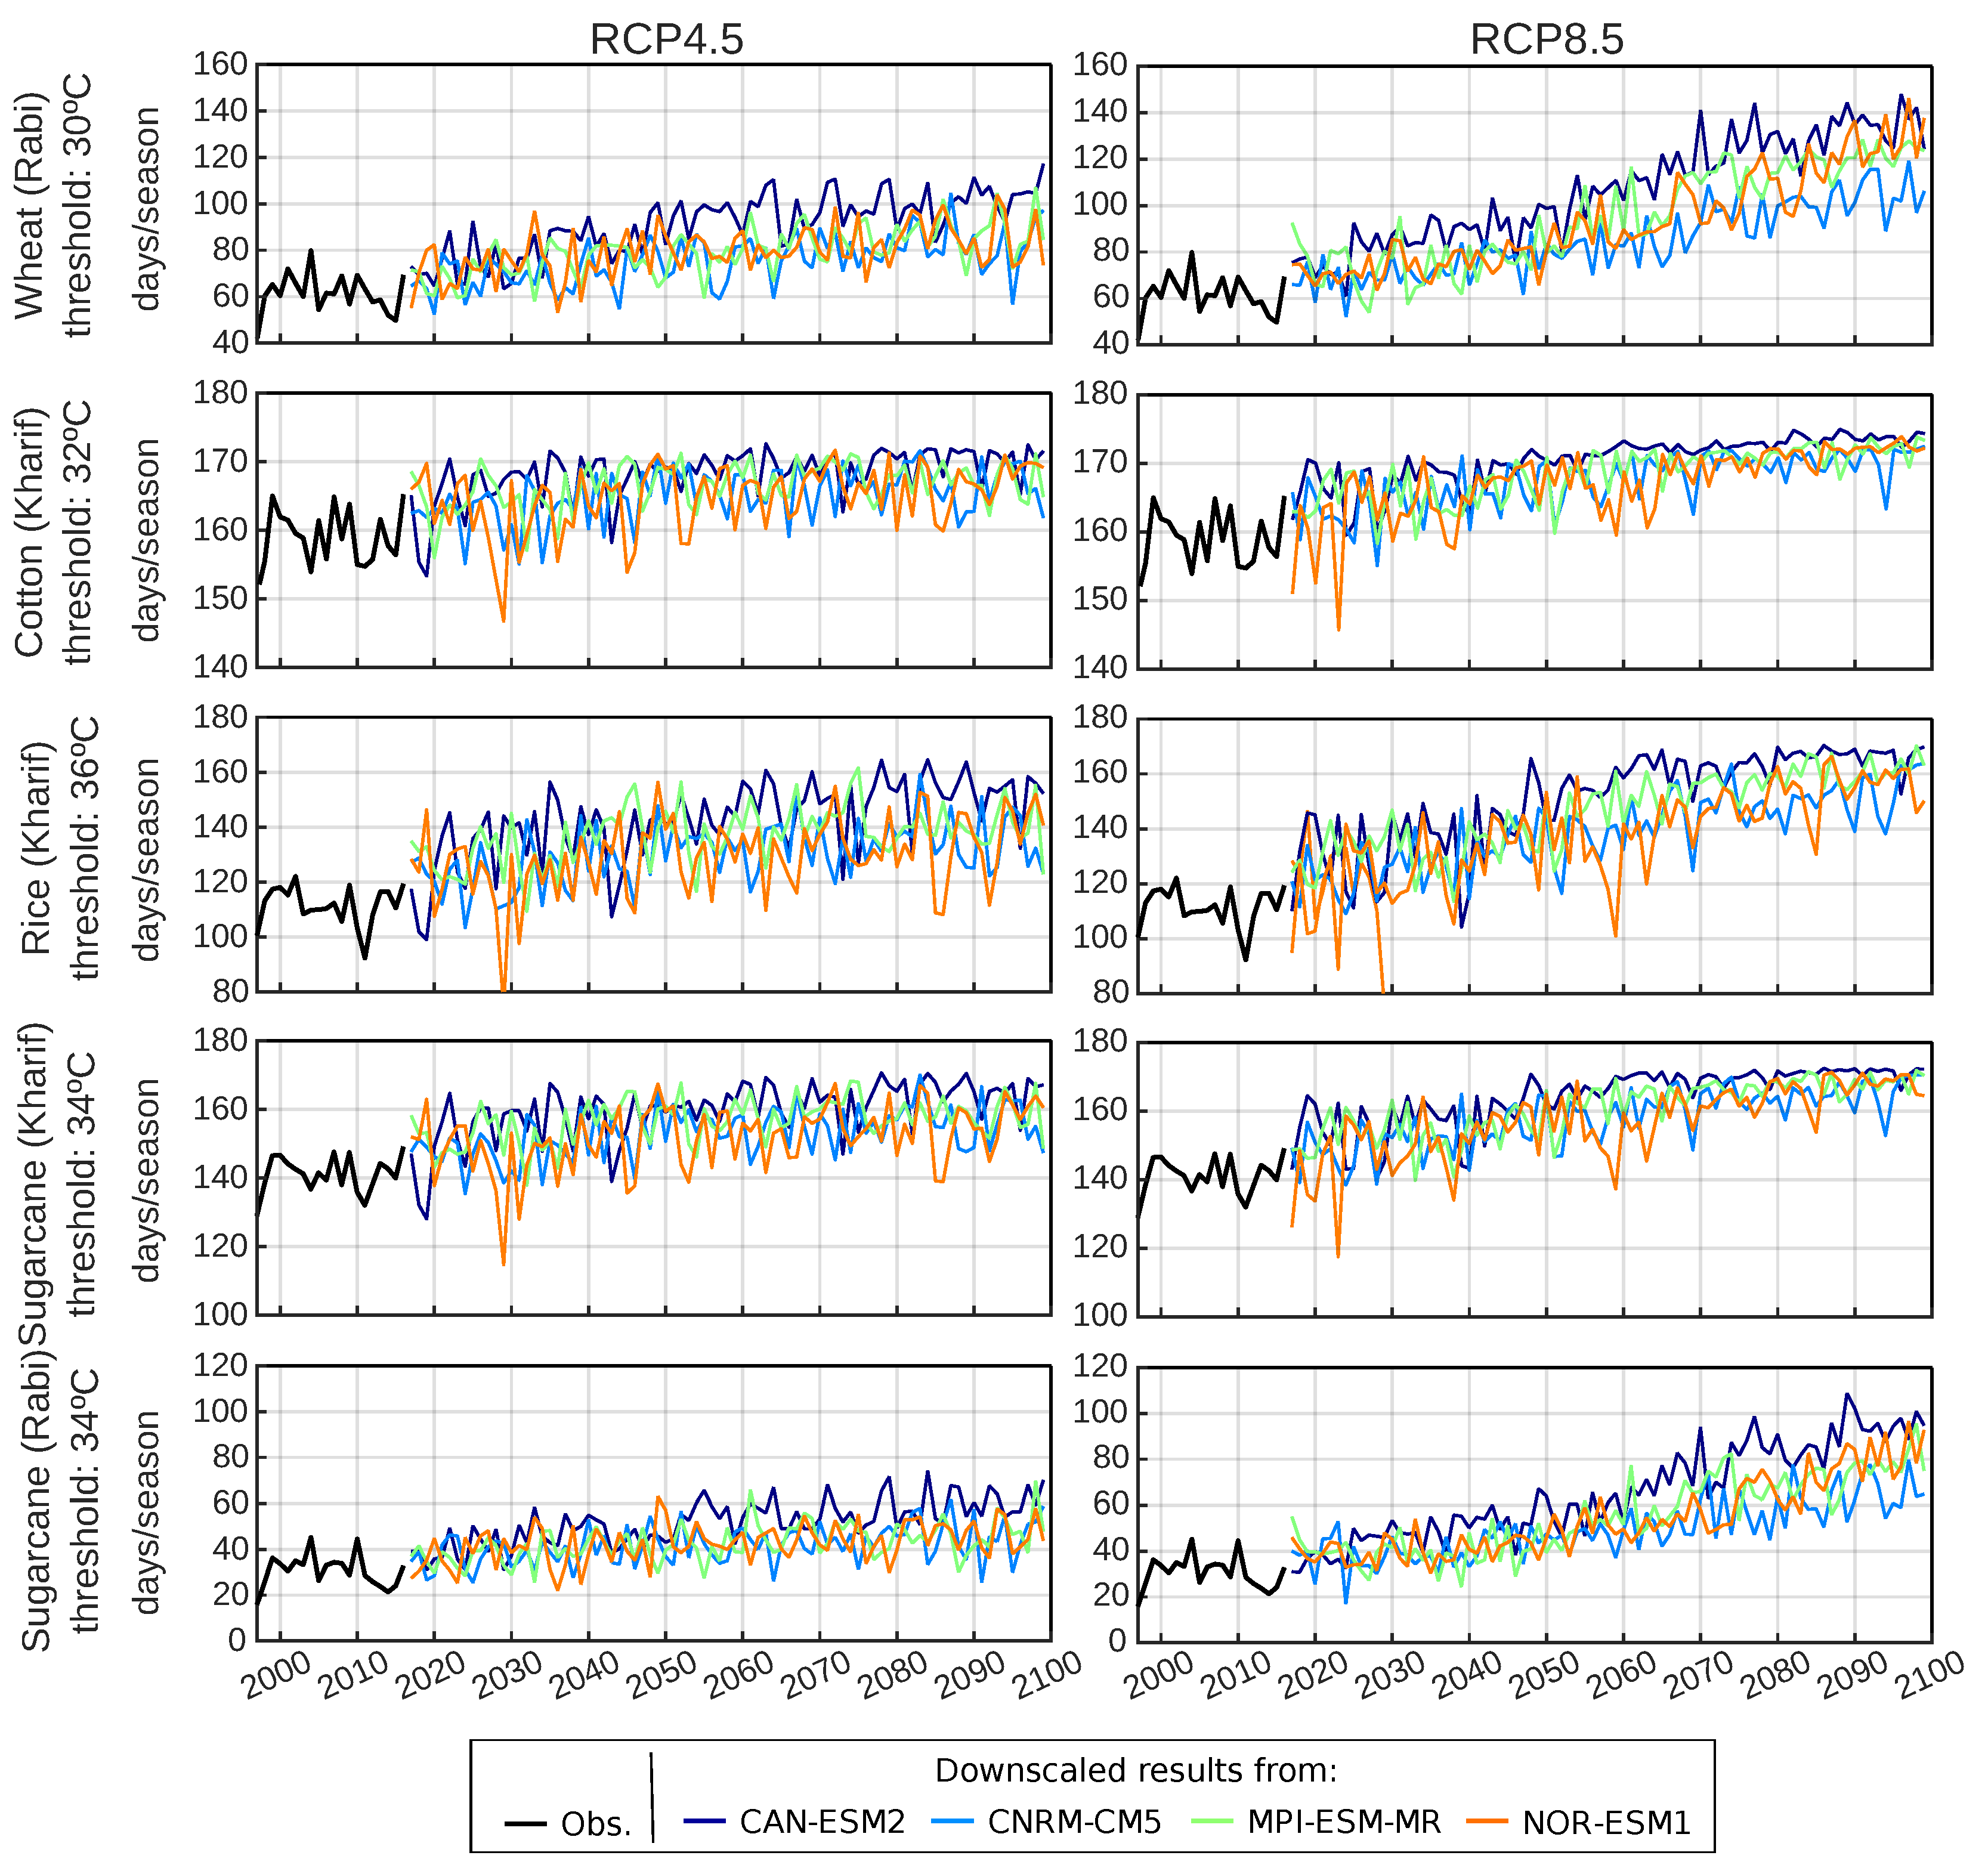
3.2.2. Change in Crop-Specific Temperature-Based Indicators

Most of the agricultural production in Punjab and Sindh provinces depends on the Indus Basin Irrigation System (IBIS). As a result, most agriculture in the basin does not depend directly on water from precipitation, rather on water availability in the basin more broadly. Therefore, the investigation of crop-specific indicators in this study focuses exclusively on temperature thresholds, leaving precipitation out of the discourse. In particular, we analyze the number of “hot” days exceeding a maximum temperature of 30, 32, 36 and 34 °C. These thresholds have been empirically determined to be critical for wheat, cotton, rice and sugarcane, respectively, [25,26,27,28,29]. These thresholds mark the boundaries for heat stress above which the plant’s physiology is negatively affected, or even inhibited.
Figure 7 shows, for each crop (in rows), the annual projections of the number of “hot” days averaged over the 15 PMD stations up to 2100, as given by the different ESMs used (in colors) under the RCP4.5 and RCP8.5 scenarios (left and right column, respectively), while increases in temperature and CO 2 enrichment support the growth and development of wheat [39], temperatures above 30 °C can result in a decline in pollen viability [46]. The first row of Figure 7 shows that the number of days per year with maximum temperature above 30 °C in Rabi is projected to increase from about 70 to up to 140 days/season (depending on the ESM and RCP) by 2100, which suggests that this crop’s productivity will likely be negatively affected by heat stress over the studied region. More intense and shorter rainy periods may compound this negative effect; however, in the mainly irrigated basin, it is expected to be limited compared to temperature drivers.
Cotton is impacted by heat stress at temperatures above 32 °C, when pollen viability and pollen tube elongation is reduced [47]. Moreover, above this critical threshold, water losses due to evapotranspiration may make the plant undergo water stress, which in turn may inhibit its growth. Nevertheless, the second row in Figure 7 shows that the number of days with maximum temperature above 32 °C during Kharif is only projected to increase from about 160 to 170 days/season (depending on the ESM and RCP) by 2100, which suggests that the impact of climate change on local cotton plantations may be limited.
For rice, exposure to temperatures above 36 °C can result in incomplete fertilization [48] and can even cause sterility [25]. The third row in Figure 7 shows that the number of days per year with maximum temperature above this critical threshold during Kharif is expected to increase from approximately 110 to 160 days/season (depending on the ESM and RCP) by the end of the century. The results highlight the potential challenge for rice cultivation over Punjab and Sindh provinces, which currently account for about 90% of this key crop’s production in Pakistan. To ensure sustainable and resilient production in the future, adaptation measures should be considered through appropriate agricultural planning, adjusted cropping calendars and irrigation schedules and cultivation of more heat-resilient rice varieties.
Sugarcane requires temperatures around 30–34 °C for economic production. Outside this optimal range, a reduction in yields is observed [49,50]. The fourth row in Figure 7 indicates that the number of days per year with maximum temperature exceeding 34 °C in Kharif is projected to increase from about 140 to 160 days/season (depending on the ESM and RCP) by 2100; whilst, for Rabi (fifth row), this indicator is expected to increase from about 30 to up 90 (depending on the ESM and RCP), especially from 2060 onward. Although projected changes (with respect to the observed historical conditions) are important in both seasons, these results indicate that Rabi may become more viable for sugarcane production in Punjab and Sindh provinces.

4. Conclusions

Building a better understanding of climate trends and extremes in the IRB provides a basis for identification of efficient adaptation measures and targeted investments for the agriculture sector in Pakistan. The present study elucidates the spatial and temporal distribution of observed climate trends and the frequency of projected extreme conditions that can affect the long-term productivity of the four main crops in the Punjab and Sindh provinces: wheat, cotton, sugarcane and rice. Our results indicate that changes in the annual regime of temperatures (e.g., increasing temperatures at the end of the summer period) may lead to late harvest of Kharif crops and therefore late planting of Rabi crops, which constitutes one of the major risks for wheat production in the region. Coinciding with an observed decrease in precipitation, we have also detected increases in both maximum and minimum temperature in October, resulting in increased evapotranspiration, decreased water availability and higher heat stress conditions for crops, mostly at the end of the Kharif and beginning of the Rabi season. Moreover, the findings emerging from the seasonal and monthly trend analysis undertaken emphasize that shifts in the seasonality of climatic variables might be critical drivers of the timing and stress on cropping systems into the future. This effect should be considered when developing future cropping calendars, crop-tailored irrigation schedules, national adaptation plans and advisory services to farmers.
Analysis of future climate projections highlights that the climatic trends (and their related impacts) observed over the last two decades will likely be exacerbated in the future. In particular, while temperatures (especially minimum temperature) will continue to rise, precipitation is expected to become more variable, both spatially and temporally. These conditions combined will result in challenges for farmers, as critical temperature thresholds are increasingly exceeded and plant water requirements rise. Crop-specific analysis of empirically derived heat thresholds highlight that future warming will result in heat stress for the four major crops of the region (wheat, cotton, rice and sugarcane) in the mid and long-term future, suggesting the need for adapted crop varieties or other measures to address heat stress and increased water demand. The results presented highlight that all crops will experience temperatures exceeding their optimal heat threshold into the future, increasing until the end of the century. Cotton, with the lowest optimal heat threshold, will experience approximately a 10 days increase in days exceeding the threshold throughout the century. The other crops, namely rice and sugarcane, have higher heat stress thresholds (36 and 34 °C, respectively), and therefore experience fewer days with heat thresholds exceeded at the beginning of the century, increasing to the end of the century. Winter wheat will experience fewer days above the critical heat threshold, however this number will increase toward the end of the century.
This study provides an evidence-base of climate-driven impacts on crops in the IRB which should be referenced for future adaptation and resilience measures for agriculture in the basin. Relevant adaptation measures supported by the current findings include updated cropping calendars based on climatic conditions, developing irrigation schedules by crop and location, promoting crops which better tolerate heat conditions and local planning/policy making based on impact assessments, while the results of this study elucidate some key impacts in this important basin, future work should further parameterize the system to look more in depth at hydrological changes in the basin and diverse crops. This analysis, coupled with previous and future impact assessments, will support the identification of resilience measures to reduce the negative impacts that climate change can have on the IRB’s agriculture.

Author Contributions

A.M.C.H., J.A.-B. and R.M. conceived the study. M.A. (Muhammad Afzaal), D.K. and B.A. provided the meteorological data and R.M. performed all the analyses. Finally, A.M.C.H., J.A.-B. and R.M. wrote the manuscript, which was reviewed by the rest of authors. All authors have read and agreed to the published version of the manuscript.

Funding

This research received no external funding.

Institutional Review Board Statement

Not applicable.

Informed Consent Statement

Not applicable.

Data Availability Statement

Not applicable.

Acknowledgments

The data collection and analysis for the study was initiated under the formulation of the FAO-led Green Climate Fund (GCF) project in Pakistan entitled “Transforming the Indus Basin with Climate Resilient Agriculture and Water Management” and further elaborated by the authors. Meteorological data used in this study was provided by the Pakistan Meteorological Department (PMD) and guidance on crop parameters was provided by experts from FAO-Pakistan. The authors acknowledge colleagues in FAO’s investment centre for leading the project formulation, the technical support and inputs from FAO-Pakistan and the Ministry of Climate Change in Pakistan, the National Designated Authority for the GCF project. The findings of this study have informed the development of the GCF project and identified areas for further assessment through implementation. The authors also want to acknowledge the project “Development of the Climate and Agriculture risk Visualization and Assessment (CAVA) for climate change vulnerability analysis”, funded by FAO and coordinated by R.M. at the University of Cantabria.

Conflicts of Interest

The authors declare no conflict of interest.

References

  1. Pakistan Ministry of Finance: Pakistan Economic Survey 2016–2017. 2017. Available online: https://www.finance.gov.pk/survey/chapters_17/Pakistan_ES_2016_17_pdf.pdf (accessed on 17 May 2021).
  2. Eckstein, D.; Künzel, V.; Schäfer, L.; Winges, M. Global Climate Risk Index 2020. Germanwatch 2019. Available online: https://germanwatch.org/sites/default/files/20-2-01e%20Global%20Climate%20Risk%20Index%202020_15.pdf (accessed on 17 May 2021).
  3. Ministry of Climate Change (Government of Pakistan). Pakistan’s Second National Communication on Climate Change; Technical Report; Ministry of Climate Change: Islamabad, Pakistan, 2019.
  4. Hanif, U.; Syed, S.H.; Ahmad, R.; Malik, K.A.; Nasir, M. Economic Impact of Climate Change on the Agricultural Sector of Punjab. 2010. Available online: http://www.jstor.org/stable/41428690 (accessed on 17 May 2021).
  5. Nomman, A.; Schmitz, M. Economic assessment of the impact of climate change on the agriculture of Pakistan. Bus. Econ. Horiz. (BEH) 2011, 4, 1–12. [Google Scholar] [CrossRef]
  6. Abid, M.; Schilling, J.; Scheffran, J.; Zulfiqar, F. Climate change vulnerability, adaptation and risk perceptions at farm level in Punjab, Pakistan. Sci. Total Environ. 2016, 547, 447–460. [Google Scholar] [CrossRef]
  7. Chaudhry, Q.U.Z.; Mahmood, A.; Rasul, G.; Afzaal, M. Climate change indicators of Pakistan. Pak. Meterol. Dep. 2009, PMD-22/2009, 1–43. [Google Scholar]
  8. Rasul, G.; Mahmood, A.; Sadiq, A.; Khan, S. Vulnerability of the Indus delta to climate change in Pakistan. Pak. J. Meteorol. 2012, 8, 89–107. [Google Scholar]
  9. Aryal, J.P.; Sapkota, T.B.; Khurana, R.; Khatri-Chhetri, A.; Rahut, D.B.; Jat, M.L. Climate change and agriculture in South Asia: Adaptation options in smallholder production systems. Environ. Dev. Sustain. 2020, 22, 5045–5075. [Google Scholar] [CrossRef] [Green Version]
  10. FAO. AQUASTAT Main Database, Food and Agriculture Organization of the United Nations (FAO). 2016. Available online: http://www.fao.org/aquastat/en/databases/maindatabase (accessed on 18 January 2022).
  11. Chaudhry, Q.U.Z. Climate Change Profile of Pakistan; Asian Development Bank: Mandaluyong City, Philippines, 2017. [Google Scholar]
  12. Ahmad, B.; Rana, A.; Abuzar, K.; Kiran, R.; Mansoor, R.; Kubra, S. Diagnostic study of heavy downpour in 2015 flash floods over Chitral Area, Northern Pakistan. Pak. J. Meteorol. 2016, 12, 79–93. [Google Scholar]
  13. Lutz, A.F.; Immerzeel, W.W.; Kraaijenbrink, P.D.A.; Shrestha, A.B.; Bierkens, M.F.P. Climate Change Impacts on the Upper Indus Hydrology: Sources, Shifts and Extremes. PLoS ONE 2016, 11, e0165630. [Google Scholar] [CrossRef] [Green Version]
  14. Ali, S.; Li, D.; Congbin, F.; Khan, F. Twenty first century climatic and hydrological changes over Upper Indus Basin of Himalayan region of Pakistan. Environ. Res. Lett. 2015, 10, 014007. [Google Scholar] [CrossRef]
  15. Zahid, M.; Rasul, G. Frequency of extreme temperature and precipitation events in Pakistan 1965–2009. Sci. Int. 2011, 23, 313–319. [Google Scholar]
  16. Pakistan Ministry of Finance: Pakistan Economic Survey 2010–2011. 2011. Available online: http://www.finance.gov.pk/survey/chapter_11/Highlights.pdf (accessed on 17 May 2021).
  17. World Meteorological Organization (WMO). State of the Global Climate 2020, Technical Report. 2021. Available online: https://library.wmo.int/doc_num.php?explnum_id=10618 (accessed on 17 May 2021).
  18. Sheikh, M.M.; Manzoor, N.; Adnan, M.; Ashraf, J.; Khan, A.M. Climate Profile and Past Climate Changes in Pakistan; Technical report; Global Change Impact Studies Centre: Islabamad, Pakistan, 2009.
  19. Ahmad, B.; Mahmood, S. Observed, Simulated and Projected Extreme Climate Indices over Pakistan; Anchor Academic Publishing: Hamburg, Germany, 2017. [Google Scholar]
  20. Ikram, F.; Afzaal, M.; Bukhari, S.; Ahmed, B. Past and future trends in frequency of heavy rainfall events over Pakistan. Pak. J. Meteorol. Vol. 2016, 12, 57–78. [Google Scholar]
  21. Rajbhandari, R.; Shrestha, A.B.; Kulkarni, A.; Patwardhan, S.K.; Bajracharya, S.R. Projected changes in climate over the Indus river basin using a high resolution regional climate model (PRECIS). Clim. Dyn. 2015, 44, 339–357. [Google Scholar] [CrossRef] [Green Version]
  22. Ullah, A.; Salehnia, N.; Kolsoumi, S.; Ahmad, A.; Khaliq, T. Prediction of effective climate change indicators using statistical downscaling approach and impact assessment on pearl millet (Pennisetum glaucum L.) yield through Genetic Algorithm in Punjab, Pakistan. Ecol. Indic. 2018, 90, 569–576. [Google Scholar] [CrossRef]
  23. Ali, M.A.; Hassan, M.; Mehmood, M.; Kazmi, D.H.; Chishtie, F.A.; Shahid, I. The Potential Impact of Climate Extremes on Cotton and Wheat Crops in Southern Punjab, Pakistan. Sustainability 2022, 14, 1609. [Google Scholar] [CrossRef]
  24. Pakistan Bureau of Statistics: Agricultural Statistics of Pakistan 2010–2011. 2011. Available online: https://www.pbs.gov.pk/content/agriculture-statistics-pakistan-2010-11 (accessed on 17 May 2021).
  25. Satake, T.; Yoshida, S. High Temperature-Induced Sterility in Indica Rices at Flowering. Jpn. J. Crop Sci. 1978, 47, 6–17. [Google Scholar] [CrossRef] [Green Version]
  26. Gawith, J.R.P.M. Temperatures and the growth and development of wheat: A review. Eur. J. Agron. 1999, 10, 23–36. [Google Scholar] [CrossRef]
  27. Wahid, A.; Close, T. Expression of dehydrins under heat stress and their relationship with water relations of sugarcane leaves. Biol. Plant. 2007, 51, 104–109. [Google Scholar] [CrossRef]
  28. Carmo-Silva, A.E.; Gore, M.A.; Andrade-Sanchez, P.; French, A.N.; Hunsaker, D.J.; Salvucci, M.E. Decreased CO2 availability and inactivation of Rubisco limit photosynthesis in cotton plants under heat and drought stress in the field. Environ. Exp. Bot. 2012, 83, 1–11. [Google Scholar] [CrossRef]
  29. Baker, J.T.; Boote, K.J.; Allen, L.H., Jr. Potential Climate Change Effects on Rice: Carbon Dioxide and Temperature. In Climate Change and Agriculture: Analysis of Potential International Impacts; John Wiley & Sons, Ltd.: Hoboken, NJ, USA, 2015; Chapter 2; pp. 31–47. [Google Scholar] [CrossRef]
  30. Mann, H.B. Nonparametric tests against trend. Econom. J. Econom. Soc. 1945, 13, 245–259. [Google Scholar] [CrossRef]
  31. Kendall, M. Rank Correlation Methods, 4th ed.; Charles Griffin: San Francisco, CA, USA, 1975. [Google Scholar]
  32. Gilbert, R.O. Statistical Methods for Environmental Pollution Monitoring; Wiley: New York, NY, USA, 1987. [Google Scholar]
  33. van Belle, G.; Hughes, J.P. Nonparametric Tests for Trend in Water Quality. Water Resour. Res. 1984, 20, 127–136. [Google Scholar] [CrossRef]
  34. Zhang, X.; Harvey, K.D.; Hogg, W.D.; Yuzyk, T.R. Trends in Canadian streamflow. Water Resour. Res. 2001, 37, 987–998. [Google Scholar] [CrossRef]
  35. Elnur, D.H.B.M.A.H. Detection of hydrologic trends and variability. J. Hydrol. 2002, 255, 107–122. [Google Scholar] [CrossRef]
  36. Partal, T.; Kahya, E. Trend analysis in Turkish precipitation data. Hydrol. Process. 2006, 20, 2011–2026. [Google Scholar] [CrossRef]
  37. Obot, N.; Chendo, M.; Udo, S.; Ewona, I. Evaluation of rainfall trends in Nigeria for 30 years (1978–2007). Int. J. Phys. Sci. 2010, 5, 2217–2222. [Google Scholar]
  38. Manzanas, R.; Amekudzi, L.K.; Preko, K.; Herrera, S.; Gutiérrez, J.M. Precipitation variability and trends in Ghana: An intercomparison of observational and reanalysis products. Clim. Chang. 2014, 124, 805–819. [Google Scholar] [CrossRef] [Green Version]
  39. Alvar-Beltrán, J.; Heureux, A.; Soldan, R.; Manzanas, R.; Khan, B.; Dalla Marta, A. Assessing the impact of climate change on wheat and sugarcane with the AquaCrop model along the Indus River Basin, Pakistan. Agric. Water Manag. 2021, 253, 106909. [Google Scholar] [CrossRef]
  40. Thomson, A.M.; Calvin, K.V.; Smith, S.J.; Kyle, G.P.; Volke, A.; Patel, P.; Delgado-Arias, S.; Bond-Lamberty, B.; Wise, M.A.; Clarke, L.E.; et al. RCP4.5: A pathway for stabilization of radiative forcing by 2100. Clim. Chang. 2011, 109, 77–94. [Google Scholar] [CrossRef] [Green Version]
  41. Riahi, K.; Rao, S.; Krey, V.; Cho, C.; Chirkov, V.; Fischer, G.; Kindermann, G.; Nakicenovic, N.; Rafaj, P. RCP8.5—A scenario of comparatively high greenhouse gas emissions. Clim. Chang. 2011, 109, 33. [Google Scholar] [CrossRef] [Green Version]
  42. Chylek, P.; Li, J.; Dubey, M.K.; Wang, M.; Lesins, G. Observed and model simulated 20th century Arctic temperature variability: Canadian Earth System Model CanESM2. Atmos. Chem. Phys. Discuss. 2011, 11, 22893–22907. [Google Scholar] [CrossRef]
  43. Voldoire, A.; Sánchez-Gómez, E.; Salas y Mélia, D.; Decharme, B.; Cassou, C.; Sénési, S.; Valcke, S.; Beau, I.; Alias, A.; Chevallier, M.; et al. The CNRM-CM5.1 global climate model: Description and basic evaluation. Clim. Dyn. 2013, 40, 2091–2121. [Google Scholar] [CrossRef] [Green Version]
  44. Giorgetta, M.A.; Jungclaus, J.; Reick, C.H.; Legutke, S.; Bader, J.; Böttinger, M.; Brovkin, V.; Crueger, T.; Esch, M.; Fieg, K.; et al. Climate and carbon cycle changes from 1850 to 2100 in MPI-ESM simulations for the Coupled Model Intercomparison Project phase 5. J. Adv. Model. Earth Syst. 2013, 5, 572–597. [Google Scholar] [CrossRef]
  45. Bentsen, M.; Bethke, I.; Debernard, J.B.; Iversen, T.; Kirkevåg, A.; Seland, Ø.; Drange, H.; Roelandt, C.; Seierstad, I.A.; Hoose, C.; et al. The Norwegian Earth System Model, NorESM1-M – Part 1: Description and basic evaluation of the physical climate. Geosci. Model Dev. 2013, 6, 687–720. [Google Scholar] [CrossRef] [Green Version]
  46. Akter, N.; Rafiqul Islam, M. Heat stress effects and management in wheat. A review. Agron. Sustain. Dev. 2017, 37, 37. [Google Scholar] [CrossRef]
  47. Kakani, V.; Reddy, K.; Koti, S.; Wallace, T.; Prasad, P.; Reddy, V.; Zhao, D. Differences in in vitro pollen germination and pollen tube growth of cotton cultivars in response to high temperature. Ann. Bot. 2005, 96, 59–67. [Google Scholar] [CrossRef] [PubMed] [Green Version]
  48. Jagadish, S.; Murty, M.; Quick, W. Rice responses to rising temperatures: Challenges, perspectives and future directions. Plant Cell Environ. 2015, 38, 1686–1698. [Google Scholar] [CrossRef]
  49. Tai, P.; Lentini, R. Freeze Damage of Florida Sugarcane. In Sugarcane Handbook, 1st ed.; Anderson, D.L., Ed.; University of Florida Cooperative Extension Service, Institute of Food and Agricultural Sciences: Gainesville, FL, USA, 1998; pp. 1–3. [Google Scholar]
  50. Sanghera, G.S.; Malhotra, P.K.; Singh, H.; Bhatt, R. Climate change impact in sugarcane agriculture and mitigation strategies. Harnessing Plant Biotechnol. Physiol. Stimul. Agric. Growth 2019, 99–115. [Google Scholar]
Figure 1. Study area and location of the 15 weather stations used in this work (red triangles), together with a land-use map for the Punjab and Sindh provinces. Note that the Jammu and Kashmir regions, whose current status has not yet been agreed upon the different parties involved, are not shown in the map. Sources: PMD and FAO-Pakistan.
Atmosphere 13 00378 g001
Figure 2. Observed mean climatology for precipitation, maximum and minimum temperature (in rows) for the 15 PMD stations over the period 1997–2016, for the entire year and the Kharif and Rabi seasons (in columns).
Atmosphere 13 00378 g002
Figure 3. Observed annual trends in precipitation, maximum and minimum temperature (from top to bottom) over the period 1997–2016 for the whole year and the Kharif and Rabi seasons (in columns). Significant (95% confidence level) trends are marked with a white dot.
Atmosphere 13 00378 g003
Figure 4. Observed annual trends in precipitation, maximum and minimum temperature (panels from left to right) over the period 1997–2016 for each of the twelve calendar months. Significant (95% confidence level) trends are marked with a white dot.
Atmosphere 13 00378 g004
Figure 5. Observed annual trends for the temperature- and precipitation-based extreme indicators listed in Table 3 (left and right panel, respectively) over the period 1997–2016. Significant (95% confidence level) trends are marked with a white dot.
Atmosphere 13 00378 g005
Figure 6. Projections of annual precipitation, maximum and minimum temperature (in rows) averaged along the 15 PMD stations considered up to 2100, as obtained from statistical downscaling. Colors represent the different ESMs used under the RCP4.5 and RCP8.5 scenarios (left and right column, respectively). For completeness, the available observations for the period 1997–2016 are given in black.
Atmosphere 13 00378 g006
Figure 7. Annual projections of the number of “hot” days averaged over the 15 PMD stations up to 2100, as given by the different ESMs (in colors) under the RCP4.5 and RCP8.5 scenarios (left and right column, respectively). The threshold defining a “hot” day depends on each particular crop (in rows), being 30/32/36/34 °C for wheat/cotton/rice/sugarcane. Only the growing season of each crop is considered in this analysis: Rabi for wheat and Kharif for rice and cotton. For sugarcane, which grows in the two seasons, results are shown for both Kharif and Rabi (last two rows).
Atmosphere 13 00378 g007
Table 1. Details of the 15 PMD stations used in this study.
Station NameLongitude (°)Latitude (°)
BADIN68.9024.63
BAHAWAL-NAGAR73.2529.95
BAHAWAL-PUR71.7829.33
DERA ISMAIL KHAN70.9231.82
FAISALABAD73.1031.43
HYDERABAD68.4225.38
JACOBABAD68.4728.30
JHELUM73.7232.93
KARACHI (AIRPORT)67.1324.90
KHANPUR70.6828.65
LAHORE74.3331.55
MULTAN71.4330.20
MURREE73.3833.92
NAWABSHAH68.3726.25
SIALKOT74.5332.50
Table 2. Cropping calendar for wheat, cotton, rice and sugarcane (in rows). The blue/green/yellow boxes, labelled as P/G/H correspond to the planting/growing/harvesting phase. Brown boxes identify those periods of the year which can correspond to more than one phase, depending on the region. Source: Personal communication from Jam Khali (FAO-Pakistan).
JanFebMarAprMayJunJulAugSepOctNovDec
Wheat (Rabi)GGHH PPG
Rice (Kharif) PPPGGG/HHH
Cotton (Kharif) PPPGGGHHH
Sugarcane (Kharif)G/HP/HPP/GGGGGGGGG
Sugarcane (Rabi)GGGGGGGGP/HP/HP/HG
Table 3. Precipitation and temperature-based extreme indicators used.
Related VariableIndicatorDescriptionUnits
PrecipitationCDDLargest number of Consecutive Dry Days (precipitation < 1 mm)days
CWDLargest number of Consecutive Wet Days (precipitation ≥ 1 mm)days
SDIISimple Daily Intensity Indexmm/wet day
R20Number of very heavy precipitation days (precipitation ≥ 20 mm)days
TemperaturesTX90p90th percentile of maximum temperature°C
SUSummer days: Number of days with maximum temperature above 35 °Cdays
TRTropical nights: Number of days with minimum temperature above 20 °Cdays
ETRExtreme diurnal temperature range (difference between the highest maximum temperature and the lowest minimum temperature)°C
Table 4. The four CMIP5 Earth System Models (ESMs) used in this study.
ESMInstitution Acronym and CountryHorizontal ResolutionReference
CAN-ESM2CCCMA (Canada)2.8° × 2.8°[42]
CNRM-CM5CNRM-CERFACS (France)1.4° × 1.4°[43]
MPI-ESM-MRMPI (Germany)1.8° × 1.8°[44]
NOR-ESM1NCC (Norway)1.5° × 1.9°[45]
Publisher’s Note: MDPI stays neutral with regard to jurisdictional claims in published maps and institutional affiliations.

