Article

Assessment of the Carbon Budget of Local Governments in South Korea

1
National Institute of Ecology, Seocheon 33657, Korea
2
Department Bio and Environmental Technology, Seoul Women’s University, Seoul 01797, Korea
3
Baekdudaegan National Arboretum, Bonghwa 36209, Korea
4
Center for Atmospheric and Environmental Modeling, Seoul National University Research Park, Seoul 08826, Korea
*
Author to whom correspondence should be addressed.
Atmosphere 2022, 13(2), 342; https://doi.org/10.3390/atmos13020342
Submission received: 17 December 2021 / Revised: 4 February 2022 / Accepted: 9 February 2022 / Published: 18 February 2022
(This article belongs to the Special Issue Frontiers in Quantifying CO2 Uptake by Forests)

Abstract

:
This study was carried out to assess the carbon budget of local governments in South Korea. The carbon budget was obtained from the difference between net ecosystem productivity (NEP) that the natural ecosystem displays, and carbon dioxide emissions calculated from energy consumption in each local government. NEP was obtained from the difference between net primary productivity, measured by an allometric method, and soil respiration, measured with EGM-4 in natural forests and artificial plantations. Heterotrophic respiration was adjusted to 55% level of the total soil respiration based on existing research results. A field survey to obtain information for components of the carbon cycle was conducted in Cheongju (central Korea) and Yeosu (southern Korea). Pinus densiflora, Quercus acutissima, and Quercus mongolica (central Korea) and P. densiflora and Q. acutissima (southern Korea) forests were selected as the natural forests. Pinus rigida and Larix kaempferi (central Korea) and P. rigida (southern Korea) plantations were selected as the artificial plantations. Vegetation types were classified by analyzing LandSat images by applying a GIS program. CO2 emissions were the highest in Pohang, Gwangyang, and Yeosu, where the iron and the petrochemical industrial complexes are located. CO2 emissions per unit area were the highest in Seoul, followed by Pohang and Gwangyang. CO2 absorption was the highest in the Gangwon province, where the forest area ratio to the total area is the highest, and the lowest in the metropolitan areas such as Seoul, Incheon, Daegu, Daejeon, and Gwangju. The number of local governments in which the amount of absorption is more than the emission amount was highest in Gangwon-do, where 10 local governments showed a negative carbon budget. Eight, seven, five, five, three, and three local governments in Gyeongsangbuk-do, Jeollanam-do, Gyeongsangnam-do, Jeollabuk-do, Gyeonggi-do, and Chungcheongbuk-do, respectively, showed a negative carbon budget where the amount of carbon absorption was greater than the emission amount. The carbon budget showed a very close correlation with carbon emission, and the carbon emission showed a significant correlation with population size. Moreover, the amount of carbon absorption showed a negative correlation with population size, population density, and non-forest area, and a positive correlation with the total area of the forest, coniferous forest area, and broad-leaved forest area. Considering the reality that carbon emissions exceed their absorption, measures to secure absorption sources should be considered as important as measures to reduce carbon emissions to achieve carbon neutrality in the future. As a measure to secure absorption sources, it is proposed to improve the quality of existing absorption sources, secure new absorption sources such as riparian forests, and efficiently arrange absorption sources.

1. Introduction

Ecosystem changes due to climate change are accompanied by functional changes, such as a biogeochemical cycle and the energy flow of ecosystems. The carbon cycle between atmosphere, vegetation, and soil among these functional changes may have a very high relevance for the trend of future climate change [1,2]. The carbon cycle of the ecosystem begins with fixing atmospheric carbon through photosynthesis by vegetation as a producer. Fixed carbon is supplied to the soil through dead trees, fallen leaves, fallen branches, etc.; some are returned to the atmosphere through decomposition and some are accumulated in the soil [3].
Summarizing the results of carbon absorption from the atmosphere and emission from the soil, the pure carbon absorption (net ecosystem production) of an ecosystem is calculated. In order to quantify the net ecosystem production for various vegetation types and to understand their carbon cycle, it is necessary to quantify the carbon flow of several stages leading to vegetation, soil, and atmosphere [4].
As components of the Earth’s terrestrial ecosystem, soil, vegetation, and atmosphere store about 1650, 600, and 795 Gt of carbon, respectively [5]. Vegetation absorbs about 60 Gt of carbon annually from the atmosphere through photosynthesis. Carbon amounting to 50–98 Gt y−1 is generated from the soil through soil respiration, which accounts for more than 10 times the amount of artificially generated CO2 due to fossil fuel combustion [5,6,7]. As such, the terrestrial ecosystem is an important component for maintaining the balanced Earth’s carbon cycle and carbon budget, and controls climate and environmental systems through a biological process of the components [8,9]. In addition, fluctuations and disturbances in functional roles, such as the biogeochemical cycle and energy flow in the terrestrial ecosystem, due to rapid changes in the climate system, are expected to ultimately affect the balance and feedback system of carbon between atmosphere, vegetation, and soil, which will have a significant impact on future climate change [1,2,10]. In this respect, it is very important to clearly understand and grasp the mechanisms and dynamics of the carbon cycle occurring between the atmosphere, vegetation, and soil in various terrestrial ecosystems. Therefore, researchers in this field are paying significant attention and making considerable effort to strategically clarify the carbon budget of the terrestrial ecosystem to predict future climate change systems and cope with the results [4,11,12].
The emission of huge amounts of greenhouse-effect gases, including CO2, into the atmosphere through excessive fossil energy use and land-use changes, which have lasted for the past 100 years, is accelerating the rapid climate crisis and warming [3,13,14,15]. Accordingly, many countries and related social organizations around the world are pointing to global warming as the cause of ongoing weather change and are making many efforts to reduce and control artificial greenhouse gas emissions caused by large-scale industrialization and forest destruction. In particular, in order to actively cope with climate change, each country is trying to understand climate change mechanisms and obtain information on the carbon budget in various ecosystems [5,9,16,17].
Carbon emissions from human activities affect the balance between the absorption and emission of carbon that the global ecosystem has maintained, causing irreversible changes in the global carbon cycle [18]. To recognize the seriousness of the climate change issue and solve it, the international society adopted the Paris Agreement in 2015, in which both developed and developing countries participated, following the adoption of the Kyoto Protocol in 1997, which only gave reduction obligations to developed countries. The goal of the Paris Agreement is to keep the global average temperature rise below 2 °C compared to before industrialization, and to further try to suppress it to 1.5 °C [19]. The IPCC [20] suggested that, in order to limit the global average temperature increase to within 1.5 °C by 2100, carbon dioxide emissions should be reduced by at least 45% worldwide by 2030 compared to 2010, and carbon neutrality should be achieved by 2050. By comparison, in the case of the 2 °C target achievement route, carbon dioxide emissions should be reduced by about 25% compared to 2010 by 2030, and carbon-zero should be achieved by 2070.
In order to put carbon neutrality into practice, it is first necessary to evaluate the carbon budget as a diagnostic evaluation to understand the current state. Carbon budgets are usually evaluated as the difference between carbon uptake by forests and carbon emissions from anthropogenic sources. To monitor a carbon budget, we have to quantify inputs (sources) and outputs (sinks) of CO2. Schimel [21], Le Quéré et al. [22], Candela and Carlson [23], and Friedlingstein et al. [24] have quantified carbon budgets at a global level.
These studies quantified fossil CO2 emissions (EFOS) based on energy statistics and cement production data, whereas emissions from land-use change (ELUC), mainly deforestation, are based on land-use and land-use change data and bookkeeping models. They estimated the ocean CO2 sink (SOCEAN) with global ocean biogeochemistry models and observation-based data-products. They estimated the terrestrial CO2 sink (SLAND) with dynamic global vegetation models.
To date, the carbon budget has mainly been evaluated at the global level. However, since the adoption of the carbon neutrality policy, in recent years the carbon balance has been evaluated at national, local government, and company levels. Nevertheless, most still focus on reducing carbon emissions, and no evaluation has been made of the budget between carbon emission and absorption. No evaluation has been undertaken of the carbon budget of a country or local government unit by comprehensively reviewing the emission and absorption of carbon. However, in order to achieve sustainable development and realize carbon neutrality, it is necessary to evaluate the carbon budget at a lower level, such as that of a national or local government.
The resulting carbon budget imbalance (BIM), the difference between the estimated total emissions and the estimated changes in the atmosphere, ocean, and terrestrial biosphere, are measures resulting from imperfect data and understanding of the contemporary carbon cycle. All uncertainties are reported as ±1σ.
However, each country tries to reduce the burden of mandatory reductions using the CO2 absorption function of forests as much as possible, as the reduction in emissions in the industrial sector is a factor that dampens the domestic economy. For this reason, the conservation of forests, creation of forests, and accurate calculation of net carbon absorption of forests that can be recognized internationally has emerged as a very important task. Accordingly, each country has been actively conducting research to measure the exact net carbon absorption of forests [25,26].
About 65% (6.3 × 10⁶ ha) of the total land area of South Korea is forested [27]. However, due to rapid industrialization and population growth, urbanization has progressed rapidly, and the intensity and scale of land use has gradually increased. As a result, such changes are causing various environmental problems, and damaging and destroying forests and other natural green spaces [28,29]. It has been reported that, because the population is concentrated, and residential areas, buildings, and roads have expanded in urban areas, the amount of CO2 emitted from urban areas accounts for about 78–97% of the total amount of emissions on Earth [30,31,32]. The rapid expansion of urbanized areas is a major cause of the rapid increase in CO2 concentration in those areas. At the same time, the urban heat island and warming effects due to enormous energy consumption are causing great changes in the carbon balance of the urban ecosystem. Therefore, research that continuously monitors and evaluates CO2 absorption and emissions for each landscape element of a complex city has emerged [33,34].
Components of the carbon cycle have a complex organization that circulates through several steps [3]. Therefore, in order to clarify the carbon budget quantitatively, it is necessary to analyze the dynamics of carbon cycle components occurring between the atmosphere, vegetation, and soil over time [11,12]. In particular, the quantitative evaluation of net ecosystem production (NEP), calculated by combining the results of CO2 absorption from the atmosphere and emissions from the soil in a terrestrial ecosystem, represent the functional characteristics of a region and its carbon budget, and is a very important indicator of whether the region is a carbon sink or source [4,35]. To date, however, studies on the quantification of carbon budgets in terrestrial ecosystems in Korea have been conducted in the form of measuring either net primary production (NPP) or soil respiration, rather than NEP as a combined indicator in forests, cultivated lands, or urban areas. Therefore, research related to net ecosystem production, which represents a comprehensive evaluation of an ecosystem, is highly insufficient [36,37,38].
This study aimed to evaluate the carbon budget of the local government in South Korea. Furthermore, this study aimed to recommend a sustainable land use plan as a strategy to arrive at carbon neutrality. In order to achieve these goals, we first quantified the NEP of major vegetation types by measuring the amount of CO2 emitted into the atmosphere through soil respiration and fixed in vegetation as NPP, based on the carbon circulation system of the terrestrial ecosystem. Second, we calculated the amount of CO2 emitted from each local government’s energy use. Third, we quantified and compared the carbon budget of each local government by calculating the difference between the amount of carbon absorption by forests and the amount of CO2 emission from each local government’s energy use. Finally, we prepared an efficient land use plan as a climate change adaptation strategy to delay the progression of climate change.

2. Materials and Methods
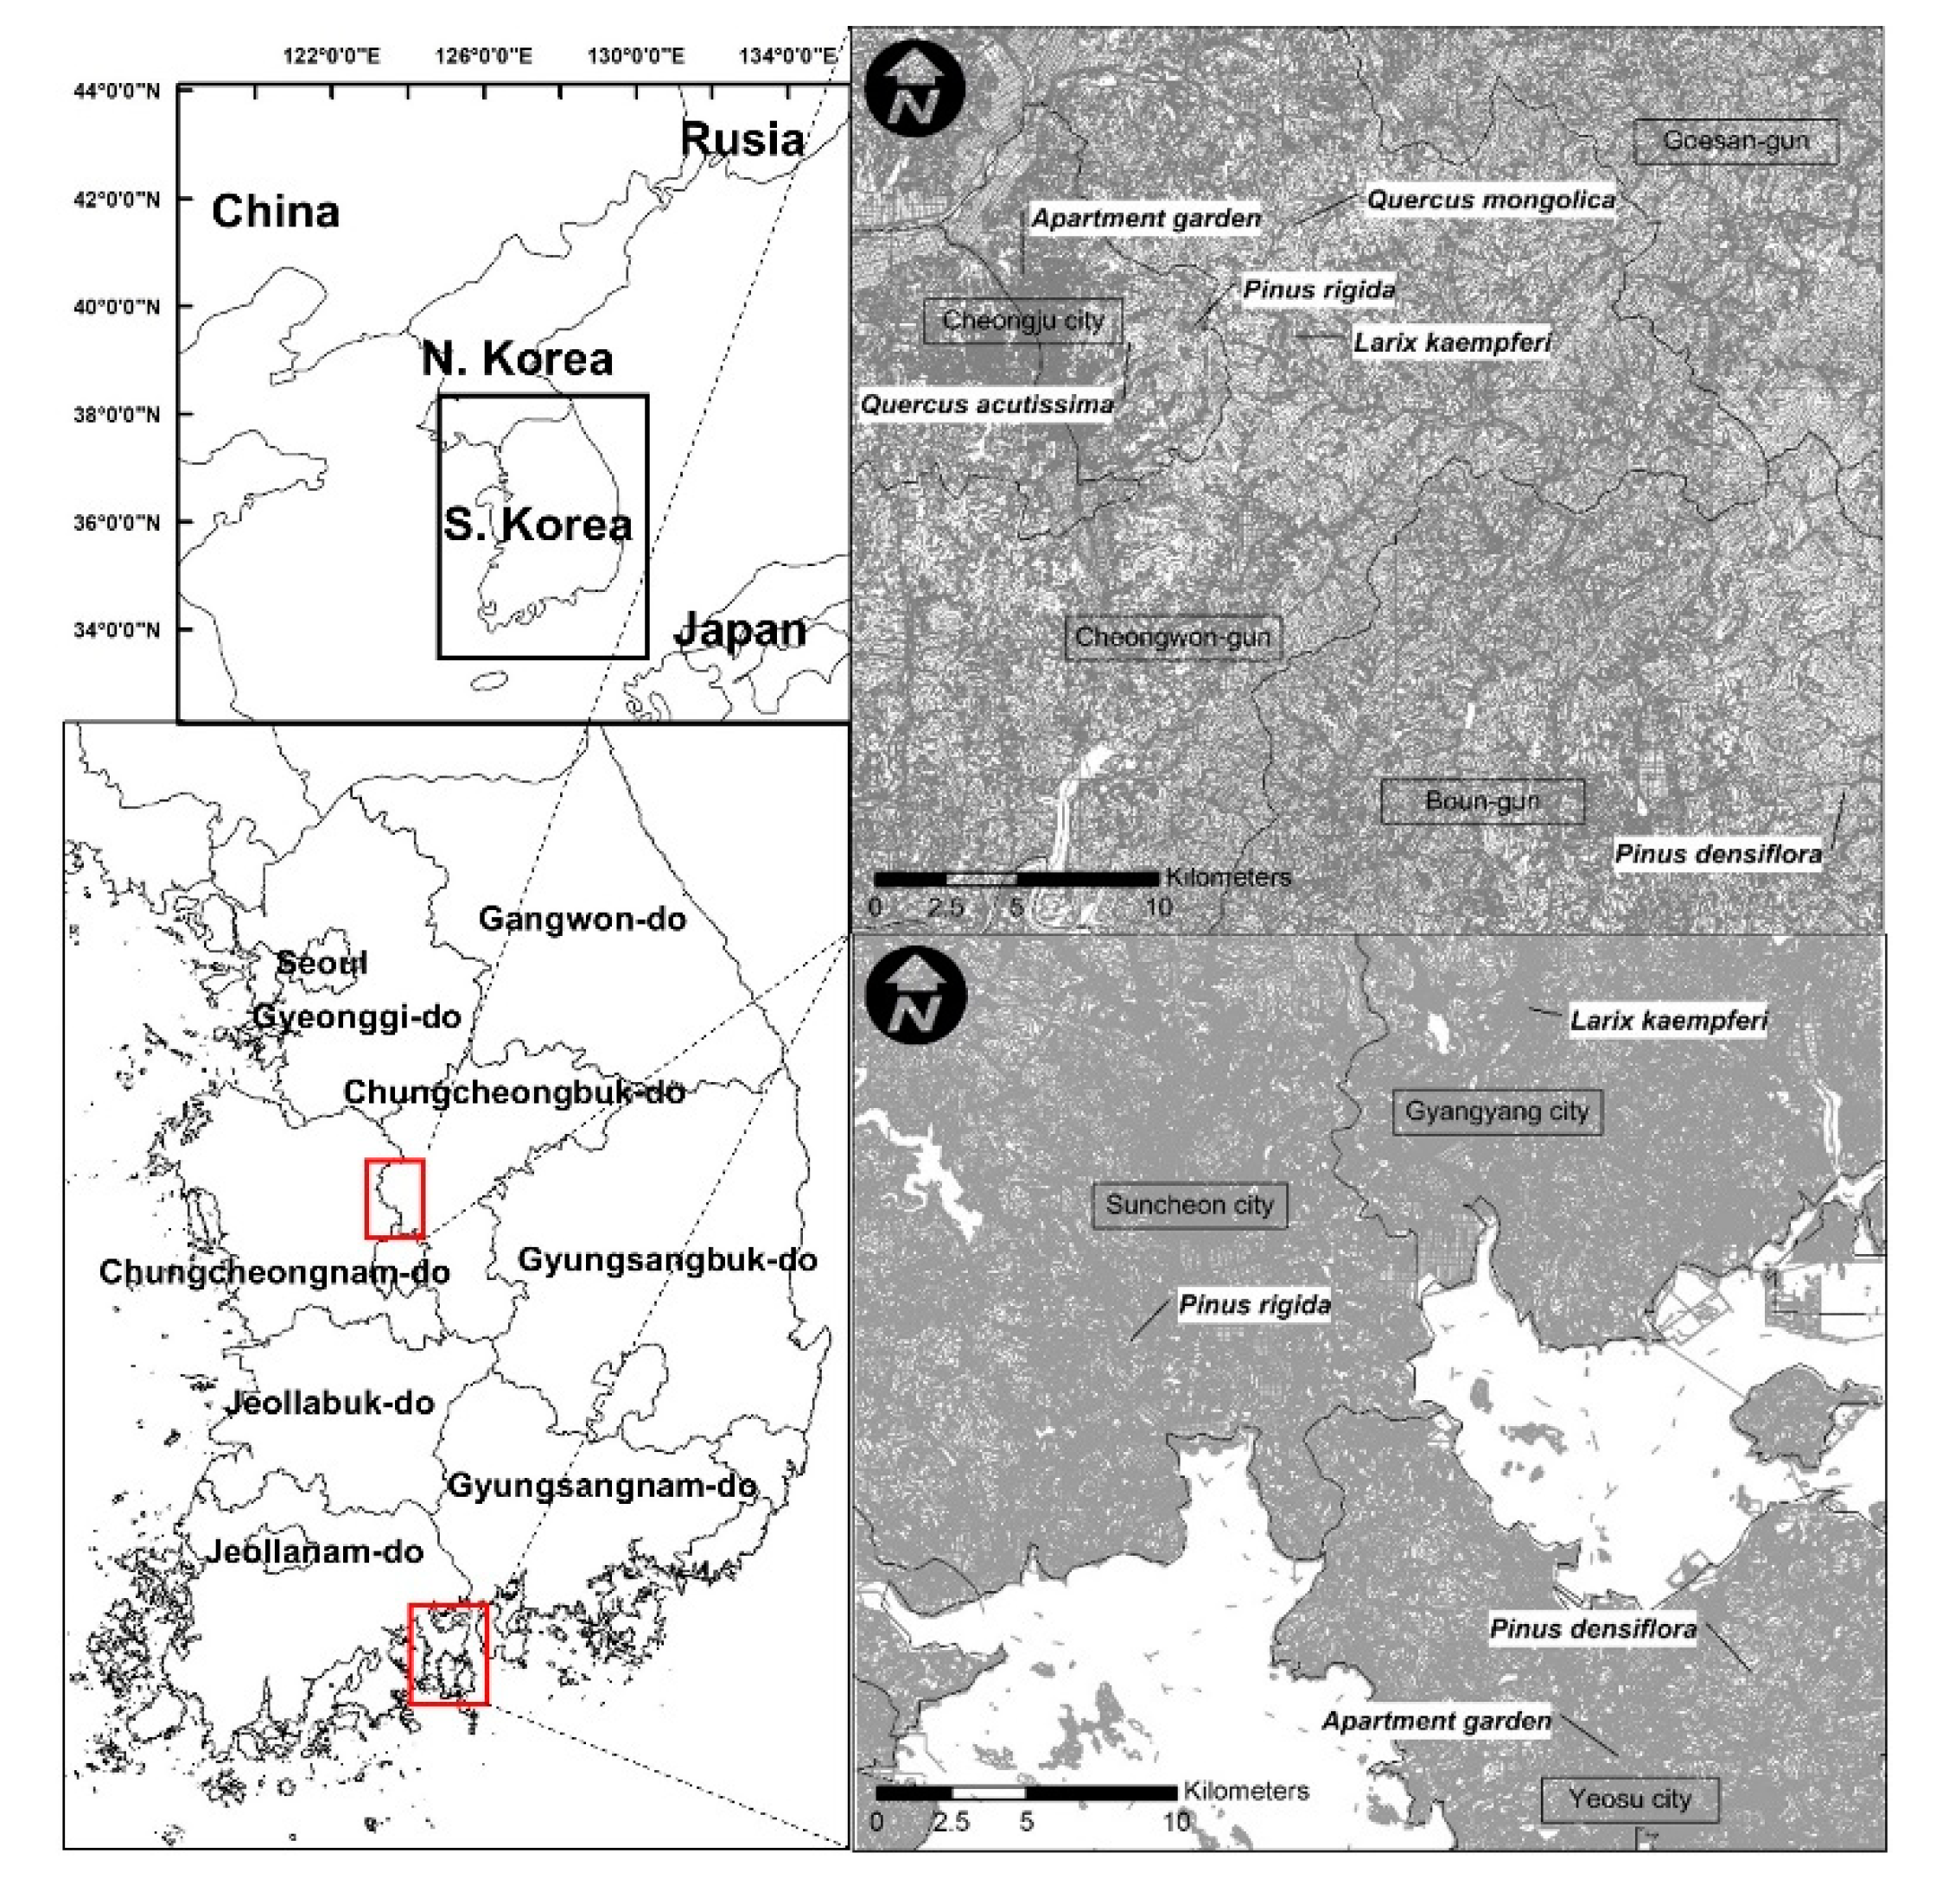
2.1. Study Sites

The study sites to measure NEP of major vegetation types are located in Cheongju city of Chungcheongbuk-province, central Korea, and in Yeosu city of Jeollanam-province, southern Korea. In Cheongju, a natural forest (Pinus densiflora, Quercus acutissima, and Q. mongolica stands), plantation (P. rigida and Larix kaempferi stands), and apartment garden were selected. In Yeosu, a natural forest (P. densiflora and Q. acutissima stand), plantation (P. rigida stand), and apartment garden were selected (Figure 1).
Cheongju is located on the central part of the Korean Peninsula and ranges from 36°24′ to 46′ N in latitude and from 127°15′ to 49′ E in longitude. The annual mean temperature, precipitation, and relative humidity are 13.0 °C, 1019.8 mm, and 61%, respectively [39].
Yeosu is located on the southern part of the Korean Peninsula and ranges from 34°43′ to 51′ N in latitude and from 127°33′ to 45′ E in longitude. The annual mean temperature, precipitation, and relative humidity are 14.6 °C, 1247.7 mm, and 63%, respectively [40].

2.2. Methods

2.2.1. Measurement of Net Primary Production

Net primary production was measured by applying an allometric method [40,41,42]. After installing a permanent quadrat of 400 m2 (20 m × 20 m) in the stands selected for survey in each study area, the diameter of breast height (DBH) and height of each tree located in the permanent quadrat were measured in September 2010 and September 2011. Diameter was measured using a measuring tape 1.3 m high from ground level for woody plants having a DBH of more than 2.0 cm. Height was measured using an ultrasonic distance meter (Vertex Laser VL400, Haglöf of Sweden). The biomasses in 2010 (W1) and 2011 (W2) were calculated by putting these measurements into the allometric equation of each tree. NPP was calculated from the biomass increase in 2011 compared with that in 2010 (ΔW = W2 − W1). The amount of carbon was estimated by applying the carbon fraction of IPCC [13] and the value was again converted into the amount of carbon dioxide (CO2) [43].

2.2.2. Measurement of Soil Respiration

Soil respiration was measured by applying the closed dynamic chamber method with an infrared gas analyzer (IRGA) [44]. Soil respiration was measured using an infrared gas analyzer (IRGA, EGM-4, PP Systems, UK) with a chamber for measurement of soil respiration once a month from August 2010 to July 2011. In order to measure soil respiration, six cylindrical collars with a diameter of 10 cm and a height of 8 cm were installed at each survey site. The amount of soil respiration was calculated from the rate of increase in CO2 concentration over time, by measuring the CO2 concentration of the air in the closed collar and cap every two seconds for two minutes, while the cap with the CO2 concentration sensor was mounted on the collar. The method of calculating soil respiration from the increasing rate of CO2 concentration emitted from soil surfaces is shown in Equation (1):
Soil respiration (mg CO2 m−2 h−1) = aρVS−1
where: a: increasing rate of CO2 concentration; ρ: CO2 density (mg m−3); V: volume of chamber (m3); S: surface area of soil covered with collar (m2).
During the measurement of soil respiration, the air temperature (°C) at 1.5 m above the ground surface and the soil temperature (°C) at 5 cm soil depth were continuously measured and recorded at 1 min intervals for one year from August 2010 to July 2011 using a temperature logger with a soil probe (HOBO Pro Air/Soil Temp., Bourne, MA, USA) at each study site.
The daily mean values of soil respiration and temperature (air and soil) were calculated by averaging all the measured data in each study site. The annual soil respiration rates were estimated by the regression equations derived from the relationships between daily mean soil respiration rates and temperatures. For regression analysis, the dependence of soil respiration rate on temperature was fitted to the following exponential functions to the data:
Annual soil respiration rate = α·e(β·T)
where: T: the temperature (°C); α and β: constants of the modeled exponential equation between the soil respiration and temperature.
The amount of soil respiration of the heterotrophic organisms was calculated by applying the respiratory coefficient, 0.55, which is usually cited for forest soil [45,46].

2.2.3. Calculation of the Amount of Carbon Absorption by Local Government

NEP was obtained from the difference between CO2 absorption (NPP) by vegetation and CO2 emission by the respiration of soil microorganisms. Vegetation types were classified by analyzing LandSat images by applying the GIS program (ERDAS IMAGINE 8.6, ArcGIS 9.3). Vegetation types were classified into coniferous forest, broad-leaved forest, rice fields, and upper fields.
Carbon dioxide absorption was obtained from the NEP of Pinus densiflora, Pinus rigida, Larix kaempferi, Quercus mongolica, and Quercus acutissima communities. Among these plant communities, P. densiflora, P. rigida, and Larix kaempferi communities were classified into coniferous forests, and Q. mongolica and Q. acutissima communities into broad-leaved forests. The average NEPs of plant communities comprising coniferous forest and broad-leaved forest were regarded as NEPs of coniferous forest and broad-leaved forest. The amount of carbon dioxide absorption in paddy and upper fields was obtained from data from the Rural Development Administration [47]. The carbon dioxide absorption amount of each local government was calculated by multiplying the area of the vegetation type by NEP.

2.2.4. Calculation of the Amount of Carbon Emissions by Local Government

The quantity of carbon dioxide emissions was calculated from the energy consumption of each local government [48].

2.2.5. Evaluation of the Carbon Budget of Local Government

The carbon budget of each local government was obtained from the difference between the amount of carbon absorption by vegetation types and the amount of CO2 emissions from each local government’s energy use.

3. Results

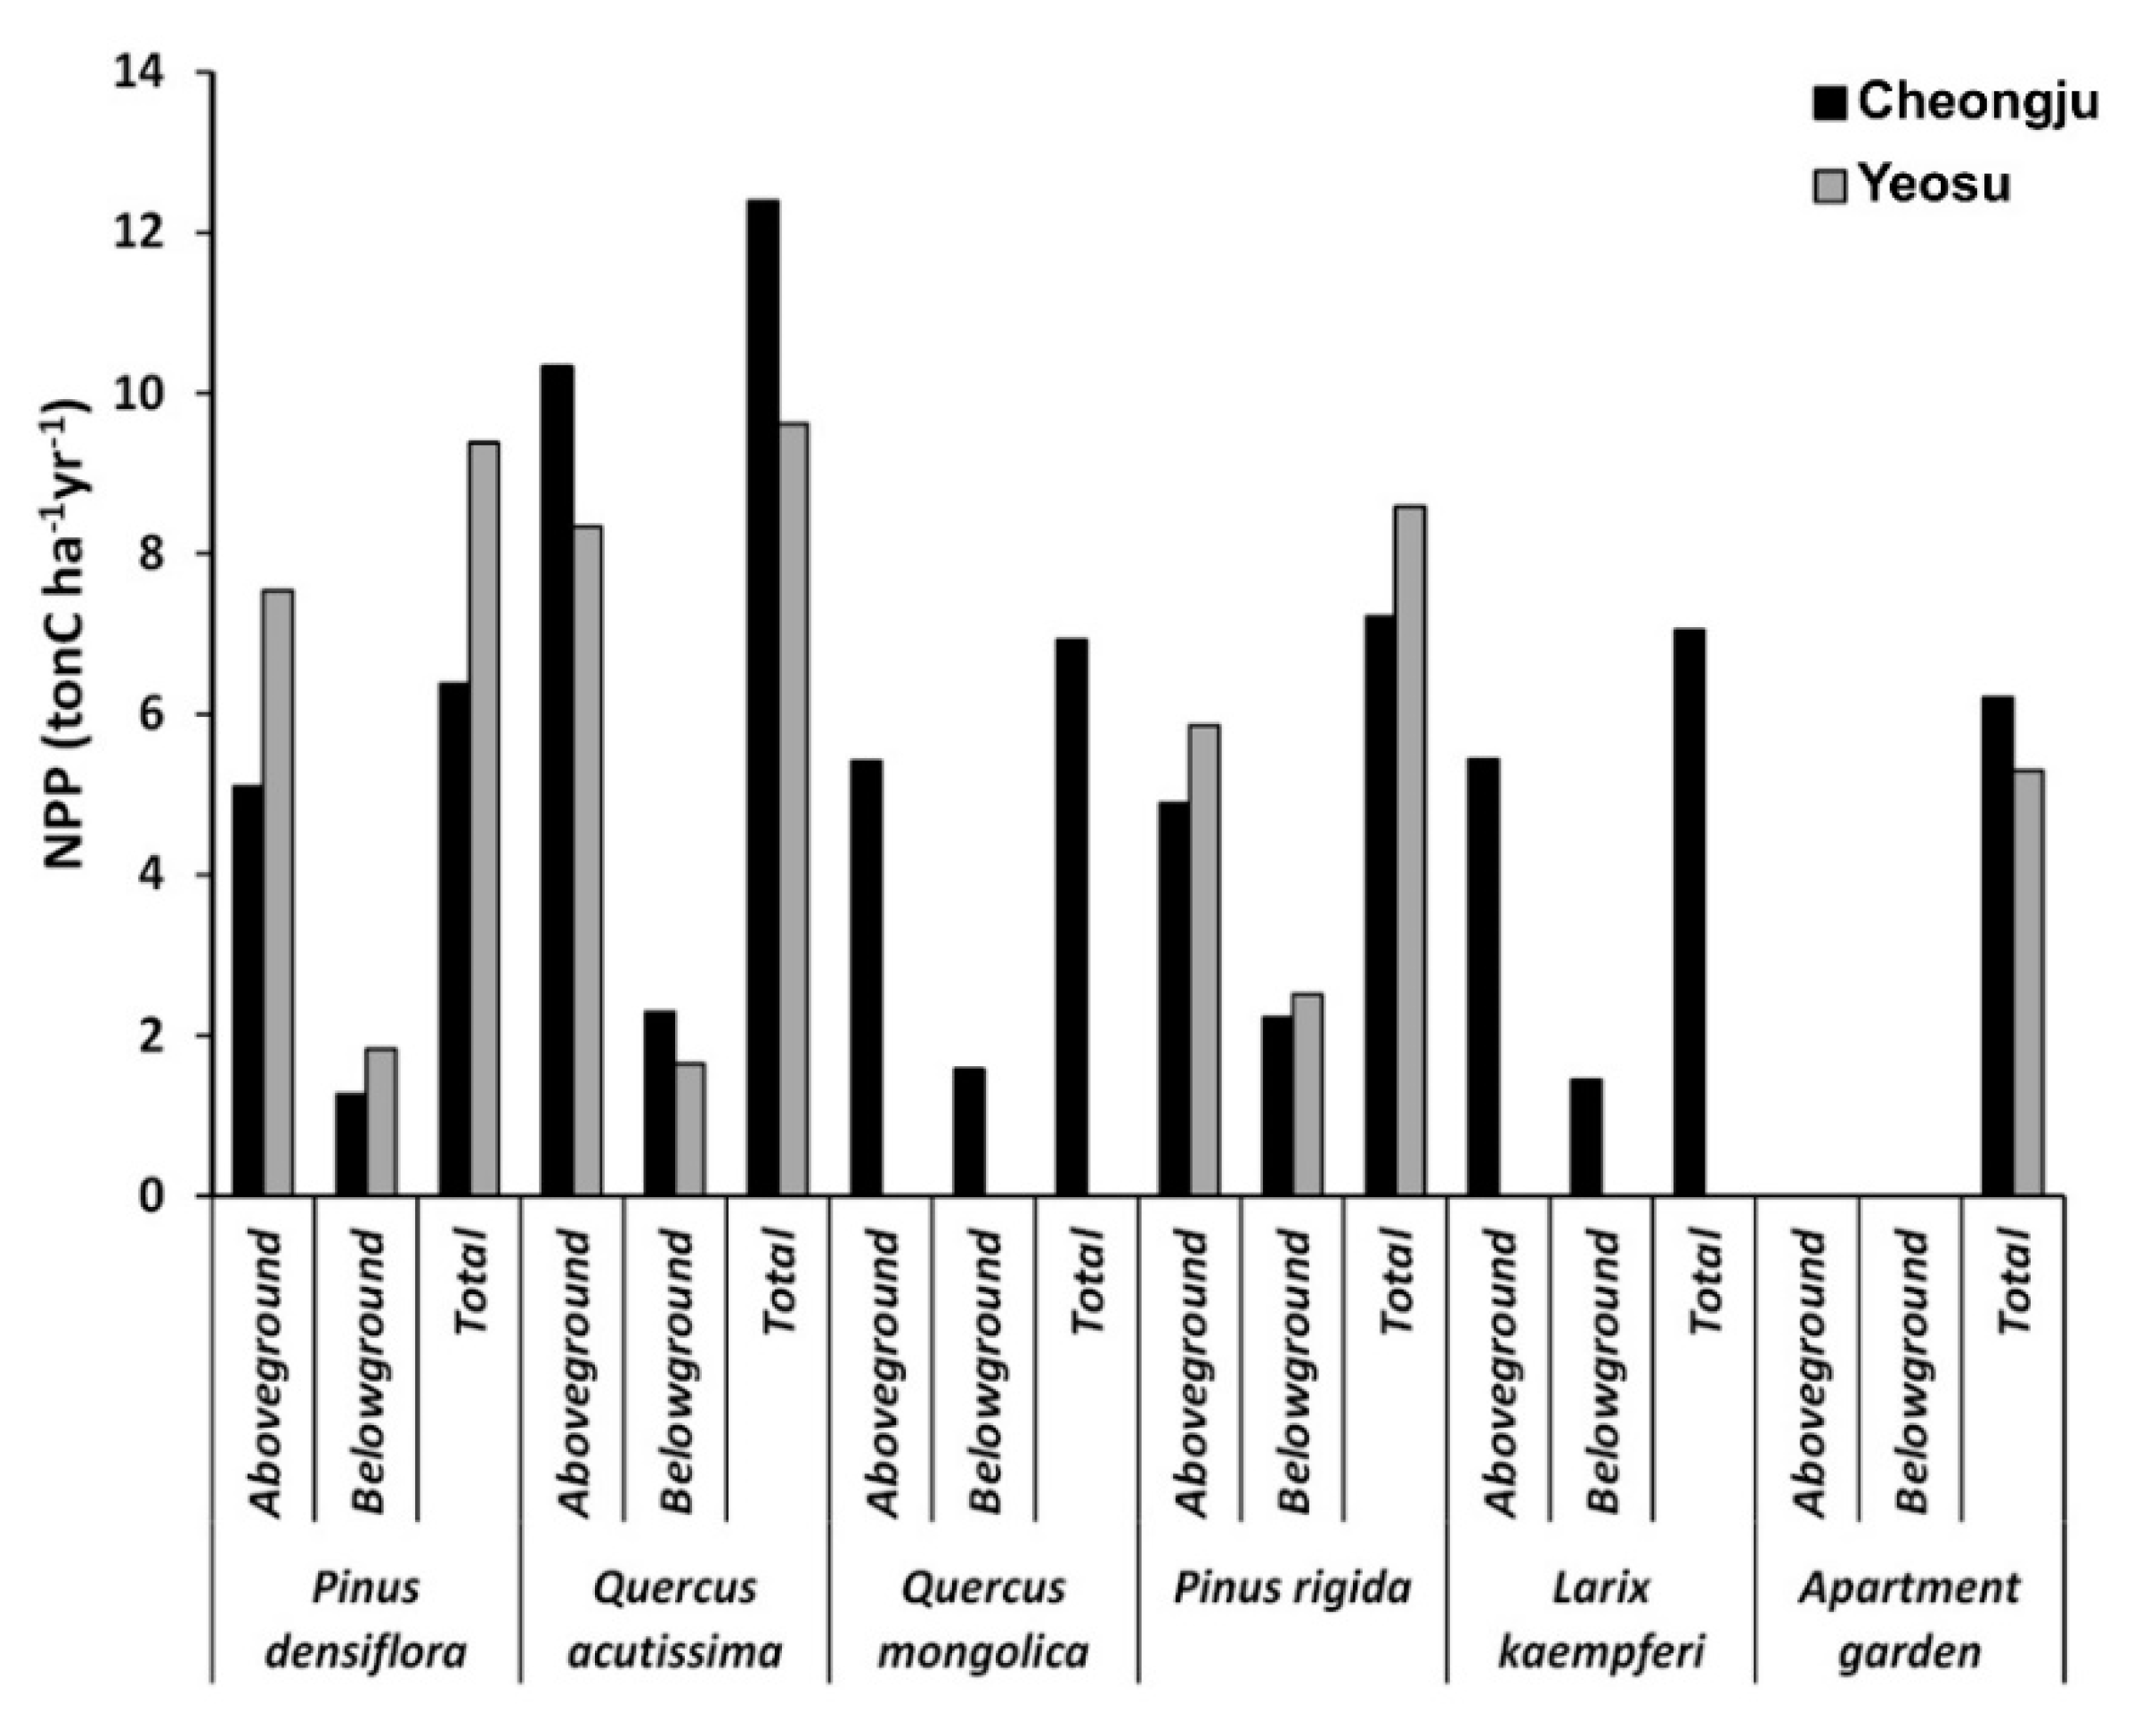
3.1. Net Primary Production (NPP)

The NPPs of P. densiflora, P. rigida, Q. acutissima, Q. mongolica, and Larix kaempferi stands, and apartment gardens in Cheongju are shown in Figure 2. The values were between 6.4 and 12.4 tonC ha−1 yr−1.
NPPs of P. densiflora, P. rigida, Q. acutissima, and apartment gardens in Yeosu are shown in Figure 2. The values were between 5.3 and 9.4 tonC ha−1 yr−1.

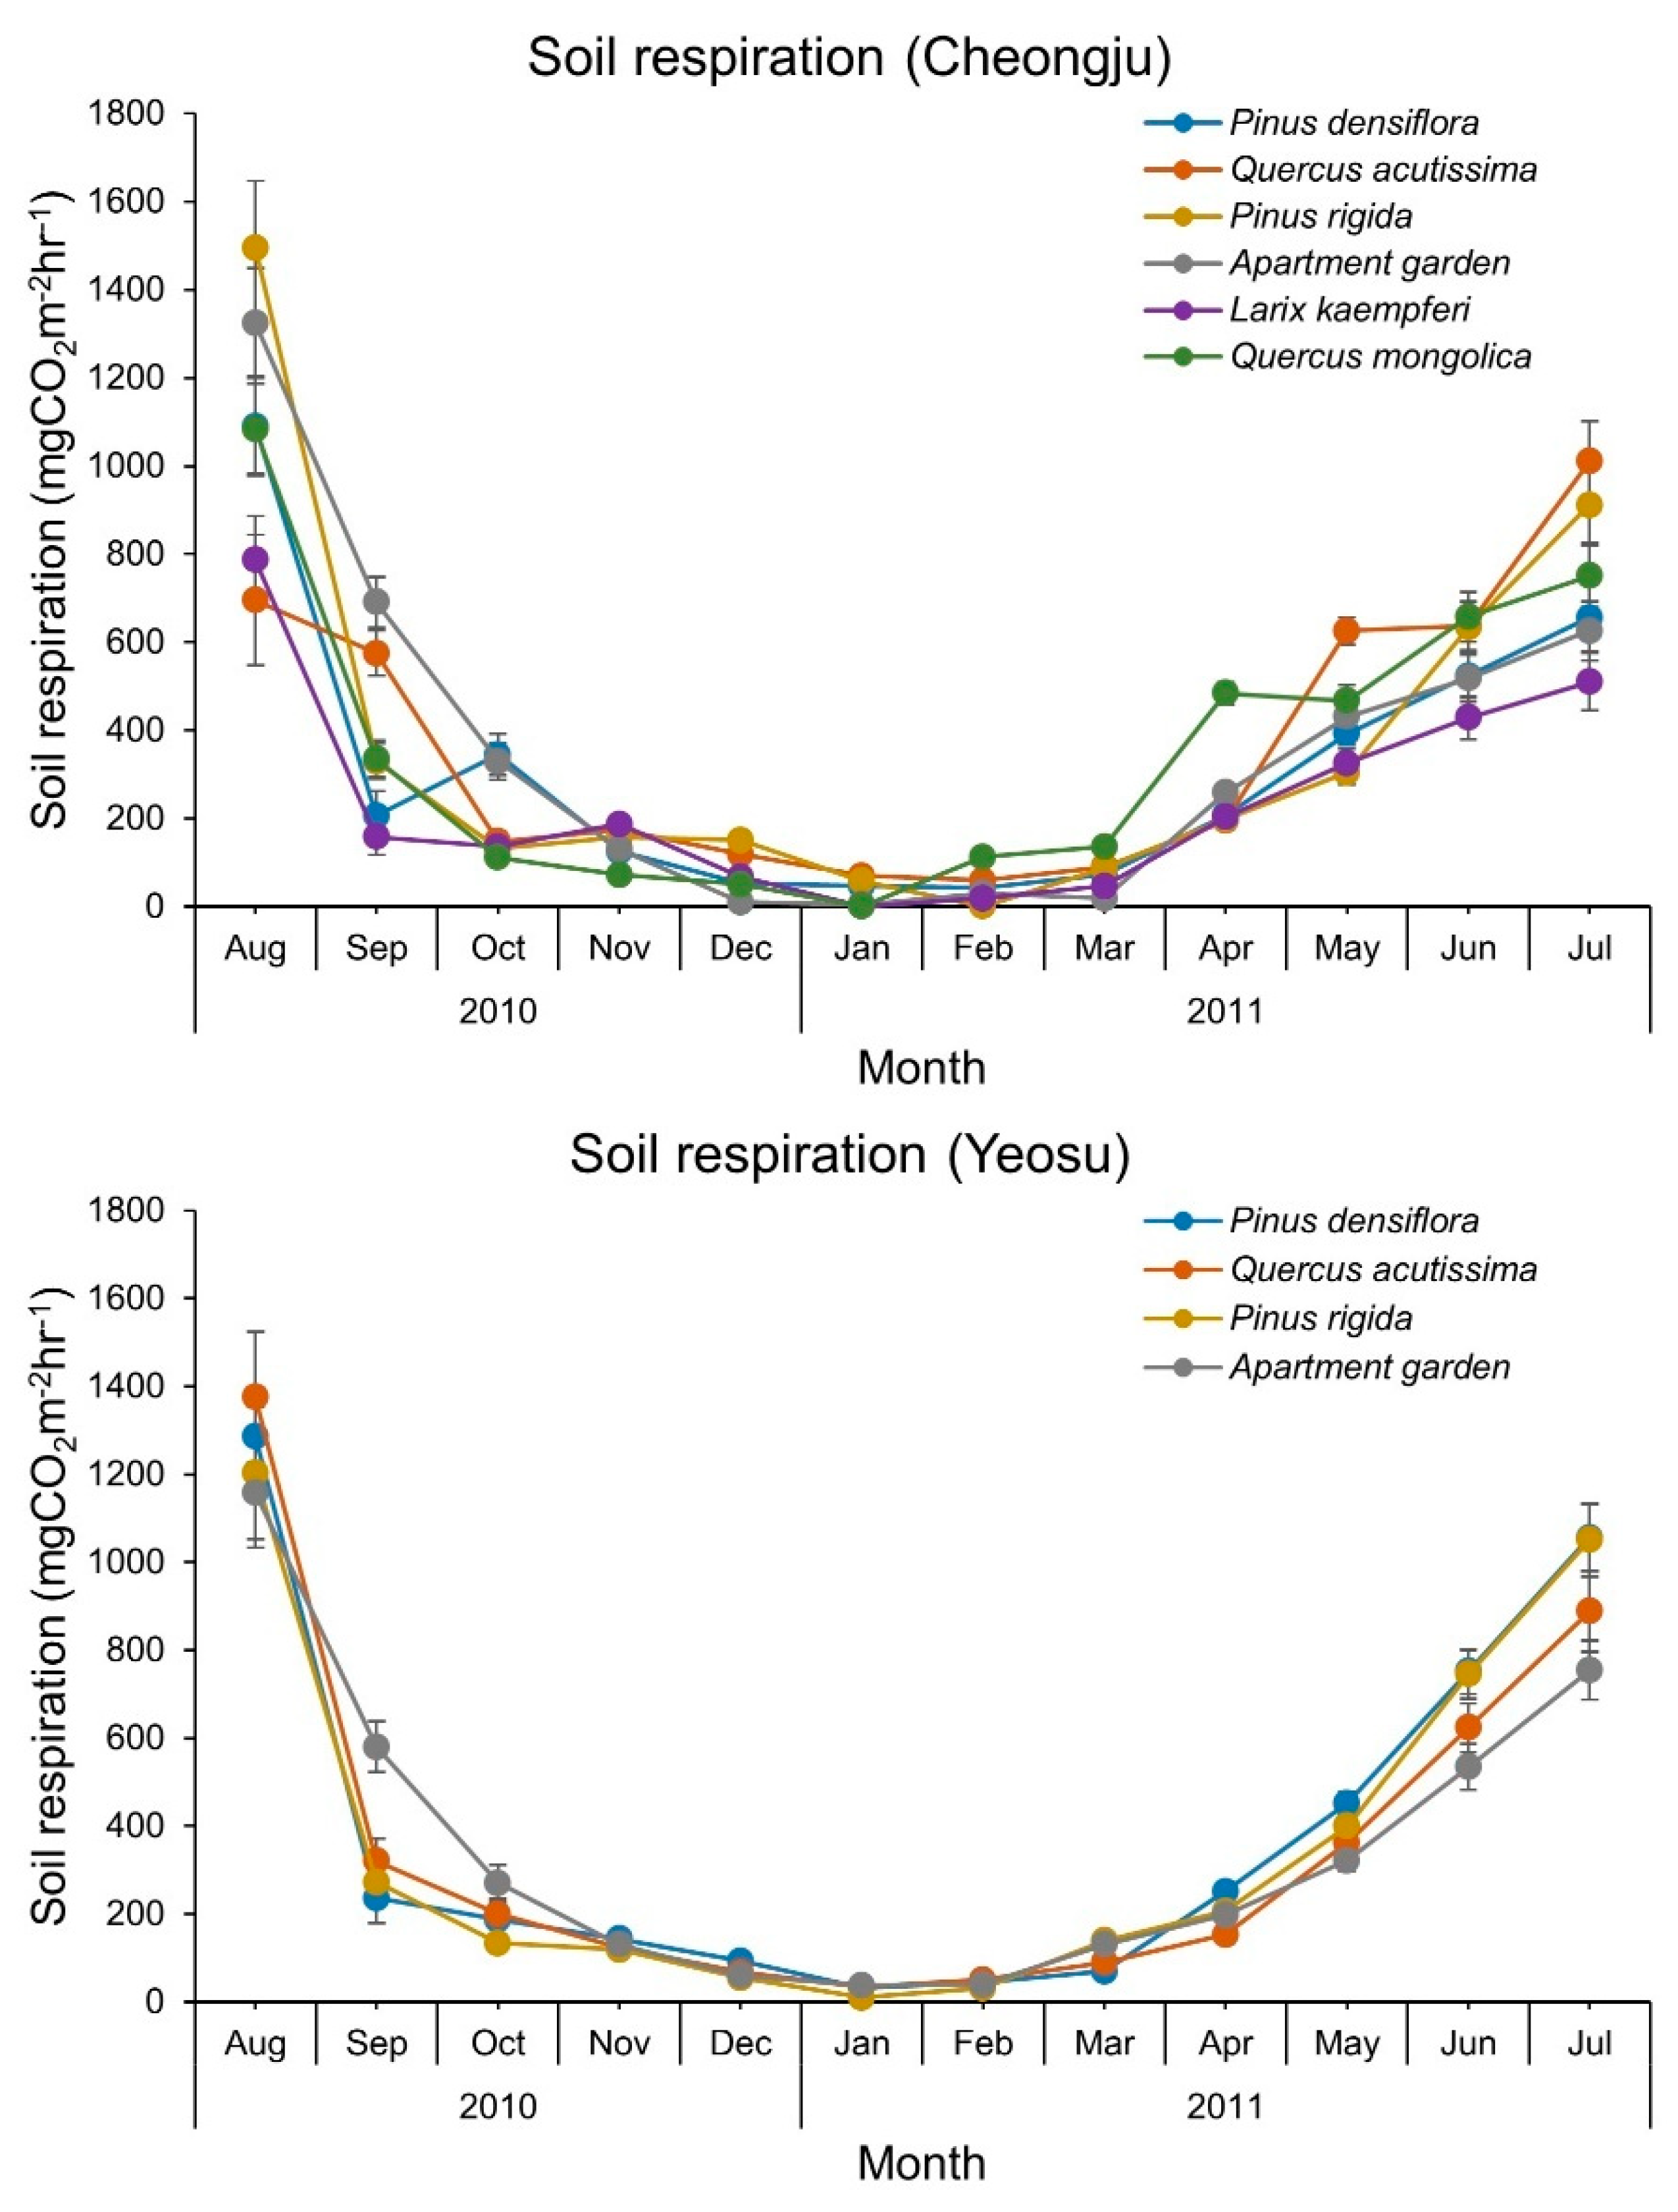
3.2. Seasonal Changes in Soil Respiration and the Amount of Annual Soil Respiration

The soil respiration rate showed the typical seasonal change pattern. The soil respiration rate showed the highest value in August and the rate began to subsequently decrease gradually, thus, maintaining a minimum value between December and March of the following year. Soil respiration rates of P. densiflora, P. rigida, Q. acutissima, Q. mongolica, L. kaempferi stands, and apartment gardens in Cheongju were shown to be 46.3–1090 mgCO2 m−2 h−1, 0–1495 mgCO2 m−2 h−1, 59.2–694.8 mgCO2 m−2 h−1, 0–1084 mgCO2 m−2 h−1, 0–787 mgCO2 m−2 h−1, and 5–1324 mgCO2 m−2 h−1, respectively (Figure 3).
The soil respiration rates of P. densiflora, P. rigida, Q. acutissima, and apartment gardens in Yeosu were shown to be 32.5–1285 mgCO2 m−2 h−1, 9.5–1050 mgCO2 m−2 h−1, 34.2–1375 mgCO2 m−2 h−1, and 37–1158 mgCO2 m−2 h−1, respectively (Figure 3).
The amount of annual soil respiration of P. densiflora, P. rigida, Q. acutissima, Q. mongolica, L. kaempferi stands, and apartment gardens in Cheongju was shown to be 5.6, 12.6, 8.3, 8.3, 5.8, and 8.7 tonC ha−1 yr−1, respectively (Table 1).
The amount of annual soil respiration of P. densiflora, P. rigida, Q. acutissima, and apartment gardens in Yeosu was shown to be 6.4, 3.8, 7.1, and 6.4 tonC ha−1 yr−1, respectively (Table 1).

3.3. Net Ecosystem Production (NEP)

The NEPs of P. densiflora, Q. mongolica, Q. acutissima, P. rigida, L. kaempferi, and apartment gardens in Cheongju were shown to be 2.3, 2.2, 7.6, 2.3, 4.0, and 1.4 tonC ha−1 yr−1, respectively (Table 1). NEPs of P. densiflora, Q. acutissima, P. rigida, and apartment gardens in Yeosu were shown to be 2.7, 4.0, 5.2, and 1.8 tonC ha−1 yr−1, respectively (Table 1).

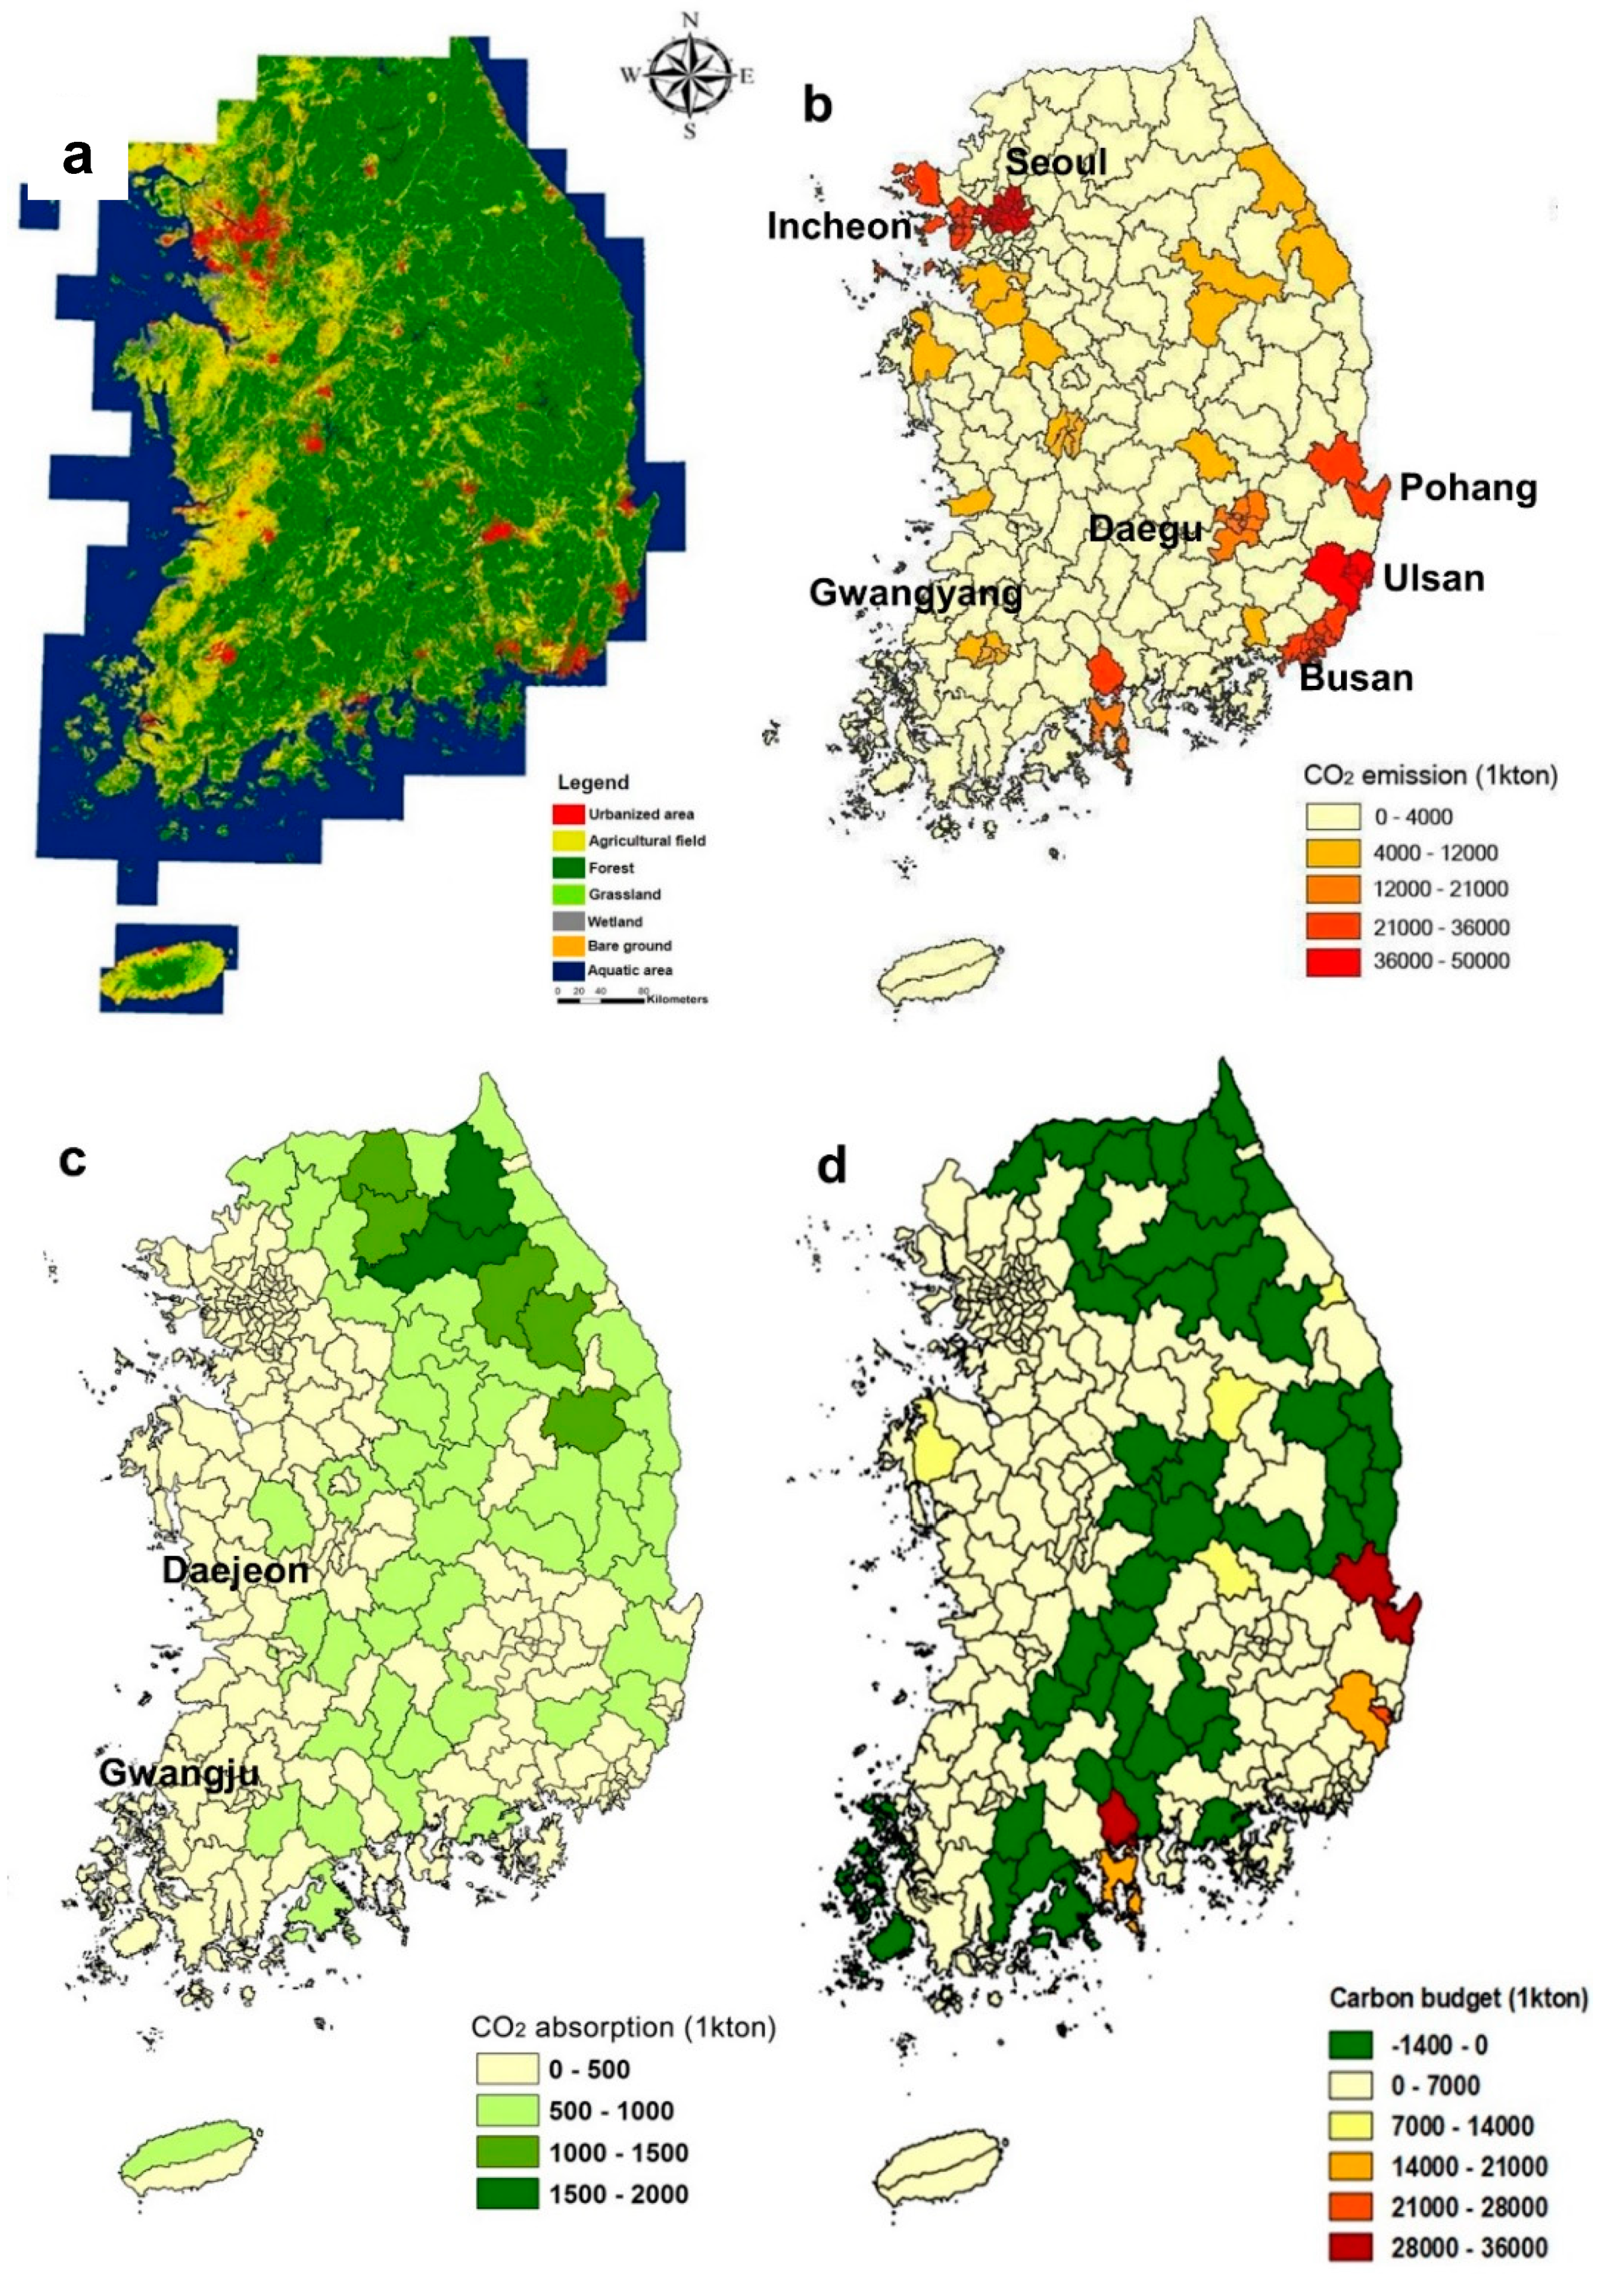
3.4. Carbon Emission by Local Government

The total CO2 emissions combined with carbon emissions from households, commercial facilities, industrial facilities, transport, and waste by local government are shown in Figure 4a. The CO2 emissions were higher in Ulsan, Gwangyang, and Pohang, where heavy and chemical industrial complexes such as the steel industry and the petrochemical industry are located, and in big cities such as Seoul, Busan, Incheon, and Daegu (Figure 4b).

3.5. Carbon Absorption by Local Government

As a result of averaging the NEP measured in Cheongju and Yeosu by dividing coniferous forests (P. densiflora, P. rigida, and L. kaempferi) and broad-leaved forests (Q. mongolica and Q. acutissima), NEPs of coniferous forests and broad-leaved forests were shown to be 3.1 and 5.0 tons tonC ha−1 yr−1, respectively.
The amount of CO2 absorption by local government was calculated by multiplying these NEPs with the area of the forests that the local government maintains (Figure 4c). The amount of carbon absorption was higher in local governments in Gangwon-do, where the forest ratio was high, whereas there was little absorption in large cities such as Seoul, Busan, Incheon, Daegu, Daejeon, and Gwangju.

3.6. Carbon Bdget

The carbon budget for each local government obtained from the difference between carbon emission and carbon absorption is shown in Figure 4d. In Figure 4d, the numbers mean the amount of carbon dioxide (KT), a negative (−) value means that the absorption exceeds the emission, and a positive value indicates the opposite case.
The total CO2 emission is 573.6 MT, and the total absorption is 70.3 MT. Although the total absorption is only 12.3% of the emission, in some local governments the absorption exceeds the emission. In Gangwon-do, Gyeongsangbuk-do, Jeollanam-do, Gyeongsangnam-do, Jeollabuk-do, Chungcheongbuk-do, and Gyeonggi-do, the carbon absorption levels of 10, 8, 7, 5, 3, and 3 local governments exceeded their carbon emission (Figure 4d).

3.7. Relationship between the Carbon Budget and the Environmental Factor

The correlation between the absorption, emission, and budget of CO2, and population size, population density, areal size of coniferous forest, and areal size of broad-leaved forest by local government, is shown in Table 2. There was a significant positive correlation between carbon emissions and population size, between carbon absorption and areal sizes of coniferous forests and broad-leaved forests, and between carbon budget and population size. In contrast, the amount of carbon absorption showed a significant negative correlation with the population size and population density.

4. Discussion

4.1. Carbon Dynamics

The NPPs of P. densiflora forests measured at the long-term ecological research sites in Korea ranged from 2.55 to 6.30 tonC ha−1 yr−1 [49]. The NPPs of broad-leaved forests measured at several sites, including the long-term ecological research sites in Korea, ranged from 1.5 to 9 tonC ha−1 yr−1 [49,50,51,52].
On the other hand, the NPP was estimated to be 7.83 tonC ha−1 yr−1 for humid temperate evergreen, 7.38 tonC ha−1 yr−1 for humid temperate deciduous, 3.54 tonC ha−1 yr−1 for temperate semi-arid evergreen, and 8.01 tonC ha−1 yr−1 for Mediterranean warm evergreen forests [53]. In addition, Meiillo et al. [54] estimated the NPPs for temperate coniferous, mixed, and deciduous and broad-leaved evergreen forests as 4.65, 6.69, and 7.41 tonC ha−1 yr−1, respectively.
The NPPs obtained through this study are in the range of those measurements estimated in Korea and foreign countries (Figure 2).
Estimates of the amount of autotrophic and heterotrophic respiration in the temperate forests range between 4.98 and 9.51 tonC ha−1 yr−1 and between 2.8 and 9.7 tonC ha−1 yr−1, respectively [53]. The estimates for autotrophic and heterotrophic respiration obtained from this study are in a similar range to those measurements (Table 1). Even when compared based on the soil respiration rate, the estimates for soil respiration obtained from this study are in a similar range to the values measured by other studies in Korea [55,56].
The NEPs obtained from this study ranged from 2.2 tonC ha−1 yr−1 (Q. mongolica forest) to 7.6 tonC ha−1 yr−1 (Q. acutissima forest). Comparing NEPs between natural forests and afforestation, the NEPs of artificial plantations were higher than those of natural forests, except for the Q. acutissima forest (Table 1). The higher NEP in the Q. acutissima forest and artificial plantations was probably due to intensive forest management. The NEPs estimated for the temperate forests range from 1.33 to 3.98 tonC ha−1 yr−1 [53]; the NEPs obtained from this study are in a similar range of these, measurements except for those of the Q. acutissima forest (Table 1).

4.2. Carbon Budget and Environmental Sustainability

As of 2007, the total carbon dioxide emission in South Korea was 573.6 CO2 MT annually, the total absorption was 70.3 CO2 MT, and the net emission was 503.3 CO2 MT. The carbon emissions were the highest in Ulsan, Gwangyang, and Pohang, where heavy and chemical industrial complexes such as the steel industry and the petrochemical industry are located, and in big cities such as Seoul, Busan, Incheon, and Daegu (Figure 4).
By comparison, carbon absorption was higher in local governments in Gangwon-do, where forests are abundant, and was very low in large cities such as Seoul, Incheon, Daegu, Daejeon, and Gwangju (Figure 4).
The carbon budget showed a significant correlation with carbon emissions and population size. Carbon emissions showed a significant correlation with population size. Carbon absorption showed a significant correlation with the forest’s area, and a negative correlation with population size and density (Table 2).
Because humans are involved in its balance, the carbon budget is becoming imbalanced. The increase in land use due to population growth and the increase in fossil fuel use due to civilization have been evaluated as the main factors causing this imbalance [57]. Interest in this carbon cycle has grown because the increase in carbon dioxide in the atmosphere causes greenhouse effects, and thus climate change at a global level began to occur. To date, efforts to solve this climate change problem have usually focused on reducing carbon dioxide emissions. However, because the policy has recently shifted to carbon neutrality, and the desire to balance the carbon budget, interest in securing carbon absorption sources is increasing to solve the problem of the imbalance in carbon budgets. It can be said that this major idea shift began as MEA [57] evaluated the value of ecosystem services on a global scale. At a local level, the US climate change response strategy, which prepared a plan to reduce carbon dioxide concentration in the atmosphere through the restoration of abandoned farmland, could be cited [10]. IUCN also raised interest in this thinking by proposing nature-based solutions [58,59]. Furthermore, the UN [60] is emphasizing the importance of securing absorption sources as a means for solving environmental problems at the global level, including climate change, by declaring the UN Decade on Ecosystem Restoration.
As a result of evaluating the carbon budget by local governments in South Korea, the imbalance in the carbon budget showed a significant correlation with the population size, while being negatively correlated with the forest ratio (Table 2). Thus, there were significant differences in the population size, population density, forested land ratio, and non-forested land ratio between local governments with more carbon absorption than emission and local governments having the opposite case (Table 3).
The spatial distribution of the carbon budget by local governments showed a similar trend to the spatial distribution of the temperature rise coefficient across the national territory [61]. The spring phenology of plants showed an advancing trend in proportion to the changes in microclimate caused by land use intensity; the abnormal phenology of the plants also showed a similar trend to the spatial distribution of the carbon budget by local governments [12,61,62,63].
Considering these results, it was observed that the carbon budget by local area may be a tool for diagnosing the environmental sustainability of the area. Furthermore, it was considered that sustainable land use may be a means of achieving carbon neutrality and the ultimate means for solving climate change problems.
It has been estimated that land use intensity has already exceeded the sustainability of the environment at a global level [64]. In this regard, the importance of ecological restoration is emerging to ensure the sustainability of the environment at a global level [59]. The nature-based solutions of the IUCN and UN Decade on Ecosystem Restoration reflect such a perception. It is well known that the landscape created through ecological restoration contributes to environmental stability, in addition to environmental improvement, by exerting multiple ecosystem service functions such as climate mitigation, pollutant absorption, biodiversity support, and aesthetic stability [59,65].

4.3. Strategies to Achieve Carbon Neutrality

Meeting the goal of the Paris climate accord to limit global warming to 2 °C requires adopting multiple strategies for rapidly reducing and mitigating carbon emissions. These strategies include an array of negative emission technologies that result in the net removal of greenhouse gases from the atmosphere, including the capture and storage of carbon in vegetation and soil through reforestation, afforestation, and changes in agricultural practices [66,67]. Restoration of degraded landscapes will also contribute to improving ecological integrity, which will provide many additional benefits to biodiversity and human well-being [68,69,70,71,72,73]. As a result, 56 countries have pledged to restore 168.4 million ha of deforested and degraded land through the Bonn Challenge, which will sequester an estimated 15.7 Gt CO2 and generate USD 48.4 billion in economic activity [74].
The Republic of Korea uses a large quantity of energy and consequently emits a significant amount of carbon because it is an industrial country with high population density. Therefore, the central government announced its green growth strategy a long time ago and declared a carbon-neutral policy with the aim of achieving it by 2050, in line with the recent international trend. Such policies include securing renewable energy resources, improving energy use efficiency, and securing carbon absorption sources [75].
However, it is difficult to secure the entire amount of energy required by industrial facilities in a limited national area. In terms of improving energy use efficiency, dispersion energy that functions as a carbon emission source is bound to be generated according to the thermodynamic law. In this respect, the development of a new absorption source is inevitably required. Moreover, in addition to the climate change problem, Korea has many outside pollution sources represented by particulate matter. Securing absorption sources is also absolutely necessary to solve these problems.
Conserving and improving existing absorption sources and developing new absorption sources may be considered when securing an absorption source. Among the existing absorption sources, natural forests should mainly be managed for conservation to preserve biodiversity according to the customs of the international society. However, among the existing absorption sources in Korea, there are many artificial plantations created to restore forests destroyed due to excessive use and damage, which occurred during the Japanese occupation period and the Korean War. Although the age of these artificial plantations is just 50 to 60 years, most of them are made up of early successional species, and the growth has slowed significantly during these periods.
The Korean government is now pushing for a plan to increase carbon absorption by cutting down artificial plantations and converting them to young forests. However, this approach has several problems [76]. First of all, succession of these forests is in progress toward a dynamic natural forest [77]. Moreover, if they are cut down, at least for the time being, the surface temperature will rise and the increased temperature will facilitate decomposition of organic matter accumulated in the soil. Therefore, even if the amount of carbon absorption is increased through young forests, the amount will be offset by carbon emitted through decomposition of soil organic matter [12].
Improvements can be made in the forests created through landscaping, such as apartment gardens. In Korea, the area of developed land, including residential areas, amounts to 6788.2 km2. These developed lands must maintain legal land equivalent to 15% of their area, with 1018.2 km2 as greenery space [12,78]. Additionally, forests of such developed lands are maintained as low-quality forests similarly to apartment gardens. These developed lands are usually located on flat or mountainous lowlands. In the spatial distribution of vegetation, a sort of village forest, which is established in areas where human interference and natural resiliency are harmonized, is established around these residential areas, and the Q. acutissima forest dominates there. As revealed in this study, the NEPs of Q. acutissima forests are much higher than those of apartment garden forests (Table 1). Therefore, converting these apartment garden forests into Q. acutissima forests could greatly improve the carbon absorption capacity.
Securing new absorption sources could be achieved in riparian zones. Riparian forests, located along water channels, may be of particular importance to these efforts. Reference rates of carbon stock accumulation have been compiled for many forest types (e.g., IPCC [33]), but these do not typically distinguish between riparian and upland forests. Despite their relatively small spatial footprint, riparian forests usually have more favorable growing conditions (e.g., soil moisture), and they may accumulate carbon stocks at a greater rate than upland forests [79,80,81], contributing more to rapid carbon sequestration in the short term. Further, riparian ecosystems are widely recognized as providing numerous ecosystem services [79,82,83], having the potential to mitigate the effects of climate change [84], and being biodiversity hotspots that provide critical habitats for fish and wildlife [79,85]. Riparian ecosystems have been severely degraded worldwide [86,87]. This is particularly so in Asian countries, including Korea, where people depend upon rice as a staple food; the floodplains of most rivers have been transformed into rice fields [61]. Therefore, restoration of riparian forests may be a valuable strategy for providing both rapid carbon sequestration value and long-term ecosystem service returns [72,88,89].

5. Conclusions

As shown in the results of this study, the carbon budget is dominated not only by excessive use of fossil fuels but also by land use. In this regard, in order to realize carbon neutrality and further address the climate change problem, measures to secure carbon absorption sources are also as important as measures to reduce carbon emissions. Moreover, securing carbon absorption sources through ecological restoration is valuable because it contributes to securing the sustainability of the environment by exerting various ecosystem service functions in addition to carbon absorption. Carbon absorption sources can be enhanced by improving the quality of existing absorption sources, but they can also be found in places that have not been noticed so far, such as riparian forests. Furthermore, the efficient arrangement of the absorption source can contribute to enhancing the function it exerts. Climate change is not only a global issue, but it is also a profoundly local issue. When problems are solved at a regional or national level, problems at a global level can also be solved.

Author Contributions

Conceptualization, C.S.L. and G.S.K.; methodology, A.R.K., B.S.L. and J.S.; software, J.H.A. and C.H.L.; validation, J.H.A. and C.H.L.; formal analysis, G.S.K. and S.J.J.; investigation, G.S.K., S.J.J., A.R.K., B.S.L. and J.S.; resources, B.S.L.; data curation, G.S.K. and S.J.J.; writing—original draft preparation, G.S.K.; writing—review and editing, S.J.J. and C.S.L.; visualization, G.S.K. and B.S.L.; supervision, C.S.L.; project administration, C.S.L.; funding acquisition, C.S.L. All authors have read and agreed to the published version of the manuscript.

Funding

This research received no external funding.

Institutional Review Board Statement

Not applicable.

Informed Consent Statement

Not applicable.

Data Availability Statement

Not applicable.

Conflicts of Interest

The authors declare no conflict of interest.

References

  1. Cox, P.M.; Betts, R.A.; Jones, C.D.; Spall, S.A.; Totterdell, I.J. Acceleration of global warming due to carbon-cycle feedbacks in a coupled climate model. Nature 2000, 408, 184–187. [Google Scholar] [CrossRef]
  2. Prentice, I.C.; Farquhar, G.D.; Fasham, M.J.R.; Goulden, M.L.; Heimann, M.; Jaramillo, V.J.; Kheshgi, H.S.; Quéré, C.L.; Scholes, R.J.; Wallace, D.W.R.; et al. The carbon cycle and atmospheric carbon dioxide. In Climate Change 2001: The Scientific Basis, Intergovernmental Panel on Climate Change; IPCC: Geneva, Switzerland, 2001. [Google Scholar]
  3. Nakane, K. Quantitative evaluation of atmospheric CO2 sink into forest soils from the tropics to the boreal zone during the past three decades. Ecol. Res. 2001, 16, 671–685. [Google Scholar] [CrossRef]
  4. Joo, S.J.; Park, M.S.; Kim, G.S.; Lee, C.S. CO2 flux in a cool-temperate deciduous forest (Quercus mongolica) of Mt. Nam in Seoul, Korea. J. Ecol. Field Biol. 2011, 34, 95–106. [Google Scholar] [CrossRef] [Green Version]
  5. IPCC. Fourth Assessment Report of the Intergovernmental Panel on Climate Change, Climate Change 2007; Intergovernmental Panel on Climate Change: Cambridge, UK, 2007. [Google Scholar]
  6. Raich, J.W.; Schlesinger, W.H. The global carbon dioxide flux in soil respiration and its relationship to vegetation and climate. Tellus B 1992, 44, 81–99. [Google Scholar] [CrossRef] [Green Version]
  7. Bond-Lamberty, B.; Wang, C.; Gower, S.T. A global relationship between the heterotrophic and autotrophic components of soil respiration? Glob. Chang. Biol. 2004, 10, 1756–1766. [Google Scholar] [CrossRef]
  8. Schimel, D.S.; Wigley, T. The Carbon Cycle; Cambridge University Press: Cambridge, UK, 2000. [Google Scholar]
  9. Heimann, M.; Reichstein, M. Terrestrial ecosystem carbon dynamics and climate feedbacks. Nature 2008, 451, 289–292. [Google Scholar] [CrossRef] [PubMed]
  10. Hardy, J.T. Climate Change: Causes, Effects, and Solutions; John Wiley & Sons: West Sussex, UK, 2003. [Google Scholar]
  11. Joo, S.J.; Park, S.U.; Park, M.S.; Lee, C.S. Estimation of soil respiration using automated chamber systems in an oak (Quercus mongolica) forest at the Nam-San site in Seoul, Korea. Sci. Total Environ. 2012, 416, 400–409. [Google Scholar] [CrossRef]
  12. Kim, G.S.; Joo, S.J.; Lee, C.S. Seasonal Variation of Soil Respiration in the Mongolian Oak (Quercus mongolica Fisch. Ex Ledeb.) Forests at the Cool Temperate Zone in Korea. Forests 2020, 11, 984. [Google Scholar] [CrossRef]
  13. IPCC. A Report of Working Group of the Intergovernmental Panel on Climate Change, Climate Change 2001; Intergovernmental Panel on Climate Change: Cambridge, UK, 2001. [Google Scholar]
  14. Canadell, J.G.; Le Quéré, C.; Raupach, M.R.; Field, C.B.; Buitenhuis, E.T.; Ciais, P.; Conway, T.J.; Gillett, N.P.; Houghton, R.A.; Marland, G. Contributions to accelerating atmospheric CO2 growth from economic activity, carbon intensity, and efficiency of natural sinks. Proc. Natl. Acad. Sci. USA 2007, 104, 18866. [Google Scholar] [CrossRef] [Green Version]
  15. UNEP. Overview of the Republic of Korea’s Green Growth National Vision; United Nations Environment Programme: Nairobi, Kenya, 2009. [Google Scholar]
  16. Houghton, R.A. Land-use change and the carbon cycle. Glob. Change Biol. 1995, 1, 275–287. [Google Scholar] [CrossRef]
  17. IPCC. Climate Change 2014: Mitigation of Climate Change, Agriculture, Forestry and Other Land Use (AFOLU); Intergovernmental Panel on Climate Change: Cambridge, UK, 2014. [Google Scholar]
  18. The National Academy of Sciences and the Royal Society. Climate Change. Evidence & Causes. Update 2020; National Academy of Sciences and the Royal Society: Washington, DC, USA, 2020; p. 24. [Google Scholar]
  19. Paris Agreement. Paris agreement. In Proceedings of the Report of the Conference of the Parties to the United Nations Framework Convention on Climate Change, Bonn, Germany, 12 December 2015; p. 2017. [Google Scholar]
  20. Masson-Delmotte, V.; Zhai, P.; Pörtner, H.-O.; Roberts, D.; Skea, J.; Shukla, P.R.; Pirani, A.; Moufouma-Okia, W.; Péan, C.; Pidcock, R. Global Warming of 1.5 °C; Intergovernmental Panel on Climate Change: Geneva, Switzerland, 2018. [Google Scholar]
  21. Schimel, D.S. Terrestrial ecosystems and the carbon cycle. Glob. Change Biol. 1995, 1, 77–91. [Google Scholar] [CrossRef]
  22. Le Quéré, C.; Andrew, R.M.; Friedlingstein, P.; Sitch, S.; Hauck, J.; Pongratz, J.; Pickers, P.A.; Korsbakken, J.I.; Peters, G.P.; Canadell, J.G.; et al. Global Carbon Budget 2018. Earth Syst. Sci. Data 2018, 10, 2141–2194. [Google Scholar] [CrossRef] [Green Version]
  23. Candela, J.; Carlson, D. The Annual Global Carbon Budget. 2017. Available online: https://public.wmo.int/en/resources/bulletin/annual-global-carbon-budget (accessed on 15 December 2021).
  24. Friedlingstein, P.; O’Sullivan, M.; Jones, M.W.; Andrew, R.M.; Hauck, J.; Olsen, A.; Peters, G.P.; Peters, W.; Pongratz, J.; Sitch, S.; et al. Global Carbon Budget 2020. Earth Syst. Sci. Data 2020, 12, 3269–3340. [Google Scholar] [CrossRef]
  25. Nabuurs, G.J.; Masera, O.; Andrasko, K.; Benitez-Ponce, P.; Boer, R.; Dutschke, M.; Elsiddig, E.; Ford-Robertson, J.; Frumhoff, P.; Karjalainen, T.; et al. Forestry. In Climate Change 2007—Mitigation of Climate Change: Working Group III Contribution to the Fourth Assessment Report of the IPCC; Intergovernmental Panel on Climate; Cambridge University Press: Cambridge, UK, 2007; pp. 541–584. [Google Scholar]
  26. Rizvi, A.; Baig, S.; Barrow, E.; Kumar, C. Synergies between Climate Mitigation and Adaptation in Forest Landscape Restoration; IUCN: Gland, Switzerland, 2015. [Google Scholar]
  27. Son, Y.; Jun, Y.C.; Lee, Y.Y.; Kim, R.H.; Yang, S.Y. Soil Carbon Dioxide Evolution, Litter Decomposition, and Nitrogen Availability Four Years after Thinning in a Japanese Larch Plantation. Commun. Soil Sci. Plant Anal. 2004, 35, 1111–1122. [Google Scholar] [CrossRef]
  28. Kim, K.G.; Cho, D.G.; Kim, N.C.; Min, B.M. A study on the development of techniques for urban forest restoration and management-focus on the restoration of origin vegetation and improvement of biodiversity. J. Korean Soc. Environ. Restor. Technol. 2000, 3, 27–37. [Google Scholar]
  29. Kim, I.H.; Oh, K.S.; Jung, S.H. An analysis of relationship between carbon emission and urban spatial patterns. Spat. Inf. Res. 2011, 19, 61–72. [Google Scholar]
  30. Grübler, A. Technology and Global Change; Cambridge University Press: Cambridge, UK, 1994. [Google Scholar]
  31. Sheehan, M.O.M.; Peterson, J.A. Reinventing Cities for People and the Planet; Worldwatch Institute: Washington, DC, USA, 1999. [Google Scholar]
  32. IPCC. IPCC Special Report on Emissions Scenarios; Intergovernmental Panel on Climate Change: Cambridge, UK, 2000. [Google Scholar]
  33. Eggleston, H.S.; Buendia, L.; Miwa, K.; Ngara, T.; Tanabe, K. 2006 IPCC Guidelines for National Greenhouse Gas Inventories; IPCC: Hayama, Japan, 2006. [Google Scholar]
  34. Park, E.J.; Kang, K.Y. Estimation of C storage and annual CO2 uptake by street trees in Gyeonggi-do. Korean J. Environ. Ecol. 2010, 24, 591–600. [Google Scholar]
  35. Curtis, P.S.; Hanson, P.J.; Bolstad, P.; Barford, C.; Randolph, J.C.; Schmid, H.P.; Wilson, K.B. Biometric and eddy-covariance based estimates of annual carbon storage in five eastern North American deciduous forests. Agric. For. Meteorol. 2002, 113, 3–19. [Google Scholar] [CrossRef]
  36. Jo, H.K. Carbon uptake and emissions in urban landscape, and the role of urban greenspace for several cities in Kangwon Province. J. Korean Inst. Landsc. Archit. 1999, 27, 39–53. [Google Scholar]
  37. Kim, G.S.; Lim, Y.K.; An, J.H.; Lee, J.S.; Lee, C.S. Carbon budget in campus of the national institute of ecology. Korean J. Ecol. Environ. 2014, 47, 167–175. [Google Scholar] [CrossRef]
  38. Kim, G.S.; Pi, J.H.; An, J.H.; Lim, C.H.; Jung, S.H.; Joo, S.J.; Lee, C.S. Carbon Budget Evaluated in Two Urban Parks of Seoul. Korean J. Ecol. Environ. 2016, 49, 51–61. [Google Scholar] [CrossRef]
  39. Korea Meteorological Administration (KMA). Annual Climatological Report; Korea Meteorological Administration: Seoul, Korea, 2009.
  40. Whittaker, R.H.; Marks, P.L. Methods of assessing terrestrial productivity. In Primary Productivity of the Biosphere; Springer: Berlin/Heidelberg, Germany, 1975; pp. 55–118. [Google Scholar]
  41. Návar, J. Allometric equations for tree species and carbon stocks for forests of northwestern Mexico. For. Ecol. Manag. 2009, 257, 427–434. [Google Scholar] [CrossRef]
  42. Korea Forest Service (NIFS). Study on the Basis of Forest Carbon Accounting in Korea; Korea Forest Service: Seoul, Korea, 2010.
  43. Han, D.Y. Carbon Cycle Modeling by Litter Decomposition Rate and Estimation of Carbon Dioxide Budget in Quercus mongolica Forest at Mt. Songni National Park. Ph.D. Thesis, Chungbuk National University, Cheongju, Korea, 2002. [Google Scholar]
  44. Bekku, Y.; Koizumi, H.; Oikawa, T.; Iwaki, H. Examination of four methods for measuring soil respiration. Appl. Soil Ecol. 1997, 5, 247–254. [Google Scholar] [CrossRef]
  45. Raich, J.W.; Tufekciogul, A. Vegetation and soil respiration: Correlations and controls. Biogeochemistry 2000, 48, 71–90. [Google Scholar] [CrossRef]
  46. Lee, M.S. Method for Assessing Forest Carbon Sinks by Ecological Process-Based Approach-A Case Study for Takayama Station, Japan. Korean J. Ecol. 2003, 26, 289–296. [Google Scholar] [CrossRef]
  47. National Institute of Agricultural Sciences (NIAS). Test and Research Report; Rural Development Administration: Wanju, Korea, 1994.
  48. National Institute of Environmental Research (NIER). A Study on GHG-CAPSS Improvement Process; Ministory of Environment: Incheon, Korea, 2009.
  49. National Institute of Environmental Research (NIER). The Second Stage Report of KNLTER; Ministry of Environment: Incheon, Korea, 2010; p. 1258.
  50. Kim, S.K.; Jeong, J.Y. A Study on the Production Structure and Biomass Productivity of Quercus variabilis Natural Forest. J. Korean For. Soc. 1985, 70, 91–102. [Google Scholar]
  51. Song, C.Y.; Lee, S.W. Biomass and Net Primary Productivity in Natural Forests of Quercus mongolica and Quercus variabilis. J. Korean For. Soc. 1996, 85, 443–452. [Google Scholar]
  52. Park, G.S. Aboveground and Soil Carbon Storages in Quercus mongolica and Quercus variabilis Natural Forest Ecosystems in Chungju. J. Korean For. Soc. 1999, 88, 93–100. [Google Scholar]
  53. Luyssaert, S.; Inglima, I.; Jung, M.; Richardson, A.D.; Reichstein, M.; Papale, D.; Piao, S.L.; Schulze, E.D.; Wingate, L.; Matteucci, G.; et al. CO2 balance of boreal, temperate, and tropical forests derived from a global database. Glob. Change Biol. 2007, 13, 2509–2537. [Google Scholar] [CrossRef] [Green Version]
  54. Melillo, J.M.; McGuire, A.D.; Kicklighter, D.W.; Moore, B.; Vorosmarty, C.J.; Schloss, A.L. Global climate change and terrestrial net primary production. Nature 1993, 363, 234–240. [Google Scholar] [CrossRef]
  55. Son, Y.; Kim, H.W. Soil respiration in Pinus rigida and Larix leptolepis plantations. J. Korean Soc. For. Sci. 1996, 85, 496–505. [Google Scholar]
  56. Hwang, J.; Son, Y. Short-term effects of thinning and liming on forest soils of pitch pine and Japanese larch plantations in central Korea. Ecol. Res. 2006, 21, 671–680. [Google Scholar] [CrossRef]
  57. Prentice, I.C.; Farquhar, G.D.; Fasham, M.J.R.; Goulden, M.L.; Heimann, M.; Jaramillo, V.J.; Kheshgi, H.S.; Le Quéré, C.; Scholes, R.J.; Wallace, D.W.R.; et al. The carbon cycle and atmospheric carbon dioxide. In Climate Change 2001: The Scientific Basis. Contribution of Working Group I to the Third Assessment Report of the Intergovernmental Panel on Climate Change; Cambridge University Press: Cambridge, UK, 2001; Chapter 3; pp. 183–237. [Google Scholar]
  58. MEA. Ecosystems and Human Well-Being: Synthesis; World Resources Institute: Washington, DC, USA, 2005. [Google Scholar]
  59. Cohen-Shacham, E.; Walters, G.; Janzen, C.; Maginnis, S. Nature-Based Solutions to Address Global Societal Challenges; IUCN: Gland, Switzerland, 2016; p. 97. [Google Scholar]
  60. UNEP. Guidelines for Integrating Ecosystem-Based Adaptation into National Adaptation Plans: Supplement to the UNFCCC NAP Technical Guidelines; United Nations Environment Programme: Nairobi, Kenya, 2021. [Google Scholar]
  61. UN. The Sustainable Development Goals Report; United Nations: New York, NY, USA, 2019; p. 64. [Google Scholar]
  62. Lim, C.H.; Pi, J.H.; Kim, A.R.; Cho, H.J.; Lee, K.S.; You, Y.H.; Lee, K.H.; Kim, K.D.; Moon, J.S.; Lee, C.S. Diagnostic Evaluation and Preparation of the Reference Information for River Restoration in South Korea. Int. J. Environ. Res. Public Health 2021, 18, 1724. [Google Scholar] [CrossRef] [PubMed]
  63. Song, H.G.; Lee, C.S. Diagnosis on climate change: Climate change based on the flowering response of cherry tree. Clim. Chang. Ecol. Ser. Long Term Ecol. Res. 2014, 7, 60–74. [Google Scholar]
  64. Jung, S.H.; Kim, A.R.; An, J.H.; Lim, C.H.; Lee, H.; Lee, C.S. Abnormal shoot growth in Korean red pine as a response to microclimate changes due to urbanization in Korea. Int. J. Biometeorol. 2020, 64, 571–584. [Google Scholar] [CrossRef]
  65. Benton, T.G.; Bailey, R.; Froggatt, A.; King, R.; Lee, B.; Wellesley, L. Designing sustainable landuse in a 1.5 °C world: The complexities of projecting multiple ecosystem services from land. Curr. Opin. Environ. Sustain. 2018, 31, 88–95. [Google Scholar] [CrossRef]
  66. Kim, A.R.; Lim, B.S.; Seol, J.; Lee, C.S. Principle of restoration ecology reflected in the process creating the National Institute of Ecology. J. Ecol. Environ. 2021, 45, 12. [Google Scholar] [CrossRef]
  67. Hansen, J.; Sato, M.; Kharecha, P.; von Schuckmann, K.; Beerling, D.J.; Cao, J.; Marcott, S.; Masson-Delmotte, V.; Prather, M.J.; Rohling, E.J.; et al. Young people’s burden: Requirement of negative CO2 emissions. Earth Syst. Dyn. 2017, 8, 577–616. [Google Scholar] [CrossRef] [Green Version]
  68. Smith, P.; Davis, S.J.; Creutzig, F.; Fuss, S.; Minx, J.; Gabrielle, B.; Kato, E.; Jackson, R.B.; Cowie, A.; Kriegler, E.; et al. Biophysical and economic limits to negative CO2 emissions. Nat. Clim. Chang. 2016, 6, 42–50. [Google Scholar] [CrossRef] [Green Version]
  69. Galatowitsch, S.M. Carbon Offsets as Ecological Restorations. Restor. Ecol. 2009, 17, 563–570. [Google Scholar] [CrossRef]
  70. Evans, M.C.; Carwardine, J.; Fensham, R.J.; Butler, D.W.; Wilson, K.A.; Possingham, H.P.; Martin, T.G. Carbon farming via assisted natural regeneration as a cost-effective mechanism for restoring biodiversity in agricultural landscapes. Environ. Sci. Policy 2015, 50, 114–129. [Google Scholar] [CrossRef] [Green Version]
  71. IUCN. International Union for Conservation of Nature Annual Report 2016; IUCN: Gland, Switzerland, 2016. [Google Scholar]
  72. Hertog, C. Ecological Sustainability within California’s Improved Forest Management Carbon Offsets Program. Master’s Thesis, Clark University, Worcester, MA, USA, 2018. [Google Scholar]
  73. Dybala, K.E.; Matzek, V.; Gardali, T.; Seavy, N.E. Carbon sequestration in riparian forests: A global synthesis and meta-analysis. Glob. Change Biol. 2019, 25, 57–67. [Google Scholar] [CrossRef] [PubMed] [Green Version]
  74. Wanous, S. Carbon Offsets in San Diego County: An Analysis of Carbon Offset Policy Effectiveness, Best Practices, and Local Viability in the San Diego County Region; Institution of Oceanography: San Diego, CA, USA, 2019. [Google Scholar]
  75. Dave, R.; Saint-Laurent, C.; Murray, L.; Antunes Daldegan, G.; Brouwer, R.; de Mattos Scaramuzza, C.A.; Raes, L.; Simonit, S.; Catapan, M.; García Contreras, G. Second Bonn Challenge Progress Report; IUCN: Gland, Switzerland, 2018. [Google Scholar]
  76. The Government of the Republic of Korea (GRK). 2050 Carbon Neutral Strategy of the Republic of Korea; The Government of the Republic of Korea: Seoul, Korea, 2020.
  77. Lorenz, K.; Lal, R. Carbon dynamics and pools in major forest biomes of the world. In Carbon Sequestration in Forest Ecosystems; Springer: Dordrecht, The Netherlands, 2010; pp. 159–205. [Google Scholar]
  78. Lee, C.S.; Lee, H.; Kim, A.R.; Pi, J.H.; Bae, Y.J.; Choi, J.K.; Lee, W.S.; Moon, J.S. Ecological effects of daylighting and plant reintroduction to the Cheonggye Stream in Seoul, Korea. Ecol. Eng. 2020, 152, 105879. [Google Scholar] [CrossRef]
  79. Korean National Geographic Information Institute (KNGII). Korea National Spatial Data Infrastructure Portal. 2020. Available online: http://data.nsdi.go.kr/organization/a05016 (accessed on 15 December 2021).
  80. Naiman, R.J.; Decamps, H.; McClain, M.E. Riparia: Ecology, Conservation, and Management of Streamside Communities; Elsevier: Burlington, UK, 2010. [Google Scholar]
  81. Sutfin, N.A.; Wohl, E.E.; Dwire, K.A. Banking carbon: A review of organic carbon storage and physical factors influencing retention in floodplains and riparian ecosystems. Earth Surf. Processes Landf. 2016, 41, 38–60. [Google Scholar] [CrossRef]
  82. Matzek, V.; Stella, J.; Ropion, P. Development of a carbon calculator tool for riparian forest restoration. Appl. Veg. Sci. 2018, 21, 584–594. [Google Scholar] [CrossRef]
  83. Daigneault, A.J.; Eppink, F.V.; Lee, W.G. A national riparian restoration programme in New Zealand: Is it value for money? J. Environ. Manag. 2017, 187, 166–177. [Google Scholar] [CrossRef]
  84. O’Brien, J.M.; Warburton, H.J.; Graham, S.E.; Franklin, H.M.; Febria, C.M.; Hogsden, K.L.; Harding, J.S.; McIntosh, A.R. Leaf litter additions enhance stream metabolism, denitrification, and restoration prospects for agricultural catchments. Ecosphere 2017, 8, e02018. [Google Scholar] [CrossRef]
  85. Capon, S.J.; Chambers, L.E.; Mac Nally, R.; Naiman, R.J.; Davies, P.; Marshall, N.; Pittock, J.; Reid, M.; Capon, T.; Douglas, M.; et al. Riparian Ecosystems in the 21st Century: Hotspots for Climate Change Adaptation? Ecosystems 2013, 16, 359–381. [Google Scholar] [CrossRef]
  86. Knopf, F.L.; Johnson, R.R.; Rich, T.; Samson, F.B.; Szaro, R.C. Conservation of Riparian Ecosystems in the United States. Wilson Bull. 1988, 100, 272–284. [Google Scholar]
  87. Nilsson, C.; Berggren, K. Alterations of Riparian Ecosystems Caused by River Regulation: Dam operations have caused global-scale ecological changes in riparian ecosystems. How to protect river environments and human needs of rivers remains one of the most important questions of our time. BioScience 2000, 50, 783–792. [Google Scholar] [CrossRef]
  88. Perry, L.G.; Andersen, D.C.; Reynolds, L.V.; Nelson, S.M.; Shafroth, P.B. Vulnerability of riparian ecosystems to elevated CO2 and climate change in arid and semiarid western North America. Glob. Chang. Biol. 2012, 18, 821–842. [Google Scholar] [CrossRef]
  89. Rheinhardt, R.D.; Brinson, M.M.; Meyer, G.F.; Miller, K.H. Carbon storage of headwater riparian zones in an agricultural landscape. Carbon Balance Manag. 2012, 7, 4. [Google Scholar] [CrossRef] [PubMed] [Green Version]
Figure 1. A map showing study sites where net ecosystem production (NEP) of major vegetation types was measured ((upper): Cheongju, (lower): Yeosu). The red squares represent the places where NEP of the major vegetation type was measured.
Atmosphere 13 00342 g001
Figure 2. Net primary production (NPP, tonC․ha−1․yr−1) by vegetation type measured in Cheongju and Yeosu.
Atmosphere 13 00342 g002
Figure 3. Seasonal variations in monthly mean soil respiration in Cheongju and Yeosu. Bars indicate standard deviation.
Atmosphere 13 00342 g003
Figure 4. Maps showing (a) the land use, (b) carbon emission, (c) carbon absorption, and (d) carbon budget of local government in South Korea. A negative sign (−) indicates a case where the amount of carbon absorption is greater than the emission amount.
Atmosphere 13 00342 g004
Table 1. The NPP, heterotrophic respiration, and NEP by vegetation type measured in Cheongju and Yeosu (unit: tonC ha−1 yr−1).
CommunityNPPHeterotrophic RespirationNEP
CheongjuP. densiflora6.44.12.3
P. rigida7.24.92.3
Q. acutissima12.44.87.6
L. kaempferi7.13.14.0
Q. mongolica6.94.72.2
Apartment garden6.24.81.4
YeosuP. densiflora9.46.72.7
P. rigida8.64.64.0
Q. acutissima9.64.45.2
Apartment garden5.33.51.8
Table 2. Correlations (Pearson) among carbon emission, absorption, budget, population size and density, coniferous and broad-leaved forest areas, total forest area, and non-forest area.
Carbon
Emission
Carbon
Absorption
Carbon BudgetPopulation SizePopulation DensityConiferous ForestDeciduous ForestTotal
Forest Area
Carbon
absorption
−0.004
(0.948)
Carbon budget0.997 **
(0.000)
−0.087
(0.186)
Population
size
0.212 **
(0.001)
−0.405 **
(0.000)
0.240 **
(0.000)
Population density−0.020
(0.763)
−0.440 **
(0.000)
0.012
(0.787)
0.666 **
(0.000)
Coniferous forest area−0.011
(0.868)
0.844 **
(0.000)
−0.080
(0.217)
−0.435 **
(0.000)
−0.457 **
(0.000)
Broad-leaved
forest area
0.001
(0.996)
0.956 **
(0.000)
−0.077
(0.231)
−0.343 **
(0.000)
−0.356 **
(0.000)
0.673 **
(0.000)
Total forest area−0.030
(0.656)
0.679 **
(0.000)
−0.077
(0.185)
−0.451 **
(0.001)
−0.499 **
(0.000)
0.627 **
(0.000)
0.653 **
(0.000)
Non-forest area0.030
(0.656)
−0.679 **
(0.000)
−0.077
(0.383)
0.451 **
(0.001)
0.499 **
(0.000)
−0.627 **
(0.000)
−0.653 **
(0.000)
−1.00 **
(0.000)
Numbers in parentheses indicate the p-value. **: p < 0.01.
Table 3. A comparison of environmental factors, which shows a significant correlation in the carbon budget between local governments showing a positive carbon budget and local governments showing a negative carbon budget. In the carbon budget, a positive indication (+) indicates a case where the amount of carbon emission is greater than the absorption amount, and a negative indication (−) indicates the opposite case.
Environmental FactorCarbon Budget (+)Carbon Budget (−)
CO2 emission (ton)2,700,901.9 ± 4,630,635.9411,696.0 ± 189,858.2
CO2 absorption (ton)214,315.6 ± 233,222.5787,068.6 ± 394,183.2
Mean population size249,785.4 ± 213,288.238,485.9 ± 17,762.4
Mean population density (individual/km2)47.7 ± 73.31.1 ± 1.5
Mean forest ratio (%)32.3 ± 17.658.3 ± 11.7
p-value < 0.01.
Publisher’s Note: MDPI stays neutral with regard to jurisdictional claims in published maps and institutional affiliations.

