1. Introduction
Currently, most cities in China have basically completed the construction of urban patterns, but a series of environmental problems have emerged in this process. Among them, the most prominent problem is that urban high-density development directly leads to the deterioration of the urban thermal environment [
1]. The urban heat island (UHI) is one of the typical characteristics of urban climate. It is a phenomenon wherein the temperature in the city is higher than that in the suburbs. The reinforced concrete, brick and tile, asphalt pavement, and buildings involved in urban construction cause the city to store more heat from the sun [
2,
3]. A large number of studies show that there are seasonal and spatial differences in the intensity of UHI. The UHI is most obvious in the center of the city in summer [
4,
5,
6]. After 2000, the UHI of Xi’an entered a relatively strong period.
Xi’an is a city located in a cold region, with hot summers and cold winters. The highest air temperature can be observed in July, reaching up to 35~41.8 °C, and the summer air temperature is increasing year by year [
1]. Meanwhile, the urban scale of Xi’an is increasing with a growth speed of 155% in recent decades. Therefore, discussion about urban climate-change mitigation in different urban built-up areas is becoming more and more important in cold climate cities such as Xi’an.
1.1. Urban Thermal Environment
A large number of studies have demonstrated that the main factors affecting the urban thermal environment include reductions in urban greening (grassland or trees) [
7,
8], changes in the urban form [
9,
10], replacement of the underlying surface material (mainly asphalt and concrete) [
11], and anthropogenic heat emission. These factors directly contribute to the urban heat-island phenomenon and affect citizens’ well-being. Currently, the main adjustment method in large- and medium-sized cities is a manual adjustment, but this adjustment method produces a great deal of heat radiation, making the urban heat-island effect more and more intense [
12]. In addition, with the process of urban development, the proportions of greenery, water, and other natural resources become smaller and smaller, worsening the urban thermal environment. For example, the summer surface temperature in the central area of Xi’an increased by 5.99 °C from 1992 to 2018, while the surface temperature in Weiyang District increased by 7.86 °C during the same 26 years [
13]. A large number of data and studies have shown that deterioration of the urban thermal environment has a relationship with population health and resource consumption [
14,
15]. From 14 June to 4 August 2010, the temperature in Shaanxi Province increased sharply compared to that in 2009. Meanwhile, in the 8 days from 26 July to 3 August 2010, 100 people died suddenly in Xi’an, an increase of 54% over the same period in 2009 [
16]. Considering the urban population of 7.6128 million in Xi’an, accounting for 74.61% of the permanent resident population, and the impact of the heat-island effect on global warming, urbanization development, citizen welfare, and municipal engineering, the Xi’an municipal government should pay more attention to the deterioration of the urban thermal environment.
1.2. Urban Morphology
Many studies show that there is an inseparable relationship between urban morphology and the urban heat island. Liu Huimin tried to build a framework to recognize the relationship between urban morphology and the UHI, using urban clusters in Chinese cities including Xi’an, and pointed out that a lower UHI intensity tends to appear in urban clusters with a smaller scale, more scattered patches, more uniform distribution of the urban development level, and less spatial aggregation of high-density urban land [
17]. This relationship is more or less related to ventilation.
Therefore, in recent years, many cities have put forward the concept of an urban wind corridor, which introduces wind outside the scope of the city into the city, so as to improve the city’s thermal environment [
18]. However, the feasibility of Xi’an wind-corridor planning needs to be further explored. Xi’an is in a non-windy area, and the calm wind frequency is about 28% or 102 days per year [
19]. The average wind speed is 0.9 m/s. In particular, the building density in the old city is high, and there are serious climate and environmental problems, such as poor ventilation and heat-island effects [
20]. Zhang has studied the urban morphology of Xi’an, including the sky-view factor (SVF), building density, and floor-area ratio. It was pointed out that the average SVF of Xi’an is about 0.2 to 0.4, and the building density is between 35% and 45%. The built-up portion of the whole urban area of Xi’an is 1946.72 km
2, and the average floor-area ratio is about 2.2 to 2.7 [
21].
For urban blocks, block morphology and urban green spaces affect the wind environment of the block. Under the conditions of calm wind, the temperature difference between the cold-air generation area formed by urban green spaces in summer and the high-temperature area of the surrounding city promotes airflow, thus generating local thermal circulation wind in the city [
22]. The airflow induced by the local temperature difference in the urban green space has been widely confirmed by measurement, simulation, and other methods at home and abroad, but the influence’s intensity and scope still need to be assessed via in-depth quantitative research.
1.3. Urban Vegetation
Urban vegetation is an important factor affecting the urban thermal environment. Studies have demonstrated the negative correlation between urban green space and the UHI index [
23]. In addition, the effect of urban green space on the urban thermal environment can be divided into two kinds. One is a small-scale temperature reduction inside the urban green space, and the other is the cooling effect of cold-air infiltration in the urban green space on its surrounding areas [
24]. Therefore, urban green spaces not only provide a leisure space of a suitable temperature for citizens but also alleviate the heat-island effect within the urban built-up area in a certain range around it [
25]. Through transpiration and evapotranspiration, green vegetation can cool and humidify the surrounding environment [
26], absorb a large amount of carbon dioxide, and inhibit the greenhouse effect [
27]. Research shows that from 2009 to 2017, the total area of urban green space in Xi’an remained basically unchanged, but there was a very obvious fragmentation phenomenon of urban green spaces. Xi’an has maintained continuous expansion in recent years. From 2005 to 2016, a total of 78.11 km
2 of unused green land was converted to impervious surfaces in built-up areas. These disappearing green spaces are mostly large suburban green spaces. However, 84.22 km
2 of green space has been newly built in Xi’an in the past decade; most of these new green spaces are pocket parks in the city center, and the impact of this phenomenon on the thermal environment of the main body of the city still needs to be studied [
13].
1.4. Pocket Park
Rapid urbanization has led to a sharp rise in building density and population density. The area of urban green space is shrinking, and the demand for green space is particularly urgent from citizens. Therefore, there are many naturally formed and unplanned small green spaces that were developed in the city, which could be named pocket parks. The pocket parks are usually small green urban spaces that are flexibly distributed in high-density urban areas as patches [
28]. Pocket parks usually have small green planting areas and convenient service facilities, with the characteristics of flexible site selection, small area, and discrete distribution [
29].
Pocket parks between high-density blocks play an important role in the urban green infiltration system, but there is still a lack of research on the green infiltration mechanism against the background of different block development modes, which leads to a lack of a scientific basis for the design of pocket parks [
30].
Urban green space helps to improve the urban thermal environment in summer [
31]. However, for high-density big cities, it is impossible to reopen large-scale green space in the urban center. It is more economical and reasonable to build and optimize small urban parks while carrying out urban renewal and transformation. Pocket parks can make full use of the fragmented space in the city and give full play to the environmental effect of the park. Therefore, we tried to summarize the design method of pocket parks from the perspective of environmental impact assessment. This study takes three typical pocket parks in the second ring road of Xi’an as the research object, combined with field climate monitoring and ENVI-met software simulation. Using different development models, this study explores the impact from different pocket-park design methods on urban thermal environment. The next part of the paper analyzes the research methods, mainly measuring point verification and analysis simulation methods, and the case introduction. The third section presents an analysis of the results, in which we analyze and compare simulation results under different optimization methods. The fourth section presents a discussion and future directions, mainly commenting on the parts of this study that could be further developed. The last section presents our final conclusions, which show the planning strategy of pocket parks adapting to the characteristics of urban blocks.
2. Method
2.1. Case Introduction and Model Processing
Three pocket parks in the second ring road of Xi’an are simulated and analyzed as the case study. The scale of these pocket parks is uniform, which is very representative of those in Xi’an. At the same time, these pocket parks are different in their shape, surrounding architectural layout, green layout, space design, etc., covering the various types of pocket parks in Xi’an. The simulation range was a 300 m × 300 m area with the green center as the reference point, and the main microclimate parameters on a 2 m × 2 m × 2 m grid were calculated. The proportions of the lower cushion surface in three blocks is shown in
Table 1. Floor-area ratio is the ratio of total aboveground building area to net land area. It is often used for community design. However, in this study, we define the floor-area ratio of the urban block (300 m × 300 m) to show the development intensity of urban block. This is shown in
Table 2.
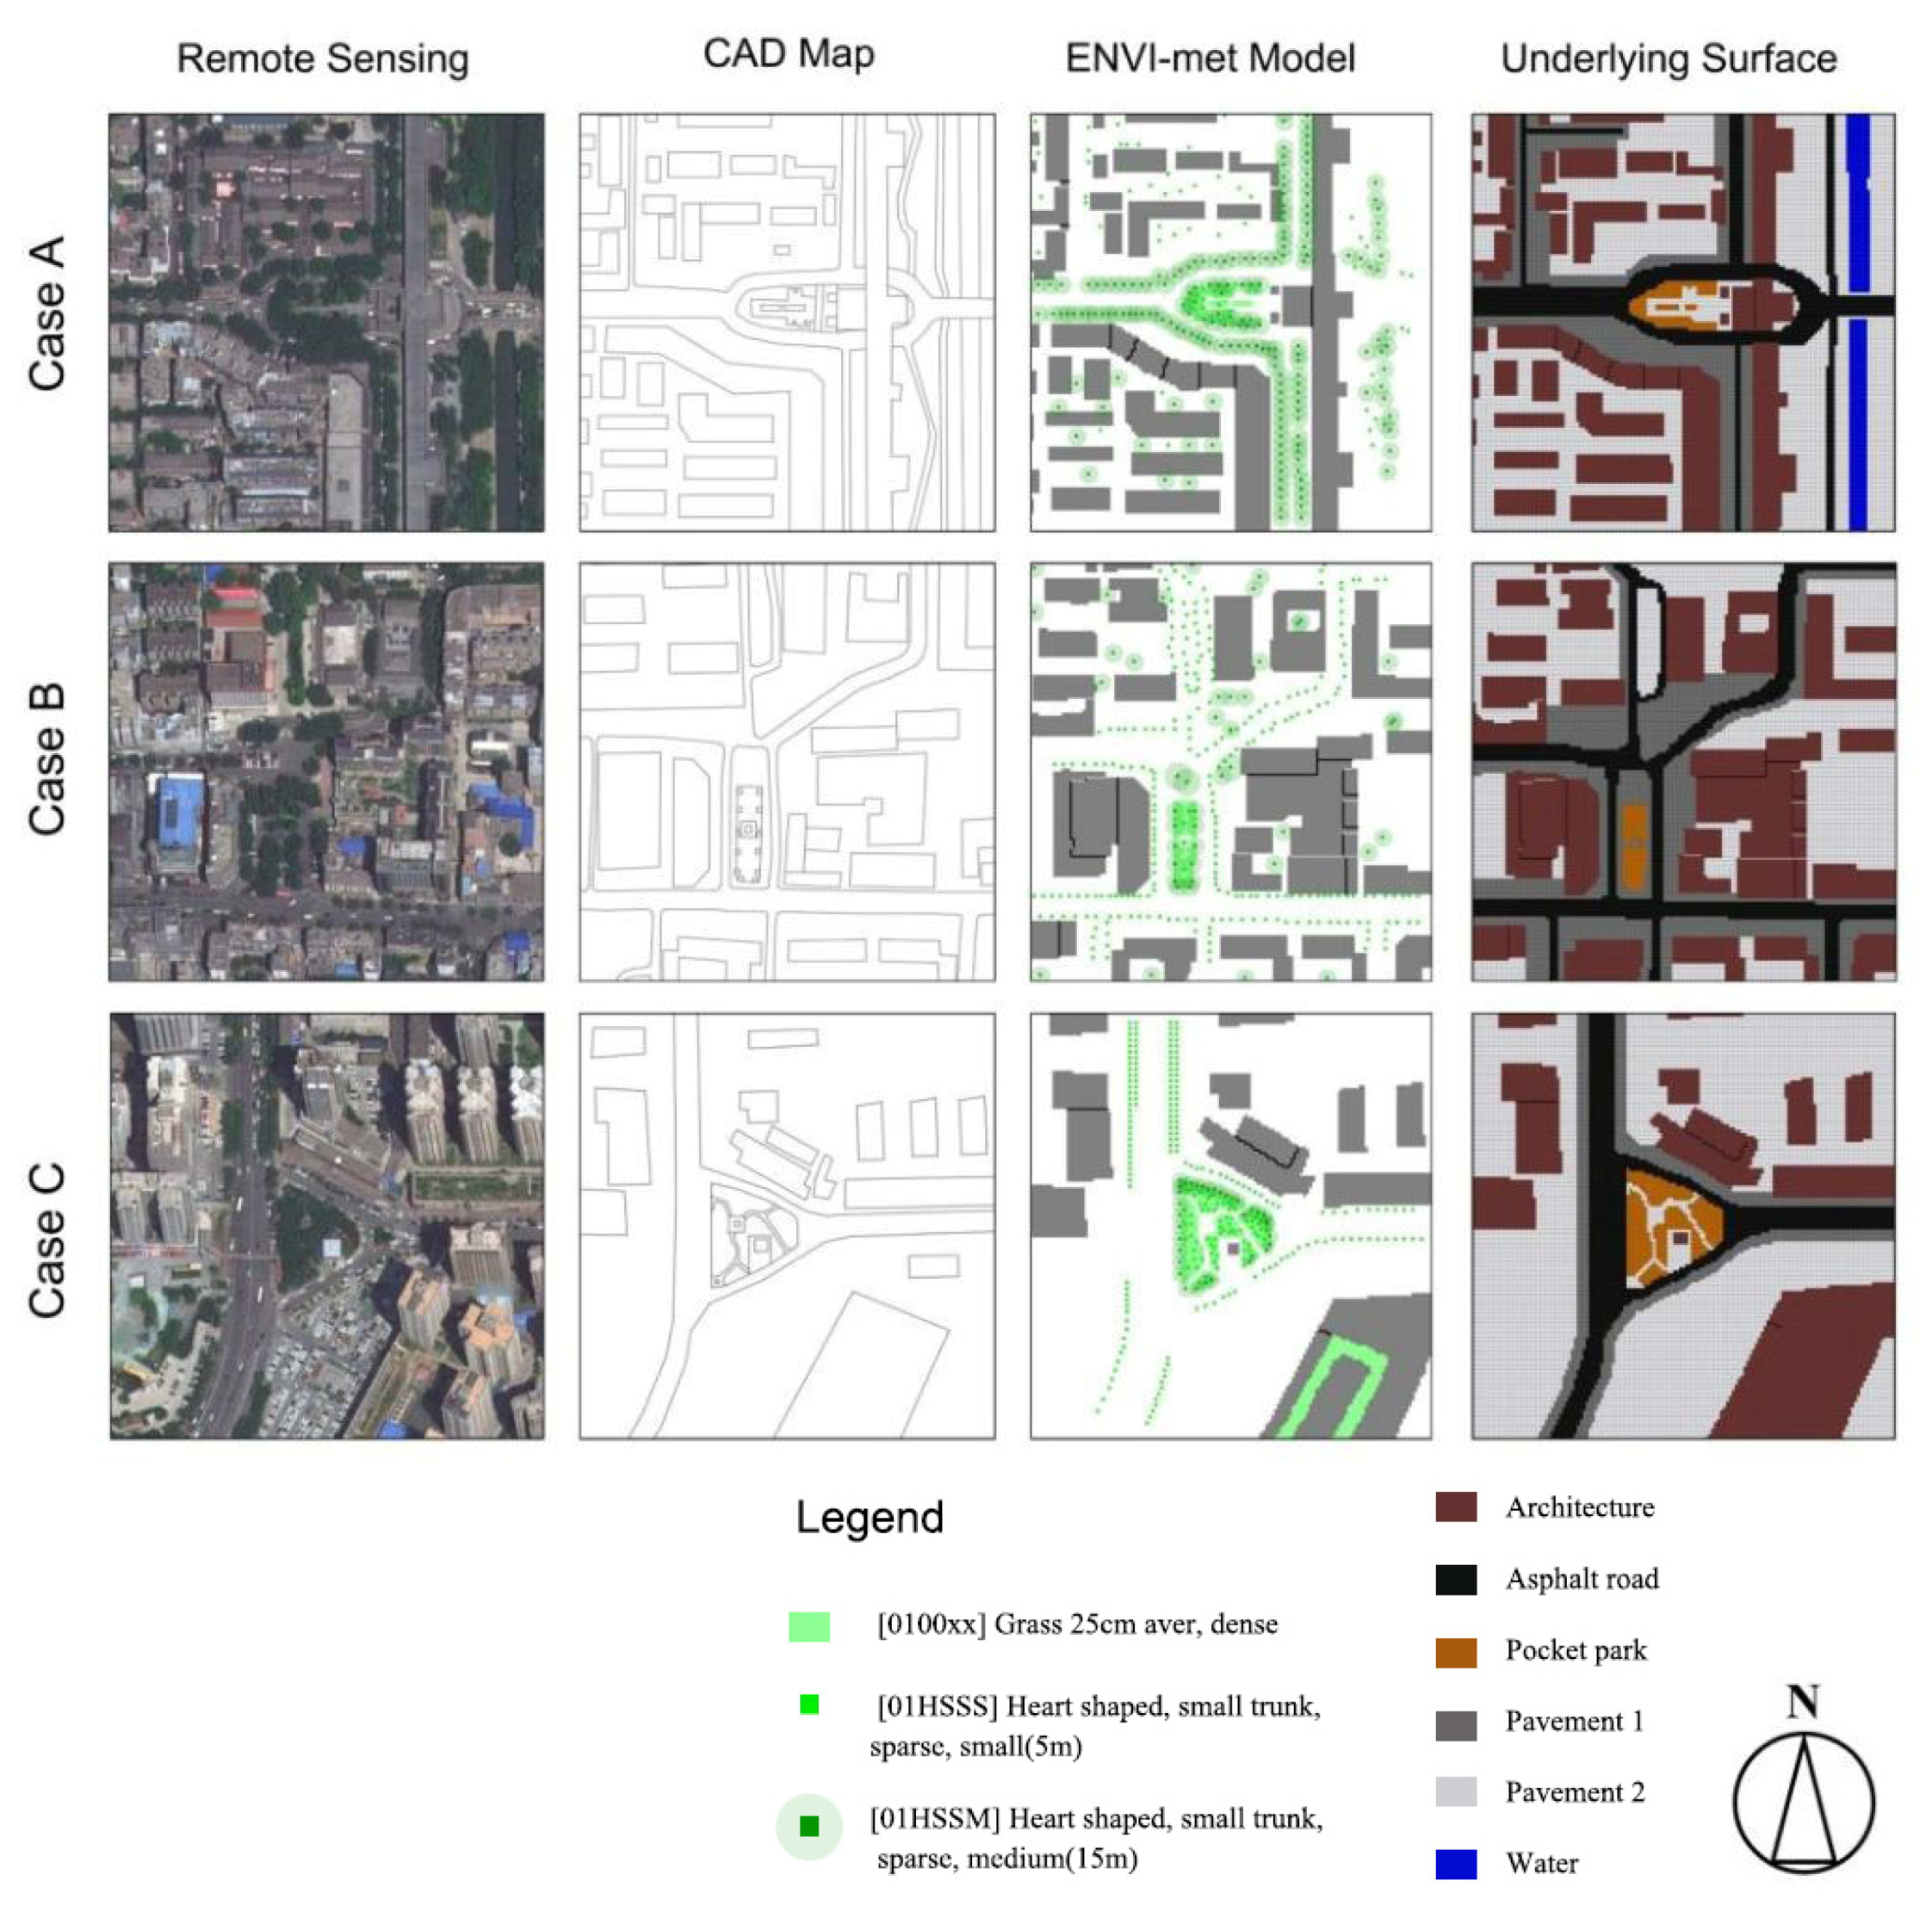
Case A is a rectangle with east–west orientation, and the surrounding buildings are relatively low as a whole; it is adjacent to the ancient city wall of Xi’an, with remarkable Xi’an characteristics. The overall block belongs to a low-development-intensity block with a low volume ratio. Case B is a rectangle with north–south orientation, with high buildings on both the east and west sides, low buildings on both the north and south sides, and a moderate overall block-volume ratio, belonging to a middle-development-intensity block. Case C is triangular, surrounded by urban roads, in a high-rise commercial district belonging to a high-development-intensity block. Case A and Case B are located in the old urban area of Xi’an, while Case C is located in the second ring road of Xi’an. The location of the three parks in the satellite map of Xi’an is shown in
Figure 1. Remote sensing map, CAD drawing, ENVI-met model, and underlying urban surfaces of the three block cases are shown in
Figure 2. Some basic information about these three pocket parks is shown in
Table 3.
In this simulation, we determined the greening arrangement of the research site by examining a combination of satellite maps and field observations. Greening is represented by the corresponding greening types in ENVI-met. The data of grassland and 3D plants are shown in
Table 4. The underlying surface treatment in ENVI-met is shown in
Table 4.
The treatment methods that shown in
Table 5 are used to present the actual situation. Our research is focusing on the design of parks, and the changes in the elements of the park, such as the tree density and the green layout of the pocket park were applied in the models for comparison. The underlying surface except the park are the same in different simulation models.
2.2. Simulation Method
ENVI-met, as a three-dimensional Microclimate Simulation software product, was used to simulate the thermal environment of the pocket parks in this study. The version used in this study was the latest version, v4.4.6. ENVI-met is based on the basic laws of hydrodynamics and thermodynamics, which are widely used in academic research on urban-block-scale climate simulation [
32]. ENVI-met software mainly requires model files and configuration files as input: model files define information such as building layout, vegetation, soil types, sensors, and project location parameters, while the configuration file contains the simulation settings and simulation time for the initialized values of meteorological parameters. The meteorological parameters required for simulation are shown in
Table 6.
Generally speaking, the simulation should last at least 6 h. Considering the specific needs of academic research, 12 h or 24 h simulation is very normal. For this study, a typical summer simulation of 30 h was selected, and the simulation results from 6 h to 30 h were taken as the research data source.
2.3. Simulation Verification
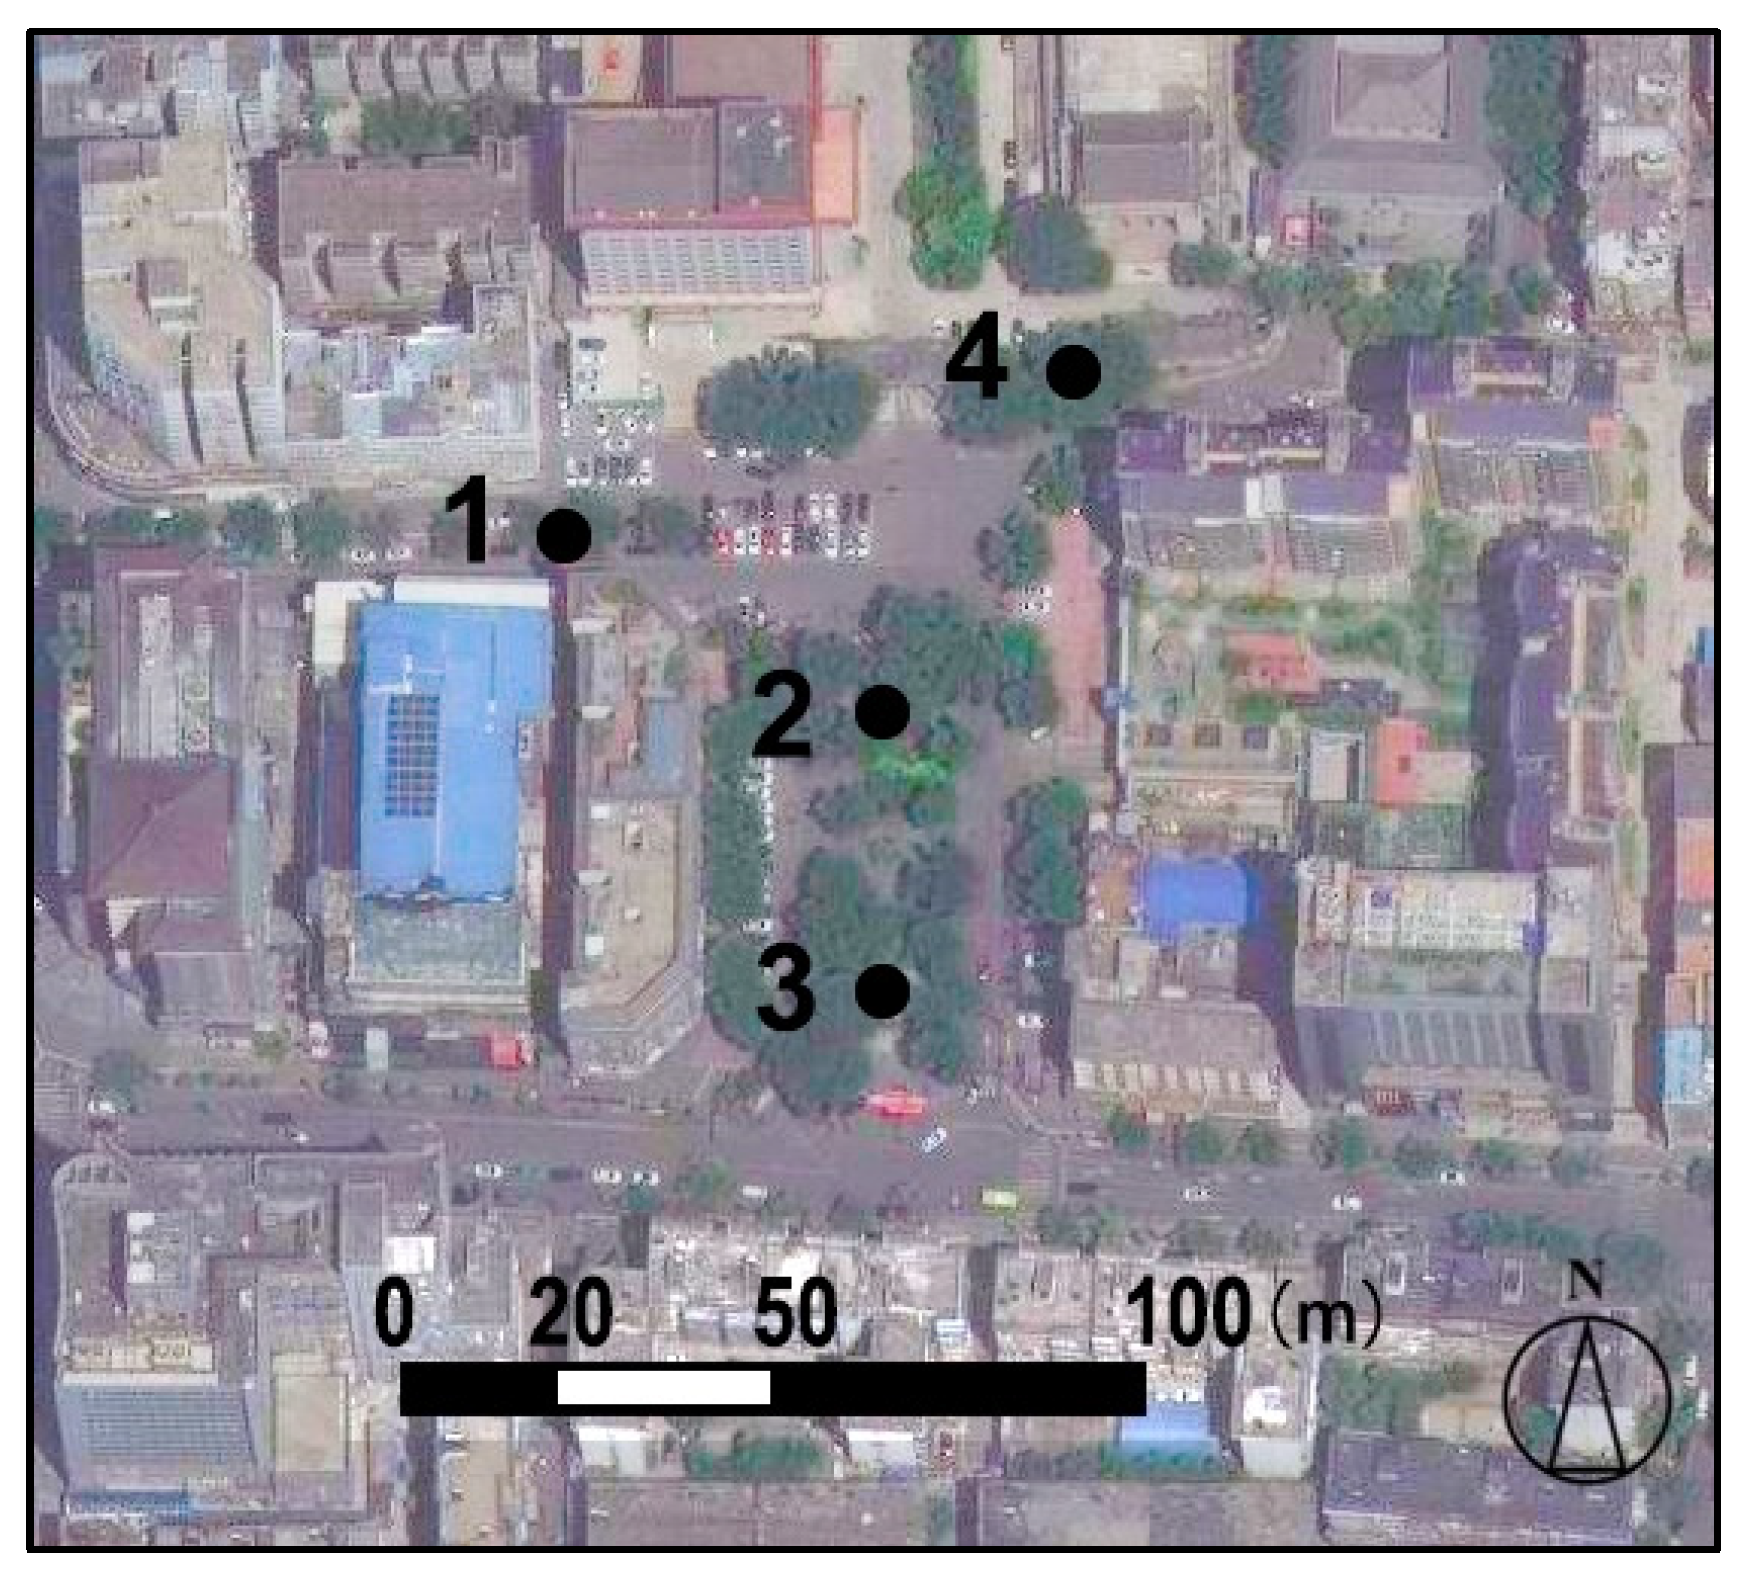
To verify the reliability of the temperature, humidity, and thermal environment simulated by ENVI-met, Case B was selected for field measurement. The observation time for field measurements of the temperature, humidity, and thermal environment was 24 h on 26 July 2019. The observation instrument used was an HOBO MX2301A temperature sensor with a built-in data recorder (accuracy: 0~70 °C, ±0.2 °C). To ensure the instrument’s safety and avoid human interference, the sensor was enclosed in an HOBO RS1 solar radiation shield. The air temperature was measured every 3 min. These measurements were carried out on a clear and windless day to minimize the impact of meteorological variables. The sensor was connected with the corresponding APP to detect and record the temperature and humidity data in real time.
There are 4 survey points in the field survey area comprising typical representative points: a green space center, both sides of the road, the periphery of the building, and around the trees on the street. In general, the measuring points were surrounded by green space. The location of measurement points is shown in
Figure 3.
To simplify the chart, we select the average of four observation points as the comparative data. This is shown in
Figure 4a. The correlation between the simulation and measurement results is shown in
Figure 4b.
Previous studies show that this method is feasible when the temperature difference between ENVI-met simulation results and measured results is less than 4 °C [
33,
34,
35,
36]. As shown in
Figure 4a, the temperature change trend between the ENVI-met simulation results and field measurement results is similar. The average air temperature difference is 1.6 °C between the simulation and measurement, and the largest air temperature difference is 3.2 °C, which occurred at 11:00. From
Figure 4b, the determination coefficient R
2 reaches up to 0.799.
2.4. Optimization Strategy
The optimization strategy herein is based on simulation analysis of the current situation (
Figure 2) and a no-pocket park block (
Figure 5). The simulation results show that the pocket park can significantly reduce the air temperature of urban blocks (0.6 °C–1.1 °C). Currently, the pocket parks in the second ring road of Xi’an have a high degree of similarity, but there are subtle differences in terms of their tree density and spatial structure. The optimization method via simulation analysis is therefore provided regarding the two aspects of tree density and spatial structure. The optimization strategy is shown in
Figure 6.
3. Results
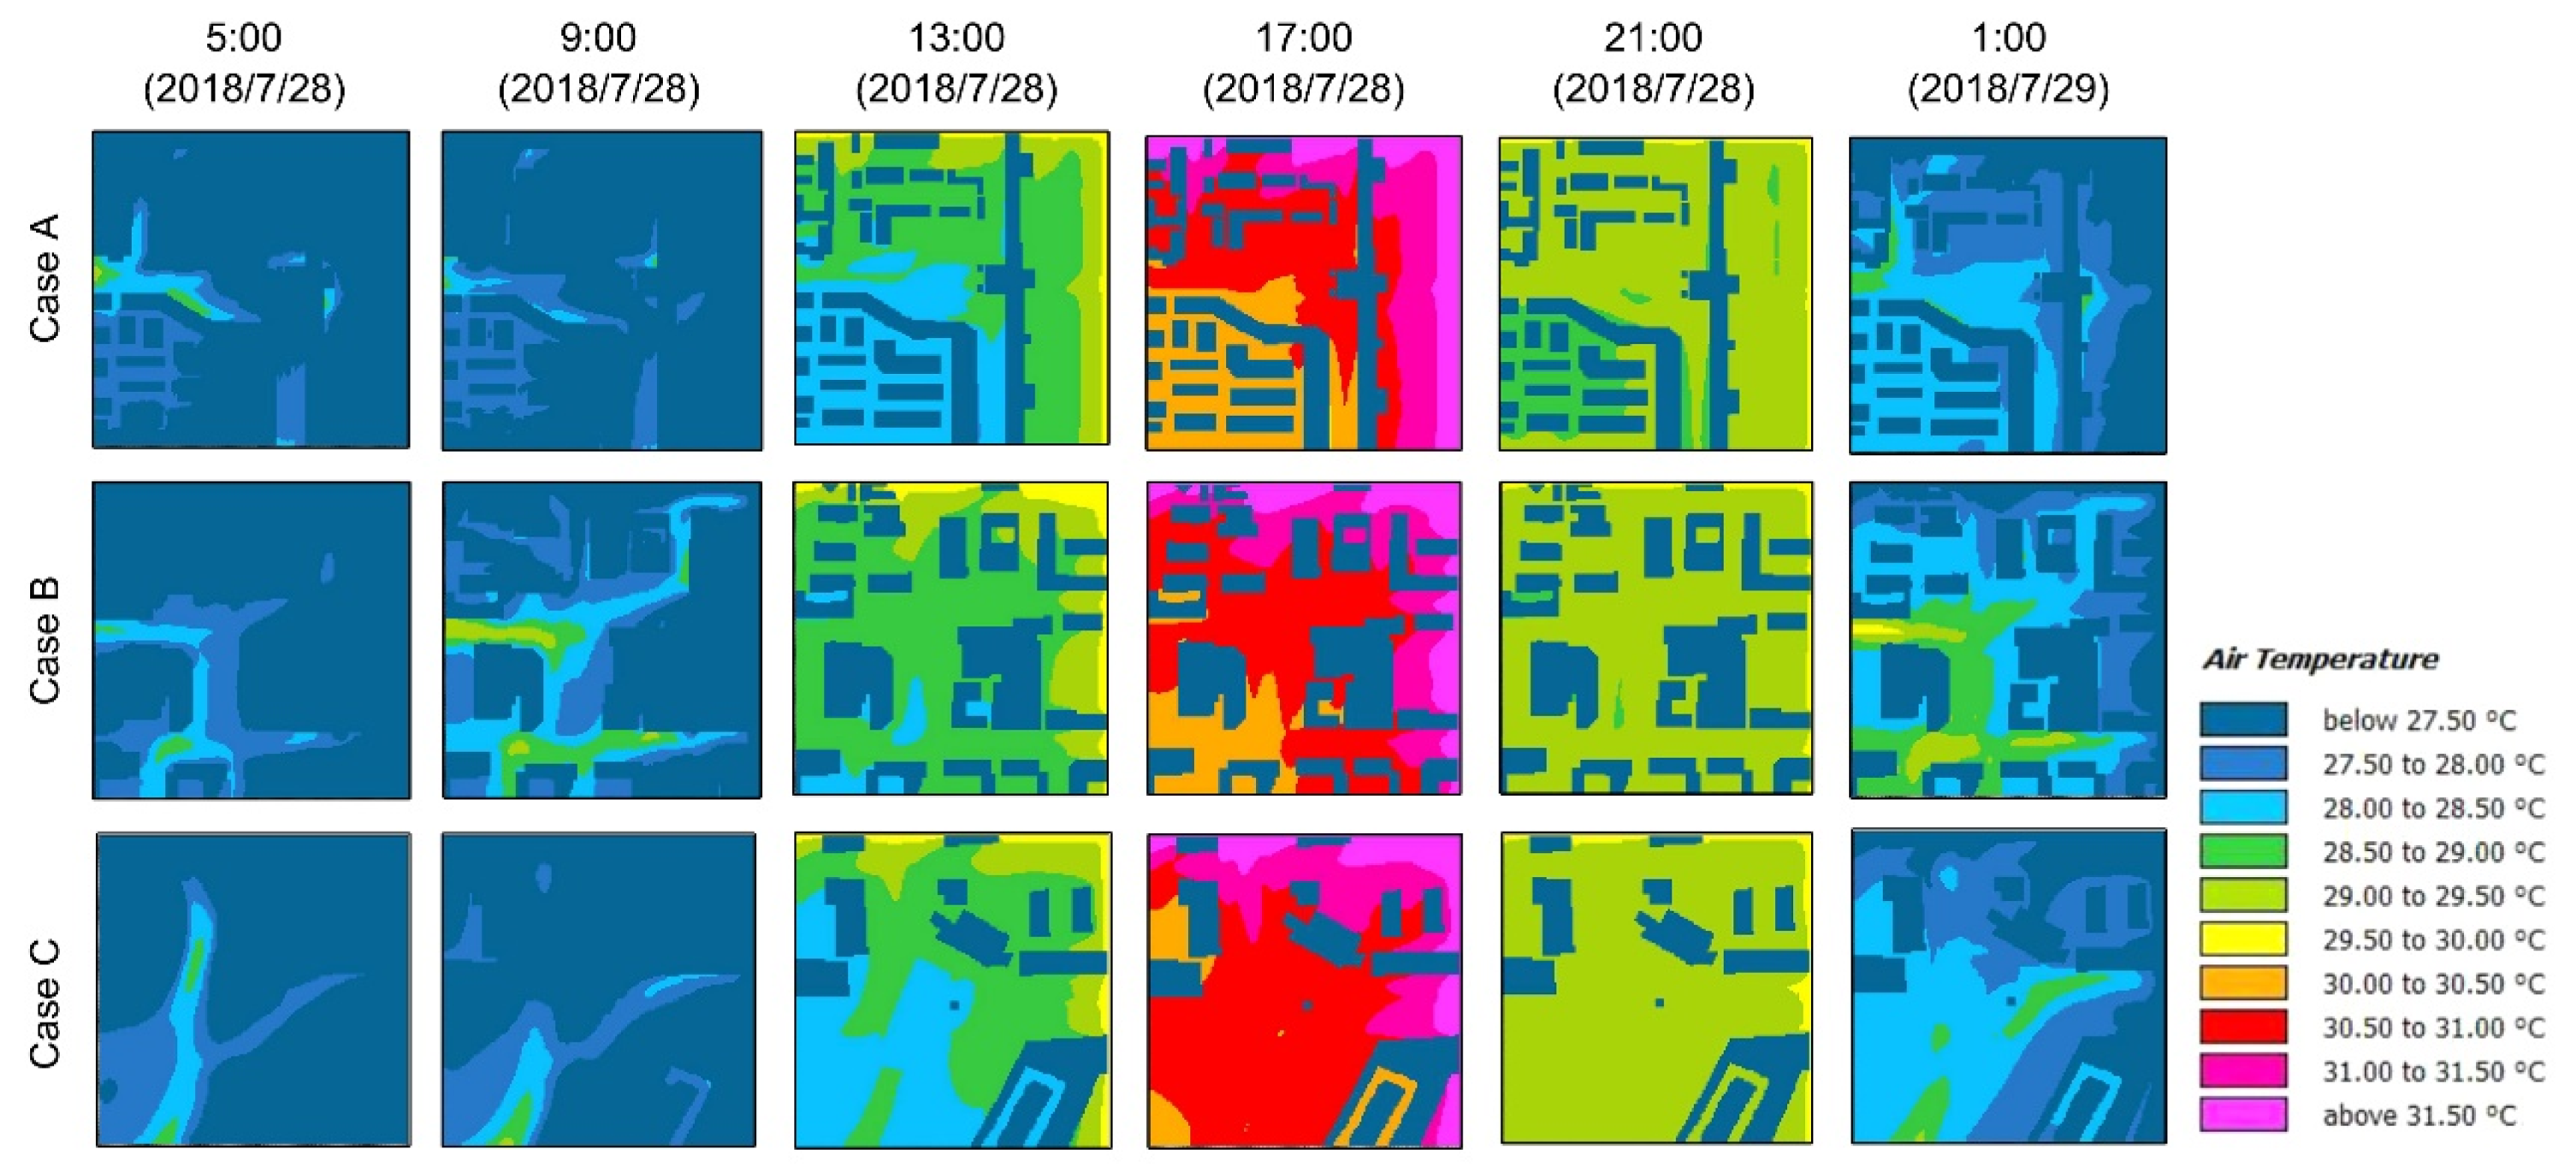
3.1. Current Situation Analysis
For our research needs, we first needed to simulate and analyze the status quo of the three case models. The simulated time is a typical summer day. From the simulation cycle, we chose six time points: 5:00, 9:00, 13:00, 17:00, 21:00, and 1:00 in the morning of the next day. The air temperature at 1.8 m from the ground was derived from the data, and the simulation results are shown in
Figure 7.
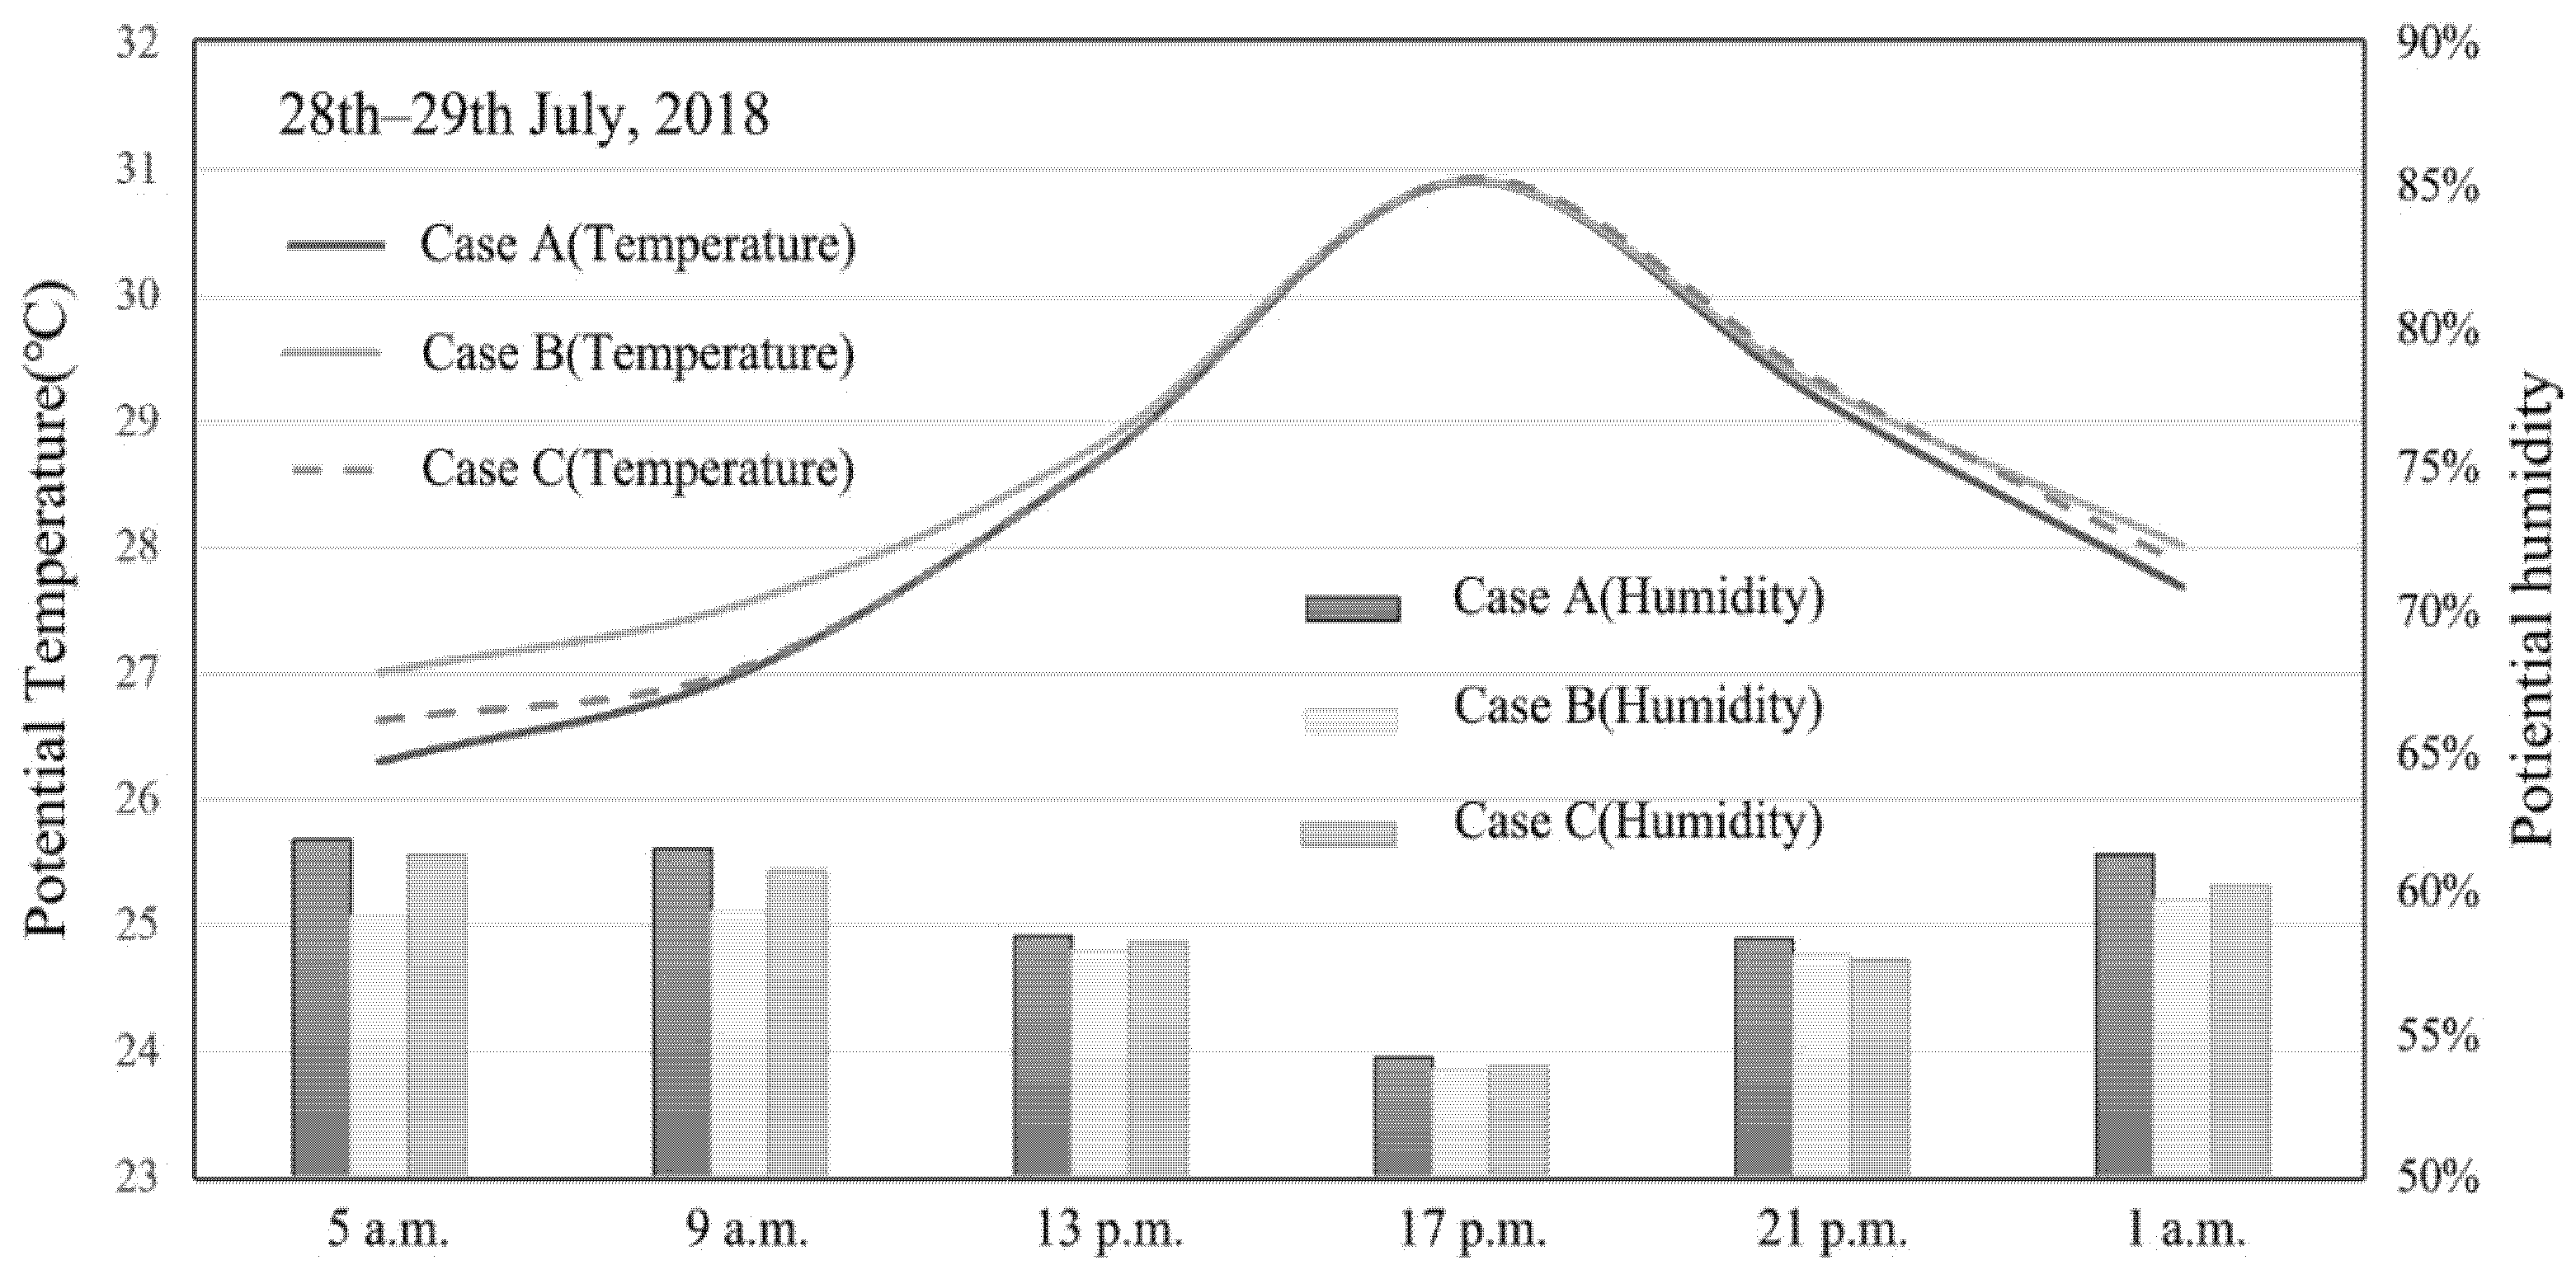
Looking at the average temperature and humidity changes in a summer day in
Figure 8, it can be seen that for the temperature, Case B > Case C > Case A. Basically, high plot ratio leads to the higher air temperature in the summer. However, according to the floor area ratio shown in
Table 2 (Case C > Case B > Case A), Case C is not showing a higher air temperature than that in Cases A and B. The average temperature in Case C (with 2.7% of pocket park) is 0.37 °C higher than that in Case A (with 1.4% of pocket park) and 0.22 °C lower than that in Case B (with 1.0% of pocket park). This is caused by the different green-area ratio and tree density of pocket park in the three blocks, which created a stronger cooling effect from green space in Case C than that in Case B and Case A. Meanwhile, green space in Case A has a stronger effect on green penetration than that in Case B. This demonstrated that tree density of the green space affects the thermal environment in the blocks. Therefore, an optimal design method for pocket parks in different districts should be proposed by selecting the tree density and spatial layout.
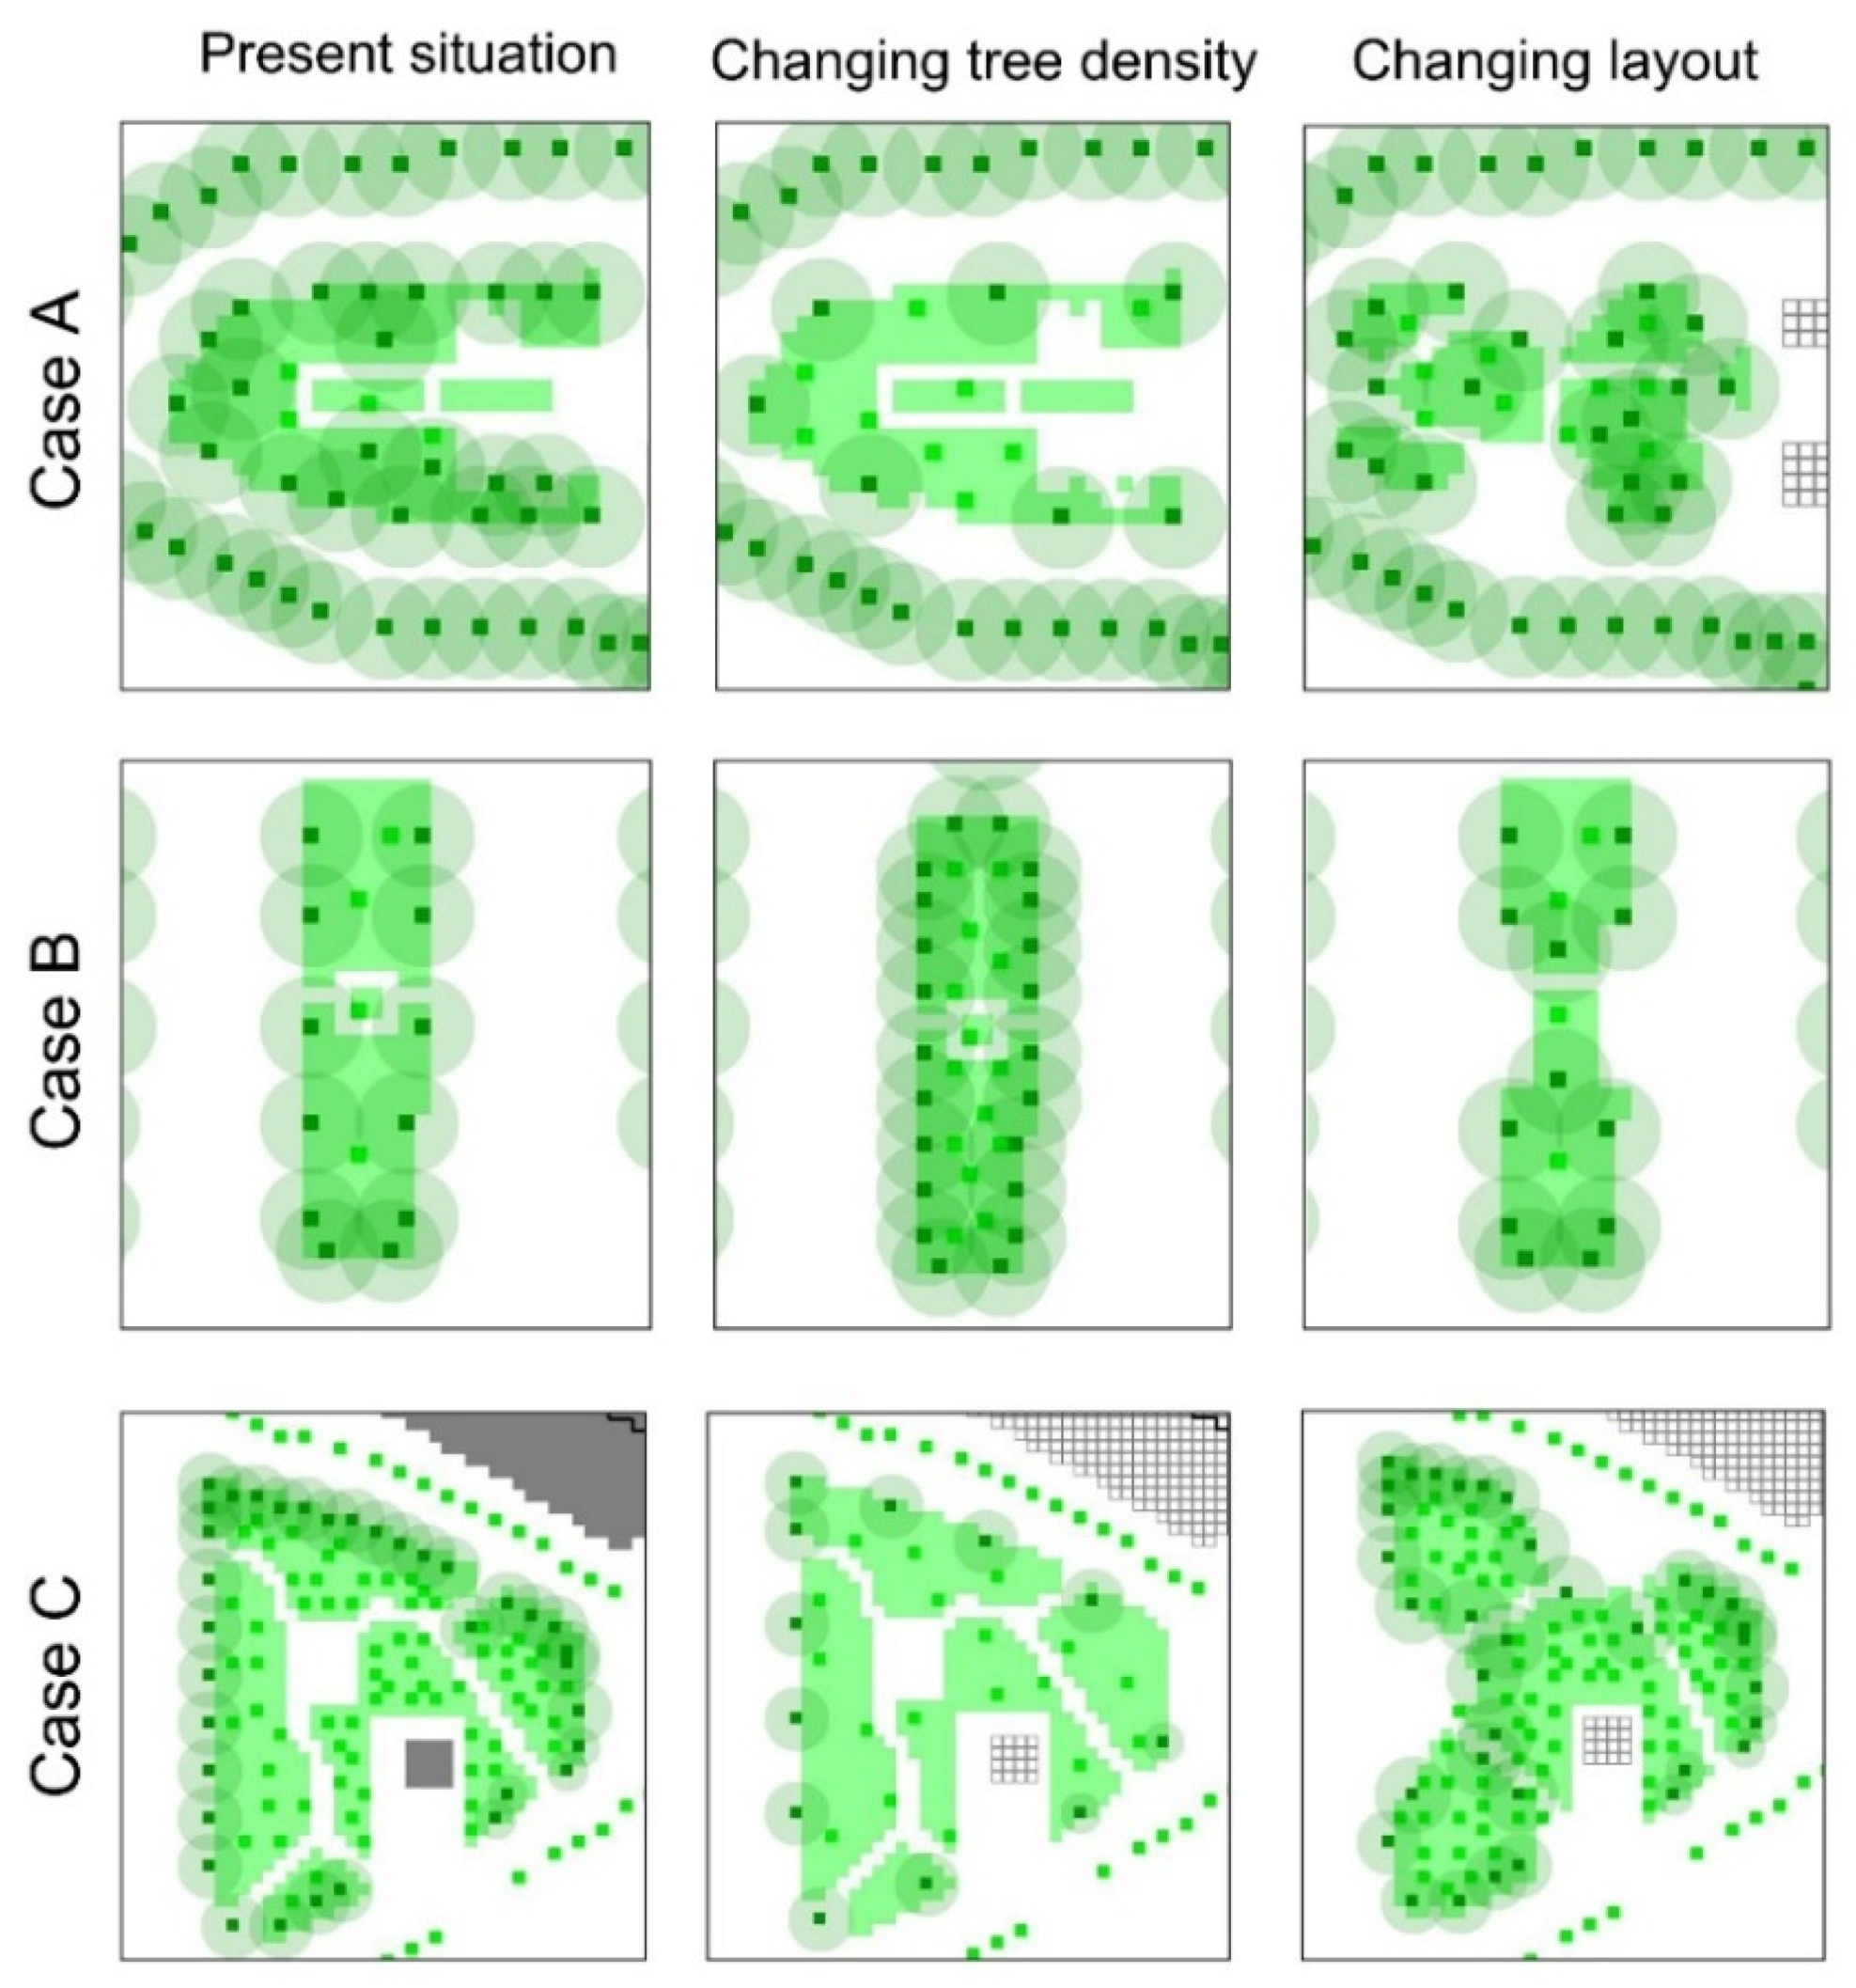
3.2. Research on the Optimization Method
3.2.1. Environmental Effects of Tree Density
Most pocket parks in Xi’an have high greening rates because of grassland. They are rich in vegetation species, but there is a large range in terms of tree density as shown in
Table 1. Currently, the tree density is high in some parks and low in others. Therefore, to increase the rationality of the optimization scheme, we did not change the tree density in one direction; instead, we reduced the arbor density in the pocket parks with higher arbor density and increased the tree density in the pocket parks with lower arbor density. Two groups of samples with different tree densities, the group with high tree density (0.02~0.04 tree/m
2) and the group with low tree density (0.01~0.016 tree/m
2), were used to obtain extensive results of the different arbor densities in each pocket park case, as shown in
Table 7.
Considering the control group, our change in the current tree density was not a simple and consistent increase. This study mainly explores this principle. Therefore, to express the comparison results more clearly, the temperature data information in
Table 8 are classified according to the tree density, rather than the present situation and after changing the tree density.
It can be seen from
Figure 9,
Figure 10 and
Figure 11 that the results of the six time points are unified. Additionally,
Table 8 provides more specific data. The average temperature of the block in the high tree-density group is lower than that in the low tree-density group. The temperature difference is generally between 0.1 °C and 0.3 °C. The temperature difference during the day is higher than that at night, and the specific difference value can be found in
Table 8. Meanwhile, the humidity of Case B increased by 0.3% at all six time points.
This means that pocket parks with higher tree densities had a relatively stronger green penetration in the various blocks. This effect was more obvious in high-density, high-rise urban blocks. For low-density, low-rise blocks, this effect was very limited.
Therefore, high-rise city blocks are more suitable for pocket parks with high tree densities. For low-density and low-rise urban blocks, the influence of tree density on the thermal environment of the block is relatively limited. At this time, the appropriate tree density should be selected according to the visibility, ventilation, expected crowds, and other factors of the pocket park.
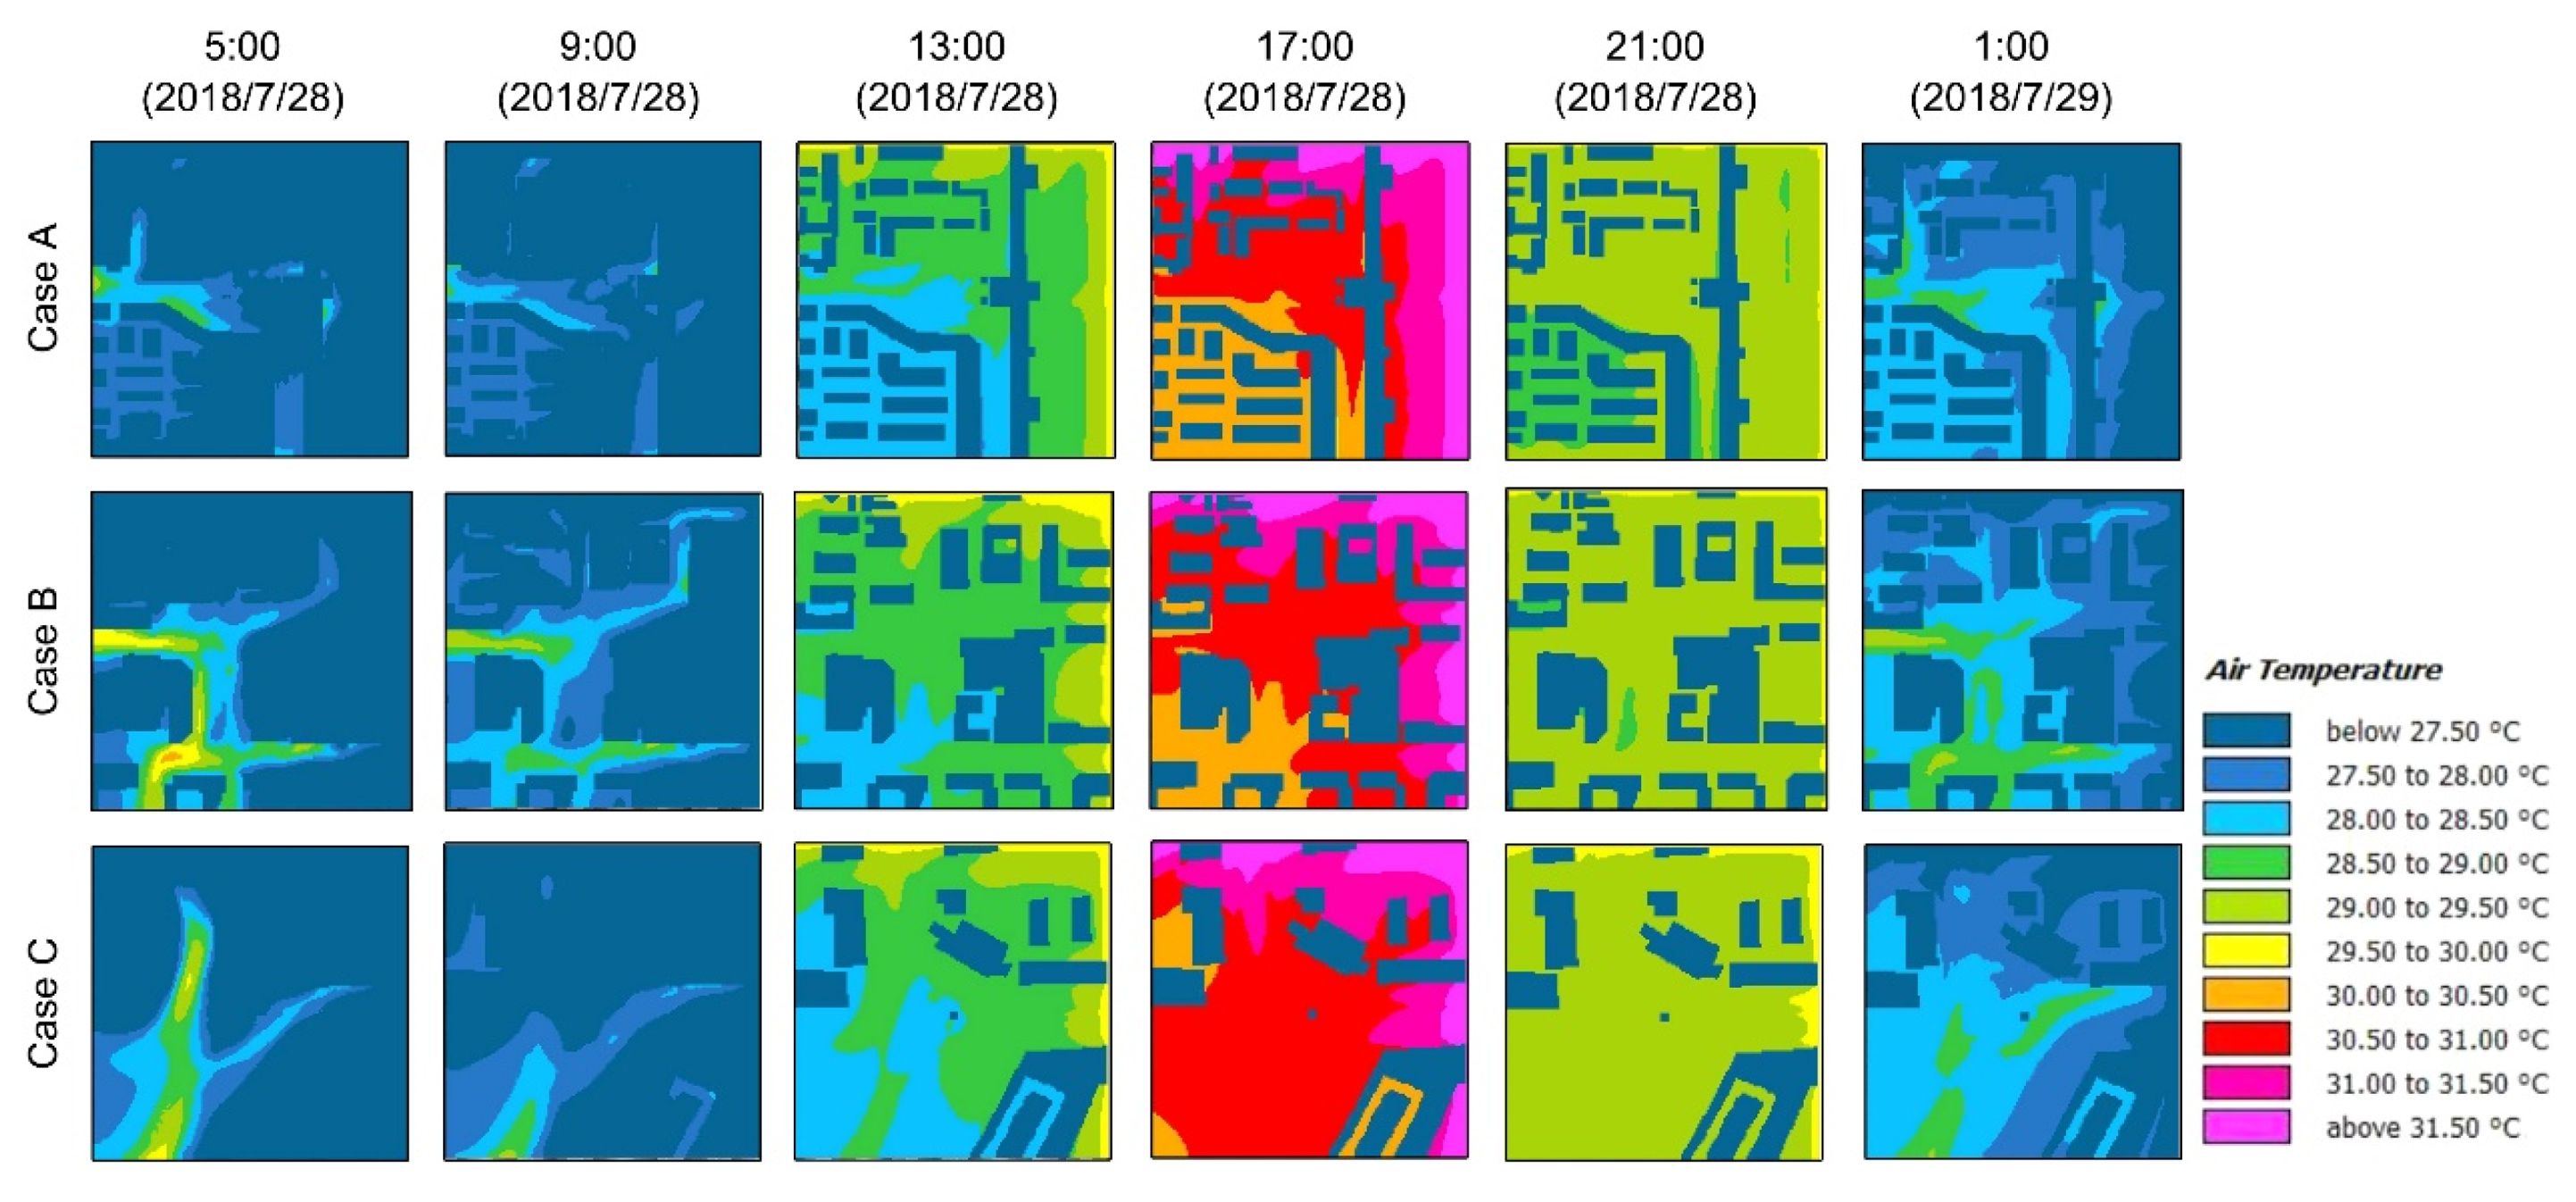
3.2.2. Environmental Impacts of Vegetation Layout
Changing the layout of greenery includes changes to the vegetation coverage and tree density. For different blocks, the impact of the spatial layout is often different. A specific way to change the layout can be seen in
Figure 6. The results for this new layout are shown in
Figure 12 and
Figure 13 and
Table 9.
It can be seen from the box diagrams in
Figure 9,
Figure 10 and
Figure 11, and
Table 9 that the results of the six time points were still unified and mutually confirmed. No matter the time point, the change in the average temperature in Case A and Case B was very small (less than 0.01 °C), while for Case C, at 5 a.m., the average temperature of the whole block was 0.19 °C lower than that of the original block. The values at the five subsequent time points were 0.12 °C, 0.18 °C, 0.17 °C, 0.13 °C, and 0.15 °C, respectively.
After the green layout was changed to an open-space layout, the humidity in Case B remained unchanged because of the small change in layout. The average humidity in Cases A and C increased by 0.2%.
For different streets and pocket parks, different green layouts will produce different effects. For a block with low-rise, low-density buildings in Case A, the impacts of open and closed green layouts on the thermal environment of the block were not much different. At this time, we should incorporate other factors (such as crowd demand, visibility of the pocket park, etc.) to select the appropriate pocket park. For the high-rise and high-density commercial block in Case C, the open green-space layout is obviously better than the closed green-space layout in improving the thermal environment and green penetration of the urban block. This may be because, in the case of high tree density, the open green-space layout is conducive to air circulation; the wind takes away heat and thus improves the thermal environment of the block. Case B has no reference value because its greening rate is high, and it is difficult to change the greening layout.
4. Discussion
Many studies have proved that it is feasible to use digital software simulation. Additionally, scholars continue to put forward new research methods based on software simulation [
37]. In recent years, the ENVI-met simulation method for urban microclimate environments with different climate characteristics has been frequently applied in academic research [
33,
38,
39]. Deep exploration of the mechanism of urban climate change is the key to urban environment improvement and related policy development. Urban environment simulation can effectively evaluate the current situation of the urban environment and environmental improvement technology. ENVI-met and other simulation software can calculate and analyze the urban microscale environment, and the minimum resolution can reach 0.5 m. ENVI-met is constantly being optimized, and factors such as the building exterior-wall structure, building window-design characteristics, building internal-heat removal, and various physical characteristics of different vegetation types are added to the existing ENVI-met program. Digital model simulation has become one of the main academic research methods because of its low cost, high speed, and easy implementation.
For Case A, the average temperature decreased by 0.33 °C and 0.22 °C, respectively, and the humidity increased by 0.8% and 0.44%; for Case B, the temperature decreased by 0.42 °C and 0.31 °C, and the humidity increased by 0.67% and 0.37%, respectively; for Case C, the temperature decreased by 0.53 °C and 0.40 °C, and the humidity increased by 0.95% and 0.6%, respectively. For Case A and Case B of relatively low-development intensity and relatively closed green spaces, the impact of green-layout change on the thermal environment was limited. For high-development-intensity commercial Case C, the air temperature decreased by 0.15 °C, and the humidity increased by 0.22% after the space layout was changed to an open type. This shows that the cooling effect of high-density trees is stronger for blocks with different development intensities. For the more open high-development-intensity blocks, the open green-space layout can effectively alleviate the problem of thermal environment deterioration. In Xi’an, most green spaces are located in the small spaces around buildings. Their size and shape are difficult to change, but we can increase the cooling effect of green spaces by changing the tree density and spatial layout.
At the same time, this study also has many shortcomings to be discussed. For the urban microscale environment simulation model, the difference between the simulation results in the critical area of the model and the actual urban environment is an important factor leading to errors in the simulation results. The software used in this paper does not consider the heat dissipation of HVAC systems and the heat flux related to transportation. In addition, it can only consider homogeneous parameters between all buildings. Therefore, the indoor temperature, transmittance, and albedo of all buildings are fixed and the same. On the other hand, due to time constraints, in this paper, we selected three representative urban blocks with different development intensities in the second ring road of Xi’an. However, we did not perform a horizontal comparison of pocket parks in urban blocks with the same development intensity.
In future research, these parameters should be listed among the missing parameters to improve the accuracy of the design method for pocket parks. Finally, future work should combine the evaluation in this study with an investigation of the specific climate in different urban areas, taking into account the outdoor comfort level of Xi’an under the climate conditions.
5. Conclusions
In this research, we compared design strategies for pocket parks in three Xi’an city blocks with existing parks by changing the parks’ tree density and green-space layout.
We demonstrated that the higher the tree density, the greater the cooling effect is on the surrounding thermal environment. The average temperature of the block was reduced by 0.33 °C at most with an increase in the tree density. Therefore, from the perspective of improving the thermal environment of the block, urban districts of different development intensities, especially high-density commercial blocks, are suitable for pocket parks with high tree densities. The importance of other design factors should also be evaluated during the design process, and an appropriate tree density in combination with the visibility, ventilation, expected crowds, and other factors of the pocket park should be considered.
In blocks with low development intensity and low wind speed, the difference in the effect between an open green layout and a closed green layout on the thermal environment of the block was not significant, with only a 0.01 °C difference. In this case, the appropriate pocket park should be selected with other factors (such as crowd demand, pocket-park visibility, etc.). For commercial districts with high development intensity and higher open wind speed, an open green-space layout was obviously better than a closed green-space layout in improving the thermal environment and green penetration of the urban block.
This research provides an evaluation and discussion of vegetation planting patterns and suggestions according to interactions between urban typology and park design, which can guide vegetation system development in urban areas.
Author Contributions
Conceptualization, Y.W. and D.Z.; methodology, J.H. and Z.G.; software, J.H. and Z.G.; validation, J.H., Y.W. and Z.G.; formal analysis, Y.W., J.H. and Z.G.; investigation, J.H., Y.W. and D.Z.; writing—original draft preparation, J.H.; writing—review and editing, Y.W. and J.H.; visualization, Y.W. and J.H.; supervision, Y.W. and D.Z.; project administration, Y.W. and D.Z.; funding acquisition, Y.W. All authors have read and agreed to the published version of the manuscript.
Funding
This research was funded by the National Natural Science Foundation of China, grant number 52078416.
Informed Consent Statement
Not applicable.
Data Availability Statement
The data presented in this study are available on request from the corresponding author.
Conflicts of Interest
The authors declare no conflict of interest.
References
- Dai, T.; Tang, W. Statistical Regular Pattern of Annual Temperature Change in Xi’an. J. Hum. Inst. Eng. 2019, 29, 61–65. [Google Scholar] [CrossRef]
- Liu, W.; Feddema, J.; Hu, L.; Zung, A.; Brunsell, N. Seasonal and Diurnal Characteristics of Land Surface Temperature and Major Explanatory Factors in Harris County, Texas. Sustainability 2017, 9, 2324. [Google Scholar] [CrossRef] [Green Version]
- Morabito, M.; Crisci, A.; Messeri, A.; Orlandini, S.; Raschi, A.; Maracchi, G.; Munafò, M. The impact of built-up surfaces on land surface temperatures in Italian urban areas. Sci. Total Environ. 2016, 551–552, 317–326. [Google Scholar] [CrossRef] [PubMed]
- Geletič, J.; Lehnert, M.; Savić, S.; Milošević, D. Inter-/intra-zonal seasonal variability of the surface urban heat island based on local climate zones in three central European cities. Build. Environ. 2019, 156, 21–32. [Google Scholar] [CrossRef]
- Top, S.; Milošević, D.; Caluwaerts, S.; Hamdi, R.; Savić, S. Intra-urban differences of outdoor thermal comfort in Ghent on seasonal level and during record-breaking 2019 heat wave. Build. Environ. 2020, 185, 107103. [Google Scholar] [CrossRef]
- Pecelj, M.; Matzarakis, A.; Vujadinović, M.; Radovanović, M.; Vagić, N.; Đurić, D.; Cvetkovic, M. Temporal Analysis of Urban-Suburban PET, mPET and UTCI Indices in Belgrade (Serbia). Atmosphere 2021, 12, 916. [Google Scholar] [CrossRef]
- Lee, H.; Mayer, H.; Chen, L. Contribution of trees and grasslands to the mitigation of human heat stress in a residential district of Freiburg, Southwest Germany. Landsc. Urban Plan. 2016, 148, 37–50. [Google Scholar] [CrossRef]
- Shashua-Bar, L.; Pearlmutter, D.; Erell, E. The influence of trees and grass on outdoor thermal comfort in a hot-arid environment. Int. J. Climatol. A J. R. Meteorol. Soc. 2011, 31, 1498–1506. [Google Scholar]
- Lau, S.S.Y.; Yang, F.; Tai, J.; Wu, X.L.; Wang, J. The study of summer-time heat island, built form and fabric in a densely built urban environment in compact Chinese cities: Hong Kong, Guangzhou. Int. J. Sustain. Dev. 2011, 14, 30. [Google Scholar] [CrossRef]
- Ng, E.; Chen, L.; Wang, Y.; Yuan, C. A study on the cooling effects of greening in a high-density city: An experience from Hong Kong. Build. Environ. 2011, 47, 256–271. [Google Scholar] [CrossRef]
- Liu, X.; Wang, C.; Jing, Y.; Mai, B. Annual variation characteristics and simulation analysis of surface temperature on four urban underlying surfaces. J. Trop. Meteorol. 2011, 27, 373–378. [Google Scholar]
- Fu, Y. Heat island Changsha -from urban cooling to overall ecology. Green Build. Mater. 2021, 2, 75–76. [Google Scholar] [CrossRef]
- Chen, Q.; Hang, M.; Guo, Z. Spatial evolution characteristics of summer surface temperature in Xi’an city. Sci. Surv. Mapp. 2020, 45, 139–146. [Google Scholar] [CrossRef]
- Li, G.; Zhou, M.; Cai, Y.; Zhang, Y.; Pan, X. Does temperature enhance acute mortality effects of ambient particle pollution in Tianjin City, China. Sci. Total Environ. 2011, 409, 1811–1817. [Google Scholar] [CrossRef]
- Wong, L.P.; Alias, H.; Aghamohammadi, N.; Aghazadeh, S.; Sulaiman, N.M.N. Urban heat island experience, control measures and health impact: A survey among working community in the city of Kuala Lumpur. Sustain. Cities Soc. 2017, 35, 660–668. [Google Scholar] [CrossRef]
- Wang, Y.; Jie, W.; Lei, X. Climate impact assessment of Shaanxi Province in 2010. Shaanxi Meteorol. 2011, 04, 23–26. [Google Scholar]
- Liu, H.; Huang, B.; Zhan, Q.; Gao, S.; Li, R.; Fan, Z. The influence of urban form on surface urban heat island and its planning implications: Evidence from 1288 urban clusters in China. Sustain. Cities Soc. 2021, 71, 102987. [Google Scholar] [CrossRef]
- Xintong, C.; Zhitai, W.; Yu, B. Cool island effects of urban remnant natural mountains for cooling communities: A case study of Guiyang, China. Sustain. Cities Soc. 2021, 71, 102983. [Google Scholar]
- Han, B.; Luo, Z.; Liu, Y.; Zhang, T.; Yang, L. Using Local Climate Zones to investigate Spatio-temporal evolution of thermal environment at the urban regional level: A case study in Xi’an, China. Sustain. Cities Soc. 2022, 76, 103495. [Google Scholar] [CrossRef]
- Luo, X.; Yu, C.W.; Zhou, D.; Gu, Z. Challenges and adaptation to urban climate change in China: A viewpoint of urban climate and urban planning. Indoor Built Environ. 2019, 28, 1157–1161. [Google Scholar] [CrossRef]
- Zhang, M. Study on the Distribution Patterns and Predictive Model of Solar Radiation in Urban Street Canyon Based on Panoramic Images—Take Xi’an as an Example. Master’s Thesis, Xi’an University of Architecture and Technology, Xi’an, China, 2021. [Google Scholar]
- Feng, X. Study of the Environmental Effects of Urban Green Space and Wind. Chin. Landsc. Archit. 2010, 26, 82–85. [Google Scholar]
- Zhang, B.; Guo, J.; Liu, Y. Research on Thermal Environment Effect of the Vegetation Characteristics and Morphological Features of Urban Green Patches. Chin. Landsc. Archit. 2010, 26, 92–96. [Google Scholar]
- Lin, P.; Lau, S.S.Y.; Qin, H.; Gou, Z. Effects of urban planning indicators on urban heat island: A case study of pocket parks in high-rise high-density environment. Landsc. Urban Plan. 2017, 168, 48–60. [Google Scholar] [CrossRef]
- Wang, Y.; Zacharias, J. Landscape modification for ambient environmental improvement in central business districts—A case from Beijing. Urban For. Urban Green. 2015, 14, 8–18. [Google Scholar] [CrossRef]
- Wang, Y.; Akbari, H. The effects of street tree planting on Urban Heat Island mitigation in Montreal. Sustain. Cities Soc. 2016, 27, 122–128. [Google Scholar] [CrossRef]
- Li, Y.; Zhang, J.; Gu, R. Research on the Relationship between Urban Greening and the Effect of Urban Heat Island. Chin. Landsc. Archit. 2004, 1, 72–75. [Google Scholar]
- Nordh, H.; Hartig, T.; Hagerhall, C.M.; Fry, G. Components of small urban parks that predict the possibility for restoration. Urban For. Urban Green. 2009, 8, 225–235. [Google Scholar] [CrossRef]
- Nordh, H.; Østby, K. Pocket parks for people—A study of park design and use. Urban For. Urban Green. 2013, 12, 12–27. [Google Scholar] [CrossRef]
- Li, K.; Liu, X.; Zhou, J. Impact of environmental characteristics in urban green spaces on outdoor thermal environment: A case study of Wuhan City, China. Indoor Built Environ. 2019, 28, 1217–1236. [Google Scholar] [CrossRef]
- Zhang, J.; Gou, Z.; Lu, Y. Outdoor thermal environments and related planning factors for subtropical urban parks. Indoor Built Environ. 2019, 30, 363–374. [Google Scholar] [CrossRef]
- Ma, J.; Chen, D. The Application of ENVI-met—A City Microclimate Simulation Software. Green Intell. 2013, 5, 56–58. [Google Scholar]
- Wang, Y.; Berardic, U.; Akbarib, H. Comparing the effects of urban heat island mitigation strategies for Toronto, Canada. Energy Build. 2015, 114, 2–19. [Google Scholar] [CrossRef]
- Yilmaz, S.; Külekçi, E.A.; Mutlu, B.E.; Sezen, I. Analysis of winter thermal comfort conditions: Street scenarios using ENVI-met model. Environ. Sci. Pollut. Res. 2021, 28, 63837–63859. [Google Scholar] [CrossRef] [PubMed]
- Qin, W.; Hu, R.; Li, Y.; Guo, Z. Numerical simulation of microclimate in Beijing typical residential area based on ENVI- met mode. J. Meteorol. Environ. 2015, 31, 56–62. [Google Scholar]
- Zhang, Y. Feasibility study on ENVI-met simulation of surface temperature. J. Chizhou Univ. 2017, 31, 81–82, 132. [Google Scholar] [CrossRef]
- Bajšanski, I.V.; Milošević, D.D.; Savić, S.M. Evaluation and improvement of outdoor thermal comfort in urban areas on extreme temperature days: Applications of automatic algorithms. Build. Environ. 2015, 94, 632–643. [Google Scholar] [CrossRef]
- Bruse, M. The Influences of Local Environmental Design on Microclimate-Development of a Prognostic Numerical Model ENVI-Met for the Simulation of Wind, Temperature and Humidity Distribution in Urban Structures; University of Bochum: Bochum, Germany, 1999. [Google Scholar]
- Paramita, B.; Fukuda, H.; Khidmat, R.; Matzarakis, A. Building Configuration of Low-Cost Apartments in Bandung—Its Contribution to the Microclimate and Outdoor Thermal Comfort. Buildings 2018, 8, 123. [Google Scholar] [CrossRef] [Green Version]
Figure 1.
Xi’an satellite photo with the three pocket parks selected for this study, and defined as low-development-intensity block (Case A), middle-development-intensity block (Case B), and high-development-intensity block (Case C).
Figure 1.
Xi’an satellite photo with the three pocket parks selected for this study, and defined as low-development-intensity block (Case A), middle-development-intensity block (Case B), and high-development-intensity block (Case C).
Figure 2.
Remote sensing map, CAD map, environmental simulation software (ENVI-met) model, and underlying urban surfaces.
Figure 2.
Remote sensing map, CAD map, environmental simulation software (ENVI-met) model, and underlying urban surfaces.
Figure 3.
The location of measurement points. (Points 1, 2, 3 and 4 are presenting the exact locations of field measurements).
Figure 3.
The location of measurement points. (Points 1, 2, 3 and 4 are presenting the exact locations of field measurements).
Figure 4.
(a) The comparison between the ENVI-met simulation results and the measured results. (b) The correlation between the simulation and measurement results on 26 July 2019.
Figure 4.
(a) The comparison between the ENVI-met simulation results and the measured results. (b) The correlation between the simulation and measurement results on 26 July 2019.
Figure 5.
The ENVI-met model of no-pocket park in three blocks.
Figure 5.
The ENVI-met model of no-pocket park in three blocks.
Figure 6.
Discussion on the optimization strategy.
Figure 6.
Discussion on the optimization strategy.
Figure 7.
Image of air temperature distribution with current planning situation on 28 July 2018, and 29 July 2018 (z = 1.8 m).
Figure 7.
Image of air temperature distribution with current planning situation on 28 July 2018, and 29 July 2018 (z = 1.8 m).
Figure 8.
ENVI-met simulation results of current situation about the average of temperature and a humidity in the whole block (300 m × 300 m) on 28 July 2018, and 29 July 2018.
Figure 8.
ENVI-met simulation results of current situation about the average of temperature and a humidity in the whole block (300 m × 300 m) on 28 July 2018, and 29 July 2018.
Figure 9.
Air temperature distribution in daytime on 28 July 2018.
Figure 9.
Air temperature distribution in daytime on 28 July 2018.
Figure 10.
Air temperature distribution in the night on 28 July 2018 and 29 July 2018.
Figure 10.
Air temperature distribution in the night on 28 July 2018 and 29 July 2018.
Figure 11.
Simulation results of the air temperature and relative humidity changes during the day.
Figure 11.
Simulation results of the air temperature and relative humidity changes during the day.
Figure 12.
Air temperature distribution after changing the density of trees on 28 July 2018 and 29 July 2018 (z = 1.8 m).
Figure 12.
Air temperature distribution after changing the density of trees on 28 July 2018 and 29 July 2018 (z = 1.8 m).
Figure 13.
The image of air temperature distribution after layout optimization on 28 July 2018 and 29 July 2018 (z = 1.8 m).
Figure 13.
The image of air temperature distribution after layout optimization on 28 July 2018 and 29 July 2018 (z = 1.8 m).
Table 1.
The proportions of the surface coverage in three blocks (300 m × 300 m).
Table 1.
The proportions of the surface coverage in three blocks (300 m × 300 m).
| | Case A | Case B | Case C |
|---|
| Architecture (%) | 28.4 | 38.6 | 25.5 |
| Asphalt road (%) | 14.2 | 15.8 | 16.4 |
| Pavement 1 (%) | 12.8 | 19.7 | 12.3 |
| Pavement 2 (%) | 38.6 | 24.9 | 43.1 |
| Water (%) | 4.6 | 0 | 0 |
| Pocket Park (%) | 1.4 | 1.0 | 2.7 |
Table 2.
Floor-area ratio of the whole block (300 m × 300 m).
Table 2.
Floor-area ratio of the whole block (300 m × 300 m).
| | Case A | Case B | Case C |
|---|
| Floor area ratio | 1.23 | 2.47 | 4.72 |
Table 3.
The areas of three pocket parks and the proportion of green space and sidewalk in these three parks.
Table 3.
The areas of three pocket parks and the proportion of green space and sidewalk in these three parks.
| | Case A | Case B | Case C |
|---|
| Green space (m2) | 964 | 868 | 2064 |
| Sidewalk (m2) | 320 | 36 | 404 |
| Total park area (m2) | 1284 | 904 | 2468 |
Table 4.
Grassland and 3D plant data in ENVI-met database. Leaf Area Density (LAD) means the total plant-leaf area per unit community volume; Root Area Density (RAD) means the total plant-root area per unit community volume. LAD and RAD are two different physical values, which are used to describe the lushness of branches and leaves of a single tree. Albedo is a physical value used to describe the radiation that is absorbed and reflected by the surface of vegetation.
Table 5.
Underlying surface treatment in ENVI-met.
Table 5.
Underlying surface treatment in ENVI-met.
| TYPE | Underlying Surface |
|---|
| Architecture | Unsealed Soil (0000LS) |
| Asphalt road | Asphalt Road (0100ST) |
| Pocket park | Loamy Soil (000000) |
| Pavement 1 | Granit pavement (0100GS) |
| Pavement 2 | Concrete Pavement Light (0100PL) |
| Water | Deep water (0100ww) |
Table 6.
Simulated meteorological parameters.
Table 6.
Simulated meteorological parameters.
| Type | Parameters |
|---|
| Date | 27 July 2018 |
| Start | 22:00 |
| Simulation time | 30 h |
| Wind speed | 2.5 m/s |
| Wind direction | Northeast |
| Temperature | 28 °C~32 °C |
Table 7.
Pocket-park area, tree number, and tree density before and after the change.
Table 7.
Pocket-park area, tree number, and tree density before and after the change.
| | | Case A | Case B | Case C |
|---|
| Present situation | Park area (m2) | 1284 | 2468 | 904 |
| Number of Trees | 26 | 87 | 14 |
| Density (Tree/m2) | 0.0203 | 0.0353 | 0.0155 |
| After changing the tree density | Park area (m2) | 1284 | 2468 | 904 |
| Number of Trees | 16 | 33 | 37 |
| Density (Tree/m2) | 0.0125 | 0.0134 | 0.0409 |
Table 8.
The average temperature of the three cases in the high-density group and the low-density group.
Table 8.
The average temperature of the three cases in the high-density group and the low-density group.
| | Time | Case A | Case B | Case C |
|---|
| High tree density group | 5:00 a.m. | 26.30 | 26.89 | 26.63 |
| 9:00 a.m. | 27.00 | 27.44 | 27.04 |
| 13:00 p.m. | 28.70 | 28.61 | 28.71 |
| 17:00 p.m. | 30.91 | 30.72 | 30.93 |
| 21:00 p.m. | 29.17 | 29.13 | 29.32 |
| 1:00 a.m. | 27.69 | 27.89 | 27.87 |
| Low tree density group | 5:00 a.m. | 26.43 | 27.01 | 26.85 |
| 9:00 a.m. | 27.16 | 27.55 | 27.31 |
| 13:00 p.m. | 28.87 | 28.83 | 29.02 |
| 17:00 p.m. | 31.08 | 30.92 | 31.21 |
| 21:00 p.m. | 29.31 | 29.27 | 29.56 |
| 1:00 a.m. | 27.82 | 28.02 | 28.09 |
Table 9.
The average temperature of the three cases in the open green layout group and the closed green layout group.
Table 9.
The average temperature of the three cases in the open green layout group and the closed green layout group.
| | Time | Case A | Case B | Case C |
|---|
| Open green layout | 5:00 a.m. | 26.31 | 27.01 | 26.44 |
| 9:00 a.m. | 27.01 | 27.55 | 26.92 |
| 13:00 p.m. | 28.70 | 28.83 | 28.53 |
| 17:00 p.m. | 30.91 | 30.92 | 30.76 |
| 21:00 p.m. | 29.16 | 29.27 | 29.19 |
| 1:00 a.m. | 27.69 | 28.02 | 27.73 |
| Closed green layout | 5:00 a.m. | 26.30 | 27.01 | 26.63 |
| 9:00 a.m. | 27.00 | 27.55 | 27.04 |
| 13:00 p.m. | 28.70 | 28.83 | 28.71 |
| 17:00 p.m. | 30.91 | 30.92 | 30.93 |
| 21:00 p.m. | 29.17 | 29.27 | 29.32 |
| 1:00 a.m. | 26.30 | 27.01 | 26.63 |
| Publisher’s Note: MDPI stays neutral with regard to jurisdictional claims in published maps and institutional affiliations. |
© 2022 by the authors. Licensee MDPI, Basel, Switzerland. This article is an open access article distributed under the terms and conditions of the Creative Commons Attribution (CC BY) license (https://creativecommons.org/licenses/by/4.0/).


