Abstract
Buildings consume energy, which is a major contributor to greenhouse gas emissions. In order to reduce their environmental impact, it is important to choose suitable building materials and energy source. The paper presents the results of a multi-variant analysis of five environmental impact categories (global warming potential, acidification, eutrophication, ozone layer depletion, and total use of primary energy) for a single-family house located in Poland in a 25-year life cycle. The tests were carried out for two different types of building structures (brick and wooden), two variants of external partition insulation, and four heat sources. The following computer programs were used for the calculations: OpenStudio and EnergyPlus, and One Click LCA. The analysis took into account the erection of the building in its shell and the energy consumption for heating in a 25-year life cycle. Studies have shown that when an electric heat source is used, the use stage has the greatest environmental impact, accounting for up to 80% of the total emissions over the life cycle. This ratio can be reduced by half in the case of a house with thicker external wall insulation and an eco-biomass boiler.
1. Introduction
Faced with global warming underway, it is of paramount importance to reduce greenhouse gas (GHG) emissions from the building stock, which generates one-third of global warming emissions [1]. Studies considering different types of buildings have shown that interventions in the construction sector can result in energy savings of 30% and thus significantly reduce their environmental impact [2]. To identify potential energy saving interventions, it is essential to understand how buildings use energy throughout their life cycle. Life cycle assessment (LCA) is a commonly used approach in this context, allowing the analysis of the building from the raw material supply stage of its construction, through the operational stage, including heating and cooling, to the demolition and processing of waste at the end of the life of the building [3]. Potential environmental impacts can be evaluated using a selected calculation procedure. These procedures form the LCIA (life cycle impact assessment) group. The purpose of classification is to organize and transform the LCI results into impact categories (the effects that technical objects have on the environment and their relationship to individual phenomena in nature) [4].
Buildings have a long life cycle; therefore, the impact of the use phase is in most cases greater than the impact of the production phase. Researchers estimate that this value ranges from 40% to 90% of energy consumption in the life cycle, depending on the climatic conditions and usage habits [5,6,7,8]. However, in the case of new buildings with very high energy efficiency, the ratio may be the opposite [9,10]. Moreover, minimization of energy consumption does not always lead to the most desirable results for the environment, because energy systems differ in the intensity of their impact [11,12]. Furthermore, the proportion of embodied emissions increases in the life cycle because operational emissions decrease due to decarbonization of electricity grids, improvements in heating, ventilation and air conditioning (HVAC) systems, and the implementation of passive energy efficiency measures [13]. Currently, in cold and transient climates, the main trend is to reduce the need for heating, which is achieved through better insulation of the building envelope and the use of improved HVAC systems. Following a significant reduction in the energy requirement of a building, the choice of building materials becomes another important factor to reduce the environmental impact of the life cycle [14]. However, some bona fide measures can result in higher embodied emissions than offset reductions achieved during the operation stage [15], as increasing the energy efficiency of buildings often requires more materials, equipment, and sometimes operational expenditure [9].
There is extensive research literature on the life cycle assessment of commercial and residential buildings. Due to the scope of this study, studies related to residential buildings are presented below.
The article by Islam et al. [16] presents the life cycle assessment and life cycle costs of typical Australian houses. The study showed how various roofs and floors affect the environment and life cycle costs in consecutive life stages of buildings (construction, operation, maintenance, and final disposal). The research also presents workable environmentally friendly solutions. The carbon footprint reduction using sustainable building materials and systems was also analyzed by Monahan and Powel [17]. Their study compared the carbon footprint of a low-energy, low-cost house constructed using a novel paneled modular timber frame system with two traditional British alternative scenarios. Compared to traditional constructions, the modern houses saw a 34% reduction in carbon content. In a similar study in Australia [18], wood products were found to reduce greenhouse gas emissions compared to other alternative materials. Dahlstrøm et al. [9] compared the environmental impact of single-family wooden houses in two building standards (the Norwegian standard and the passive house) with four different heating systems. Greenhouse gas emissions from the “cleanest design” were almost 30% lower compared to the standard alternative.
Evangelista et al. [19] showed that Brazilian single-family houses often have a greater environmental impact than multi-family buildings of similar size and standard; in addition, high-standard dwellings have higher environmental costs. The study showed that the operating phase represents 80% of the total energy demand in the life cycle. Alhazmi et al. [20] analyzed the life cycle of a typical single-family house in Saudi Arabia; the operational phase represented 95% of the total energy demand. In contrast, a study of a single-family house in Sweden [10], where most of the electricity comes from renewable energy sources, showed that the use phase was responsible only for 21% of total greenhouse gas emissions.
The purpose of the article by Georges et al. [21] was to show how the balance between profitability and environmental efficiency of heating systems in single-family houses with low heat demand (e.g., passive and low-energy houses) is changing. Some solutions that were optimal for buildings with higher net energy demand (e.g., 120 kWh∙m−2 per year), such as wood pellet boilers, required too high investment costs to be optimal for buildings with very low net energy needs. The carbon footprint study for a low-energy single-family house in Italy is also presented in the article by Blengini et al. [22]. Compared to traditional construction, where the dominant environmental impacts occur in the operation stage (related to heating), in a low-energy building, they were significantly reduced (4 times). In turn, the study by Rivera et al. [15] assessed the effectiveness of the application of five passive energy efficiency measures to reduce greenhouse gas emissions in the life cycle of high-rise buildings in Canada, with reference to future climate projections and different energy sources. It has been found that reducing the window-to-wall ratio was the most effective way to lower the total greenhouse gas emissions relating to the building envelope (approx. 28%). Depending on the scenario, increasing wall and roof insulation (e.g., extruded polystyrene) may increase the overall emissions. A good compromise between built-in and operational emissions was found when highly efficient HVAC systems (e.g., heat pumps) were implemented.
The literature shows that LCA can be a valuable tool for finding a trade-off between the desire to reduce energy consumption and environmental pressures as well as the additional material and energy expenditure required to design energy-efficient buildings.
2. Research Gap and Aim
Most of the research is based on the analysis of embodied and operational energy and the global warming potential index throughout the building life cycle. Only a few studies also take into account other categories of environmental impact. Therefore, this study aims to assess the potential environmental impact of a single-family model house in Poland in five impact categories: global warming, potential, acidification, eutrophication, ozone depletion, and the total use of primary energy. Few of the previous studies have looked at the overall LCA of single-family houses in the Central European climate scenario. Furthermore, this research takes into account human behavior including the instantaneous presence of occupants, the variability of ventilation airflow, and the opening of windows. Building operation is the important stage; therefore, the choice of energy calculation method is crucial. Typically, for such calculations, simplified engineering methods are used according to the methodology of energy certificates, which assume constant airflow and constant average internal gains. There are no life cycle analyses for buildings where an integrated computer simulation with a small time step to calculate heat demand was used.
By and large, structural elements in single-family houses are dissimilar to multi-family ones. The former offers many more possibilities to use wood as a building material. Therefore, two design alternatives (brick and wood) with two insulation levels according to the standard building and the passive building reequipments (BSTD, WSTD, BPASS, and WPASS) and four energy source options (coal, biomass, gas, electric) were analyzed for each of them. The analysis took into account the erection of the building in its shell stage and the energy consumption for heating in the life cycle. Cooling was not considered because air-conditioning devices are found only in 3% of Polish households [23]. The simulation results showed the most ecological solutions and quantitative benefits to the environmental impact of these solutions. The article is an extension of an earlier publication [24] that analyzed the life cycle costs and the global warming potential.
3. Methods
The LCA methodology was used to evaluate the environmental impact of a typical single-family house in Poland. From the LCA point of view, buildings are products, so an environmental analysis is carried out for all facilities. For this purpose, all individual products and processes are analyzed, which allows one to calculate an environmental effect. Methodology according to EN 15978: 2011 [25] refers to such phases of life as material production, construction, use and utilization of the building, which in turn are divided into even more detailed stages. For example, in the production phase, they are as follows: A1—extraction and production of raw materials, A2—transport of components and products, A3—manufacturing, A4—transport during construction of the building, and A5—construction and installation process. In these studies, the following life phases were taken into account: materials (A1–A4), transportation (A4), maintenance and replacement (B1–B5), and operational stage (B6) for 25 years (one generation). In terms of category A, the building was calculated in a closed shell stage; only heating energy was considered within the B6 scope; other components, that is, electricity and domestic hot water, did not change in the analyzed cases and were excluded from this assessment. Due to the duration of the analysis (25 years), the environmental cost associated with the demolition (end-of-life stage) was not considered (as some previous studies [26]).
The following midpoint impact categories were analyzed [27]: global warming (GWP; calculated over a 100-year time horizon with the AR4 metric), acidification (AP), eutrophication (EP), ozone depletion potential (ODP), and total primary energy use (TPE) using CML-IA methods. The CML methodology was created by the University of Leiden in the Netherlands in 2001 [28].
3.1. Research Object
Four variants of the same building with an area of 153 m2 located in Warsaw (52°15′ N and 21°00′ E) were considered. The differences result from the assumption of two different types of structures (brick and wooden frame) and two different thermal insulation standards for external partitions (Figure 1).
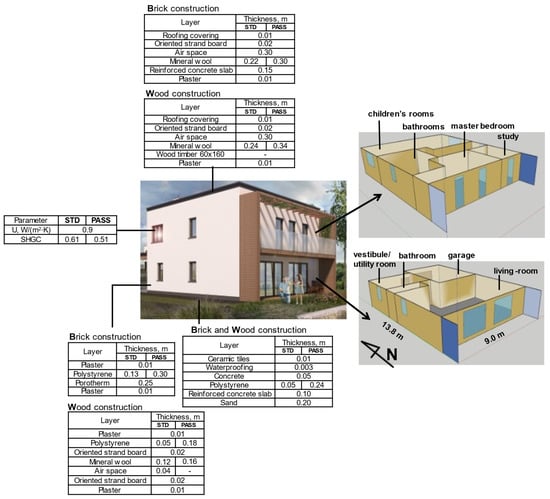
Figure 1.
The building under consideration and construction details.
The two-story building has a compact, regular shape. In traditional technology (the case indicated as B), the external walls are made of two-layer ceramic bricks and are insulated with polystyrene. The load-bearing internal walls are also made of ceramic blocks, while the partition walls are designed as light walls on a steel structure with gypsum-based sheathing. The ceilings are made with monolithic reinforced concrete. In a wooden frame building (the case indicated as W), the entire structure is based on the use of timber posts made of solid structural wood with a spacing of 62.5 cm. All wooden structural elements measure 60 × 160 mm. The space between the posts in the external walls is filled with rock wool, the entire structure is covered with oriented strand boards (OSB), and from the outside it is insulated with polystyrene. The internal load-bearing walls are filled with mineral wool and covered with plasterboards, while the partition walls are designed as light walls on a steel structure with gypsum sheathing. The ceilings are designed as beam ceilings insulated with mineral wool.
The design and construction of buildings in Poland must comply with applicable legal acts, a relevant document being the regulation on the technical conditions to be met by buildings and their location [29]. To meet the requirement regarding the heat transfer coefficient for the external walls and roofs included in the above-mentioned act, both the brick and the wooden building were adopted in the project. The building was modified to meet the criteria of the currently applicable standards [29] (the case indicated as STD), as well as those adopted for a passive house according to the guidelines of the Polish Institute of Passive House [30] (the case indicated as PASS). The insulation thicknesses for all cases are given in Figure 1.
As part of solar shading devices, a balcony and a pergola have been designed along the entire length of the southern façade. During the sunlight hours in summer, the glass surfaces are shaded, and in winter and during the transition period, they are exposed. Between April and October, shading coefficient resulting from the greenery is 0.4; while during the rest of the year, it amounts to 0.8. Internal blinds are installed into the windows to limit solar gains.
3.2. Heating System
A low-temperature central heating system was installed; the temperature control in the rooms was carried out by means of thermostatic valves and a weather regulator. The temperature set points in the rooms are presented in Table 1. The heating was turned off from June to August.

Table 1.
Indoor temperature in rooms.
Four heat sources were considered: an electric boiler (electricity is produced in a coal-fired power plant), gas boiler, coal boiler, and biomass boiler (wood pellets). To adjust the coal and biomass boilers to the operating parameters of the system, it was necessary to use a buffer tank to protect the system from overheating.
3.3. Simulation Model
The One Click LCA (2015) program [31] was used to simulate environmental impacts. The One Click LCA was developed by Bionova Ltd. and complies with the EN 15978:2011 standard [24]. In its database, the program uses environmental product declarations based on the ISO 14044:2006 [32] and EN 15804:2012 [33] standards. Construction materials data were entered to the program, along with their measurements (Table A1). In addition, the consumption of electricity and fuels for the heat source in the building were entered in order to calculate the operation stage.
The annual heating demand was calculated in the OpenStudio program [34] with the EnergyPlus program [35] as the calculation engine. These programs are well-validated and widely used in research. An integrated simulation was carried out with a 15-min time step, taking into account the instantaneous variability of the outdoor climate, the ventilation air flow, and the use of the building. The calculated annual heat demand was converted into energy consumption for the assumed efficiency of the entire heating system (Figure 2). The simulation algorithm is presented in Figure 3.
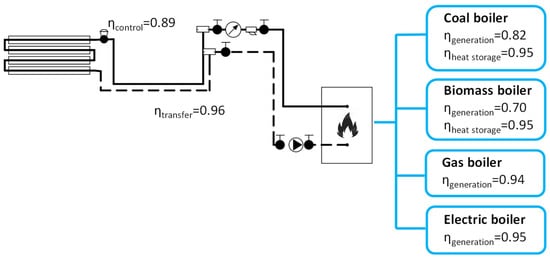
Figure 2.
Heating sources considered and efficiency of the heating system.
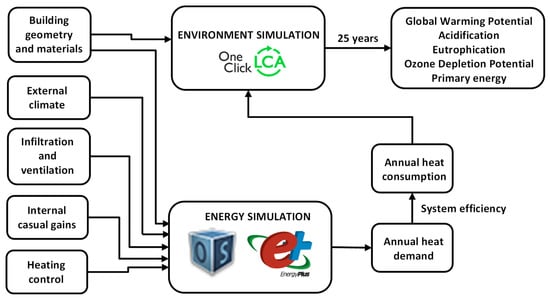
Figure 3.
Calculation scheme.
3.3.1. Internal and External Heat Gains
The total heat gains (sensible and latent) of an occupant at the level of 126 W were assumed [36]. These gains correspond to light work. In the model, the heat loads were defined by the number of people in the room and the appropriate schedule. The occupancy schedules for 4 people were determined on the basis of social practice in Poland, divided into weekdays and weekends. Figure 4 shows the occupancy schedule in the living room.
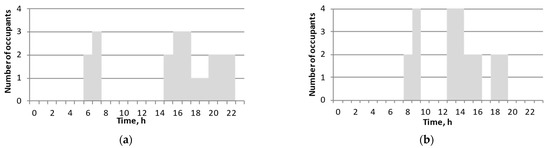
Figure 4.
Schedule of occupancy in the living room during working days (a) and weekend (b).
According to the EN 15193-1:2017 [37] standard, the illuminance depends on the size of a room. An average value of light intensity was adopted in the model, taking into account the intended use of the room and the type of work carried out there. For the study and bathrooms, a maximum power factor of 4 W∙m−2 was adopted. With reference to corridor, utility and vestibule room, children’s rooms, living room, the assumed value was 2 W∙m−2; whereas as for the garage, 1 W∙m−2 was assumed. The light source was a light-emitting diode lamp. The light was turned on when the light intensity in children’s rooms and in the study dropped below 300 lx, and below 200 lx in the remaining rooms (the light power depended on the intensity of natural light).
Heat gains from the equipment and its schedule were assumed in accordance with the ASHRAE standard [38]. The operation schedule for the living-room is shown in Figure 5. To limit solar gains, window blinds were used when the lighting intensity in the room was above 200 lx and the indoor temperature exceeded 22 °C.
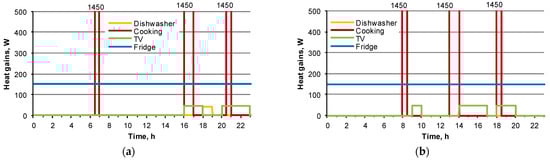
Figure 5.
Heat gain from the equipment in the living-room: weekdays (a) and weekend (b).
3.3.2. Ventilation
There is natural ventilation in the building. Airflow through the leaks in the windows (infiltration) and additional airing by opening the windows were modeled. Sherman and Grimsrud’s (1980) [35] model based on the so-called effective leakage area was used to predict infiltration. It is one of the predefined models in the EnergyPlus program. The effective leakage area is defined as “the equivalent amount of open area through which would pass the same quantity of air as would pass collectively through the building envelope at the reference pressure of 4 Pa” [39]. The value of the airtightness coefficient for windows was assumed at the level of 0.3 m3/(m∙h∙Pa0.67) based on the research on the airtightness of Polish residential buildings [40,41]. The total length of the cracks was equal to the circumference of all the windows. The window diffusers were also modeled based on the characteristics of the Aereco diffuser [42].
As regards additional airing by windows, the opening angle changed depending on the thermal conditions in the room and the outdoor temperature. To model this mechanism in the simulation program, a controller based on the “if...then” principle was built and optimized; it was implemented in the energy management system of the EnergyPlus program. This ventilation model was described in detail in the article by Grygierek et al. [24].
3.3.3. External Climate
The typical meteorological year for Warsaw was used for thermal simulations [43]. Weather data for the buildings’ energy calculation are produced based on 30-year data from the Institute of Meteorology and Water Management in Poland [44]. The climate of Warsaw is moderately continental and humid; the Dfb class according to Köppen-Geiger classification. The average monthly outdoor temperature is presented in Figure 6.
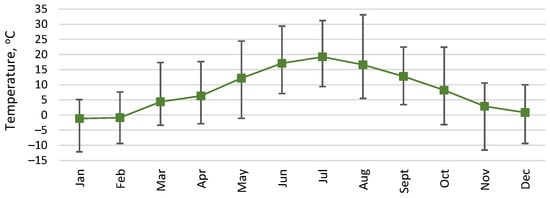
Figure 6.
Average monthly outdoor temperature according to [43].
4. Results and Discussion
The results are presented for the functional unit and square meter of the building area.
Due to the different thermal insulation of the external partitions each of the assessed buildings is characterized by a different heat demand. Figure 7 shows the annual heating demand (usable energy) depending on the type of building (marked in grey). The obtained usable energy index is in the range of 27 to 44 kWh∙m−2. As expected, the most advantageous case is the building with the passive standard of external partitions. The energy demand is 37% (B) and 35% (W) lower compared to the standard building. The timber building has a slightly higher annual heating demand; on average, about 3%. This is due to the much lower heat capacity of the wooden partitions of the building. In turn, the final energy value is influenced by the heating systems used, specifically the heat source. Depending on the efficiency of the heat source, an inversely proportional amount of final energy is obtained. The final energy is the highest (18% higher compared to a system with a coal boiler) for the lowest efficiency biomass boiler. Owing to the much higher efficiency of heat generation systems, gas and electric boilers consume 17% less energy compared to the coal boiler.
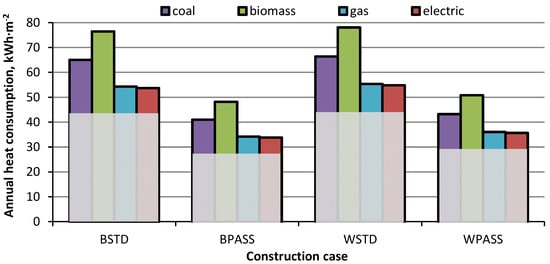
Figure 7.
Annual heating consumption (final energy); heating demand (useable energy part) is indicated in grey.
Figure 8 shows the share of stages in the life cycle of buildings with a coal-fired boiler for all environmental impact categories. The results show that for standard insulated buildings, the most important stage is the operational one in all impact categories. The ratio in this phase for a brick building ranges from 63% (GWP) to 78% (EP); for the wooden building, from 65% (ODP) to 76% (AP and EP). For example, the BSTD building produces 992 kg of CO2e over 25 years and 681 kg comes from heating. In the passive building the emission related to materials increases insignificantly (4–12% and 8–18%) for brick and wooden buildings, respectively (which is related to the greater amount of insulation materials). In turn, the emission resulting from the heating of a building decreases significantly by 37% and 35%. The operational stage is 50% (GWP) to 68% (EP) for the brick building and 53% (ODP) to 65% (EP) for the wooden building. The results are similar compared to the other life cycle studies mentioned in the Introduction. Dahlstrøm et al. [9] found a 7% difference in green gas emissions from materials in passive and conventional Norwegian building standards.
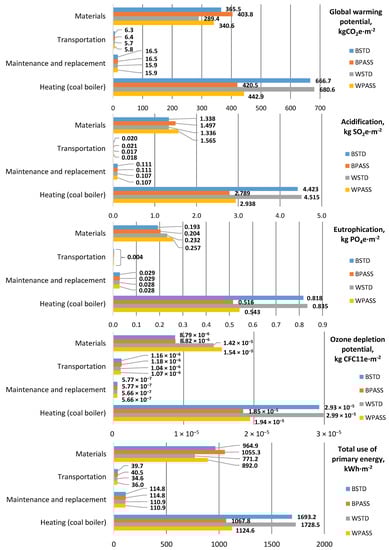
Figure 8.
Global warming potential, acidification, eutrophication, ozone depletion potential, and total use of primary energy by LCA stage.
Considering the entire life cycle of the building, the transport of materials to a construction site does not have a significant impact (a maximum in 4% of the ODP category). Maintenance and replacement steps involve the replacement of some building components whose service life is shorter than the assumed lifespan. The share of this stage amounted to at least 5% of the impact category of TPE.
4.1. The Influence of Building Materials
The more stringent the values of the heat transfer coefficient of the external walls, the greater the amount of CO2e emitted during the production process. Designing thicker insulation in a building envelope is associated with more CO2e produced.
Figure 8 shows that the two environmental criteria, GWP and TPE, have a significantly higher impact on the environment of the brick building, by 20% and 15% for the standard and passive building, respectively. A more positive assessment of these indicators in wooden construction is due to the lower energy demand for the production of structural elements, the use of primary energy from renewable sources being the major reason in this case. Similar results were obtained in the study by Potkány et al. [45], where the timber and brick (ytong) external walls were considered; with reference to the timber structure, the total primary energy consumption of the materials used to make the external walls was 34% lower than in the case of the brick structure. In our study, taking into account only external walls, this difference is 22% for the building with standard insulation. Mitterpach and Štefko [46] found that the materials for the construction of a brick house leave twice the carbon footprint in the environment than materials for a wooden house, but in this case it was a wooden log building.
The other criteria do not show significant absolute differences in terms of environmental impact. The AP, EP, and ODP indices are at a slightly higher level in the wooden building, similarly in the study by Potkány et al. [45]. In turn, after the cradle-to-grave evaluation of a single-family house based on timber frames and concrete-masonry construction in Uruguay, Soust-Verdaguer et al. found the same relationships for the potentials for global warming and eutrophication [47]. Uruguay is located in completely different part of the world, where raw materials used for the building components manufacturing might slightly differ.
The same foundations, windows, and external doors were used for each of the buildings in the analysis, yet their share in the total environmental impact differs depending on the case. As Figure 9 shows, the foundations and external walls of the considered buildings are responsible for the highest amount of emitted gases. The share of external structures and foundations ranges from 65% for the AP category in brick buildings to up to 78% for the ozone depletion potential category in the same building. In general, wooden buildings have a higher proportion of these structural parts than brick buildings, except for the ODP index, where the inverse relationship is obtained.
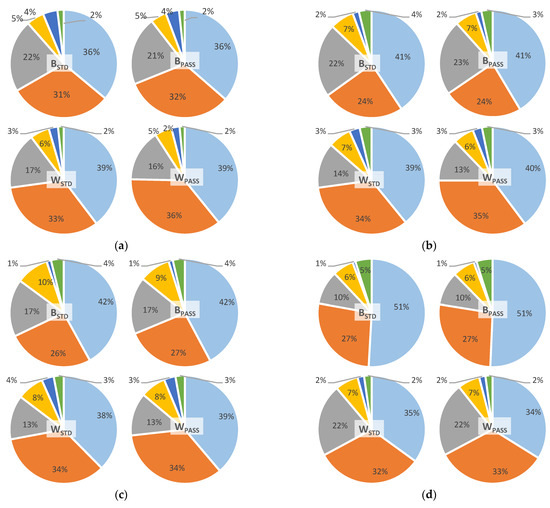
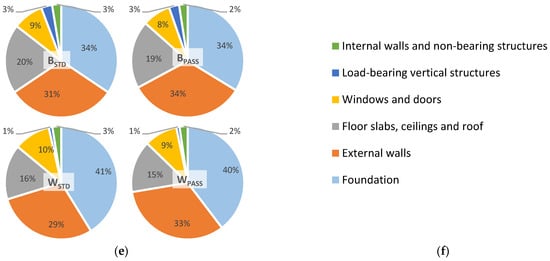
Figure 9.
Contribution of individual types of building structures to environmental impact categories: global warming potential (a), acidification (b), eutrophication (c), ozone depletion potential (d), total use of primary energy (e), and legend (f).
Wooden windows were used in the building, more ecological than plastic windows, and their environmental share does not exceed 10%. It can also be seen that the share of emissions from horizontal partitions such as ceilings, roof is variable; the greatest differences exist between buildings made in different technologies, e.g., the difference between the wooden and brick building in the CO2e emitted is about 42% to the disadvantage of the second one. It should be noted that the relative contribution of the building components of the house to the overall embodied impact depends on the building design options (window size and building shape) that were evaluated in the study by Monteiro et al. [48] on the south European single-family house. However, the results obtained are at a similar level.
4.2. The Influence of Heat Sources
In recent years, a decrease in the number of traditional coal-fired boilers can be observed in Poland. Despite this, they are still the main heat source in Polish single-family housing (36%). The second group is gas boilers (14%); a small part uses electricity (5%) or biomass (1.3%) for this purpose [23].
Table 2 and Table 3 presents the environmental impacts associated with heating in the standard and passive brick buildings (BSTD and BPASS). The highest CO2e emission occurs when an electric boiler is used. This is due to the fact that most of the electricity in Poland is produced by burning coal in power plants, which generates a large amount of carbon dioxide emissions. The electric boiler is preferable to the coal-fired and gas-fired boilers only in the case of ozone depletion potential.
Table 2.
Environmental impact factors for the operational stage over 25 years (BSTD case).
Table 3.
Environmental impact factors for the operational stage over 25 years (BPASS case).
As can be seen, the use of the gas boiler in the building is associated with a reduced CO2e emission compared to the traditional coal-fired boiler (by approximately 50%), while compared to the biomass-fired boiler with an increased emission of approximately 370%.
The biomass boiler is characterized by relatively low CO2e emissions. The GWP was reduced by 90% compared to the system that used the coal boiler. The biomass boiler system is the most favorable for most environmental influences; only in the eutrophication category, the gas boiler performs better, which is almost twice as good as the coal boiler. Similar relationships were obtained for other types of buildings.
The change in the heat source significantly influences the ratio of the operational stage to total emission in the assumed life cycle of the building. Figure 10 presents the percentage ratio of the heating stage in the total life cycle.
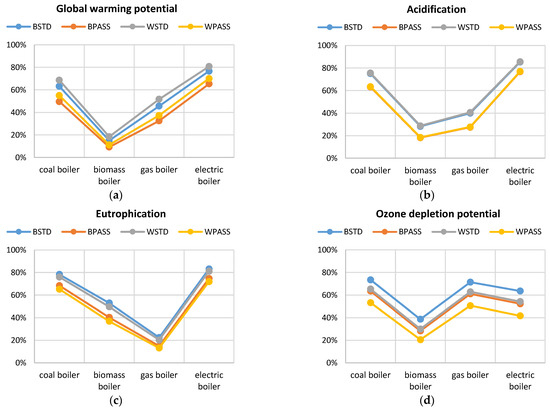
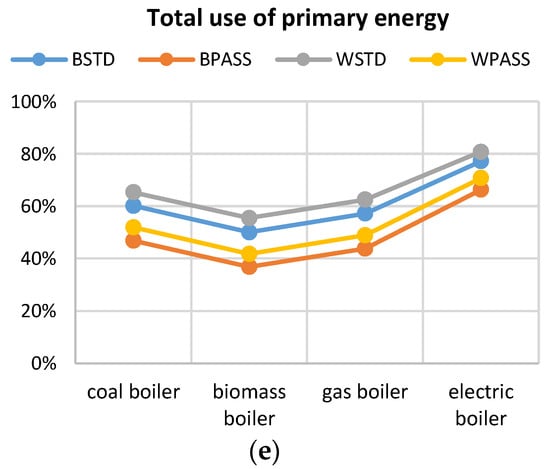
Figure 10.
Percentage ratio of the operational stage (heating) stage in the life cycle: global warming potential (a), acidification (b), eutrophication (c), ozone depletion potential (d), and total primary energy use (e).
Previous studies, for example conducted by Alhazmi et al. [20] or Abd Rashid et al. [49] relating to the environmental efficiency of a building during the 50-year operational period, including the evaluation of the construction, maintenance, and operation phases as well as the end of life, showed that for all impact categories analyzed, the operational stage (based mainly on electricity) had the greatest impact on the environment (up to 90%). The results obtained in this study are comparable. Despite the assumed lifespan that was half as long, the GWP, AP, EP, and TPE indicators for the operation stage, depending on the type of building, represent from 60% for more insulated buildings to 80% for less insulated ones. In the case of a system based on wooden pellets, the 25-year heating provides no more than 40% total emissions. It should also be emphasized that in this study only the consumption of heating energy was analyzed. Taking into account the remaining components (domestic hot water, lighting, and cooling) would increase the share of the operating period.
In the case of buildings with higher energy efficiency (PASS), the share of the operational stage is lower, like in the studies discussed in the Introduction section [9,10]. In this study, the share for such cases decreases by 6 to 14 percentage points, depending on the heat source used. The lowest effect is obtained for the case with the biomass boiler.
5. Conclusions
The LCA allowed the analysis of the entire life cycle of a typical single-family house in Poland, taking into account the specific building materials and energy supply scenarios for heating. In Poland, there is a lot to talk about the use of electricity as, for example, an eco-friendly heat source. Analyzing the data obtained as a result of the simulations, it is noticed that this is the wrong approach. It can be concluded that:
- The choice of building structure and the heat source has a fundamental impact on both the amount of greenhouse gas emissions into the atmosphere and other categories of environmental impact;
- Building a wooden house will always generate less environmental impact, regardless of the insulation standard of external partitions;
- The operational phase has the greatest environmental impact over the life cycle of a house with an electric heat source; these results are in line with the previously published life cycle assessments of residential buildings; the heating-related operation stage accounts for more than 80% of the environmental impact;
- The use of a traditional coal-fired boiler is much more ecological (in the aspects considered here) than the use of an electric boiler; in the case of the second heat source, CO2e emission is approximately 90% higher than in the case of the coal-fired boiler; unfortunately, electricity generation in Poland is highly dependent on fossil fuels;
- The environmental impact is significantly lower when using the biomass boiler (wood pellets in the analyzed case); despite the fact that of the heat sources considered in this study, this one has the lowest energy generation efficiency, the share of the 25-year operational stage can even drop below 20%.
According to data from the General Office of Construction Supervision, 93,714 building permits were issued to construct single-family houses in Poland in 2018 [50]. Translating this into the difference in emissions between the BSTD and WSTD options, if investors chose the greener option, the amount of CO2e emitted from the construction stage alone would be reduced by approximately 1,065,000 tons of CO2e. These results confirm the ecological approach to choosing a wood-based structure while meeting the conditions of sustainable development.
It should be noted that the obtained results for electric heating refer to very specific energy mix (based on coal) and will not apply to LCA of single-family houses in other European countries, e.g., Denmark or Germany, even if the climate, building structures, insulation, and heat sources assumptions will be the same.
Future Research
The conclusions presented in the work will help to assess the life cycle of residential buildings in terms of future planning and energy saving. However, more research is needed to identify the main causes of the environmental and energy impacts of the building life cycle. The use of the air-conditioning system in the summer was not assessed in this study. In the era of climate change, more and more Poles decide to have cooling systems installed in their homes. This aspect should also be taken into account in future studies.
Author Contributions
Conceptualization, J.F.-G. and K.G.; methodology, K.G.; formal analysis, J.F.-G.; writing—original draft preparation, J.F.-G. and K.G. All authors have read and agreed to the published version of the manuscript.
Funding
This research received no external funding.
Institutional Review Board Statement
Not applicable.
Informed Consent Statement
Not applicable.
Data Availability Statement
Not applicable.
Acknowledgments
The work was supported by the Polish Ministry of Education and Science within the research subsidy.
Conflicts of Interest
The authors declare no conflict of interest.
Appendix A
Table A1.
Material Inventory.
Table A1.
Material Inventory.
| Material | Quantity | |||
|---|---|---|---|---|
| BSTD | BPASS | WSTD | WPASS | |
| Acrylic emulsion paint for exterior application | 627.9 kg | 602.5 kg | ||
| Ceramic tiles | 159.3 m2 | 158.5 m2 | ||
| EPS foam insulation | 8.0 m3 | 24.0 m3 | 4.2 m3 | 20.3 m3 |
| Floor screed mortar, cement screed | 12.3 m3 | 8.4 m3 | ||
| Glass wool insulation, unfaced | 6.7 m3 | 12.6 m3 | ||
| Glass wool/mineral wool insulation, panel | - | 4.8 m3 | ||
| Gypsum plaster for internal walls and ceilings | 5.1 m3 | - | ||
| Gypsum plasterboard | 4.7 m3 | 8.7 m3 | ||
| Hardwood poles | - | 13.5 m3 | ||
| Hollow core concrete slabs, generic | 34.0 m3 | 8.8 m3 | ||
| Insulation, EPS facade panel | 27.0 m3 | 73.6 m3 | 12.1 m3 | 43.6 m3 |
| Insulation, XPS | 2.6 m3 | |||
| Inward-facing window, with wooden frame | 30.4 m2 | |||
| Lightweight bituminous underlays for roof waterproofing | 265.5 m2 | |||
| Membranes, FPO/PVC-P waterproofing reinforced with polyester net | 159.3 m2 | 84.5 m2 | ||
| Mineral wool insulation with recycled briquette content | - | 12.7 m3 | ||
| OSB panels | 1.8 m3 | 8.5 m3 | ||
| Ready-mix concrete, normal-strength, generic | 22.3 m3 | |||
| Rock wool insulation | 16.0 m3 | 26.5 m3 | 15.3 m3 | 27.2 m3 |
| Sandstone cladding, natural | 17.7 m3 | |||
| Unbonded, non-combustible blown glass/mineral wool insulation | - | 3.6 m3 | 15.9 m3 | |
| Wall bricks | 70.5 m3 | - | ||
| Wooden entrance door | 1.8 m2 | |||
References
- Cerezo-Narváez, A.; Piñero-Vilela, J.-M.; Rodríguez-Jara, E.-Á.; Otero-Mateo, M.; Pastor-Fernández, A.; Ballesteros-Pérez, P. Energy, emissions and economic impact of the new nZEB regulatory framework on residential buildings renovation: Case study in southern Spain. J. Build. Eng. 2021, 42, 103054. [Google Scholar] [CrossRef]
- Fernandez, N.; Katipamula, S.; Wang, W.; Xie, Y.; Zhao, M. Energy savings potential from improved building controls for the US commercial building sector. Energy Effic. 2018, 11, 393–413. [Google Scholar] [CrossRef]
- Curran, M.A. Life cycle assessment: A review of the methodology and its application to sustainability. Curr. Opin. Chem. Eng. 2013, 2, 273–277. [Google Scholar] [CrossRef]
- Hong, J.; Zhang, X.; Shen, Q.; Zhang, W.; Feng, Y. A multi-regional based hybrid method for assessing life cycle energy use of buildings: A case study. J. Clean. Prod. 2017, 148, 760–772. [Google Scholar] [CrossRef]
- Hauschild, M.Z.; Goedkoop, M.; Guinée, J.; Heijungs, R.; Huijbregts, M.; Jolliet, O.; Margni, M.; De Schryver, A.; Humbert, S.; Laurent, A.; et al. Identifying best existing practice for characterization modeling in life cycle impact assessment. Int. J. Life Cycle Assess. 2013, 18, 683–697. [Google Scholar] [CrossRef]
- Guan, L.; Walmsely, M.; Chen, G. Life cycle energy analysis of eight residential houses in Brisbane, Australia. Proc. Eng. 2015, 121, 653–661. [Google Scholar] [CrossRef]
- Schlegl, F.; Gantner, J.; Traunspurger, R.; Albrecht, S.; Leistner, P. LCA of buildings in Germany: Proposal for a future benchmark based on existing databases. Energy Build. 2019, 194, 342–350. [Google Scholar] [CrossRef]
- Lawania, K.K.; Biswas, W.K. Achieving environmentally friendly building envelope for Western Australia’s housing sector: A life cycle assessment approach. Int. J. Sustain. Built Environ. 2016, 5, 210–224. [Google Scholar] [CrossRef] [Green Version]
- Dahlstrøm, O.; Sørnes, K.; Eriksen, S.T.; Hertwich, E.G. Life cycle assessment of a single-family residence built to either conventional- or passive house standard. Energy Build. 2012, 54, 470–479. [Google Scholar] [CrossRef]
- Petrovic, B.; Myhren, J.A.; Zhang, X.; Wallhagen, M.; Eriksson, O. Life cycle assessment of a wooden single-family house in Sweden. Appl. Energy 2019, 251, 113253. [Google Scholar] [CrossRef]
- Sartori, I.; Hestnes, A.G. Energy use in the life cycle of conventional and low-energy buildings: A review article. Energy Build. 2007, 39, 249–257. [Google Scholar] [CrossRef]
- Brunklaus, B.; Thormark, C.; Baumann, H. Illustrating limitations of energy Studies of buildings with LCA and actor analysis. Build. Res. Inf. 2010, 38, 265–279. [Google Scholar] [CrossRef] [Green Version]
- Mao, C.; Shen, Q.; Shen, L.; Tang, L. Comparative study of greenhouse gas emissions between off-site prefabrication and conventional construction methods: Two case studies of residential projects. Energy Build. 2013, 66, 165–176. [Google Scholar] [CrossRef] [Green Version]
- Faludi, J.; Lepech, M.D.; Loisos, G. Using life cycle assessment methods to guide architectural decision-making for sustainable prefabricated modular buildings. J. Green Build. 2012, 7, 151–170. [Google Scholar] [CrossRef] [Green Version]
- Rivera, M.L.; MacLean, H.L.; McCabe, B. Implications of passive energy efficiency measures on life cycle greenhouse gas emissions of high-rise residential building envelopes. Energy Build. 2021, 249, 111202. [Google Scholar] [CrossRef]
- Islam, H.; Jollands, M.; Setunge, S.; Haque, N.; Bhuiyan, M.A. Life cycle assessment and life cycle cost implications for roofing and floor designs in residential buildings. Energy Build. 2015, 104, 250–263. [Google Scholar] [CrossRef]
- Monahan, J.; Powell, C. An embodied carbon and energy analysis of modern methods of construction in housing: A case study using a life cycle assessment framework. Energy Build. 2011, 43, 179–188. [Google Scholar] [CrossRef]
- Ximenes, F.A.; Grant, T. Quantifying the greenhouse benefits of the use of wood products in two popular house designs in Sydney, Australia. Int. J. Life Cycle Assess. 2013, 18, 891–908. [Google Scholar] [CrossRef]
- Evangelista, P.P.; Kiperstok, A.; Torres, E.A.; Gonçalves, J.P. Environmental performance analysis of residential buildings in Brazil using life cycle assessment (LCA). Constr. Build. Mater. 2018, 169, 748–761. [Google Scholar] [CrossRef]
- Alhazmi, H.; Alduwais, A.K.; Tabbakh, T.; Aljamlani, S.; Alkahlan, B.; Kurdi, A. Environmental performance of residential buildings: A life cycle assessment study in Saudi Arabia. Sustainability 2021, 13, 3542. [Google Scholar] [CrossRef]
- Georges, L.; Massart, C.; VanMoeseke, G.; De Herde, A. Environmental and economic performance of heating systems for energy-efficient dwellings: Case of passive and low-energy single-family houses. Energy Policy 2012, 40, 452–464. [Google Scholar] [CrossRef] [Green Version]
- Blengini, G.A.; Di Carlo, T. The changing role of life cycle phases, subsystems and materials in the LCA of low energy buildings. Energy Build. 2010, 42, 869–880. [Google Scholar] [CrossRef]
- Central Statistical Office. Available online: https://stat.gov.pl/obszary-tematyczne/srodowisko-energia/energia/zuzycie-energii-w-gospodarstwach-domowych-w-2018-roku,2,4.html (accessed on 15 December 2021).
- Grygierek, K.; Ferdyn-Grygierek, J.; Gumińska, A.; Baran, Ł.; Barwa, M.; Czerw, K.; Gowik, P.; Makselan, K.; Potyka, K.; Psikuta, A. Energy and environmental analysis of single-family houses located in Poland. Energies 2020, 13, 2740. [Google Scholar] [CrossRef]
- EU Standard EN 15978:2011; Sustainability of Construction Works—Assessment of Environmental Performance of Buildings—Calculation Method. European Committee for Standardization: Brussels, Belgium, 2011.
- Soust-Verdaguer, B.; Llatas, C.; García-Martínez, A. Simplification in life cycle assessment of single-family houses: A review of recent developments. Build. Environ. 2016, 103, 215–227. [Google Scholar] [CrossRef] [Green Version]
- Ghinea, C.; Petraru, M.; Simion, I.M.; Sobariu, D.; Bressers, T.H.; Gavrilescu, M. Life cycle assessment of waste management and recycled paper systems. Environ. Eng. Manag. J. 2014, 13, 2073–2085. [Google Scholar]
- Leiden University. CML-IA Characterisation Factors. Available online: https://www.universiteitleiden.nl/en/research/research-output/science/cml-ia-characterisation-factors (accessed on 15 December 2021).
- Polish Ministry of Infrastructure. Regulation of the Minister of Infrastructure of 12 April 2002 on the Technical Conditions That Should Be Met by Buildings and Their Location; Polish Ministry of Infrastructure: Warsaw, Poland, 2002. (In Polish)
- Polish Institute of Passive House. Available online: http://www.pibp.pl/ (accessed on 15 December 2021).
- One Click LCA. Bionova Ltd.: Helsinki, Finland, 2015. Available online: https://www.oneclicklca.com/ (accessed on 15 April 2020).
- ISO Standard ISO14044:2006; Environmental Management—Life Cycle Assessment—Requirements and Guidelines. International Organization for Standardization: Geneva, Switzerland, 2006.
- EU Standard EN 15804:2012; Sustainability of Construction Works—Environmental Product Declarations. European Committee for Standardization: Brussels, Belgium, 2012.
- OpenStudio. Available online: https://www.openstudio.net/ (accessed on 15 April 2020).
- Engineering Reference, EnergyPlus™; version 9.4.0; US Department of Energy: Washington, DC, USA, 2020. Available online: https://energyplus.net/sites/all/modules/custom/nrel_custom/pdfs/pdfs_v9.4.0/EngineeringReference.pdf (accessed on 23 February 2021).
- ANSI/ASHRAE Standard 55; Thermal Environmental Conditions for Human Occupancy. American Society of Heating, Refrigerating and Air-Conditioning Engineers (ASHRAE): Atlanta, GA, USA, 2017.
- EU Standard EN 15193-1:2017+A1:2021; Energy Performance of Buildings—Energy Requirements for Lighting—Part 1: Specifications, Module M9. European Committee for Standardization: Brussels, Belgium, 2017.
- American Society of Heating, Refrigerating and Air Conditioning Engineers. ASHRAE Handbook Fundamentals; SI ed.; American Society of Heating, Refrigerating and Air Conditioning Engineers: Atlanta, GA, USA, 1997; ISBN 978-1883413453. [Google Scholar]
- Dickinson, J.B.; Feustel, H.E. Seasonal Variation in Effective Leakage Area; University of California: Berkeley, CA, USA, 1986. [Google Scholar]
- Blaszczok, M.; Baranowski, A. Thermal improvement in residential buildings in view of the indoor air quality—Case study for Polish dwelling. Arch. Civ. Eng. Environ. 2018, 11, 121–130. [Google Scholar] [CrossRef] [Green Version]
- Ferdyn-Grygierek, J.; Baranowski, A.; Blaszczok, M.; Kaczmarczyk, J. Thermal diagnostics of natural ventilation in buildings: An integrated approach. Energies 2019, 12, 4556. [Google Scholar] [CrossRef] [Green Version]
- AERECO. Available online: https://www.aereco.com.pl/produkty/nawiewniki/ (accessed on 15 December 2021).
- U.S. Department of Energy. Weather Data. EnergyPlus. Available online: https://energyplus.net/weather (accessed on 23 October 2020).
- Typical Meteorological and Statistical Climatic Data for Energy Calculations of Buildings. Available online: https://dane.gov.pl/dataset/797,typowe-lata-meteorologiczne-i-statystyczne-dane-klimatyczne-dla-obszaru-polski-do-obliczen-energetycznych-budynkow (accessed on 15 December 2021).
- Potkány, M.; Gejdoš, M.; Debnár, M. Sustainable Innovation Approach for Wood Quality Evaluation in Green Business. Sustainability 2018, 10, 2984. [Google Scholar] [CrossRef] [Green Version]
- Mitterpach, J.; Štefko, J. An environmental impact of a wooden and brick house by the LCA method. Key Eng. Mater. 2016, 688, 204–209. [Google Scholar] [CrossRef]
- Soust-Verdaguera, B.; Llatasa, C.; Moyab, L. Comparative BIM-based life cycle assessment of Uruguayan timber and concrete-masonry single-family houses in design stage. J. Clean. Prod. 2020, 277, 121958. [Google Scholar] [CrossRef]
- Monteiro, H.; Freire, F.; Soares, N. Life cycle assessment of a south European house addressing building design options for orientation, window sizing and building shape. J. Build. Eng. 2021, 39, 102276. [Google Scholar] [CrossRef]
- Abd Rashid, A.F.; Idris, J.; Yusoff, S. Environmental impact analysis on residential building in Malaysia using life cycle assessment. Sustainability 2017, 9, 329. [Google Scholar] [CrossRef] [Green Version]
- The Central Construction Supervision Office. Available online: www.gunb.gov.pl/aktualnosc/ruch-budowlany-w-2018-r (accessed on 15 December 2021).
Publisher’s Note: MDPI stays neutral with regard to jurisdictional claims in published maps and institutional affiliations. |
© 2022 by the authors. Licensee MDPI, Basel, Switzerland. This article is an open access article distributed under the terms and conditions of the Creative Commons Attribution (CC BY) license (https://creativecommons.org/licenses/by/4.0/).