Abstract
The evaluation of the meteorological drought is fundamental for the management of the water resource. One of the most used indices to evaluate the drought is the standardized precipitation index (SPI) due to its practicality and evaluation in a variety of time scales, however, this uses precipitation as the only variable, depending on the deviations in the precipitation values. This is important when evaluating the SPI, because in some ecosystems close to the equatorial zone, there are very warm periods with low rainfall, in which a large proportion of the data collected by the meteorological stations corresponds to zero. In this research, the SPI was calculated in the Pechelín basin located in Colombia, in which there is zero precipitation in a large proportion of the data, registering zero precipitation in the month of January and February in 67% and 70% respectively. As a result, the SPI values increased to “wet” ranges, only when the amount of data with zero precipitation exceeded half of the total data; this means that the SPI determines wrong values when it is calculated with zero-precipitation data in large proportions. Based on this finding, this study aims to modify the index by typing the distribution (using a correction factor K), finally correcting the SPI values, this correction was called SPI-C. The results indicate that the SPI-C improved the identification of drought, obtaining corresponding values that better represent the high frequency of zero precipitation existing in the study area.
1. Introduction
The SPI is frequently used for drought evaluation, the World Meteorological Organization considers the SPI as a universal drought index because of its capacity to be estimated for various reference periods adapting to the different response times of typical hydrological characteristics to precipitation [1]. Some investigations of the SPI as [2,3,4,5,6] show the practicality of the index to characterize drought events with few resources and at different time scales; this is an advantage over other methods of assessing drought. Although the SPI has been in existence for only a decade, it has been used with notable success in various applications, particularly in describing and monitoring drought conditions. It can be used as an indicator of drought severity or excessive wetness, and in the design of drought/flood contingency plans [7]. The SPI constitutes one of the basic elements to develop strategic planning, which allows the decision-making required in the medium and long term to efficiently face the different drought events that may arise [8].
Some research [9,10,11,12,13,14] indicates the temporal versatility of the index is useful in determining the beginning and end of dry events, it allows the analysis of the impacts of droughts at different time scales, simply compared to other indices. Several authors have analyzed the advantages and disadvantages of SPI using different distributions, there are several recommended distributions for calculating the SPI. Some research recommends the Pearson III distribution, for example [15], for the United States and [16] for Africa. Other authors recommend the use of the gamma distribution, for example, [17] for Europe and [18] for Portugal. In some cases, no differences were found between these two distributions [19], used the gamma or Pearson III distribution to characterize the droughts in Brazil. There are other equally recommended distributions, however, this study focuses on the gamma distribution to evaluate the SPI. The main advantage of SPI is that regional comparison of drought is possible; while one of the disadvantages of standardized indices is that the severity of a drought event is expressed only in relative terms. Another disadvantage of the SPI is that only rainfall is considered as an input variable, while other relevant variables and meteorological parameters in drought assessment, used in the calculation of other indices, are not considered [20].
The SPI represents the number of standard deviations that each precipitation data deviates from the historical average; considering this, when evaluating the drought in tropical areas, critical conditions are found, such as very severe dry periods in the months with low precipitation. Based on this characteristic, the SPI was evaluated in the Pechelín basin, located in Colombia, in this basin there are areas with zero monthly rainfall in a large proportion of the data, due to the large amount of data with zero rainfall, which exceeds 50% of the total precipitation data, resulting in “wet” SPI values. The main objective of the study is to adjust the SPI or SPI-C, to improve the evaluation of drought in areas with zero rainfall.
2. Data and Method
2.1. The Standardized Precipitation Index (SPI)
In the study carried out by [2] in 1997, it was recommended that the SPI be calculated for a continuous monthly precipitation data set of at least 30 years at different time stages. Each of the data sets that are determined from the data from previous months adjusted to the gamma function to define the probability relationship with the precipitation from which the probability of any observed data point is obtained, and the deviation is calculated of precipitation for a normally distributed probability density with a mean of zero and unit standard deviation [21].
The cumulative probability of observed precipitation for the given month and time scale of a given station is given by:
As the range of the gamma function is defined by values greater than zero, however, in the data we can find m precipitation values equal to zero, then the probability that this value occurs is m/n; where n is the number of years to evaluate, this probability is called q, then an adjustment is made for when one or more precipitation values equal to zero are found, this is expressed as follows:
H(x) = q + (1 − q) G(x)
The value of SPI, for the normal distribution function with zero mean and one variance, is calculated as follows:
The values obtained are classified in a scale proposed by [2], these range from the range of “extremely drought” to “extremely wet”. Below is shown the proposed scale used to classify the SPI, see Table 1.

Table 1.
SPI by categories and their probability of occurrence. Source: Edwards and McKee, 1997.
2.2. The Standardized Precipitation Index Corrected (SPI-C)
Previously, the SPI was evaluated under precipitation conditions of 0 mm/month (no rain). It was identified that the index calculates “wet”, provided that the data with 0 exceed more than half of the total data recorded in the station. This is demonstrated in the research results.
For the adjustment and correction of the SPI values, a new model called SPI-C was proposed, which consisted in the adjustment of the standardized normal distribution employing typing, establishing a K factor that corrects the SPI values. To adjust the SPI values, in which there are more than 50% of the monthly precipitation data with zeros, the variable must be typified in such a way that the maximum SPI value remains the mean or zero, shifting the mean to the maximum value of zeros present in the station, this is done by establishing the value of the coefficient K and subtracting it from the value of the calculated SPI, the SPI-C is described below:
When the probability of occurrence of precipitation is zero, the gamma distribution tends to zero, therefore the probability of occurrence of the event remains a function of the probability of zero precipitation.
When the probability of occurrence of zero is greater than 50%, the positive event 0.5 < H(x) ≤ 1 is assumed, which establishes that dry periods are being evaluated as wet periods.
The model is typed as a K coefficient, to transform the SPI into SPIC, the typing is only performed when the probability of occurrence of zeros is greater than 50% of the available data, adjusting the maximum and unique value of the series to the mean (μ = 0), shifting the graph to the left.
Therefore,
SPI-C = SPI − K
The typing, transforming the SPI into SPI-C, adjusts the maximum and unique value of the series to the mean (μ = 0), shifting the graph to the left as shown in Figure 1.
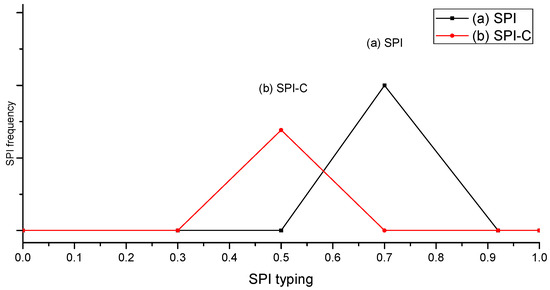
Figure 1.
SPI typing. (a) Standardized precipitation index (SPI); (b) standardized precipitation index corrected (SPI-C).
2.3. Study Site
The countries located in the equatorial belt generally present vulnerability to drought events due to their climatic characteristics of high temperatures [22,23,24,25,26,27] and had SPI in other ecosystems with warm environments, such as the Colombian Caribbean and the Pechelín stream basin, showing periods with low rainfall. Colombia has various meteorological characteristics depending on its geographical location and its orography, presenting warm climates in the regions of lower elevation for sea level. In [28] it was identified that the extreme or severe periods tend to be more intense, while the mean values have remained more or less constant. In other words, for the December to February quarter, the droughts in Colombia are intensifying; on the contrary, the months of May and June, the humid periods are more marked.
The Pechelín stream basin is in the Caribbean region, it is characterized mainly by its warm climate and low rainfall in the first quarter and extends to low rainfall in the first half. For the evaluation of the drought in the tropical zone, the investigation was carried out in the Arroyo Pechelín basin, in the Colombian Caribbean region, at latitude 9°31′0″ N and longitude 75°34′60″ W, in the department of Sucre in the Caribbean Littoral and Central Caribbean subregions.
The study area has a type of dry tropical climate Aw or As, with two seasons, a humid one with rains and a dry one with very warm temperatures throughout the year, with a temperature that oscillates between 19.7 °C and 35.3 °C, and low precipitation in its driest period. The main municipalities that are supplied with water from the basin or affected by runoff are Colosó, Chalán, Ovejas, Santiago de Tolú, and Toluviejo, which have agricultural, livestock and mining activities.
To calculate the SPI the basin was divided into different zones, low, medium and high, for the orography and the meteorological behavior present in the study area, as can be seen in Figure 2.
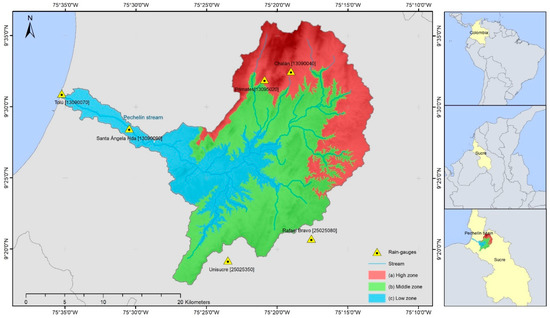
Figure 2.
Characterization of the Arroyo Pechelín watershed: (a) (>250 m) high zone; (b) (100–250 m) middle zone; (c) (0–100 m) low zone.
2.4. Obtaining Data
The information used is of a secondary nature, monthly precipitation data series, supplied by the existing meteorological stations of the Institute of Meteorology, Hydrology and Environmental Studies (IDEAM). Thirty-five years of records were selected and no more than 10% of data were missing, as seen below in Table 2. The missing data were recovered, using the normal proportion method, because the differences in the annual normal rainfall from the station (missing data station) and the data from the neighboring station (complete data station) differ by more than 10%. Figure 3 shows the summary of the data from the study area.
Table 2.
Stations in the study basin’s high zone, middle zone and low zone.
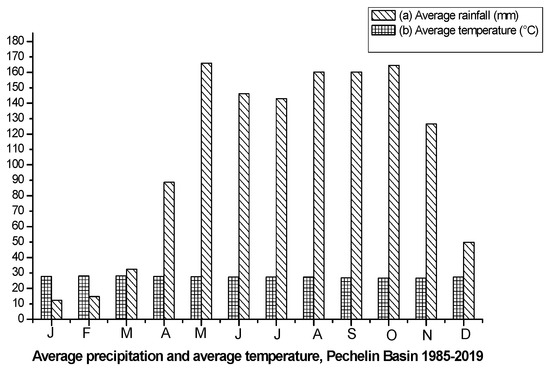
Figure 3.
Average rainfall and average temperature, Pehelín basin 1985–2019: (a) average rainfall (mm); (b) average temperature (°C).
Exploratory analysis of the monthly precipitation data series per station was carried out, using tools belonging to descriptive statistics, (number of data, missing data recovery, mean, standard deviation) to identify possible trends in the data, characteristics in their structure and outliers or outliers, which indicate that there are no outliers and the data behave randomly in the stations under study.
With the data obtained, the data consistency analysis was performed using double mass analysis, t (Student), and Fisher’s F tests, establishing that the series are homogeneous, with a probability of 95% for which reason no requires correcting the meteorological data. The nonparametric Mann–Whitney U test (Shapiro–Wilk) was applied, verifying that the precipitation series fit a normal distribution. It is determined that the sample data come from a normal distribution, establishing that the p Value (p Value) is greater than 0.05 adjusting to a normal distribution with a confidence level of 95%.
3. Results
3.1. Time Series of the Standardized Precipitation Index in the Study Basin
A historical series for the calculation of the SPI was carried out for each of the stations present in the study basin in the period between 1985 and 2019, to identify the months for each year with the greatest drought, in which the divergence in drought events can be observed, in which they establish periods of greater drought mainly in the months of January, February and March of each season. This time series allows a general analysis of the intensity of the drought in the basin of the study area, as is shown in Figure 4, Figure 5, Figure 6, Figure 7, Figure 8 and Figure 9.
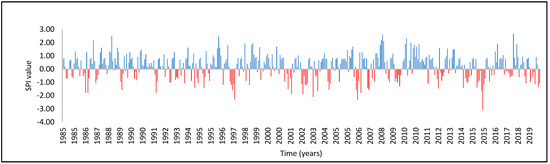
Figure 4.
SPI time series, Tolú station in the period (1985–2019).
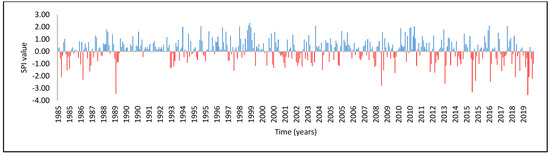
Figure 5.
SPI time series, Argentina Hda station in the period (1985–2019).
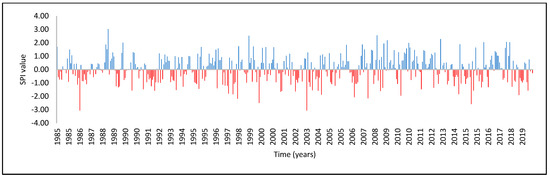
Figure 6.
SPI time series, Unisucre station in the period (1985–2019).
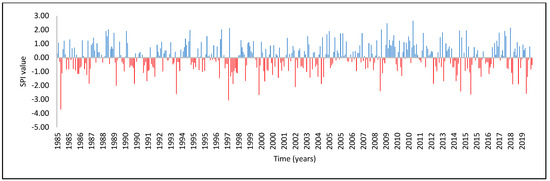
Figure 7.
SPI time series, Rafael Bravo station in the period (1985–2019).
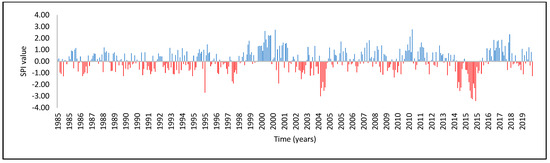
Figure 8.
SPI time series, Primate station in the period (1985–2019).
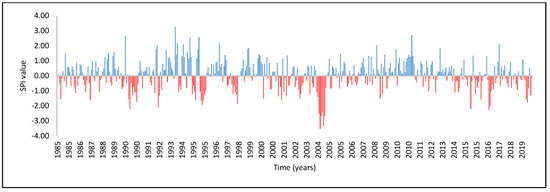
Figure 9.
SPI time series, Chalan station in the period (1985–2019).
3.2. Zero Precipitation Frequency (0 mm/Month)
To evaluate the SPI in critical conditions of absence of precipitation, the number of data that have zero precipitation for each month was determined, establishing the frequency with which it occurs. It was identified that in the lower area of the basin, the months of January and February have a precipitation frequency of 0 mm/month in more than 50% of the data; these months have zero monthly rainfall in more than half of the available data below, as is shown in Figure 10.
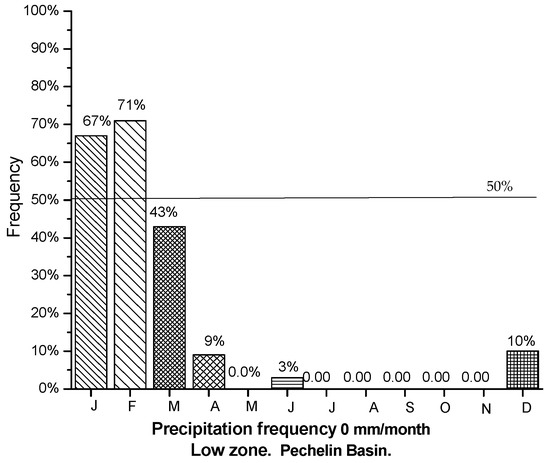
Figure 10.
Precipitation frequency 0 mm/month in the low zone, Pechelín basin.
3.3. SPI Calculation
For each of the areas of the basin, the value of the monthly average SPI was determined through the analysis of data in the period between 1985 and 2019 grouped in monthly intervals. The upper and middle zone did not present extremely wet or dry values. However, for the lower zone, the months with less precipitation (January, February and March) were those that presented wet SPI values. This occurred due to the high frequency of zero-precipitation values in the months of January, February and March, as shown in Figure 11, Figure 12 and Figure 13.
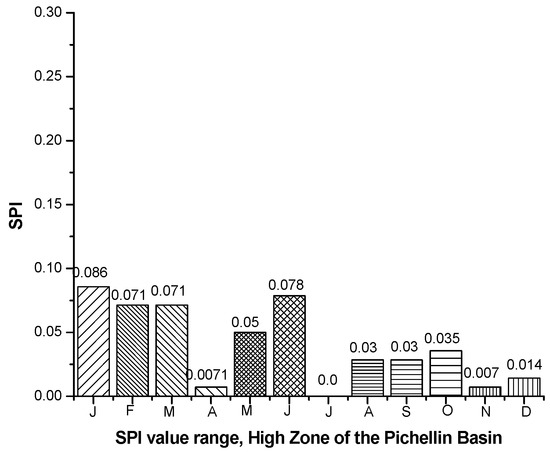
Figure 11.
Standardized precipitation index (SPI), high zone.
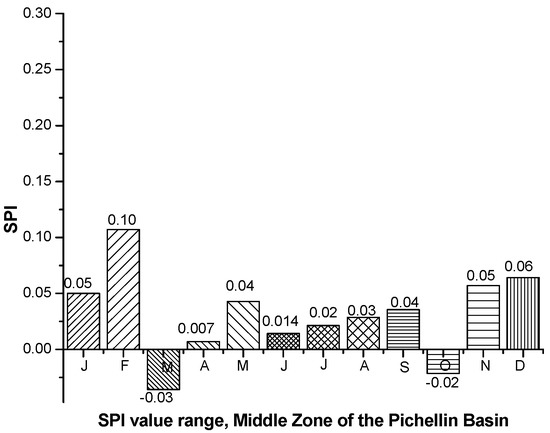
Figure 12.
Standardized precipitation index (SPI), middle zone.
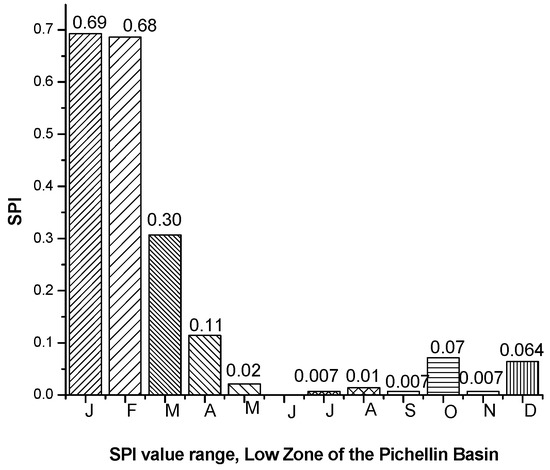
Figure 13.
Standardized precipitation index (SPI), low zone.
It is necessary to clarify that having zero precipitation (0 mm/month) in more than half of the available historical months should be an indication of meteorological drought. However, when calculating the SPI, these values rise, as can be seen in the low zone (January and February) concerning the months in which they have more precipitation (rest of the year). This condition can be observed in Figure 13.
The precipitation data in the basin under study begin to rise to “moderately wet”, according to the classification of SPI values table suggested by [2], in the months January and February for the low zone. With these data it is shown that in the months with zero monthly precipitation in more than half of all the available historical data (p > 0.5), the standardized precipitation index (SPI) instead of forecasting negative values (drought), begins to generate higher positive values (wet), meaning a significant deviation in the SPI calculation. This evidences the need to correct the SPI values when they are calculated under zero-precipitation conditions.
3.4. SPI-C Calculation (Corrected)
The corrected values were determined from the adjustment in the classification of the distribution presented previously, in which it is established that the correction or SPI-C is made in the values in the lower basin, in the months of January, February and March. (Probability of occurrence of zero precipitation in more than 50% of the data). The SPI-C values are shown in Figure 14, Figure 15 and Figure 16.
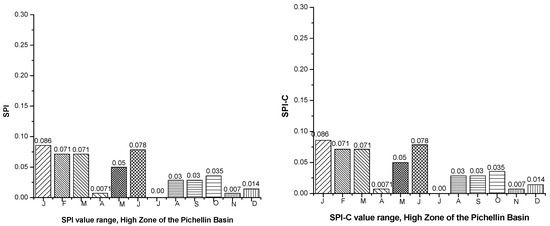
Figure 14.
Comparative SPI and SPI-C, high zone of the basin.
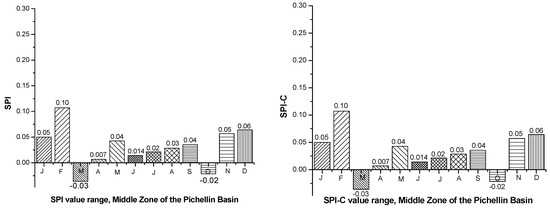
Figure 15.
Comparative SPI and SPI-C, middle zone of the basin.
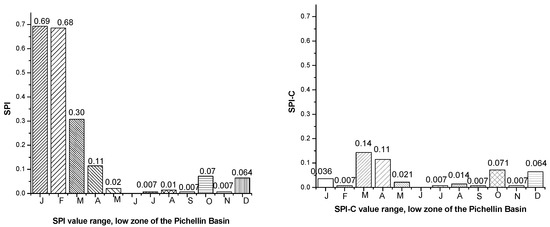
Figure 16.
Comparative SPI and SPI-C, low zone of the basin.
In the middle and high zone, the SPI obtained the same values as the SPI calculated initially. This is because the correction is made for months that exceed the zero precipitation in more than half of the available data.
The SPI-C substantially reduced these values of the index, falling in the month of January from Z = 0.693 → Z = 0.036 and in the month of February from Z = 0.686 → Z = 0.007, classified as normal in the classification table of the SPI suggested by [2]. There was a considerable reduction in the SPI-C values, in the months in which zero was presented in more than half of the monthly precipitation data, as can be seen in Figure 17.
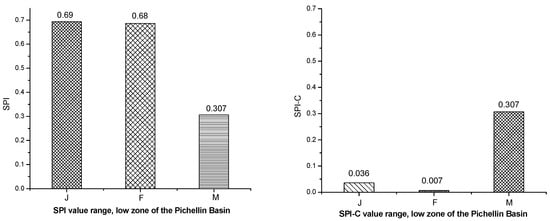
Figure 17.
Comparative SPI and SPI-C, low zone of the basin in January February and March.
To check the validity of the correction, the correlation between the SPI and the SPI-C, for the month of January, February and March was determined through Pearson’s linear determination coefficient, this is a measure of linear dependence between two quantitative random variables; this means that the mathematical model used to approximate the relationship between the variable (SPI-C) and the independent variable (SPI) reflects a high correlation. Figure 18 and Figure 19 and Table 3 show the correlation between SPI and SPI-C.
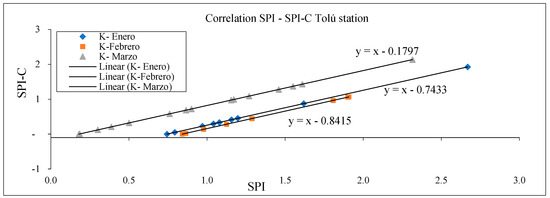
Figure 18.
SPI-SPI-C, Tolú station correlation.
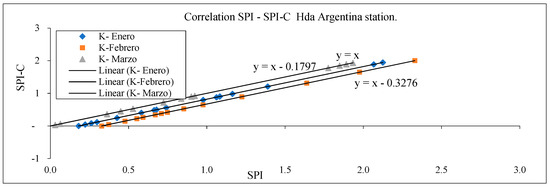
Figure 19.
SPI-SPI-C, Tolú station correlation.
Table 3.
Calculation of the fit of the model and correlation of the SPI.
4. Conclusions
SPI was evaluated with information from the study area. The Pechelín basin has critical weather conditions, registering high temperatures and low precipitation. The months of December, January, February and March were identified as the months with the least rainfall during the year. In addition, there are periods of rain during June and July. The identification of periods with low rainfall was important to evaluate the SPI and its effectiveness in evaluating drought. It was identified that, for January, February and March, the SPI began to show increasingly higher “moderately wet” values in the lower area of the basin. This happened only because these months had zero precipitation (0 mm/month) in more than 50% of the available data. In this way, it is shown that it is necessary to correct the SPI values when subjected to these conditions, due to the deviations in the values obtained.
Deviations in SPI values when calculated with a high frequency of zero precipitation, means that the SPI does not correctly represent the drought under these conditions. In addition, the correction of the values carried out by the SPI-C reduced the “wet” values, determining values that tend to the “drought” and “normal” range, according to the classification table suggested by [2].
The SPI-C only corrected the values when there is zero monthly precipitation (0 mm/month) in more than half of the data. The SPI-C reduced the values for January in the low zone of the Pechelín basin from Z = 0.693 → Z = 0.036 and for the month of February from Z = 0.686 → Z = 0.007. These results obtained by the SPI-C better represent the high frequency of data with zero precipitation.
The results obtained in the investigation show that the calculated “wet” values when the proportion of zero precipitation exceeds 50% of the data. On the other hand, the SPI-C determines values equal to the SPI when half the data with zero is not exceeded. Therefore, this study concludes that the correction factor (correction factor K) should be used only when the amount of data with zero precipitation exceeds half of the total available data.
The SPI-C improves the identification of drought, due to the correction in the deviations of the values produced by the frequency of zero; This makes it possible to organize and manage the prevention plan for periods of drought in the study area, for the benefit of the inhabitants and the biodiversity associated with the hydrographic basin. From the collected evidence, the SPI-C is a methodology that can be applied in different tropical areas that have similar precipitation characteristics, it is suggested to carry out its evaluation in different areas of the world that present this meteorological condition.
Author Contributions
Conceptualization, L.J.C.R.; methodology, L.J.C.R.; software, L.J.C.R.; validation, H.Á.R., L.C.S.H. and L.J.C.R.; formal analysis, L.J.C.R.; investigation, L.J.C.R.; resources, H.Á.R., L.C.S.H. and L.J.C.R.; data curation, L.J.C.R.; writing—original draft preparation, L.J.C.R., H.Á.R. and L.C.S.H.; writing—review and editing, L.J.C.R. and L.C.S.H.; visualization, L.J.C.R.; supervision, H.Á.R.; project administration, L.J.C.R. and L.C.S.H.; funding acquisition, L.J.C.R. All authors have read and agreed to the published version of the manuscript.
Funding
This research received no external funding.
Institutional Review Board Statement
Not applicable.
Informed Consent Statement
Not applicable.
Data Availability Statement
The data presented in this study are available on request from the corresponding authors.
Acknowledgments
The first author is grateful to the Universidad del Norte, Colombia for allowing me to study for a PhD in Engineering. Luis Cerpa Mercado and Erick Arturo Betanzo Torres is thanked for his technical support.
Conflicts of Interest
The authors declare no conflict of interest.
References
- Mohammed, R.; Scholz, M.; Zounemat-Kermani, M. Temporal Hydrologic Alterations Coupled with Climate Variability and Drought for Transboundary River Basins. Water Resour. Manag. 2017, 31, 1489–1502. [Google Scholar] [CrossRef]
- Edwards, D.C.; McKee, T.B. Characteristics of 20th Century Drought in the United States at Multiple Time Scales. Master’s Thesis, Air Force Institute of Technology, Dayton, OH, USA, 1997. [Google Scholar]
- Rouault, M.; Richard, Y. Intensity and Spatial Extension of Drought in South Africa at Different Time Scales. Water SA 2003, 29, 489–500. [Google Scholar] [CrossRef]
- Pasho, E.; Camarero, J.J.; de Luis, M.; Vicente-Serrano, S.M. Impacts of Drought at Different Time Scales on Forest Growth across a Wide Climatic Gradient in North-Eastern Spain. Agric. For. Meteorol. 2011, 151, 1800–1811. [Google Scholar] [CrossRef]
- Santos, E.B.; de Freitas, E.D.; Rafee, S.A.A. Spatio-temporal Variability of Wet and Drought Events in the Paraná River Basin—Brazil and Its Association with the El Niño—Southern Oscillation Phenomenon. Int. J. Climatol. 2021, 41, 4879–4897. [Google Scholar] [CrossRef]
- Muthuvel, D.; Mahesha, A. Spatiotemporal Analysis of Compound Agrometeorological Drought and Hot Events in India Using a Standardized Index. J. Hydrol. Eng. 2021, 26, 04021022. [Google Scholar] [CrossRef]
- Giddings, L.; SOTO, M.; Rutherford, B.M.; Maarouf, A. Standardized Precipitation Index Zones for Mexico. Atmósfera 2005, 18, 33–56. [Google Scholar]
- Cerón, W.L.; Escobar, Y.C.; Montoya, O.L.B. Índice Estandarizado de Precipitación (SPI) Para La Caracterización de Sequías Meteorológicas En La Cuenca Del Río Dagua-Colombia. Estud. Geográficos 2015, 76, 557–578. [Google Scholar] [CrossRef][Green Version]
- Rahman, K.U.; Shang, S.; Zohaib, M. Assessment of Merged Satellite Precipitation Datasets in Monitoring Meteorological Drought over Pakistan. Remote Sens. 2021, 13, 1662. [Google Scholar] [CrossRef]
- Radia, G.; Kamila, B.H.; Abderrazak, B. Highlighting Drought in the Wadi Lakhdar Watershed Tafna, Northwestern Algeria. Arab. J. Geosci. 2021, 14, 984. [Google Scholar] [CrossRef]
- Neves, A.D.O.; Vilanova, M.R.N. Caracterização Da Seca Histórica Da Década de 2010 Na Bacia Do Rio Paraíba Do Sul, Estado de São Paulo, Brasil. Eng. Sanit. Ambient. 2021, 26, 339–349. [Google Scholar] [CrossRef]
- Bi, V.N.G.; Adjakpa, T.; Allechy, F.; Ta, M.Y.; Assa, Y.; AFFIAN, K. Characterization of the Drought by the Spi and Spei Indices in the West Center of Côte d’ivoire Case of the Lobo Basin. LARHYSS J. 2020, 43, 23–39. [Google Scholar]
- Belayneh, A.; Adamowski, J.; Khalil, B.; Ozga-Zielinski, B. Long-Term SPI Drought Forecasting in the Awash River Basin in Ethiopia Using Wavelet Neural Network and Wavelet Support Vector Regression Models. J. Hydrol. 2014, 508, 418–429. [Google Scholar] [CrossRef]
- Vicente-Serrano, S.M.; Beguería, S.; López-Moreno, J.I. A Multiscalar Drought Index Sensitive to Global Warming: The Standardized Precipitation Evapotranspiration Index. J. Clim. 2010, 23, 1696–1718. [Google Scholar] [CrossRef]
- Guttman, N.B. Accepting the Standardized Precipitation Index: A Calculation Algorithm. J. Am. Water Resour. Assoc. 1999, 35, 311–322. [Google Scholar] [CrossRef]
- Makungo, R.; Odiyo, J.; Mathivha, F.I.; Nkuna, T.R. Hydrological hazards in Vhembe district in Limpopo Province, South Africa. Jàmbá J. Disaster Risk Stud. 2019, 11, 1–13. [Google Scholar]
- Lloyd-Hughes, B.; Saunders, M.A. A Drought Climatology for Europe. J. R. Meteorol. Soc. 2002, 22, 1571–1592. [Google Scholar] [CrossRef]
- Angelidis, P.; Maris, F.; Kotsovinos, N.; Hrissanthou, V. Computation of Drought Index SPI with Alternative Distribution Functions. Water Resour. Manag. 2012, 26, 2453–2473. [Google Scholar] [CrossRef]
- Blain, G.C. Standardized Precipitation Index Based on Pearson Type III Distribution. Rev. Bras. Meteorol. 2011, 26, 167–180. [Google Scholar] [CrossRef]
- Sobral, B.; Oliveira-Junior, J.; de Gois, G.; Pereira-Júnior, E.; de Bodas Terassi, P.; Muniz-Júnior, J.; Bastos, G.; Zeri, M. Drought Characterization for the State of Rio de Janeiro Based on the Annual SPI Index: Trends, Statistical Tests and Its Relation with ENSO. Atmos. Res. 2019, 220, 141–154. [Google Scholar] [CrossRef]
- Bhunia, P.; Pritha, D.; Maiti, R. Meteorological Drought Study through SPI in Three Drought Prone Districts of West Bengal, India. Earth Syst. Environ. 2020, 4, 43–55. [Google Scholar] [CrossRef]
- Nguvava, M.; Abiodun, B.J.; Otieno, F. Projecting Drought Characteristics over East African Basins at Specific Global Warming Levels. Atmos. Res. 2019, 228, 41–54. [Google Scholar] [CrossRef]
- Vijay, A.; Sivan, S.D.; Mudbhatkal, A.; Mahesha, A. Long-Term Climate Variability and Drought Characteristics in Tropical Region of India. J. Hydrol. Eng. 2021, 26, 05021003. [Google Scholar] [CrossRef]
- Mallenahalli, N.K. Comparison of Parametric and Nonparametric Standardized Precipitation Index for Detecting Meteorological Drought over the Indian Region. Theor. Appl. Climatol. 2020, 142, 219–236. [Google Scholar] [CrossRef]
- Pandey, R.P.; Dash, B.B.; Mishra, S.K.; Singh, R. Study of Indices for Drought Characterization in KBK Districts in Orissa (India). Hydrol. Processes Int. J. 2008, 22, 1895–1907. [Google Scholar] [CrossRef]
- Jesus, E.T.; da Amorim, J.S.; Junqueira, R.; Viola, M.R.; Mello, C.R. Meteorological and Hydrological Drought from 1987 to 2017 in Doce River Basin, Southeastern Brazil. RBRH 2020, 25, e29. [Google Scholar] [CrossRef]
- Ntale, H.K.; Gan, T.Y. Drought Indices and Their Application to East Africa. Int. J. Climatol. J. R. Meteorol. Soc. 2003, 23, 1335–1357. [Google Scholar] [CrossRef]
- Rodríguez, J.J.; García, M.A. Evaluación de Las Sequias En El Norte de Sudamérica Utilizando Mallas de Precipitación y Temperaturas. Ph.D. Thesis, Pontificia Universidad Javeriana, Bogotá, Colombia, 2014. [Google Scholar]


Publisher’s Note: MDPI stays neutral with regard to jurisdictional claims in published maps and institutional affiliations. |
© 2022 by the authors. Licensee MDPI, Basel, Switzerland. This article is an open access article distributed under the terms and conditions of the Creative Commons Attribution (CC BY) license (https://creativecommons.org/licenses/by/4.0/).