Abstract
From 17:00 to 18:00 local standard time (LST) on 3 July 2019, a rare strong tornado occurred in Kaiyuan, Liaoning Province, northeast China. NCEP/NCAR 0.25° × 0.25° reanalysis data and WRF4.0 numerical prediction models were used to carry out the numerical simulation. Double nesting was adopted, and the horizontal grid distance was 9 km by 3 km. Based on the observation data of China meteorological observation stations, surface and upper charts, Doppler radar data, Himawari(HMW)-8 satellite images and numerical simulation results, the mesoscale structure and mechanism of the tornado were studied. The results show that: (1) At the northwest edge of the subtropical high, and the northeast cold vortex located in Northeast China, when the transverse trough moves southward, cold air is supplied continuously. Under the joint influence of the surface northeast cyclone, these are the main synoptic features of the tornado; (2) The northeast cold vortex cloud system was located at the junction of Heilongjiang and Jilin Provinces, and a squall line cloud system is formed. The tornado occurred at the tail of the squall line, and the strongest echo reached 65 dBZ. A mesocyclone, a 20 km northwest–southeast convergence belt, V-shaped gap, echo overhang structure and tornado vortex feature (TVS) were detected by the Doppler radar; (3) Before the tornado occurred, dry and cold air intruded from the northwest of the cold vortex, and a water vapor convergence zone appeared south of the squall line. The water vapor saturation zone with 80% relative humidity in northeast China was concentrated at 700 hPa, and the 20% dry column dropped down to 500 hPa between 115 and 124° E from the west. On the 850 hPa physical fields, there was a −20 × 10−5 s−1 convergence zone, and a 16 × 10−5 s−1 divergence belt appeared south and north of the squall line. A negative vorticity belt and a positive vorticity belt appeared south and north of the squall line, respectively. Kaiyuan is located at the smallest vertical shear, which is the junction place of three large vertical shear belts; (4) After 10:00 LST, the westerly wind 20 (10) m·s−1 dropped to 400 (800) hPa between 126 and 127° E. The northerly gale at 300 hPa north of 45° N moved southward. The rising center of the low level at 17:00 LST at approximately 45° N moved southward, and a sinking center appeared above it; (5) Several pairs of positive and negative vorticity columns formed between the lower troposphere and the place where the tornado occurred. There was convective instability at the lower level. CAPE increased, 0–3 km vertical wind shear increased, and LCL decreased remarkably during the afternoon.
1. Introduction
A tornado is a severe convective disastrous weather system that can cause heavy casualties and property losses. Due to its characteristics of a small spatial scale, short life history and complex wind field, it is very difficult to forecast a tornado with short-term timeliness. Currently, forecasting can only occur in the short-term and nowcasting stage. Many contemporary scholars have conducted in-depth and extensive research on tornadoes; most of them in northeast China occur under the background of a northeast cold vortex [1]. Most tornadoes are mesocyclone tornadoes, but some mesocyclones can develop into tornadoes [2]. When the height between the cyclone bottom and the ground is less than 1 km, the occurrence probability of tornado is approximately 40% [3]. Tornado vortex feature (TVS) detected by radar is an important basis for tornado approaching early warning [4]. The occurrence of tornadoes requires large convective available potential energy (CAPE) and strong 0–6 km layer vertical wind shear [5]. It is more conducive to the occurrence of tornado, where large vertical wind shear is concentrated in the lower height rather than 0~6 km [6,7]. Due to the lack of observation data, numerical prediction models have become an important tool in studying tornadoes. Lewellen et al. (2000) conducted highly idealized large-eddy-resolving simulations of tornadoes [8]. Zhang L. et al. (2021) found that a rear inflow jet descending from the mid-level to surface contributed to the formation of a bow echo and resulted in damaging local winds [9]. Above an EF4 tornado that occurred in Funing, northern Jiangsu Province, China, five nested forecast experiments were run in the WRF model, with the horizontal grid spacing of the inner-most nest being 4000, 1333, 444, 148, and 49 m, although a tornado-like vortex did not develop until the grid spacing was 444 m or less [10]. Strong midlatitude weather systems from the north in the spring and summer seasons is apparently the context with the most favorable conditions for tornadoes [11]. Recently, in order to expand tornado research, many simulations of tornadoes with high resolutions have been performed. The intensity of a tornado on the 50 m grid reaches the high end of category 3 on the Fujita scale (F3), whereas the corresponding simulated tornado on the 100 m grid reaches F2 intensity [12]. The structures of the multiple subtornadic-scale vortices were similar to that of tornadic vortices in certain respects [13]. Initially the radar-observed tornadic vortices were detected aloft, when they subsequently descended, which led to tornadogenesis [14]. Ensemble-based probabilistic tornado forecasts based upon near-surface wind and/or vorticity fields at 10 m above the surface produce skillful forecasts of tornadoes in terms of area under the relative operating characteristic curve, with probability swaths extending along and to the northeast of the observed tornado path [15]. Trajectory-based analyses of vorticity components and their time evolution reveal that the tilting of low-level frictionally generated horizontal vorticity plays a dominant role in the development of vertical vorticity near the ground [16]. Closer examination of the genesis of the tornado-like vortex (TLV) suggests that a strong low-level updraft is critical in converging and amplifying vertical vorticity associated with the mesovortex [17]. A deep upper-level damping zone is used to prevent upper-level disturbances from affecting the low-level vortex [18]. In the full-wind drag experiment, a tornado develops around 25 min into the simulation and persists for more than 10 min; in the environmental-only drag experiment, no tornado occurs [19]. The secondary rear-flank downdraft (RFD) surge played a key role in tornadogenesis by barotropically transporting the large streamwise vorticity associated with the environmental low-level veering shear toward the surface [20]. The tornado was generated at the leading edge of a rear-flank downdraft (RFD) outflow surge [21]. The frictional term is the dominant vorticity source responsible for the vortices at both the pretornadic and tornadogenesis times [22].
In summary, the above studies are useful for understanding the structural characteristics of tornadoes. Small-scale systems are bred and developed by large- and medium-scale systems, which are inseparable from the energy, instability conditions and trigger mechanism provided by the large-scale circulation background. In this paper, conventional surface and upper synoptic charts, satellite images, Doppler radar data, encrypted observation data, 6 h NCEP/NCAR 0.25° × 0.25° reanalysis data, and WRF numerical simulations are used to study this case. The aim of this research is to find some large-scale weather background and meso- and microscale system characteristics to reveal the environmental conditions conducive to the occurrence of tornadoes, so the forecast accuracy can be improved, and the forecast validity can be prolonged.
2. Case Overview and Synoptic Conditions
2.1. Disaster Analysis
Between approximately 17:17 and 17:47 LST on 3 July 2019, rare severe convective weather events, including severe tornado, hail, and short-term heavy precipitation, occurred in Kaiyuan (42.3° N, 124.0° E), Liaoning Province, China [23]. It occurred 0.5 km north of Jinying village (42.5949° N, 123.9987° E), Jingouzi town, Kaiyuan city, and then it moved southeast; the distance covered was approximately 15 km. According to the Kaiyuan meteorological observation station, the maximum instantaneous wind speed was 23.0 m·s−1 at 17:46 LST, reaching above Beaufort force 9. From 17:00 to 18:00 LST, the precipitation was 25 mm h−1. According to on-site disaster investigations, the intensity of the tornado reached level 4 of China’s meteorological industry standard (equivalent to EF4 in the United States). Many villages in Kaiyuan city were affected, with many houses, electricity and communication infrastructure seriously damaged [24].
2.2. Synoptic Situation Analysis
At 08:00 LST on 3 July 2019, a northeast cold vortex appeared at the 500, 700, and 850 hPa isobaric charts, which were all located in western Heilongjiang Province. As cold vortexes split out transverse troughs continuously, stepped troughs were formed. (Figure 1a–c). The 500 hPa cold vortex was −16 °C, 560 dagpm. Kaiyuan was under the control of the northwesterly flow at 500 and 700 hPa, and because it was located behind the trough, it was southwesterly at 850 hPa. The areas of Shangdong, Anhui, Henan, and Jiangsu provinces were controlled under the 20 °C warm core. At 08:00 LST on 3 July, at the surface chart, a 1005 hPa low-pressure center appeared in the central and western regions of Heilongjiang and Jilin provinces. Subsequently, at 17:00 LST, the pressure of the low center dropped to 1002 hPa, and it reached the junction of Liaoning, Jilin, and Inner Mongolia. Kaiyuan was located 100 km southeast of the low center, i.e., ▲ in Figure 1d. There appeared an inverted trough, which started from the lower center and then moved through central Jilin, and reached in central Heilongjiang. There was weak anticyclonic circulation west of the inverted trough and a small high pressure of 1004 hPa at the east. The northeast cold vortex was over the northern end of the inverted trough, and the southern end was located in the center of the low surface pressure. Of course, from other aspects, at 17:00 LST, the inverted surface trough in northeast China may also be an occlusion front; thus, the tornado occurred near the occlusion point, which was 100 km away southeast.
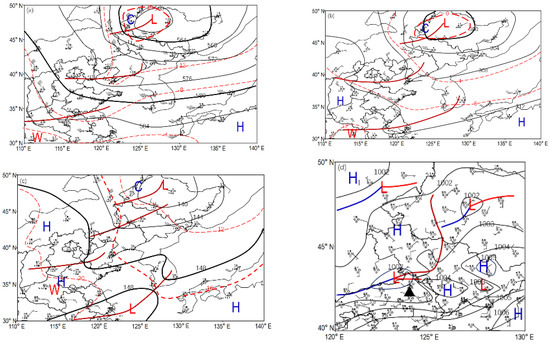
Figure 1.
Upper synoptic charts (a) 500 hPa, (b) 700 hPa, (c) 850 hPa at 08:00 LST, and (d) surface synoptic chart at 17:00 LST, 3 July 2019. Black contours in (a–c) are isoheights (unit: dagpm). Black contours in (d) are isobars (unit: hPa). A full bar is 4 m·s−1. In (d), the blue lines are cold fronts, the red lines are warm fronts, and the brown line is an inverted trough. Kaiyuan is marked with a black triangle.
The northeast cold vortex (560 dagpm, −18 °C) is deep (Figure 2a,b), and its center falls south of Heilongjiang, where a vortex can be seen at 700 and 850 hPa (Figure 2c).
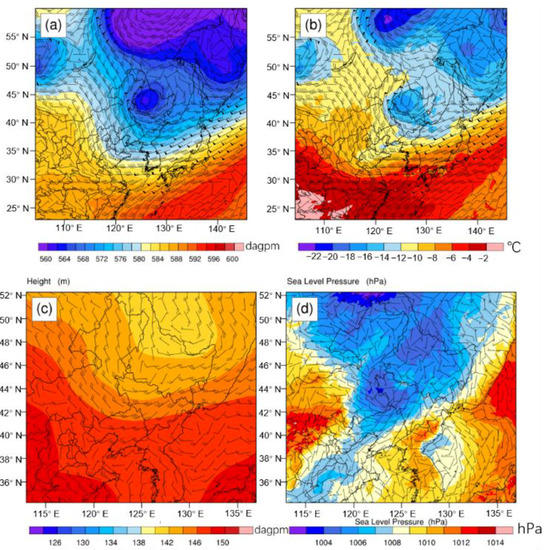
Figure 2.
(a) Potential height (shaded areas, dagpm) and horizontal winds at 500 hPa; (b) temperature (shaded areas, °C) and horizontal winds at 500 hPa; (c) potential height (shaded areas, dagpm) and horizontal winds at 850 hPa; (d) pressure (shaded areas, hPa) and horizontal winds at sea level at 08:00 LST on 3 July 2019. A full bar is 4 m·s−1.
With the strengthening of the extension of the west high ridge to the northeast, the north wind jet in the west of the cold vortex strengthened, guiding the colder air in the north to accelerate southward. At the same time, due to the strong eastern subtropical high, the southwest airflow in front of the upper trough was sped up. There was a warm tongue extending from the southwest at the low level of 925 hPa. The 08:00 LST surface weather chart (Figure 2d) showed 1005 and 1004 hPa low-pressure centers in central Heilongjiang and central Jilin, respectively. There was a cold front that lay from Heilongjiang, central Jilin, to western Liaoning; at the same time, there was a warm front east of Heilongjiang. Subsequently, at 14:00 LST, a 1003 hPa low-pressure center was located in central Jilin, and the other 1002 hPa center was near Kaiyuan. The small northern cold front moved southeast. Southwest Liaoning, Hebei, Beijing, and Shandong were under the control of northwest upper-level flow, and the weather was clear; as a result, the surface area temperature was above 35 °C in the afternoon. Guided by southwesterly winds in front of the upper trough, unstable energy was continuously transmitted to northeast China. From 08:00 to 17:00 LST, at 500 hPa, the transverse trough in northeast China turned vertical, a −16 °C 564 dagpm cold vortex center moved southward over Kaiyuan, and the southwest airflow in front of the upper trough strengthened under the obstruction of the eastern subtropical high. At 850 hPa, a 9 °C 138 dagpm cold vortex moved eastward to the junction of Heilongjiang and Jilin, 70 km northeast of Kaiyuan, and there was a transverse trough over Kaiyuan. At 17:00 LST (Figure 1d), a 1002 hPa low-pressure center was present at the junction of Jilin and central Liaoning, and the other 1003 hPa center was east of Jilin. A cold front lay from central Liaoning to northern Hebei, and a warm front lay from the low center to the east. An inverted surface trough extended northward from the junction of Jilin and Liaoning to the north central part of Heilongjiang. When the tornado occurred in Kaiyuan city, Liaoning Province, at 17:17 LST, it was approximately 100 km southeast away from the low center; then, it moved approximately 15 km southeast, and it lasted approximately 30 min.
2.3. Analysis of Satellite and Doppler Radar
At 08:00 LST on 3 July 2019, a cold vortex cloud system appeared at the junction of Heilongjiang and Jilin; then, intruded by dry and cold air from its northwest side, a squall line cloud system formed in the southeast, and the southwest flowed at the west of the subtropical high.
Subsequently, it continued to develop and grow; the rear side was neat, which indicated that the dry cold air was relatively strong. Obstructed by the strong southeast subtropical high, the northeast cold vortex moved slowly eastward, and the squall line was almost stationary. At 16:00 LST, a 100 km long and 20 km wide stratiform cloud belt stretched westward at the tail of the squall line, 100 km northeast of Kaiyuan. Then, at 17:00 LST, it rapidly grew into a −47 °C oval cloud block, with gaps to the northeast and southeast, indicating that northwest airflow intruded to the northeast and southeast airflow intruded to the southeast. At 18:00 LST (Figure 3a,b), the TBB decreased to −52 °C. The head was very smooth; therefore, the dry and cold air in the northwest was strong and there is a gap in the −52 °C cloud block, indicating that southeast air intruded at the upper level. Thus, a cyclonic circulation formed over Kaiyuan. At 16:00 LST, a supercell with a length of approximately 200 km forms near Jinzhou on the north side of Liaodong Bay. At 17:00 LST, it reached between Jinzhou and Yingkou, and the TBB (black body brightness temperature) increased to −57 °C. At 18:00 LST, the TBB decreased to −52 °C. The northeast boundary of the supercell was consistent with the southwest boundary of the squall line; both were in the northwest–southeast direction, indicating that their airflow directions were the same. At 17:17 LST, at the tail of the squall line, a tornado occurred in Kaiyuan, Liaoning Province. The occurrence of a supercell precedes that of the tornado; therefore, it can be considered that the supercell provided the southeast jet for the triggering of the tornado.
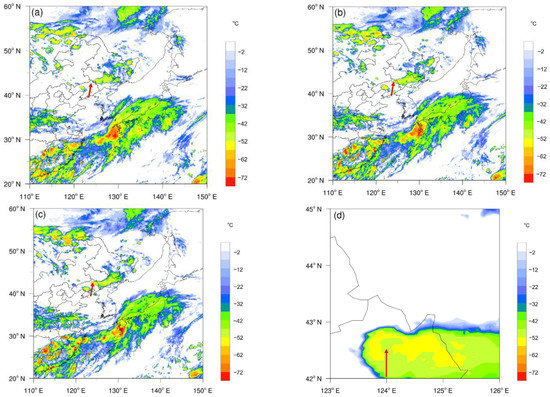
Figure 3.
The HMW-8 satellite image (TBB, unit: °C) at (a) 16:00 LST, (b) 17:00 LST, and (c) 18:00 LST on 3 July 2019. (d) Enlarged view of the squall line tail in (c). The red arrows point to where the tornado appeared.
The observation on the 0.5° elevation Doppler velocity map of the Shenyang radar station approximately 60 km southwest of Kaiyuan at 16:27:21 LST showed that a 20 km northwest–southeast convergence zone appeared at a height of 3.4 km and 70 km northeast of Kaiyuan, with a 10.0 m·s−1 velocity center and a −27.0 m·s−1 center, respectively.
At 17:00:26 LST, the 0.5° elevation reflectivity map showed that there was an east−west squall line echo zone 75 km northeast away. On the lines of Huinan, Dongfeng, Xifeng, and Kaiyuan, the strongest echo was 60 dBZ, between Kaiyuan and Xifeng. Next, the squall line at Kaiyuan grew stronger, whereas the other parts weaken; then, it was completely broken from the other parts, and the radar echo became the strongest: 65 dBZ. The squall line developed and moved southward, whereas the Kaiyuan part moved less and grew continually in the northwest–southeast direction. The 6° elevation Doppler velocity map showed that there was a pair of positive and negative velocity centers 9 km north of Kaiyuan, with the greatest velocities of 15.0 m·s−1 and −31.0 m·s−1, respectively; velocity ambiguity appeared, and the convective system tilted from north to south with height. At 17:27:58 LST, the 3.3° elevation Doppler velocity map showed that a pair of positive and negative velocities centers appeared 5 km above Kaiyuan (Figure 4a), 16.0 m·s−1 and −31.0 m·s−1. The sum of the absolute values of the two centers was greater than 45 m·s−1, and the distance between the two centers was approximately 20 km; this is called TVS, which is a typical tornado characteristic. A mesocyclone appeared 3 km from the tail of the squall line. Velocity pairs also appeared on other elevation velocity diagrams of 0.5°, 1.5°, 2.4°, 4.5°, 9.9°, and 14.6°, tilting southwest with height, and the height of the vertical wind shear center decreased. At 17:22:30 LST (Figure 4b), near Kaiyuan, a V-shaped gap appeared southeast of the rear of the squall line, and a V-shaped gap also appeared in the north; they both lasted until 17:39:01 LST. On segment AB on the 0.5° elevation reflectivity map at 17:22:30 LST (Figure 4c), on the reflectivity vertical profile, the high reflectivity echo area tilted to the inflow side (northwest) with height, reflecting the weak low-level echo area and the mid- and high-level echo overhang structure, with the maximum exceeding 65 dBZ. The V-shaped gap echo south of the squall line tail indicated that the strong southeast inflow entered the updraft, whereas the north inflow indicated that the strong northwest inflow entered the downdraft and could cause destructive gales. At 18:12 LST, the Kaiyuan echo was completely broken from the other part of the squall line.
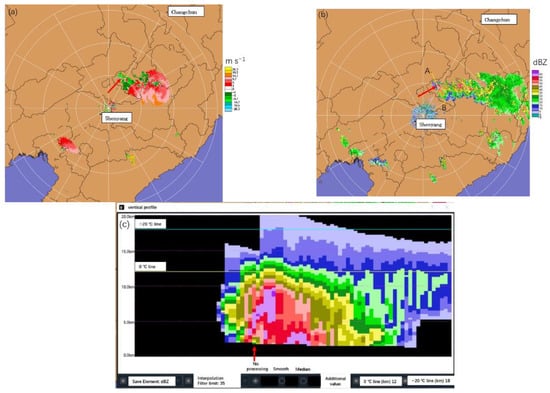
Figure 4.
(a) The 3.3° elevation Doppler velocity at 17:27:58 LST. (b) The 0.5° elevation reflectance at 17:22:30 LST. (c) Cross-section of reflectivity along line AB in Figure 4b. The color bar and unit are the same as in (b). of Shenyang Doppler radar on 3 July 2019. The red arrows point to where the tornado appeared.
2.4. Design of Numerical Experiments
The advanced research WRF (ARW) modeling system [25] has been in development for the past nineteen years. Version 4.0 has been available since June 2018. The ARW is designed to be a flexible, state-of-the-art atmospheric simulation system which is portable and efficient on available parallel computing platforms. The ARW modeling system is suitable for use in a broad range of applications, across scales ranging from meters to thousands of kilometers. This study was performed by NCAR, which is publicly available 0.25° × 0.25° reanalysis data. One-way nested grids were employed (Figure 5). The centers of Domain1 and Domain2 were at 45.0° N and 125.0° E, with grid spacings of 9 and 3 km, respectively. The numbers of grid points were 480 × 480 and 721 × 661, respectively. There were 33 layers in the vertical direction. The simple ice phase scheme and Kain–Fritsch cumulus parameterization scheme were used. The rapid radiative transfer model (RRTM) and the Dudhia scheme were employed for longwave and shortwave radiative flux calculations, respectively; the Mellor–Yamada–Janjic (MYJ) TKE scheme was utilized for the planetary boundary layer; and the unified Noah land surface model was also used. The integrations were performed for 24 h from 20:00 LST, 2 July 2019, to 20:00 LST, 3 July 2019. Examining the geopotential height fields of 500, 700 and 850 hPa at 08:00 and 20:00 LST, as well as the surface pressure field, it was observed that these were basically consistent with the actual meteorological observation fields.
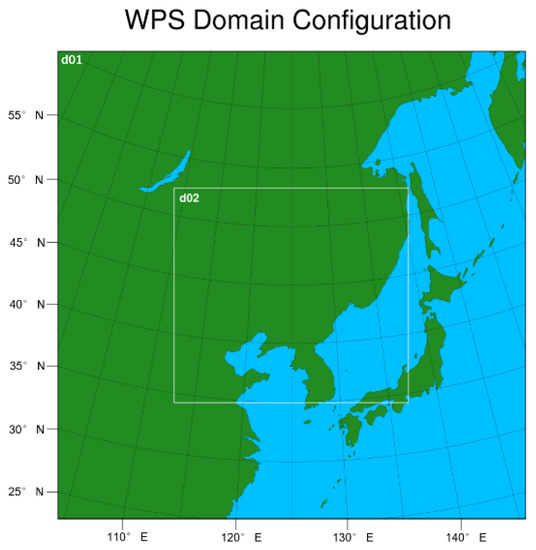
Figure 5.
Two nested model domains (D01 and D02) and their horizontal resolutions (9 km and 3 km, respectively).
Figure 6 shows the terrain of northeast China, with the main place names in the article shown.
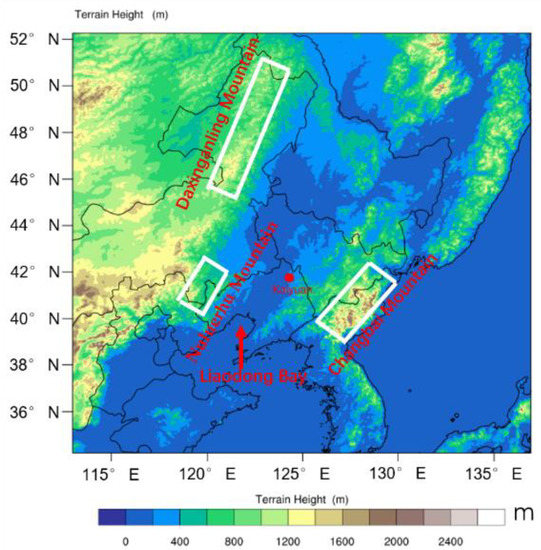
Figure 6.
The terrain height (shaded; m) of Northeast China.
3. Results
3.1. Analysis of Water Vapor Condition
At 12:00 LST (Figure 7a) [26] on 3 July 2019, at 850 hPa, a 500 km long and 100 km wide northwest–southeast water vapor divergence zone appeared in the northwest jet in western Jilin, with a maximum of 8 g/(cm2·hPa·s), indicating that the strong dry and cold air moved southeast along the northwest jet. At 17:00 LST (Figure 7b), the trough moved to eastern Heilongjiang, Jilin and the junction of Liaoning and central Jilin. In front of it, there was a water vapor convergence zone, distributed in an east–northeast belt, similar to the shape of the satellite picture, with its organization strengthened and the central strength increased. Several strong water vapor convergence centers were embedded among them, and the maximum was −20 g/(cm2·hPa·s). On the northwest side, it was close to a water vapor divergence zone, its organizational structure was also strengthened, and the center was 12 g/(cm2·hPa·s).
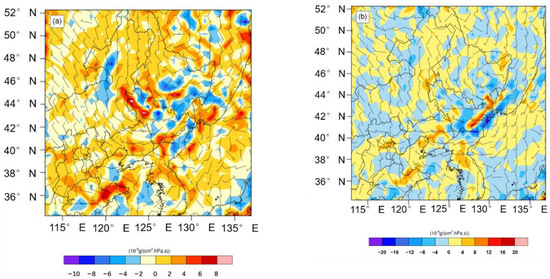
Figure 7.
Horizontal winds (barbs; m·s−1) and water vapor flux divergence (shaded; 10−8 g/(cm2·hPa·s)) at (a) 12:00 LST and (b) 17:00 LST at 850 hPa in Domain 2 on 3 July 2019. A full bar is 4 m·s−1.
At 11:00 LST, the relative humidity vertical profile in the zonal direction of 42.5° N (Figure 8a) [27] showed a high humidity zone between 115 and 134° E, from west to east, with 700 hPa as the center, which was larger than 80% between 124 and 134° E. Between 115 and 128° E, at 350–500 hPa, there was a dry area lower than 20%, which intruded obliquely from west to the east and in places on the 700 hPa high-humidity zone. Dry and cold air intruded with the northwest airflow from the west side of the northeast cold vortex. In the meridional direction along 124.0° E (Figure 8b), there was also a saturated water vapor zone centered at 700 hPa, with a humidity maximum larger than 80%, two sinking dry columns placed above it; one was around 48° N, and the humidity 30% sank to 500 hPa, another was between 38 and 42° N, the humidity 10% sank from 200 hPa, and the humidity 20% reached 500 hPa. The convective system tilted from north to south with height, indicating that the dry air sank obliquely from south to north. In contrast to the satellite picture, the deep convective system appeared between 42 and 44° N, there was a squall line on the southeast side of the northeast cold vortex, and the 48° N dry column in the north was caused by the intrusion of dry cold air from the northwest of the cold vortex, whereas the 38–42° N downdraft dry column was compensated for by the squall line and the updraft of deep convection in the southwest airflow in front of the upper trough. At 17:00 LST, Figure 8c shows that in the zonal direction of 42.5° N, dry air sank at 200 hPa approximately 125° E west of the squall line, and the 50% column reached 250 hPa at approximately 130° E, corresponding to the squall line, and upper dry and cold air subsided west of the deep convection system. Figure 8d shows that in the meridional direction of 124.0° E, a 10% long and narrow dry air column dropped from 200 to 500 hPa between 35 and 37° N, and the 20% dry area extended northward to 42–43° N. Over the next hour, the 10% column was discontinuous between 200 hPa and 350 hPa.
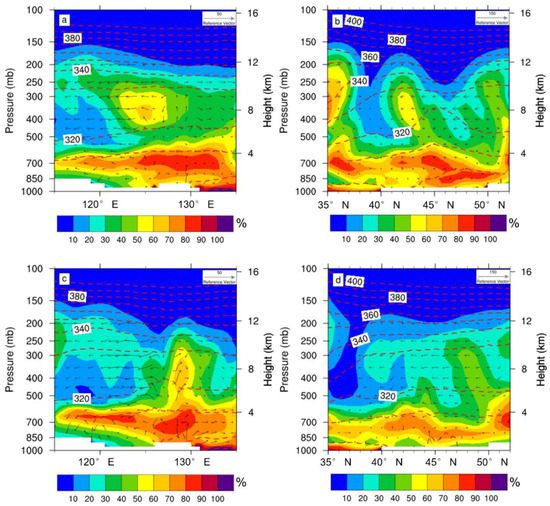
Figure 8.
Vertical cross-section of relative humidity (shaded; %), potential temperature (red contours), uw×50 (vectored) along 42.5° N (a), and 124.0° E (b) at 11:00 LST, along 42.5° N (c), and 124.0° E (d) at 17:00 LST on 3 July 2019 in Domain 2.
3.2. Dynamic Mechanism
At 08:00 LST, Figure 9a shows that the vertical wind shear at 1000–3000 m in the southwest part of the northeast cold vortex was strengthening, the maximum at the junction of Jilin and Heilongjiang reached 16 m·s−1, and it extended to the southeast; the vorticity field was strengthening too, and the maximum in the positive vorticity zone in the southeast of the cold vortex was 24 × 10−5 s−1. At 17:00 LST, Figure 9b shows the vertical wind shear between 1000 and 3000 m, which was strengthened by 18 m·s−1 west of the cold vortex, perhaps which was related to the terrain of Daxinganling. The northeast–southwest high vertical shear zone in the southeast of the cold vortex with the maximum was 16 m·s−1, which was related to the barrier of Changbai Mountain in the west of the subtropical high. A squall line was formed between it and another vertical shear zone to the south–southeast of the cold vortex. Due to the extrusion of Nuluerhu Mountain, a northeast–southwest 14 m·s−1 high vertical wind shear zone appeared in southwestern Liaoning. The junction between them was the smallest vertical shear, where the tornado occurred. The supercell generated in the front right was related to the upper trough of 700 hPa and above; the lowest TBB, −57 °C, was concentrated in the west part, which was proof of the prevailing afternoon valley wind, as well as the sea and land breeze between Liaodong Bay and the land. The three mountain areas are sunny and hot during the daytime, which strengthens convection in the mountain area, and the flat airflow is transported to the mountain area which strengthen the vertical wind shear there. The smallest vertical wind shear center of 4 m·s−1 still existed at the central junction of Liaoning and Jilin. The secondary circulation was downdraft; therefore, the supercell north of Liaodong Bay was completely separated from the squall line southeast of the cold vortex.
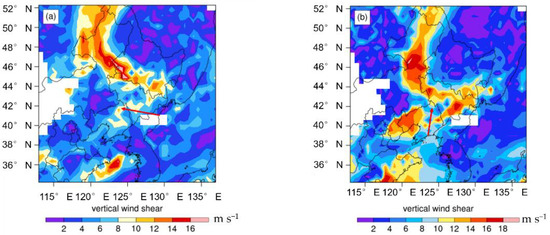
Figure 9.
Vertical wind shear between 1000 and 3000 m (m·s−1) at (a) 08:00 LST; (b) 17:00 LST in Domain 2 on 3 July 2019.
Figure 10a shows that at 17:00 LST, in the 850 hPa divergence field, in the southeast of the cold vortex, a NE–SW-oriented convergence zone appeared from eastern Heilongjiang to eastern Jilin, and a divergence zone was close to it in the southeast. There was a NE–SW-oriented convergence zone in central Liaoning. There was a divergence zone with a −15 × 10−5 s−1 minimum core between the two convergence zones. They coupled with each other well. The satellite pictures (Figure 3) show that the north side of the squall line was very smooth, which was perhaps related to the dry and cold air intruded from the northwest of the cold vortex, sinking and divergent airflow. Figure 10b shows that in the 850 hPa vorticity field, there was a −5 × 10⁻⁵ s−1 negative vorticity center at the middle junction of Liaoning and Jilin, which was surrounded by positive vorticity zones. Figure 10c shows that in the 850 hPa vertical velocity field, there was a positive center of 0.2 m/s and a negative vertical velocity of −0.4 m·s−1 near Kaiyuan.
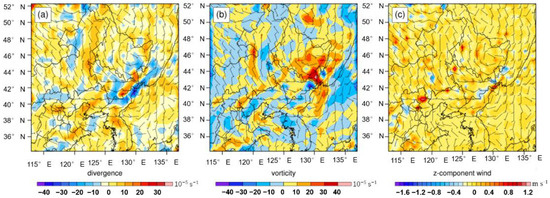
Figure 10.
Horizontal winds and (a) divergence (10−5 s−1), (b) vorticity (10−5 s−1), (c) vertical velocity (m·s−1) at 850 hPa at 17:00 LST in Domain 2 on 3 July 2019. A full bar is 4 m·s−1.
Figure 11a,c shows the vertical cross-section of w(u) along 42.5° N, Figure 11b,d shows the vertical cross-section of w(v) along 124.0° E at 17:00 LST. Figure 11a shows that between 129 and 130° E, a 0.15 m·s−1 rising center appeared at a height of 400–500 hPa. At 700–850 hPa, 121–124° E, there was a 0.1 m·s−1 rising center. Figure 11b shows that at 500–850 hPa, 43–45° N, there was a rising motion column, with a center of 0.35 m·s−1 at 600 hPa. Figure 11c shows that between 123 and 130° E, the westerly gale core subsided from the upper troposphere, a 20 m·s−1 gale core sank from 200 to 400 hPa between 126 and 127° E, a 10 m·s−1 isoline sank to 800 hPa between 123 and 129° E, and in the east there was a low level below 850 hPa. Figure 11d shows that the −27 m·s−1 gale core was between 43 and 46° N and at 250–350 hPa. At approximately 42.5° N, the −10 m·s−1 north isoline reached 650 hPa. There was a 5 m·s−1 wind center below 800 hPa at approximately 40° N.
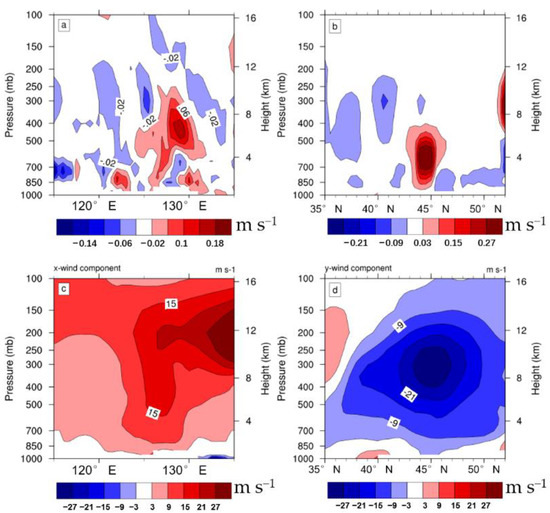
Figure 11.
Vertical cross-section of w (shaded; m·s−1) along 42.5° N (a) and 124.0° E (b); vertical cross-section of u (shaded; m·s−1) along 42.5° N (c); and v (shaded; m·s−1) along 124.0° E (d) at 17:00 LST in Domain 2 on 3 July 2019.
The meridional vertical profiles of vorticity and vw (*50) resultant wind (Plume) along 124.0° E show that, at 03:10 LST (Figure 12a), there was a positive vorticity column between 42 and 44° N, at 600–1000 hPa, with the 15 × 10−5 s−1 center of 850–700 hPa, approximately 43.5° N. The positive vorticity center with a high value above 550 hPa moved southward and sank, between 43 and 48° N, with 30 × 10−5 s−1 center at 250–350 hPa. At 17:00 LST (Figure 12b), between 42.5 and 43.5° N and below 850 hPa, there was a positive vorticity column with a center value of 10 × 10−5 s−1, and there were several negative vorticity columns above it, left and right coupled with it together. Between 44 and 49° N, below 450 hPa, there was a positive vorticity column sink, with the 15 × 10−5 s−1 center at 600–750 hPa at approximately 45° N, which is related to the sinking northeast cold vortex, indicating that the cold vortex drops down to a low level. The zonal vertical profiles of vorticity and u,w*50 resultant wind (Plume) along 42.5 °N show that, at 10:00 LST (Figure 12c), there was a 5 × 10⁻⁵ s−1 positive vorticity column at 122–125° E from a low level to 700 hPa. At 17:00 LST (Figure 12d), between 125 and 127° E, a positive vorticity column sank at 200–500 hPa, the center increased to 30 × 10−5 s−1 near 300 hPa, and there was a negative vorticity column on the north side; at 250–400 hPa, its center was −10 × 10−5 s−1. Between 122 and 123° E, the inclined vorticity column reached 650 hPa with a 10 × 10−5 s−1 center near the surface.
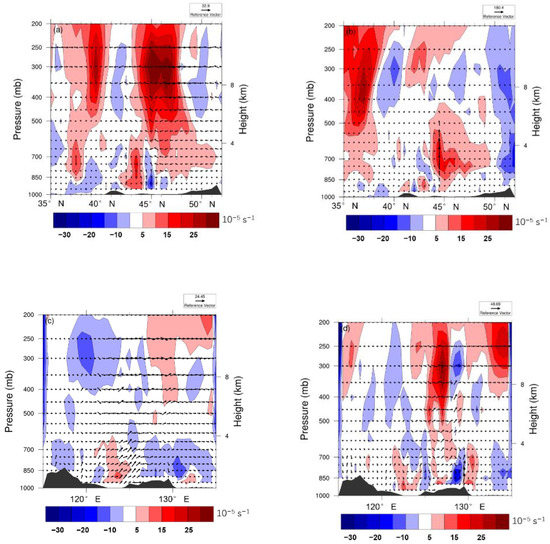
Figure 12.
Vertical profile of the resultant wind (Plume): (a,c) along longitude 124.0° E, v at 10:00 LST; (b,d) along latitudinal 42.5° N vorticity (shaded, unit: 10−5 s−1), u at 17:00 LST and w* 50 (arrows; m·s−1) in Domain 2 on 3 July 2019.
3.3. Thermal and Instability Characteristics
θse zonal vertical profiles along 42.5° N show that the 316 K low value belt was at 600 hPa, at 10:00 LST, including a 316 K small center between 121 and 124° E; subsequently, the 316 K center expanded and moved slowly eastward. At 17:00 LST, Figure 13a shows that the 316 K θse low zone was near 600 hPa, east of 118° E; the lower level was a convective instability zone, with a low center between 125 and 127° E at 550–700 hPa; and the specific humidity was 3 g/kg at 600 hPa between 122 and 123° E. θse meridional vertical profiles along 124.0° E show that at 02:20 LST, the 316 K center was north of 45° N, θse was 324 K at the ground near 42.5° N, and then, subsequently, the 316 K θse low center moved southward. At 03:13 LST, the 316 K θse center reached 42° N at 600 hPa, and θse at the ground between 40 and 43° N increased to 332 K. However, over the next hour, the 316 K center disappeared. At 17:00 LST, Figure 13b shows that the 320 K low value center belt was at 500–700 hPa, the low level θse at 40–45° N was larger than both sides, and 320 K rose to 700 hPa. The specific humidity at approximately 650 hPa was up to 3 g/kg.
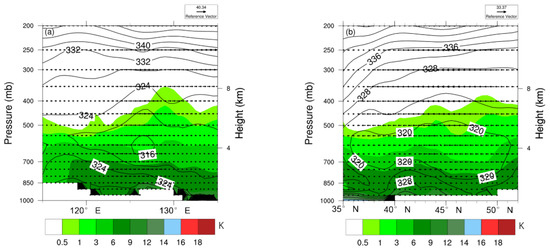
Figure 13.
Vertical cross-section of pseudo-equivalent potential temperature (solid line; K) and specific humidity (shaded; g/kg) and uw (arrows; m·s−1) along 42.5° N (a) and vw (arrows; m·s−1 along 124.0° E (b) in Domain 2 at 17:00 LST on 3 July 2019.
Kaiyuan station sounding T-lnp diagrams on 3 July 2019 based on the WRF simulation data and Kaiyuan surface meteorological observation station display showed that the convective available potential energy (CAPE) was 29.9 J/kg at 08:00 LST (Table 1), after which, perhaps due to the influence of solar radiation heating, it increased rapidly, to 1137.7 J/kg at 11:00 LST, then 2305.7 J/kg at 14:00 LST; Figure 14 shows that CAPE was 2394.1 J/kg at 17:00 LST, although suddenly decreased to 0 J/kg at 18:00 LST.

Table 1.
The modified sounding T-lnp physical quantity table of Kaiyuan station.
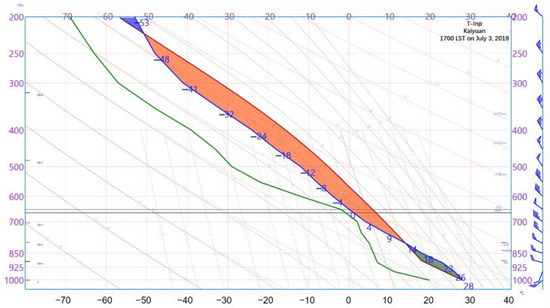
Figure 14.
The 17:00 LST Kaiyuan T-lnp from the WRF simulations in Domain 2 and surface observations. A full bar is 4 m·s−1.
Convective inhibition (CIN) was 178.2 J/kg at 08:00 LST, 27.0 J/kg at 11:00 LST, 105.1 J/kg at 14:00 LST, 15.5 J/kg at 17:00 LST, and 0 J/kg at 18:00 LST.
The 0–3 km vertical wind shear was 11.5 m·s−1 at 08:00 LST, 9.3 m·s−1 at 11:00 LST, and 14.6 m·s−1 at 14:00 LST. At 17:00 LST, the wind was 17 m·s−1 northwest at 700 hPa, 9.7 m·s−1 southwest at the surface, and 17.2 m·s−1 vertical wind shear at 0–3 km. By the next hour, 700 hPa wind had reduced to 14 m·s−1, whereas the surface wind had turned southeast at 23 m·s−1, and the 0–3 km vertical wind shear was 37.1 m·s−1. The lifting condensation level (LCL) was 1337 m at 08:00 LST, and decreased gradually in the afternoon, to 1047 m at 17:00 LST and 292.7 m 18:00 LST. The 2 °C low center of T–Td was around the height of 700 hPa from 08:00 to 1800 LST.
The hodographs show that, at 08:00 LST, the wind direction above 700 hPa was northwest, whereas it was southwest below 700 hPa; the turning height was 700 hPa. Subsequently, Figure 15 shows that at 17:00 LST, the turning height dropped to 950 hPa; above was northwest, whereas below was southwest. Near the surface, the winds veered with height from west–southeasterly to southerly, creating strong shear within 1 km of the lower troposphere (8.07 m·s−1).
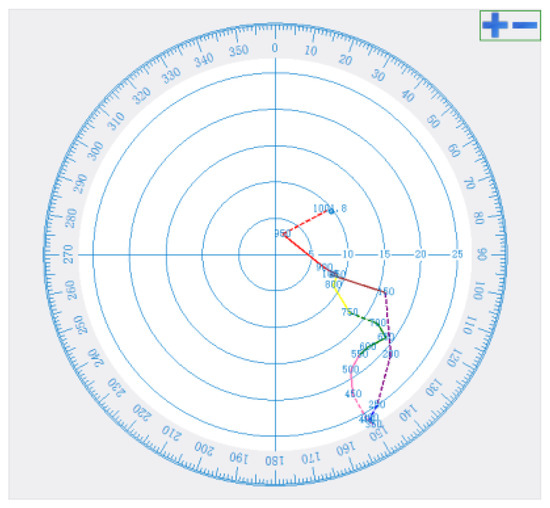
Figure 15.
The 17:00 LST Kaiyuan hodograph from the WRF simulations in Domain 2 and surface data.
4. Conclusions
Due to the obstruction of the subtropical high, the northeast cold vortex persisted for a long time. Under the action of the inclination of the warm ridge in the west, a cutoff cold vortex, stepped troughs and weak low pressure on the ground formed. The upper cold vortex fell southward, the upper trough passed through, and the inverted surface trough were the main weather situation characteristics of the Kaiyuan tornado.
The upper-level cold vortex falling south caused the middle and upper-level cold air to move southward and sink with positive vorticity. Dry and cold air intruded from the west and north and interacted with the warm and wet air, thus forming convective instability.
The water vapor saturation layer at 700 hPa was conducive to the formation of shallow clouds at the middle and low layers and the penetration of solar shortwave radiation into the ground during the daytime, but was not conducive to the emission of longwave ground radiation. In addition, the transportation of warm advection from the high-temperature area of Hebei was conducive to the rapid increase in CAPE.
Due to the warming of solar radiation during the daytime, the convective activities in the three mountainous areas of Changbai Mountain, Daxinganling Mountain, and Nuluerhu Mountain were strengthened during the daytime, which was conducive to the formation of vertical wind shear zones in the northwest, southeast, and southwest directions. The convective activity on Changbai Mountain strengthened the convective activity of the squall line and the water vapor convergence zone south of the squall line. The southward movement of the northeast cold vortex strengthened the water vapor divergence on the north side of the squall line, and the squall line extended westward after strengthening. Sea and land breezes caused the formation of the supercell north of Liaodong Bay and the sinking circulation of dry air. The tail of the squall line and supercell jointly provided strong southeast wind outflow on the surface layer. When the northeast cold vortex moved southward, the sinking dry and cold northwest air flow from the upper level was superimposed on it; thus, the height of strong vertical wind shear was reduced, resulting in strong vertical wind shear near the ground, which triggered the formation of a tornado.
Author Contributions
Y.W. initiated the study and performed the analysis of meteorological conditions, numerical simulation, dynamic diagnosis and analysis; wrote the original draft. T.W. contributed to full-text discussion, checking and proofreading. P.Y. contributed to Doppler radar picture analysis; W.X. contributed to some dynamic diagnosis and analysis. All authors have read and agreed to the published version of the manuscript.
Funding
This work was funded by the National Key Research and Development Program of China. (Grant No. 2018YFC1507301).
Institutional Review Board Statement
Ethical review and approval are waived for this study, because it does not involve humans or animals.
Informed Consent Statement
Patient consent was not applicable, because this study did not involve humans.
Data Availability Statement
The data presented in this study are available on request from the corresponding author. The amount of data is very large, the data are not publicly available.
Acknowledgments
We thank to the China Meteorological Administration for providing surface, sounding observation data, hourly precipitation observation data, and Doppler radar data. NCAR for providing NCEP reanalysis data, WRF version 4.0 mesoscale numerical prediction model and NCL mapping software, Kochi University of Japan for providing hmw-8 cloud images. We are grateful to the High-Performance Computing Center (HPCC) of Nanjing University for performing the numerical calculations in this paper on its blade cluster system.
Conflicts of Interest
The authors declare no conflict of interest.
References
- Wang, X.; Yu, X.; Zhou, X. Study of Northeast China torandoes: The environmental characteristics. Acta Meteorol. Sin. 2015, 73, 425–441. (In Chinese) [Google Scholar]
- Davies-Jones, R.; Trapp, R.; Bluestein, I.I. Tornadoes and tornadic storms. In Severe Convective Storms; Doswell, C.A., III, Ed.; American Meteorological Society: Boston, MA, USA, 2001; pp. 167–221. [Google Scholar]
- Trapp, R.; Stumpf, G.; Manross, K. A reassessment of the percentage of tornadic mesocyclones. Weather Forecast. 2005, 20, 680–687. [Google Scholar] [CrossRef]
- Yu, X.; Zhou, X.; Wang, X. The advances in the nowcasting techniques on thunderstorms and severe convection. Acta Meteorol. Sin. 2012, 70, 311–317. (In Chinese) [Google Scholar]
- Brooks, I.I.; Lee, J.; Craven, J. The spatial distribution of severe thunderstorm and tornado enviroments from global reanalysis data. Atmos. Res. 2003, 67–68, 73–94. [Google Scholar] [CrossRef]
- Markowski, P.M.; Straka, J.M.; Rasmussen, E.N. Direct Surface Thermodynamic Observations within the Rear-Flank Downdrafts of Nontornadic and Tornadic Supercells. Mon. Weather Rev. 2002, 130, 1692–1721. [Google Scholar] [CrossRef]
- Yu, X.D.; Zheng, Y.Y.; Zhang, A.M.; Yao, Y.Q.; Fang, C. The Detection of a Severe Tornado Event in Anhui with China New Generation Weather Radar. Plat. Meteorol. 2006, 25, 914–924. (In Chinese) [Google Scholar]
- Lewellen, D.; Xia, J. The influence of a local swirl ratio on tornado intensification near the surface. J. Atmos. Sci. 2000, 57, 527–544. [Google Scholar] [CrossRef]
- Zhang, L.; Sun, J.; Ying, Z.; Xiao, X. Initiation and development of a squall line crossing Hangzhou Bay. J. Geophys. Res. Atmos. 2021, 126, e2020JD032504. [Google Scholar] [CrossRef]
- Sun, Z.; Xue, M.; Zhu, K.; Zhou, B. Prediction of EF4 supercell tornado in Funing, China: Resolution dependency of simulated tornadoes and their structures. Atmos. Res. 2019, 229, 175–189. [Google Scholar] [CrossRef]
- Xue, M.; Zhao, K.; Wang, M.; Li, Z.; Zheng, Y. Recent significant tornadoes in China. Adv. Atmos. Sci. 2016, 33, 1209–1217. [Google Scholar] [CrossRef]
- Xue, M.; Hu, M.; Schenkman, A. Numerical Prediction of the 8 May 2003 Oklahoma City Tornadic Supercell and Embedded Tornado Using ARPS with the Assimilation of WSR-88D Data. Weather Forecast. 2014, 29, 39–62. [Google Scholar] [CrossRef][Green Version]
- Wurman, J. The Multiple-Vortex Structure of a Tornado. Weather Forecast. 2002, 17, 473–505. [Google Scholar] [CrossRef]
- Trapp, R.J.; Mitchell, E.D.; Tipton, G.A.; Effertz, D.W.; Watson, A.I.; Andra, D.L., Jr.; Magsig, M.A. Descending and Nondescending Tornadic Vortex Signatures Detected by WSR-88Ds. Weather Forecast. 1999, 14, 625–639. [Google Scholar] [CrossRef]
- Snook, N.; Xue, M.; Jung, Y. Tornado-Resolving Ensemble and Probabilistic Predictions of the 20 May 2013 Newcastle–Moore EF5 Tornado. Mon. Weather Rev. 2019, 147, 1215–1235. [Google Scholar] [CrossRef]
- Schenkman, A.; Xue, M.; Hu, M. Tornadogenesis in a High-Resolution Simulation of the 8 May 2003 Oklahoma City Supercell. J. Atmos. Sci. 2014, 71, 130–154. [Google Scholar] [CrossRef]
- Schenkman, A.; Xue, M.; Shapiro, A. Tornadogenesis in a Simulated Mesovortex within a Mesoscale Convective System. J. Atmos. Sci. 2012, 69, 3372–3390. [Google Scholar] [CrossRef][Green Version]
- Rotunno, R.; Bryan, G.H.; Nolan, D.S.; Dahl, N.A. Axisymmetric Tornado Simulations at High Reynolds Number. J. Atmos. Sci. 2016, 73, 3843–3854. [Google Scholar] [CrossRef]
- Roberts, B.; Xue, M.; Schenkman, A.D.; Dawson, D.T. The Role of Surface Drag in Tornadogenesis within an Idealized Supercell Simulation. J. Atmos. Sci. 2016, 73, 3371–3395. [Google Scholar] [CrossRef]
- Mashiko, W.; Niino, H.; Kato, T. Numerical Simulation of Tornadogenesis in an Outer-Rainband Minisupercell of Typhoon Shanshan on 17 September 2006. Mon. Weather Rev. 2009, 13, 4238–4260. [Google Scholar] [CrossRef]
- Mashiko, W. A Numerical Study of the 6 May 2012 Tsukuba City Supercell Tornado. Part II: Mechanisms of Tornadogenesis. Mon. Weather Rev. 2016, 144, 3077–3097. [Google Scholar] [CrossRef]
- Tao, T.; Tamura, T. Numerical Study of the 6 May 2012 Tsukuba Supercell Tornado: Vorticity Sources Responsible for Tornadogenesis. Mon. Weathet Rev. 2020, 148, 1205–1228. [Google Scholar] [CrossRef]
- Zhang, T.; Guan, L.; Zheng, Y.G. Damage survey of the 3 July 2019 Kaiyuan tornado in Liaoning Province and its evolution revealed by disaster. Meterol. Mon. 2020, 46, 603–617. (In Chinese) [Google Scholar]
- Yan, Q.; Zhang, A.; Shen, L.; Cui, J.; Zhao, Z. Observational Analysis of tornado in Kaiyuan of 2019. J. Catas. 2021, 36, 112–116. (In Chinese) [Google Scholar]
- Skamarock, W.C.; Klemp, J.B.; Dudhia, J.; Gill, D.O.; Barker, D.M.; Wang, W.; Powers, J.G. A Description of the Advanced Research WRF Version 3; Ncar Tchnical Note, NCAR/TN-475+STR; Natioanal Center for Atmospheric Research: Boulder, CO, USA, 2008. [Google Scholar]
- Wang, Y.; Wang, T. Numerical Simulation of a Heavy Rainstorm in Northeast China Caused by the Residual Vortex of Typhoon 1909 (Lekima). Atmosphere 2021, 12, 120. [Google Scholar] [CrossRef]
- Heo, K.Y.; Kim, K.E.; Ha, K.J.; Park, K.S.; Jun, K.C.; Shim, J.S.; Suh, Y.S. Simulation of snowstorm over the Yellow Sea using a mesoscale coupled model. Asia-Pac. J. Atmos. Sci. 2010, 46, 437–452. [Google Scholar] [CrossRef]


Publisher’s Note: MDPI stays neutral with regard to jurisdictional claims in published maps and institutional affiliations. |
© 2022 by the authors. Licensee MDPI, Basel, Switzerland. This article is an open access article distributed under the terms and conditions of the Creative Commons Attribution (CC BY) license (https://creativecommons.org/licenses/by/4.0/).