Article

Effect of Selected Meteorological Variables on Full Flowering of Some Forest Herbs in the Western Carpathians

1
Institute of Forest Ecology, Slovak Academy of Sciences, Ľ. Štúra 2, 960 01 Zvolen, Slovakia
2
Department of Integrated Forest and Landscape Protection, Faculty of Forestry, Technical University in Zvolen, T. G. Masaryka 24, 960 01 Zvolen, Slovakia
*
Author to whom correspondence should be addressed.
Atmosphere 2022, 13(2), 195; https://doi.org/10.3390/atmos13020195
Submission received: 14 December 2021 / Revised: 20 January 2022 / Accepted: 22 January 2022 / Published: 25 January 2022
(This article belongs to the Special Issue Climate Change and Forest Environment)

Abstract

:
At present, temperate forest ecosystems are endangered by both abiotic and biotic factors. The effects of abiotic components, e.g., meteorological variables, are constantly studied. However, the detailed mechanisms affecting the phenology of plants are still unknown. Two meteorological variables (air temperature and cumulative precipitation) were analysed for the period from 1995 to 2020 in order to determine which factor which has a more significant effect on onset of the full-flowering (FF) phenophase. A set of nine forest herbs, representing different phenological groups from the viewpoint of flowering, was examined (early spring: Petasites albus and Pulmonaria officinalis; mid-spring: Carex pilosa and Dentaria bulbifera; late spring: Fragaria visa and Galium odoratum; early summer: Veronica officinalis; mid-summer: Mycelis muralis; and late summer: Campanula trachelium). Temperature-sum requirements and temporal trends in the onset of FF were also studied. The research conducted at the Ecological Experimental Station in the Kremnické vrchy Mountains (central Slovakia) at an altitude of 500 m asl. Our results show that the air temperature correlated more significantly with the date of onset of FF (r > 0.6, p < 0.001) than with precipitation. On average, the air-temperature sums, calculated for the threshold temperatures of 0 °C and 5 °C, increased from 142.9 °C (Petasites albus) to 1732.9 °C (Campanula trachelium) and from 223.4 °C (Petasites albus) to 1820.8 °C (Campanula trachelium), respectively. Temporal trends in the onset of FF over the last 26 years confirm shifts to earlier dates for most species (excepting early spring Petasites albus). In spring flowering species, shifts ranged from 2 days (0.07 day/year) for Pulmonaria officinalis to 8 days (0.30 day/year) for Carex pilosa. As for summer species, the onset of flowering shifted more significantly to earlier dates—from 7 days (0.27 day/year) for Campanula trachelium to 12 days (0.46 day/year) for Veronica officinalis. The observed trends were statistically significant (p < 0.05) for five examined species (Carex pilosa, Dentaria bulbifera, Fragaria vesca, Veronica officinalis and Mycelis muralis).

1. Introduction

In recent decades, both climate and environmental change have been recognized to be among of the most important drivers of change in distribution and abundance of plant species in European forests [1]. Climate influences the structure and function of tree species, particularly growth and productivity of forest ecosystems [2]. On the other hand, changes in climate may cause shifts in habitats for some plant species in forests, which could influence geographic [3,4] and altitude ranges [5] or increase extinction rates [6,7]. Rising temperature generally increases the length of the growing season [8,9]. In principle, this could be a positive phenomenon, increasing productivity and offering new planting opportunities in forest conditions. On the other hand, the possible danger of late spring frosts [10], as well as increasing risk of damage by pests, droughts, fires and other climate extremes have been reported [11,12,13].
Focussing on European forest ecosystems, our knowledge relates mainly to the effects of climate and forest management on tree components [14]. However, the effect of global climate change is also visible in forest herbal species, which are more sensitive to changes in environment compared to long-lived trees [15,16]. For this reason, the flowering of herbs has been considered an important bioindicator current changes in global ecosystems [17]. According to [18], the flowering of plants represents a phase of the plant life cycle that is, in general, considered to be good indicator of the ecological conditions of an environment. Flowering can reflect individual plant fitness and biodiversity through biological activities, such as pollination, seed dispersion and germination [19]. Therefore, flowering, representing the generative phase of the life cycle of a plant, is essential for gene dispersal.
The phenological response of plants may be a suitable bioindicator of changing environmental conditions, e.g., through changes in the timing of their flowering. For example, shifts in flowering to the earlier dates have been related to rising temperatures during the growing season [20,21,22,23,24,25]. Generally, flowering is determined by several external factors, as well as the internal periodicity of the species. This fact is supported by studies that have reported that flowering dates correlate significantly with air temperature [26,27,28,29,30]. Low temperatures at the beginning of the growing season (spring) usually inhibit the onset of flowering. Unlike vegetative development, flowering is limited by specific climatic (environmental) and site conditions. This could be a direct physiological response to environmental factors or selection for different genotypes in specific herb species [31]. Additionally, photoperiod plays an important role in flowering events in some plants [32]. According to [33,34], flowering is also influenced by air and soil humidity. McMaster and Wilhelm [35] investigated both soil and air temperature as predictors of flowering. They found that humidity and soil temperature affected early flowering species but that further study was be required. Flowering of herbs is well-documented; despite this fact, a limited number of studies have focused on long-term trends in flowering phenology of herbs [36,37]. Phenological data from a specific locality can be valuable if they exist as a part of a relatively long period (usually more than 20 years). These data could show the magnitude and even the direction of shifts in flowering of herbs over time. We can determine the bioindication potential of herbs through their phenological responses. This seems to be a suitable tool for the study of changes in the phytoclimate of forests and could draw attention to ongoing processes in forest environments. Subsequently, the results could be used to improve the management of forest ecosystems, e.g., by optimizing forestry interventions to determine appropriate cuttings and minimize drastic changes in the phytoclimate or by selecting and planting suitable woody plants and their phenological forms, which would be more resistant to environmental changes.
Our hypotheses were as follows: (1) air temperature has a more significant effect on full-flowering (FF) compared to precipitation in all investigated species, and (2) temporal shift in the onset of FF is equal across phenological groups.
The main goals of this paper were as follows: (1) to analyse the onset of FF of selected forest herbs, representing different phenological groups, during the period from 1995 to 2020; (2) to determine the relationships between two meteorological variables (air temperature and precipitation) and FF dates; (3) to determine temperature requirements for the onset of FF through a model of temperature sums (Ts) using two threshold temperatures (0 °C and 5 °C); and (4) to evaluate the temporal trends in onset of FF for all investigated species for the period from 1995 to 2020.

2. Material and Methods

2.1. Study Site

The research was conducted at the Ecological Experimental Station (EES) in the Kremnické vrchy Mountains (Western Carpathians, Slovakia) which was founded in 1986 (see Figure 1). At present, the locality is a part of an international network, LTER [38]. The EES is located in the Suchá Dolina valley (48°38′ N, 19°04′ E), with an altitude of 450–520 m asl. on a southwest slope of 5–15°. The soil type is Andic Cambisol, with a high skeleton content (20–60%), mild acid reaction (pH 5.4–6.4) and acid-mull humus form. The dominant tree species (85–95%) is beech (Fagus sylvatica L.) with an average age of approximately 125 years. Fir (Abies alba), hornbeam (Carpinus betulus), linden (Tilia cordata) and oak (Quercus dalechampii) are the associated species. Species such as Carex pilosa, Dentaria bulbifera, Galium odoratum, Pulmonaria officinalis, Fragaria vesca, Veronica officinalis, etc., constitute the permanent herbal population at the EES [39]. More information can be found in in [40].
The EES is located in a moderately warm region and a moderately warm and humid hilly sub-region [41]. Long-term climatic data (mean monthly temperature and mean monthly precipitation totals) for the periods of 1951–1980 and 1995–2020 were taken from the nearest professional meteorological station, Sliač, which is situated 4 km from the study area and managed by the Slovak Hydrometeorological Institute. The long-term mean (1951–1980) of the annual air temperature is approximately 7.8 °C, with a monthly mean of 18.1 °C in the warmest month (July) and −4.0 °C in the coldest month (January). The mean annual precipitation is 698 mm [42]. Increasing positive deviation of +1.3 °C (from 7.8 °C to 9.1 °C) of the mean annual air temperature during the period from 1995 to 2014 was reported in [10], although annual precipitation did not change significantly. In the last 11 years (from 2010), selected meteorological variables (air and soil temperature, global radiation, precipitation) have been measured by our own climatic microstations, which are equipped with Minikin dataloggers (EMS Brno, Czech Republic) and precipitation collectors.

2.2. Characteristics of Plant Species

All species were selected as a representative species, usually occurring in European submountain beech forests with relatively high frequency [43]. Each taxon represents a specific phenological group in terms of flowering. The criteria for species selection were as follows: a sufficient number of flowering individuals (minimum of 30 individuals), good vitality and persistence throughout the research period at the site. We observed nine herbal species from various phenological groups: early-spring species: Petasites albus (non-bulbous geophyte) and Pulmonaria officinalis (hemicryptophyte); mid-spring species: Carex pilosa (hemicryptophyte) and Dentaria bulbifera (geophyte); late-spring species: Fragaria vesca (hemicryptophyte) and Galium odoratum (hemicryptophyte); early-summer species: Veronica officinalis (chamaephyte); mid-summer species: Mycelis muralis (hemicryptophyte); and late-summer species: Campanula trachelium (hemicryptophyte).

2.3. Phenological Observations

Phenological research began in early spring each year for the 26-year period (1995–2020), depending on snow-cover melt. Observations were conducted done twice or thrice a week to capture the exact onset of the flowering. Within all species, the study was carried out at permanent plots with relatively stable conditions throughout the observation period, without any cutting interventions on a parent stand. A set of 30 individuals with a good vitality was regularly observed. A methodology of phenological observations was created according to the methodology used by the SHMI for long-term monitoring of forest plants [44]. FF phenophase was considered to occur when nearly all the flowers of at least 50% of individuals (or shoots) were open. This phase is identical to BBCH 65 on the BBCH scale designed by Meier [45]. One shoot (Dentaria bulbifera, Galium odoratum, Veronica officinalis) or one plant (Pulmonaria officinalis, Mycelis muralis, Campanula trachelium) were considered individuals. Calendar dates of the onset of FF were transformed into the Julian days—day of the year (DOY).

2.4. Method for Calculation of Temperature and Cumulative Precipitation

In a correlation analysis focused on the relationship between FF and air temperature, we used the cumulated positive average monthly air temperature (CPAMAT), which was calculated over different periods of relevant months with regard to phenological development of individual species [46]. For cumulative daily temperature (daily temperature sums), we used a modified thermal-time model to compile detailed data on temperature requirements of individual species [47,48]. The average daily air temperature was summed to calculate the cumulative daily temperature, starting on 1 January for every year. The threshold values were 0 °C and 5 °C, which means that only average daily temperatures exceeding 0 °C (or 5 °C) were added to the sum [49]. Analyses were performed using the CPAMAT for the survey period from 1995 to 2020, while the analyses based on cumulative daily temperature were performed for the period from 2010 to 2020 due to missing data from the previous period. Cumulative precipitation totals represented the sums of monthly precipitation totals during the relevant time period.

2.5. Statistical Analysis

Statistical analyses were performed in R [50]. The degree of correlation of two variables, FF date (as DOY) versus temperature or precipitation during the relevant periods, was expressed by a Pearson correlation coefficient, and the period with the highest degree of correlation was determined [51]. The significance of temporal trends was determined by the Mann-Kendall trend test.

3. Results

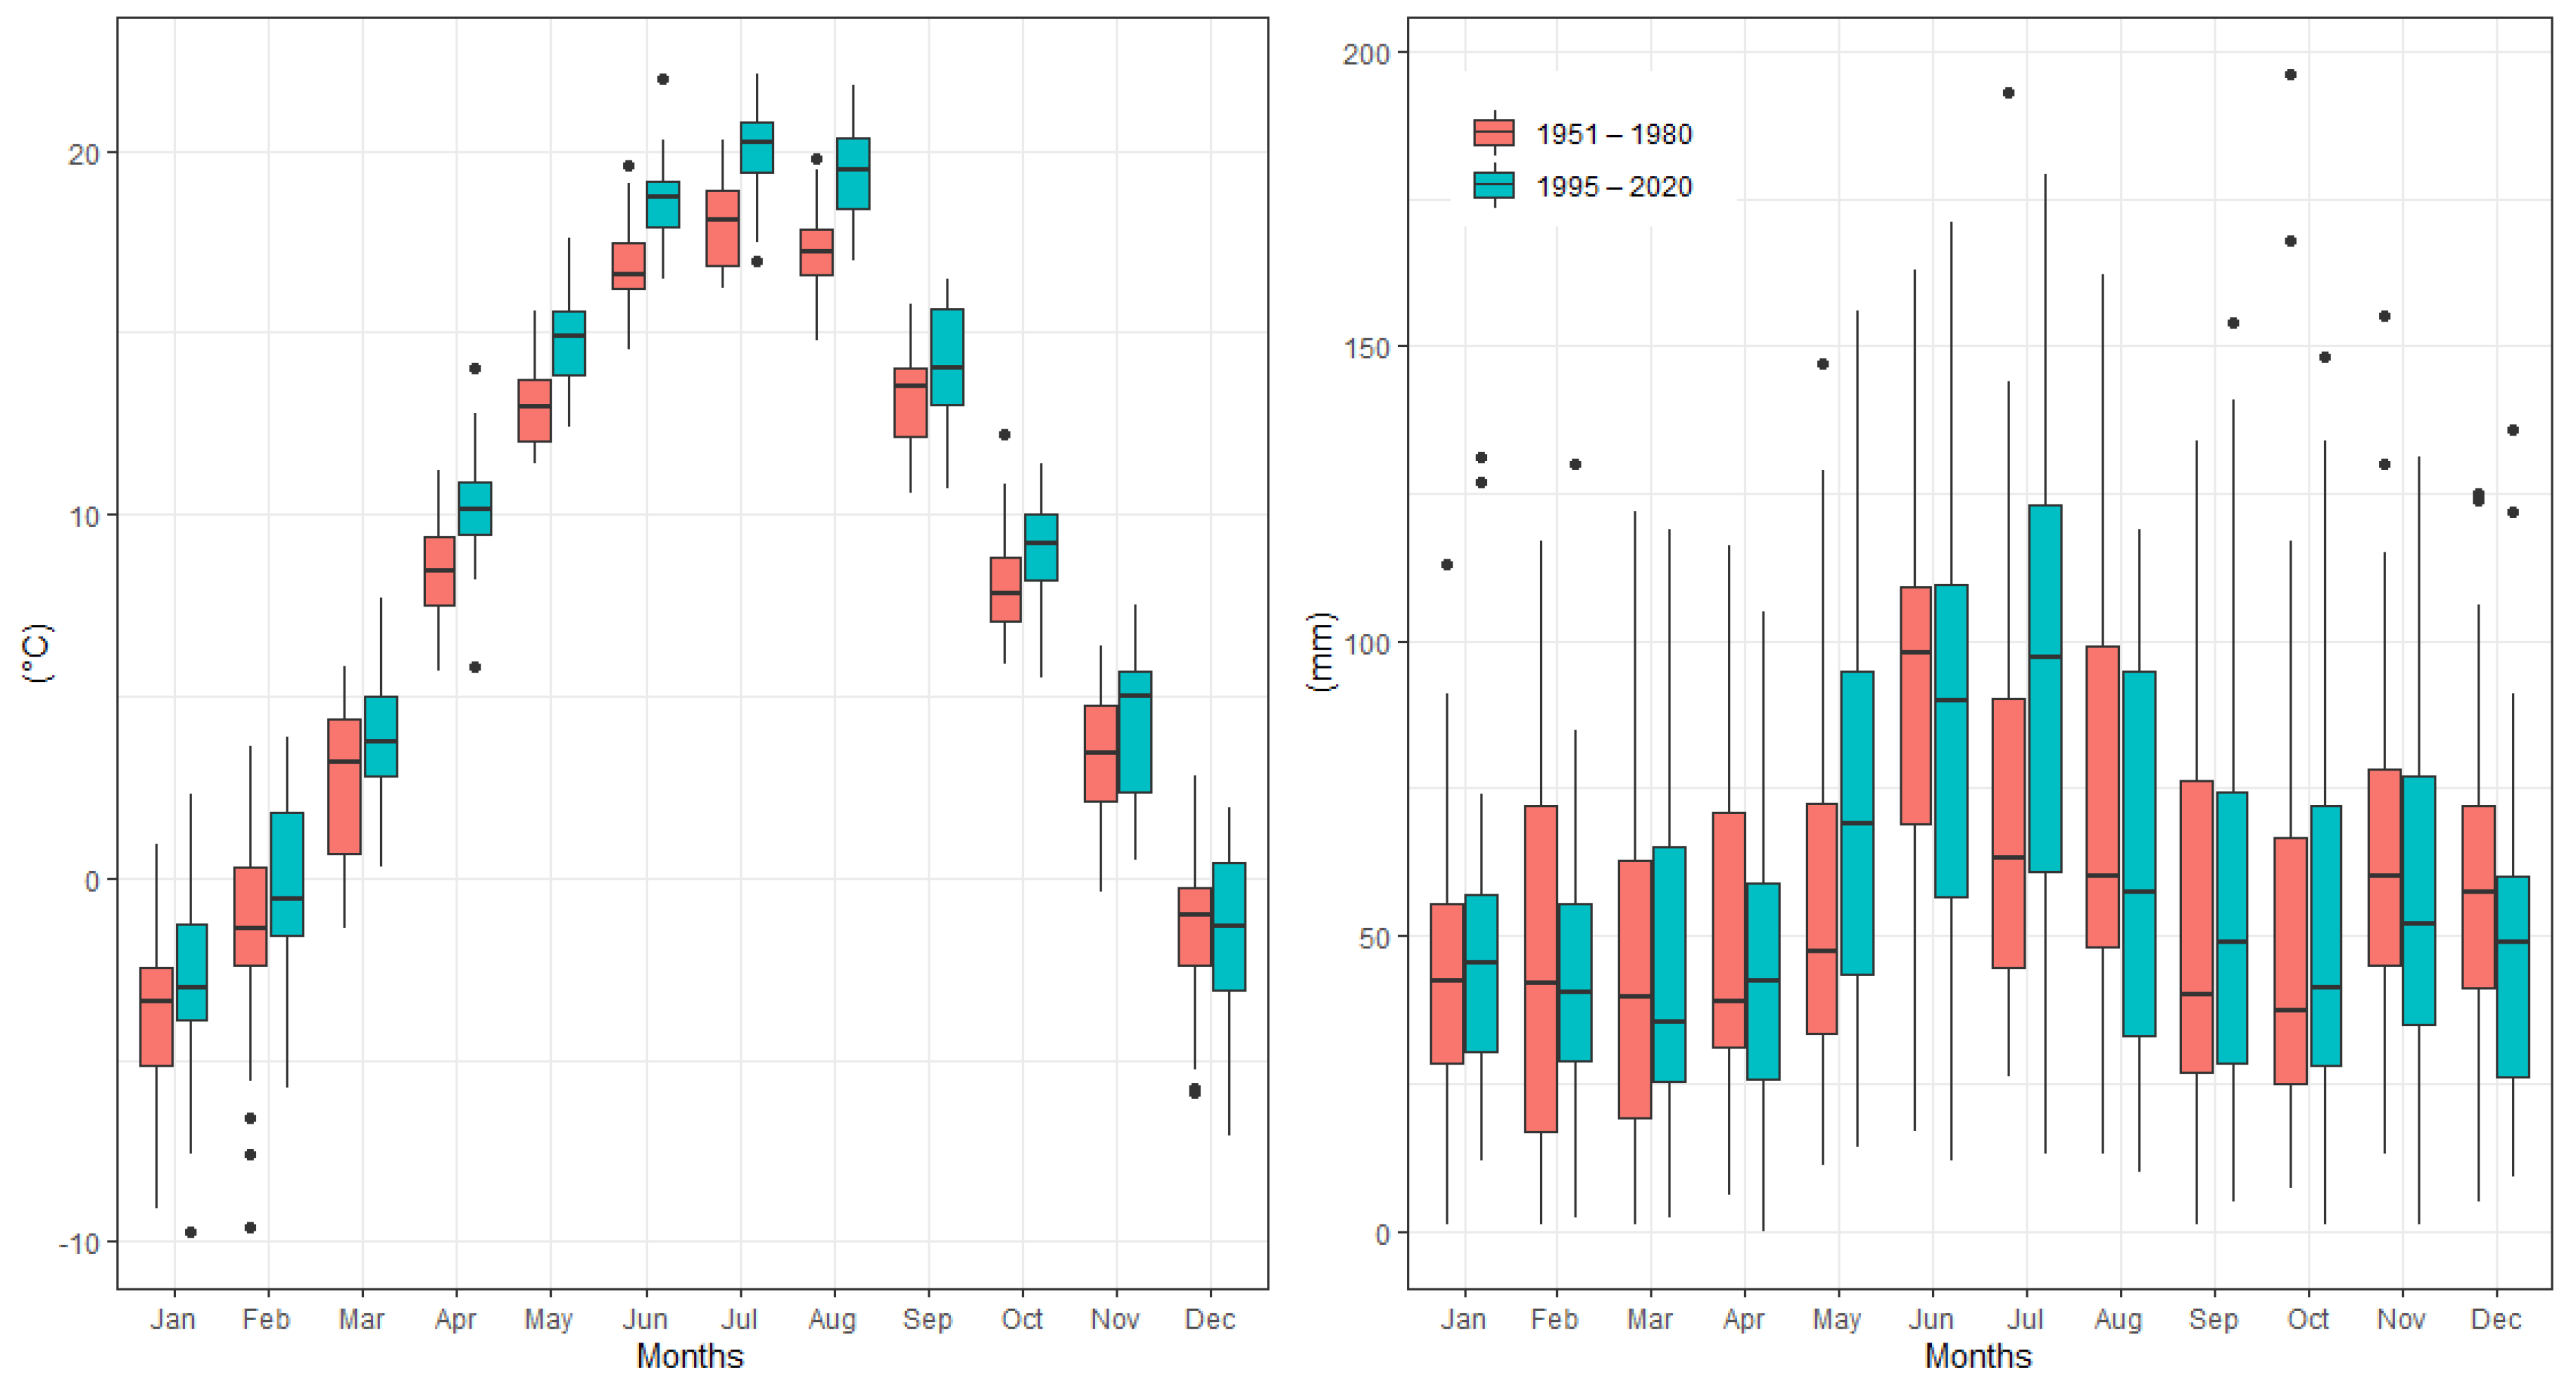
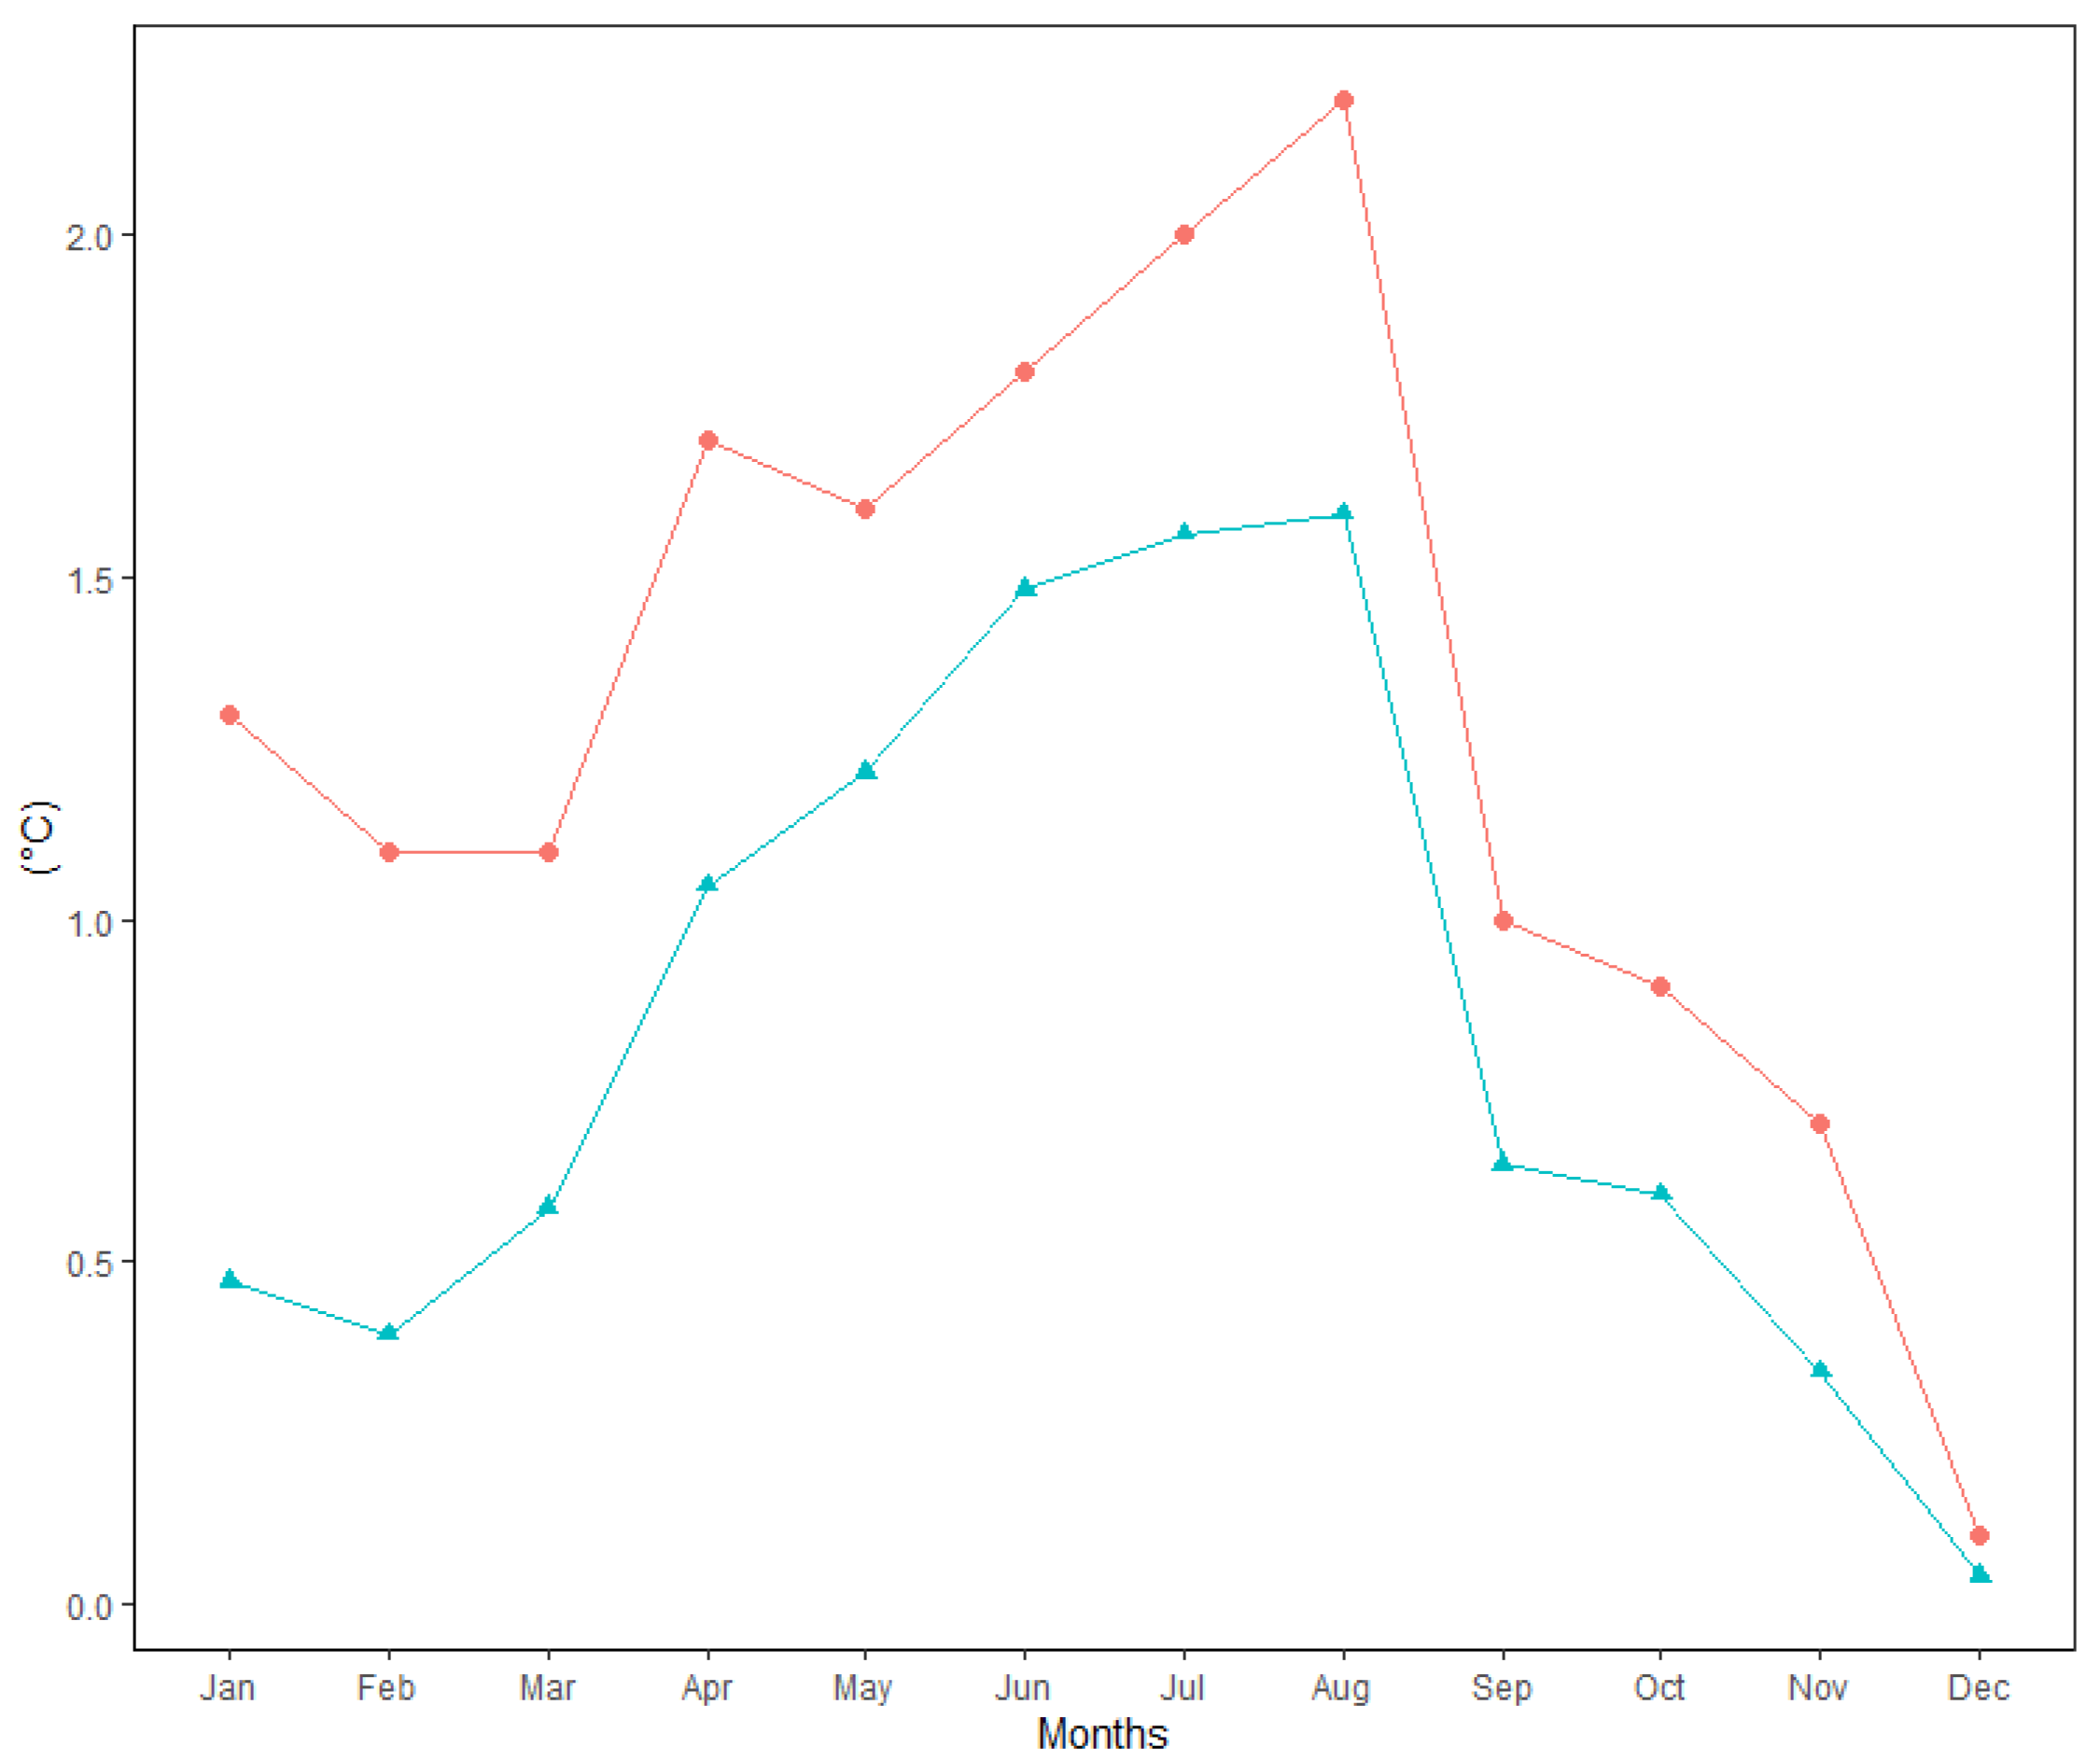
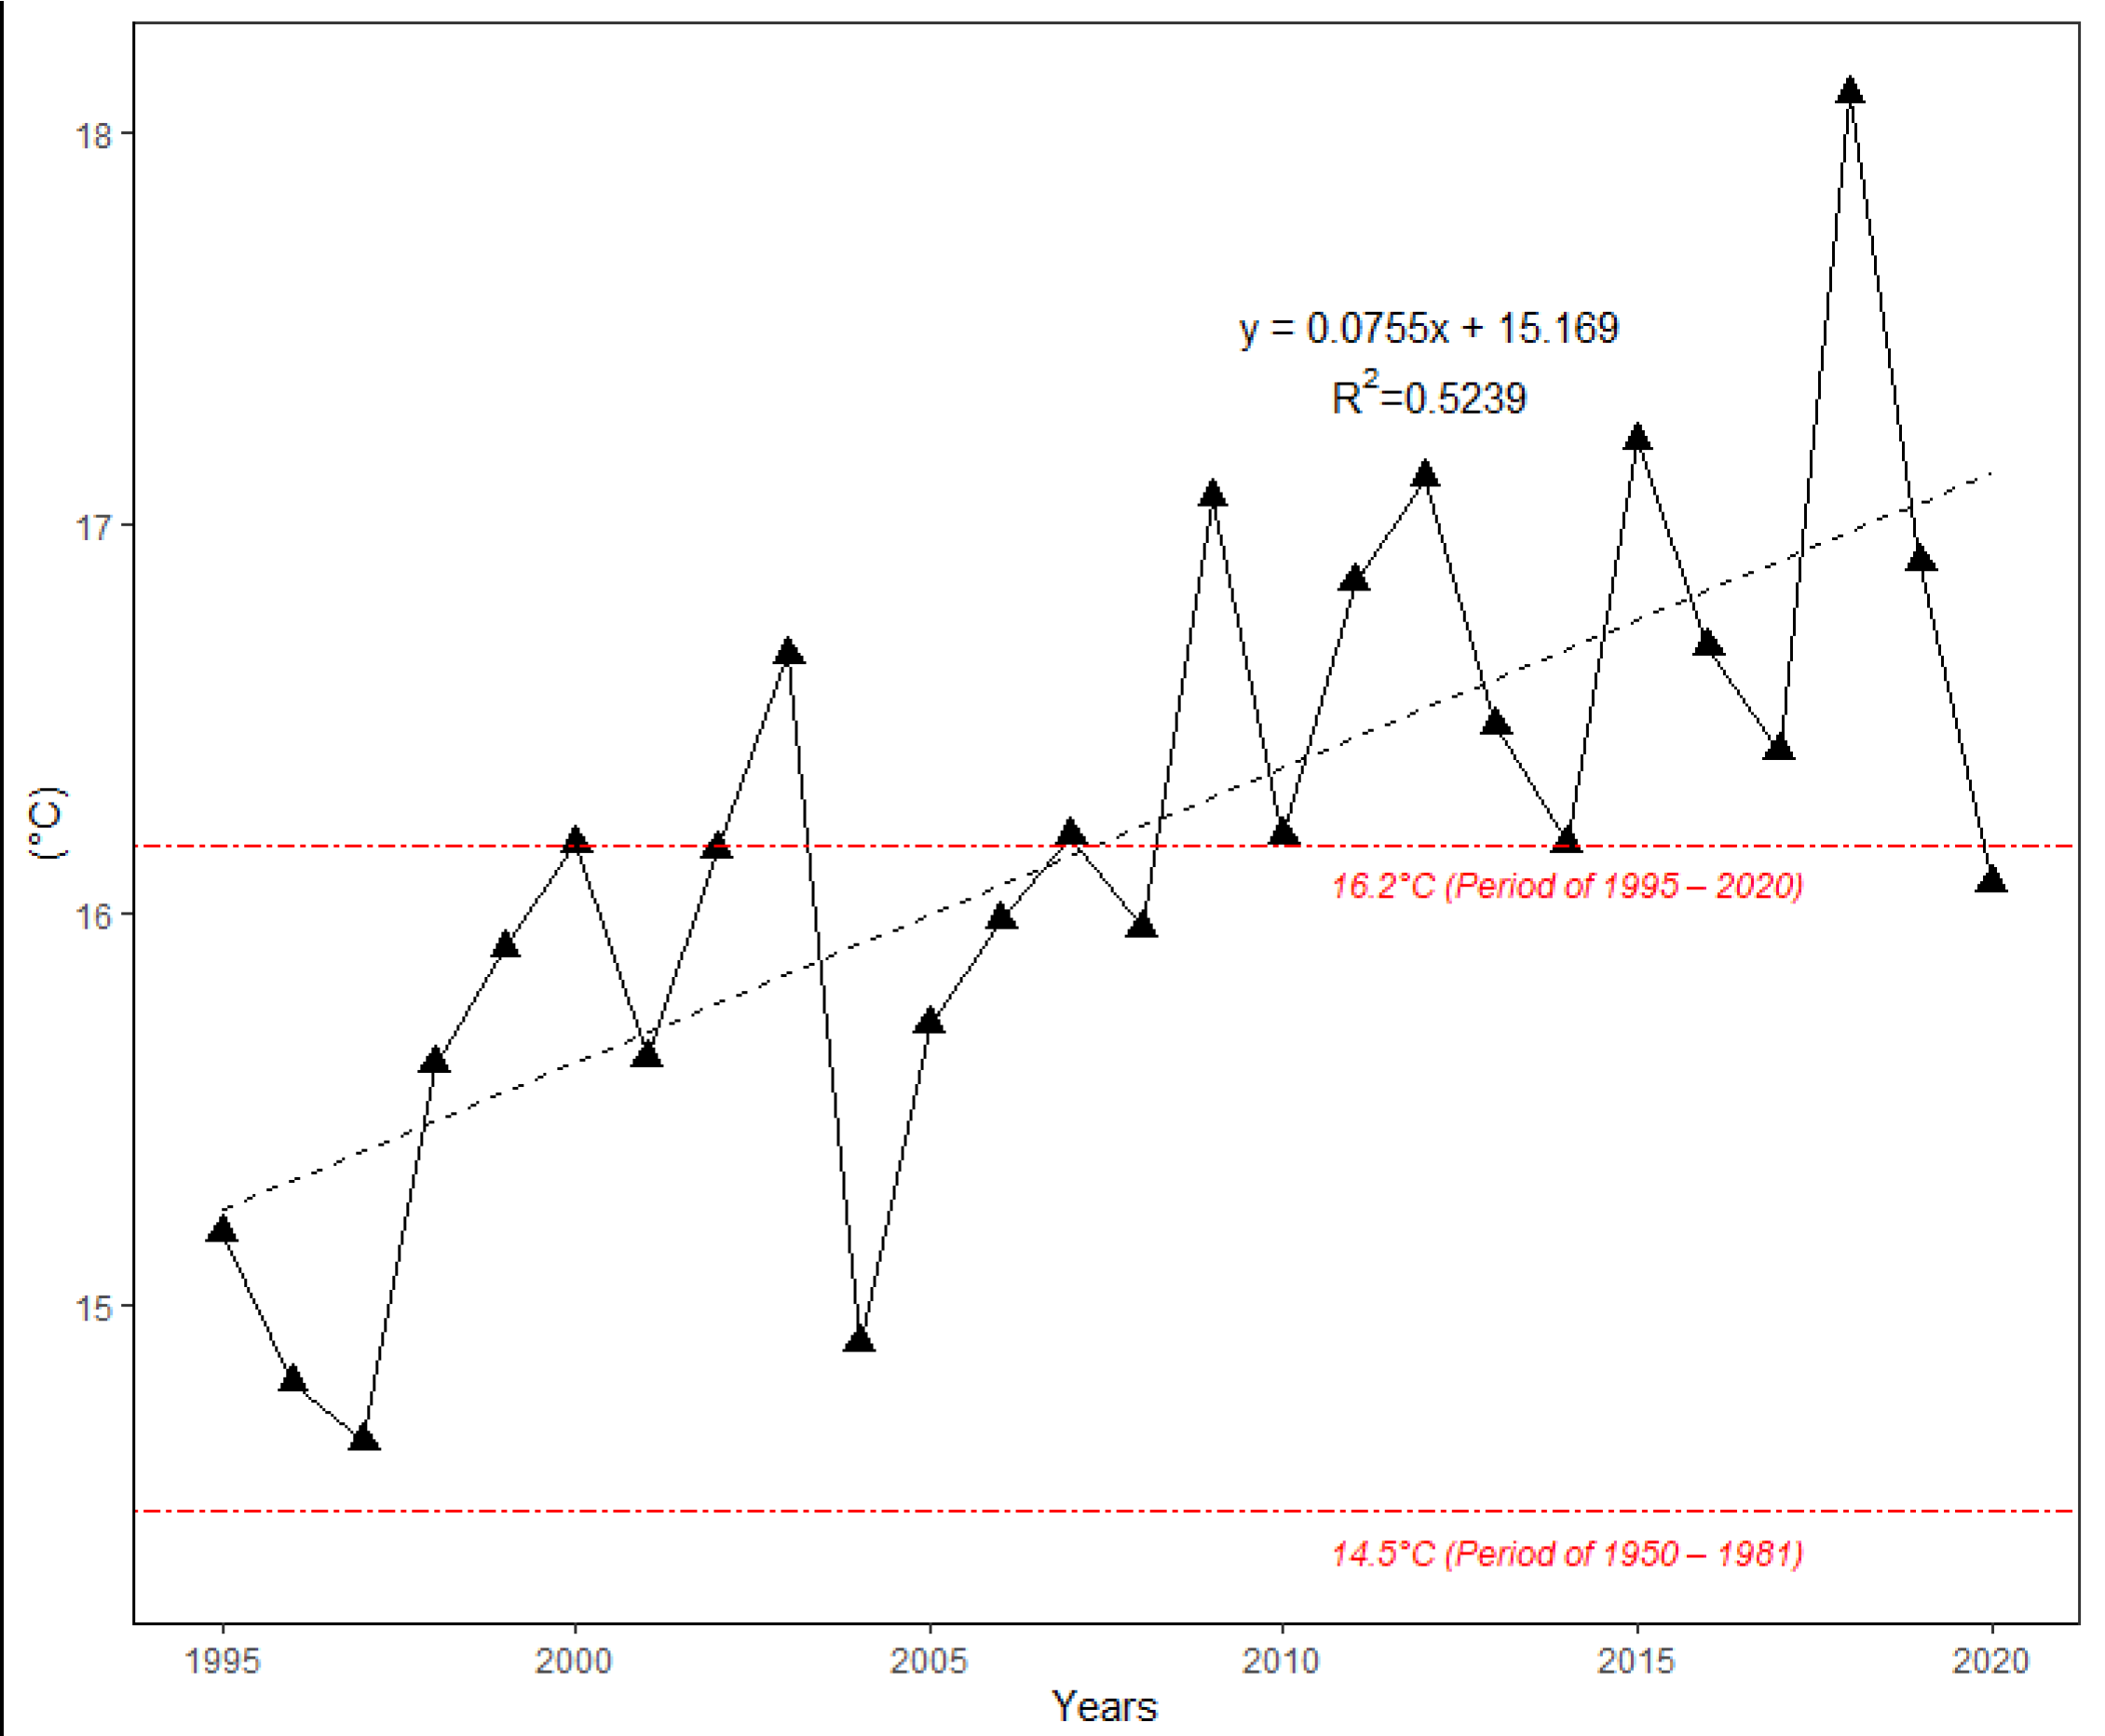
3.1. Analysis of Meteorological Variables

Figure 2 shows the changes in average monthly air temperature and monthly precipitation totals between two periods: 1951–1980 (long-term mean) and the survey period 1995–2020. Data analysis showed that the mean annual temperature increased by 1.3 °C between 1995 and 2020 in comparison to the long-term period. For all months, during the period from April to August, the monthly air temperature was significantly higher (p > 0.05) in 1995–2020 than in 1951–1980. The values of monthly air temperature deviated positively from the long-term period for all months (Figure 3). In addition, the temperature trend during the growing season (from 1 April to 30 September) showed an increase of 1.7 °C (Figure 4). Total annual precipitation increased by 4.18% (30.3 mm) during the survey period. Increasing precipitation totals were observed for two months (May and July). In contrast, monthly precipitation totals were insignificantly lower for seven months (February, April, June, August, November and December) during the survey period of 1995–2020, compared to 1951–1980. Cumulative precipitation totals during the growing season increased by 7.84% (32.8 mm).

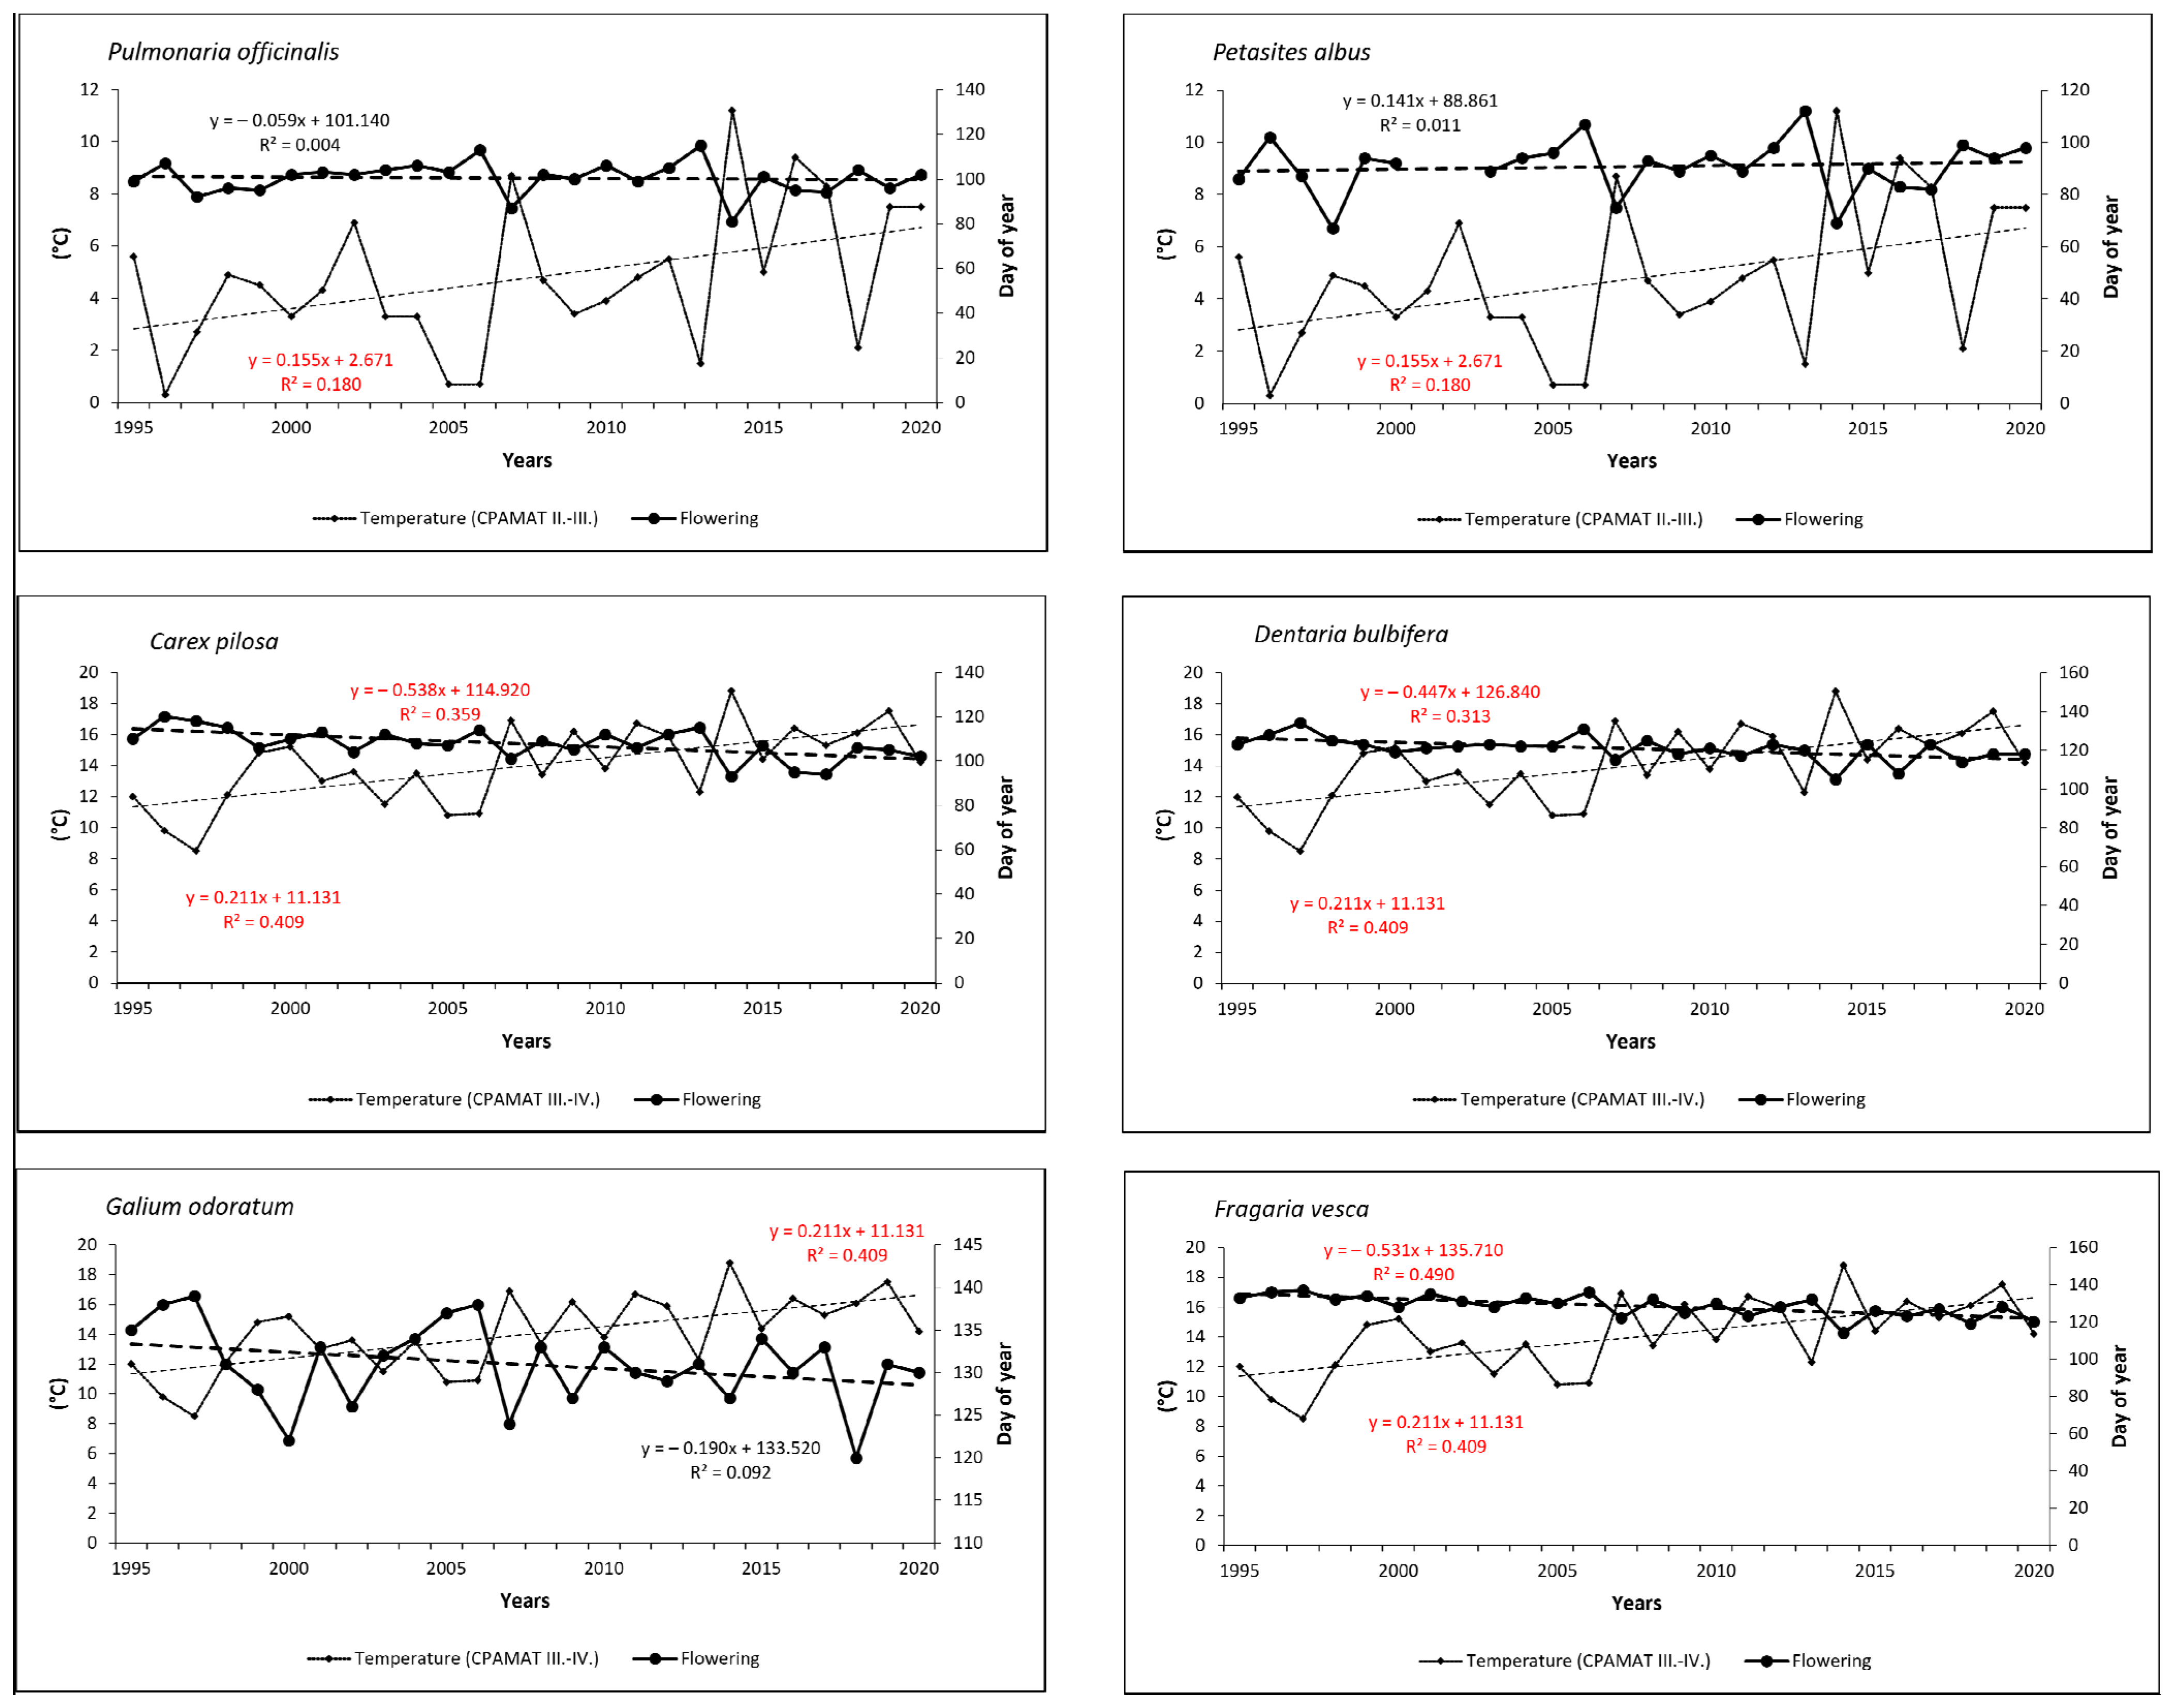
3.2. Interannual Variability Temporal Trends in the Onset of Flowering from 1995 to 2020

Basic statistical data on the onset of FF are given in Table 1. On average, the earliest onset was observed for Petasites albus (91st DOY), while the latest onset was detected for Campanula trachelium (203rd DOY). The highest and the lowest range of variation was found for Petasites albus (45 days) and Galium odoratum (19 days), respectively. Similarly, the greatest interannual variability was determined for early-spring species Petasites albus (CV = 11.6%). This variability gradually decreased among phenological groups; the lowest CV value was identified for summer species Mycelis muralis (CV = 2.7%). The earliest occurrences of FF onset were mostly detected in 2014 (or in 2018), while the latest onsets were most frequently observed in 1997.
Temporal trends in the onset of FF confirmed shifts to earlier dates for all species (excepting early-spring Petasites albus) over the last 26 years. In spring flowering species, onset was shifted from 2 days (0.07 day/year) for Pulmonaria officinalis to 8 days (0.30 day/year) for Carex pilosa. As for summer species, onset of flowering shifted more significantly to earlier dates—from 7 days (0.27 day/year) for Campanula trachelium to 12 days (0.46 day/year) for Veronica officinalis. Trends were statistically significant for five species (Carex pilosa, Dentaria bulbifera, Fragaria vesca, Veronica officinalis and Mycelis muralis; see Figure 5 and Figure 6).

3.3. Flowering Phenology in Relation to the Monthly Sums of Air Temperature (CPAMAT)

Relationships between the onset of FF and the temperature sums (CPAMAT) are given in Table 2. Relatively small differences were found among the phenological groups within this correlation. For early-spring species, the analysis confirmed a strong negative correlation between onset of the phenophase and the CPAMAT; the correlation coefficient (r) increased from 0.66 (Petasites albus) to 0.75 (Pulmonaria officinalis). Both extreme dates of the onset of FF, the earliest and the latest, were observed in the years with the highest (near the highest) or the lowest (near the lowest) sums of CPAMAT over the relevant period of February–March, respectively. The earliest onset of flowering in Pulmonaria officinalis was found in 2014, and the highest value of CPAMAT (11.2 °C) was calculated in the same year. On the other hand, the latest onset was observed in 2006 and 2013, when the CPAMAT value was the lowest (0.7 °C and 1.5 °C, respectively). A similar finding was made for Petasites albus. In the case of mid-spring species (Carex pilosa and Dentaria bulbifera), the relationship between onset of FF and air temperature was even more closely correlated (strong or very strong correlation) in comparison to early-spring species; correlation coefficients were 0.75 (Carex pilosa) and 0.82 (Dentaria bulbifera). For both species, the earliest date of flowering was observed in the same year, in which the highest sum of CPAMAT over the period of March–April was also recorded (2014, 18.8 °C). The latest occurrences of the phenophase were observed in 1996 (Carex pilosa) and in 1997 (Dentaria bulbifera), which is also when we found the lowest sums of CPAMAT (9.8 °C and 8.5 °C, respectively). As for late-spring species, the correlation can be defined as a strong; correlation coefficients increased from 0.72 (Galium odoratum) to 0.78 (Fragaria vesca). The earliest occurrence of flowering was not observed in the same year, but the latest occurrence of flowering was detected in the year with the lowest value of CPAMAT (1997, 8.5 °C) for both species. As for the summer phenological group, the correlation between temperature and onset of flowering was also strong; the correlation coefficient (r) reached values of 0.62 (Campanula trachelium), 0.67 (Veronica officinalis) and 0.77 (Mycelis muralis). The earliest occurrence of flowering among the two summer species (Veronica officinalis and Mycelis muralis) was observed in 2018, when the highest value of CPAMAT during the relevant period was recorded. On the other hand, the latest onset of was detected in 1997, with the lowest sum of monthly temperatures. Campanula trachelium (late-summer species) exhibited a different pattern; the extreme dates of flowering were identified in different years compared to above-mentioned species. However, the relationship between the sum of temperature and extreme dating in flowering was similar, as in the case of the previously mentioned species. Temporal trends in CPAMAT during the relevant periods, which were specific for phenological groups, were statistically significant (p < 0.05) for almost all species, with the exception of Veronica officinalis.

3.4. Flowering Phenology in Relation to Monthly Cumulative Precipitation

Table 2 shows the correlation (r values) between onset of FF phenophase and cumulative precipitation during different periods preceding flowering dates. We found low correlation between cumulated precipitation and onset of FF within both early- and mid-spring species. On the other hand, late-spring species (Galium odoratum and Fragaria vesca) showed a near moderate positive correlation (r > 0.4) between flowering date and cumulative precipitation in April. As for summer species, we detected a medium degree of correlation for the period of April–June late-summer species only (Campanula trachelium). Flowering dates for early- (Veronica officinalis) and mid-summer species (Mycelis muralis) showed only a weak correlation with precipitation.

3.5. Temperature-Sum Requirement for FF of the Species

Table 3 and Table 4 illustrate the basic statistical data of the temperature sums (TS) of mean daily temperatures cumulated from 1 January to the date of FF for the analysed species during the period of 11 years. The values of the TS increased, on average, from 223.4 °C (Petasites albus) to 1820.8 °C (Campanula trachelium) and from 142.9 °C (Petasites albus) to 1732.9 °C (Campanula trachelium), calculated for the threshold temperatures of 0 °C and 5 °C, respectively. It is clear that temperature demands for onset of flowering differed among phenological groups. The differences were highly statistically significant (p < 0.001). The greatest difference in temperature sums was obviously observed between the species represented the poles of the phenological groups. For comparison, early-spring Petasites albus required only 12.3% of the temperature sum required for late-summer Campanula trachelium, using the threshold temperature of 0 °C. This demand decreased to 8.2% in the case of a threshold temperature of 5 °C. We found various interannual variability in the values of temperature sums cumulated from 1 January in relation to phenological group. The greatest interannual variability was observed in early-spring Petasites albus; the coefficient of variation (CV) increased from 16.9% to 33.0%. On the other hand, the lowest variability was found within summer species for both threshold temperatures (CV < 9%). Insignificant correlations were found between the cumulative daily temperature and the onset of FF for most species, in contrast to the analysis in which we used the CPAMAT.

4. Discussion

We suppose that interannual variability in timing of FF in the studied species is a reflection of natural interannual variability in meteorological conditions over the years, as well as global (local) climate change during the study period (1995–2020). The earliest occurrences of FF were recorded in most species within the last 10 years (2011–2020). This may be related to the fact that this decade was the warmest decade on record, as reported by the WMO and IPCC [52,53]. Our findings are consistent with this statement. In the studied locality, the average air temperature for this period was 9.9 °C, while it was only 8.5 °C during the first decade of observations (1995–2004). The meteorological conditions of the first pentade of the study period (1995–1999) were more severe (relatively cold and moist) compared to the last decade. This could be one of the reasons why we observed the latest occurrence FF in most species between 1996 and 1997. The greatest variability in dating of FF was detected in early-spring species Pulmonaria officinalis (CV = 11.6%) and Petasites albus (CV = 7.2%). According to [18], this feature may be caused by the relatively greater variability in climatic conditions during spring in central Europe. The climate of central Europe is characterised by relatively strong and rapid changes in meteorological conditions during the spring, with sudden influxes of cold air masses from northern latitudes. Despite the fact that early-spring species are well adapted to the specific environmental conditions, i.e., they tolerate a low-temperature regime, produce larger perennial organs or have higher photosynthetic rates [54,55], the above-mentioned harsh conditions may be reflected in higher variability in FF timing within this phenological group. A similar finding was reported by Fitter et al. [36]; the group of early-flowering species was found to be the most variable (standard deviation was greater than 4.8 days). On the other hand, we found that variability decreased continuously in summer species (CV < 4%). Interannual variability in flowering of early-spring species can also be affected by snow-melt dating, as was reported in [56,57]. We assume that the impact of snow-cover duration at our plots was not significant. The height of snow cover was relatively low each year, which was related to the dense structure of the adult beech stand (density, 0.9). Beech with a mixture of fir were able to retain a significant amount of snow in the crowns. Additionally, the structure of the parent-stand canopy affects the phenological development of understory vegetation [58,59]. In this context, it is necessary to pay attention to selection of the suitable areas for long-term observation. Our research took place in relatively stable place, without interventions, with minimal changes in the parent stand and undergrowth vegetation.
We found that the temporal trends in the onset of FF shifted to earlier dates for all species (with the exception of early-spring Petasites albus). This is consistent with the report given in [60]. We postulate that this trend is related to the increasing air temperature during the period of the growing season (see Figure 4). On the other hand, the early-spring species were more affected by increased interannual variability of the air temperature at the beginning of the growing season.
Previous studies have mostly focused on tree species from temperate climate zones, which require a certain period with chilling temperatures, followed by a period with higher temperatures, forcing a budburst and leaf unfolding, as well as flowering and fruit ripening [24,61]. However, research studying the changes in the timing of FF in herbs across the entire growing season is uncommon. According to these studies, the FF timing of herbs is largely unknown but can be relative closely related to temperature and precipitation or their mutual interaction [62]. Our results show that the period crucial for timing of flowering varies, depending on phenological group. For example, the sum of CPAMAT for the period of February–March correlates with the FF of early-spring species better than for the period of March alone. Early-spring species often begin their physiological activity in late winter if the climate conditions are favourable. As for both mid-spring and late-spring species, the greatest correlation (r > 0.7) between the sum of CPAMAT and FF dates was found for the period of March–April. According to [21], spring-flowering species tend to be strongly influenced by temperature because they accelerate their reproductive phenology with higher spring temperatures. In contrast, wood perennials and some wind-pollinated plants, while still affected, appear to be less influenced by temperature. Our correlation analysis for summer species over the survey period showed that the closest relationship (r > 0.6) was found for the subsequent periods: April–May for early-summer species Veronica officinalis, April–June for mid-summer species Mycelis muralis and May–July for late-summer species Campanula trachelium. A similar finding was reported by Moore et al. [63], who analysed flowering phenology of 21 shortgrass steppe species. They found that the flowering dates of early and late season species were influenced by the specific timing of warmer and wetter conditions during the growing season. In addition, Schieber [22] analysed the relationship between temperature/precipitation and timing of FF of the same herbal species at the same locality for a period of ten years (1995–2004). Correlation analysis, including temperature as a variable, confirmed the close relation for species of all phenological groups (with the exception of early-spring species Pulmonaria officinalis). On the other hand, precipitation was significantly correlated for only two summer species (M. muralis and C. trachelium). These findings correspond to our recent results, although the correlation values are slightly lower. We suppose that air temperature during the selected time period preceding the onset of FF has a significant effect, although it is clear that this factor alone is not absolutely sufficient. If a cold spring period occurs, followed by precipitation events, the FF of spring species may be delayed. The second ecological factor, precipitation, was moderately correlated (r > 0.4) for late-spring and late-summer species only. It is surprising that flowering of early- and mid-summer species does depend on precipitation. Based on this finding, we can state that precipitation could affect the species that do not flower at the beginning of the growing season when the moisture is not usually a limiting factor. Thus, for early- or mid-spring species, temperature seems to be more of a limiting factor than precipitation. We suppose that precipitation represents a supplementary factor that affects the flowering of some later-flowering species, while temperature represents a dominant factor controlling the flowering of most species [64].
Daily temperature sums represent the temperature requirements of individual species for onset of FF. Highly significant differences in values of the sums for both threshold temperatures among phenological groups were confirmed by our analyses. However, the optimal start day for both calculation of sums and threshold temperature values seems to be species- (or phenological group)-specific. Detailed analysis given in [30] found that the optimal start day for spring-flowering Brassica napus was 30 January. The threshold temperature was 6 °C, and the temperature sum reached 157 °C. This finding is comparable to our results concerning early-spring species (Table 4). Further comparison with recent studies is relatively difficult because detailed values are rarely reported for forest herbs. Available studies deal mostly with tree-component analysis, such as [65]. Finally, it is interesting that insignificant correlations were found between cumulative daily temperature and the onset of FF for most species, in contrast to findings of the analysis in which we used the CPAMAT. A similar finding was also reported in [66].

5. Conclusions

This paper evaluates the effect of two meteorological variables, air temperature and precipitation, on the onset of the full-flowering (FF) phenophase of selected forest herbs during a 26-year period (1995–2020). Phenological observations were made at the Ecological Experimental Station in the Kremnické vrchy Mountains (Central Slovakia) in a beech forest at an altitude of 500 m asl. Nine herbal species representing different phenological groups from the viewpoint of flowering, were examined (early spring: Petasites albus and Pulmonaria officinalis; mid-spring: Carex pilosa and Dentaria bulbifera; late spring: Fragaria vesca and Galium odoratum; early summer: Veronica officinalis; mid-summer: Mycelis muralis; and late summer: Campanula trachelium). Air temperature correlated significantly with the dating of onset of FF (r > 0.6, p < 0.001). As for precipitation, the correlation was weaker (r < 0.5, p < 0.01). Differences in temperature-sum requirements of the species were significant among the phenological groups. Average values of the sums calculated for the threshold temperatures of 0 °C and 5 °C from 1 January, between the earliest-flowering Petasites albus and the latest-flowering Campanula trachelium, were increased from 142.9 °C to 1732.9 °C and from 223.4 °C to 1820.8 °C, respectively. Additionally, non-significant correlations were found between the sums of air temperature (cumulative daily temperature) and the onset of FF for most species. This finding differs from the result of the analysis in which a model of cumulated average monthly air temperature (CPAMAT) was used. As for our hypotheses, the first hypothesis was confirmed, but the second was not unequivocally confirmed; the temporal trends in the onset of FF over the last 26 years confirmed shifts to the earlier dates for most species but not for early-spring-flowering Petasites albus. Among spring-flowering species, onset of FF shifted from 2 days (0.07 day/year) for Pulmonaria officinalis to 8 days (0.30 day/year) for Carex pilosa. On the other hand, the onset of flowering for summer species shifted more significantly to earlier dates —from 7 days (0.27 day/year) for Campanula trachelium to 12 days (0.46 day/year) for Veronica officinalis. Based on the above observations, we can state that Carex pilosa and Veronica officinalis appear to be the most sensitive bioindicators of increasing temperature among all investigated species. The trends were statistically significant for five species, except for species that represent the opposite poles of the phenological spectrum (two early-spring, one late-spring and one late-summer species).
In study, we focused mainly on the bioindication potential of selected herbal species in relation to climatic factors. The consequences of shifts in flowering are currently difficult to predict. No visible changes in the structure of the populations or in their composition were recorded during study period. However, it is possible that if the trend continues, it may have a negative impact on the vitality of some species and thus on their competitiveness. This paper also revealed the necessity for further investigations to explain the unequal phenological response of the investigated species to the selected ecological factors. This need for further research seems to be more acute with changing environmental conditions currently occurring within all forest ecosystems.

Author Contributions

Conceptualization, M.K. and B.S.; methodology, B.S.; software, R.J.; validation, R.J.; formal analysis, R.J.; investigation, B.S.; resources, B.S.; data curation, B.S.; writing—original draft preparation, M.K. and B.S.; writing—review and editing, M.K. and B.S.; visualization, M.K.; supervision, R.J.; project administration, B.S.; funding acquisition, B.S. All authors have read and agreed to the published version of the manuscript.

Funding

This research was supported by the Science Grant Agency of the Ministry of Education of the Slovak Republic and the Slovak Academy of Sciences (VEGA), Project No. 2/0050/21.

Institutional Review Board Statement

Not applicable.

Informed Consent Statement

Not applicable.

Data Availability Statement

Not applicable.

Conflicts of Interest

The authors declare no conflict of interest.

References

  1. Amano, T.; Smithers, R.J.; Sparks, T.H.; Sutherland, W.J. A 250-year index of first flowering dates and its response to temperature changes. Proc. R. Soc. B 2010, 277, 2451–2457. [Google Scholar] [CrossRef] [PubMed] [Green Version]
  2. Boisvenue, C.; Running, S.W. Impacts of climate change on natural forest productivity—Evidence since the middle of the 20th century. Glob. Chang. Biol. 2006, 12, 862–882. [Google Scholar] [CrossRef]
  3. Parmesan, C.; Yohe, G. A globally coherent fingerprint of climate change impacts across natural systems. Nature 2003, 421, 37–42. [Google Scholar] [CrossRef] [PubMed]
  4. Cheddadi, R.; Araújo, M.B.; Maiorano, L.; Edwards, M.; Guisan, A.; Carré, M.; Chevalier, M.; Pearman, P.B. Temperature range shifts for three European tree species over the last 10,000 years. Front. Plant Sci. 2016, 7, 1581. [Google Scholar] [CrossRef] [Green Version]
  5. Kozyr, I.V. Forest Vegetation dynamics along an altitudinal gradient in relation to the climate change in Southern Transbaikalia, Russia. Achiev. Life Sci. 2014, 8, 23–28. [Google Scholar] [CrossRef] [Green Version]
  6. Thuiller, W.; Lavorel, S.; Araújo, M.B.; Sykes, M.T.; Prentice, I.C. Climate change threats to plant diversity in Europe. Proc. Natl. Acad. Sci. USA 2005, 102, 8245–8250. [Google Scholar] [CrossRef] [Green Version]
  7. Zimmermann, N.E.; Yoccoz, N.G.; Edwards, T.C.; Meier, E.S.; Thuiller, W.; Guisan, A.; Schmatz, D.R.; Pearman, P.B. Climatic extremes improve predictions of spatial patterns of tree species. Proc. Natl. Acad. Sci. USA 2009, 106, 19723–19728. [Google Scholar] [CrossRef] [Green Version]
  8. Menzel, A.; Estrella, N.; Fabian, P. Spatial and temporal variability of the phenological seasons in Germany from 1951 to 1996. Glob. Chang. Biol. 2001, 7, 657–666. [Google Scholar]
  9. Montgomery, R.A.; Rice, K.E.; Stefanski, A.; Rich, R.L.; Reich, P.B. Phenological responses of temperate and boreal trees to warming depend on ambient spring temperatures, leaf habit, and geographic range. Proc. Natl. Acad. Sci. USA 2020, 117, 10397–10405. [Google Scholar] [CrossRef]
  10. Schieber, B.; Kubov, M.; Janík, R. Effects of climate warming on vegetative phenology of the common beech Fagus sylvatica in a submontane forest of the Western Carpathians: Two-decade analysis. Pol. J. Ecol. 2017, 65, 339–351. [Google Scholar]
  11. Sierota, Z.; Grodzki, W.; Szczepkowski, A. Abiotic and biotic disturbances affecting forest health in Poland over the past 30 years: Impacts of climate and forest management. Forests 2019, 10, 75. [Google Scholar] [CrossRef] [Green Version]
  12. Lukasová, V.; Vido, J.; Škvareninová, J.; Bičárová, S.; Hlavatá, H.; Borsányi, P.; Škvarenina, J. Autumn phenological response of European Beech to summer drought and heat. Water 2020, 12, 2610. [Google Scholar] [CrossRef]
  13. Lukasová, V.; Škvareninová, J.; Bičárová, S.; Sitárová, Z.; Hlavatá, H.; Borsányi, P.; Škvarenina, J. Regional and altitudinal aspects in summer heatwave intensification in the Western Carpathians. Theor. Appl. Climatol. 2021, 146, 1111–1125. [Google Scholar] [CrossRef]
  14. Kirschbaum, M.U.F. Forest growth and species distribution in a changing climate. Tree Physiol. 2000, 20, 309–322. [Google Scholar] [CrossRef] [PubMed]
  15. Hartl-Meier, C.; Dittmar, C.; Zang, C.; Rothe, A. Mountain forest growth response to climate change in the Northern Limestone Alps. Trees 2014, 28, 819–829. [Google Scholar] [CrossRef]
  16. Ďurský, J.; Škvarenina, J.; Minďáš, J.; Miková, A. Regional analysis of climate change impact on Norway spruce (Picea abies L. Karst.) growth in Slovak mountain forests. J. Forest Sci. 2006, 52, 306–315. [Google Scholar] [CrossRef] [Green Version]
  17. Rafferty, N.E.; Diez, J.M.; Bertelsen, C.D. Changing climate drives divergent and nonlinear shifts in flowering phenology across elevations. Curr. Biol. 2020, 30, 432–441. [Google Scholar] [CrossRef] [Green Version]
  18. Bottlíková, A. Phenological characterization of selected phytocoenoses in the kettlehole of Liptov. Biologické Práce 1975, 21, 1–81. [Google Scholar]
  19. Davies, T.J.; Wolkovich, E.M.; Kraft, N.J.B.; Salamin, N.; Allen, J.M.; Ault, T.R.; Betancourt, J.L.; Bolmgren, K.; Cleland, E.E.; Cook, B.I.; et al. Phylogenetic conservatism in plant phenology. J. Ecol. 2013, 101, 1520–1530. [Google Scholar] [CrossRef]
  20. Tyler, G. Relationships between climate and flowering of eight herbs in a Swedish deciduous forest. Ann. Bot. 2001, 87, 623–630. [Google Scholar] [CrossRef] [Green Version]
  21. Fitter, A.H.; Fitter, R.S.R. Rapid changes in flowering time in British plants. Science 2002, 296, 1689–1691. [Google Scholar] [CrossRef] [PubMed]
  22. Schieber, B. Changes of flowering phenology of six herbal species in a beech forest (Central Slovakia): A decade analysis. Pol. J. Ecol. 2007, 55, 233–244. [Google Scholar]
  23. Liu, H.; Dai, J.; Liu, J. Spatiotemporal variation in full-flowering dates of tree peonies in the middle and lower reaches of China’s Yellow River: A simulation through the panel data model. Sustainability 2017, 9, 1343. [Google Scholar] [CrossRef] [Green Version]
  24. Lee, H.K.; Lee, S.J.; Kim, M.K.; Lee, S.D. Prediction of plant phenological shift under climate change in South Korea. Sustainability 2020, 12, 9276. [Google Scholar] [CrossRef]
  25. Jiang, Y.; Li, B.; Yuan, Y.; Sun, Q.; Zhang, T.; Liu, Y.; Li, Y.; Li, R.; Li, F. Trends in flowering phenology of herbaceous plants and its response to precipitation and snow cover on the Qinghai-Tibetan Plateau from 1983 to 2017. Sustainability 2021, 13, 7640. [Google Scholar] [CrossRef]
  26. Khodorova, N.V.; Boitel-Conti, M. The role of temperature in the growth and flowering of geophytes. Plants 2013, 2, 699–711. [Google Scholar] [CrossRef] [Green Version]
  27. Szabó, B.; Vincze, E.; Czúcz, B. Flowering phenological changes in relation to climate change in Hungary. Int. J. Biometeorol. 2016, 60, 1347–1356. [Google Scholar] [CrossRef]
  28. Nam, B.E.; Kim, J.G. Flowering season of vernal herbs is shortened at elevated temperatures with reduced precipitation in early spring. Sci. Rep. 2020, 10, 17494. [Google Scholar] [CrossRef]
  29. Hájková, L.; Voženílek, V.; Tolasz, R.; Kohut, M.; Možný, M.; Nekovář, J.; Novák, M.; Reitschläger, J.D.; Richterová, D.; Stříž, M.; et al. Atlas of the Phenological Conditions in Czechia; CHMI Prague-UP Olomouc: Prague, Czech Republic, 2012; p. 312. [Google Scholar]
  30. Hájková, L.; Možný, M.; Oušková, V.; Bartošová, L.; Dížková, P.; Žalud, Z. Meteorological variables that affect the beginning of flowering of the winter oilseed rape in the Czech Republic. Atmosphere 2021, 12, 1444. [Google Scholar] [CrossRef]
  31. Craine, J.M.; Wolkovich, E.M.; Towne, E.G. The roles of shifting and filtering in generating community-level flowering phenology. Ecography 2012, 35, 1033–1038. [Google Scholar] [CrossRef]
  32. Song, Y.; Shim, J.; Kinmonth-Schultz, H.; Imaizumi, T. Photoperiodic flowering: Time measurement mechanisms in leaves. Annu. Rev. Plant Biol. 2015, 66, 441–464. [Google Scholar] [CrossRef] [PubMed] [Green Version]
  33. Mortensen, L.M. Effects of air humidity on growth, flowering, keeping quality and water relations of four short-day greenhouse species. Sci. Hortic. 2000, 86, 299–310. [Google Scholar] [CrossRef]
  34. Chauhan, Y.S.; Ryan, M.; Chandra, S.; Sadras, V.O. Accounting for soil moisture improves prediction of flowering time in chickpea and wheat. Sci. Rep. 2019, 9, 1–11. [Google Scholar] [CrossRef] [PubMed]
  35. McMaster, G.S.; Wilhelm, W.W. Is soil temperature better than air temperature for predicting winter wheat phenology? Agron. J. 1998, 90, 602–607. [Google Scholar] [CrossRef] [Green Version]
  36. Fitter, H.; Fitter, R.S.R.; Harris, I.T.B.; Williamson, M.H. Relationships between first flowering date and temperature in the flora o a locality in central england. Funct. Ecol. 1995, 9, 55–60. [Google Scholar] [CrossRef]
  37. Mo, F.; Zhang, J.; Wang, J.; Cheng, Z.G.; Sun, G.J.; Ren, H.X.; Zhao, X.Z.; Cheruiyot, W.K.; Kavagi, L.; Wang, J.Y.; et al. Phenological evidence from China to address rapid shifts in global flowering times with recent climate change. Agric. For. Meteorol. 2017, 246, 22–30. [Google Scholar] [CrossRef]
  38. eLTER Networks. Available online: https://elter-ri.eu/national-lter-networks (accessed on 10 December 2021).
  39. Križová, E. Primary production of the aboveground biomass of a herb layer in selected forest types in EES Kováčová. Acta Fac. For. 1993, 35, 99–107. [Google Scholar]
  40. Kubov, M.; Schieber, B.; Janík, R. Seasonal dynamics of macronutrients in aboveground biomass of two herb-layer species in a beech forest. Biologia 2019, 74, 1415–1424. [Google Scholar] [CrossRef]
  41. Lapin, M.; Faško, P.; Melo, M.; Šťastný, P.; Tomlain, J. Atlas of the Landscape of the Slovak Republic, 1st ed.; MŽP: Bratislava, Slovakia, 2002; p. 344. [Google Scholar]
  42. Střelec, J. Influence of cutting intervention in a beech forest stand on changes in illumination. Lesnícky časopis-For. J. 1992, 38, 551–558. [Google Scholar]
  43. Diekmann, M. Relationship between flowering phenology of perennial herbs and meteorological data in deciduous forests of Sweden. Can. J. Bot. 1996, 74, 528–537. [Google Scholar] [CrossRef]
  44. Braslavská, O.; Kamenský, L. Phenological Observation of Forest Plants; Methodical Prescription; SHMI: Bratislava, Slovakia, 1996; p. 22. [Google Scholar]
  45. Meier, U. BBCH-Monograph: Growth Stages of Mono- and Dicotyledonous Plants, 2nd ed.; Technical Report; Federal Biological Research Centre for Agriculture and Forestry: Bonn, Germany, 2001. [Google Scholar]
  46. Braslavská, O.; Borsányi, P. Quality control of long series of phenological data with sum of cumulated average monthly air temperatures. In International Symposium on Applied Agrometeorology and Agroclimatology: Proceedings, Volos, Greece, 24–26 April 1996; Dalezios, N.R., Ed.; CEE: Luxembourg, 1996; pp. 305–310. [Google Scholar]
  47. Murray, M.B.; Cannell, G.R.; Smith, R.I. Date of budburst of fifteen tree species in Britain following climatic warming. J. Appl. Ecol. 1989, 26, 693–700. [Google Scholar] [CrossRef]
  48. Heide, O.M. Daylength and thermal time responses of budburst during dormancy release in some northern deciduous trees. Physiol. Plant. 1993, 88, 531–540. [Google Scholar] [CrossRef] [PubMed]
  49. Langvall, O.; Löfvenius, M.O. Long-term standardized forest phenology in Sweden: A climate change indicator. Int. J. Biometeorol. 2021, 65, 381–391. [Google Scholar] [CrossRef] [PubMed] [Green Version]
  50. R Core Team R. A Language and Environment for Statistical Computing; R Foundation for Statistical Computing: Vienna, Austria, 2017; Available online: https://www.project.org/ (accessed on 10 December 2021).
  51. Evans, J.D. Straightforward Statistics for the Behavioral Sciences; Brooks/Cole Publishing: Pacific Grove, CA, USA, 1996. [Google Scholar]
  52. WMO Report: 2020 Closes a Decade of Exceptional Heat. Available online: https://public.wmo.int/en/media/news/2020-closes-decade-of-exceptional-heat (accessed on 10 December 2021).
  53. IPCC 6th Report: Climate Change Widespread, Rapid, and Intensifying. Available online: https://www.ipcc.ch/2021/08/09/ar6-wg1-20210809-pr/ (accessed on 11 December 2021).
  54. Shorina, N.I.; Smirnova, O.V. The population biology of ephemeroids. In The Population Structure of Vegetation; White, J., Ed.; Dr. V. Junk Publishers: Dordrecht, The Netherlands, 1995; pp. 225–240. [Google Scholar]
  55. Lapointe, L.; Lerat, S. Annual growth of the spring ephemeral Erythronium americanum as a function of temperature and mycorrhizal status. Can. J. Bot. 2006, 84, 39–48. [Google Scholar] [CrossRef]
  56. Miller-Rushing, A.J.; Inouye, D.W.; Primack, R.B. How well do first flowering dates measure plant responses to climate change? The effects of population size and sampling frequency. J. Ecol. 2008, 96, 1289–1296. [Google Scholar] [CrossRef]
  57. Adhikari, B.S.; Kumar, R. Effect of snowmelt regime on phenology of herbaceous species at and around treeline in Western Himalaya, India. Not. Sci. Biol. 2020, 12, 901–919. [Google Scholar] [CrossRef]
  58. Willems, F.M.; Scheepens, J.F.; Ammer, C.; Block, S.; Bucharova, A.; Schall, P.; Sehrt, M.; Bossdorf, O. Spring understory herbs flower later in intensively managed forests. Ecol. Appl. 2021, 31, e02332. [Google Scholar] [CrossRef]
  59. Richardson, A.D.; O’Keefe, J. Phenological differences between understory and overstory: A case study using the long-term Harvard forest records. In Phenology and Ecosystem Processes; Noormets, A., Ed.; Springer Science + Business Media, LLC: New York, NY, USA, 2009; pp. 87–117. [Google Scholar]
  60. Chmielewski, F.M.; Müller, A.; Bruns, E. Climate changes and trends in phenology of fruit trees and field crops in Germany, 1961–2000. Agric. For. Meteorol. 2004, 121, 69–78. [Google Scholar] [CrossRef]
  61. Babálová, D.; Škvareninová, J.; Fazekaš, J.; Vyskot, I. The dynamics of the phenological development of four woody species in south-west and central Slovakia. Sustainability 2018, 10, 1497. [Google Scholar] [CrossRef] [Green Version]
  62. Gordo, O.; Sanz, J.J. Phenology and climate change: A long-term study in a Mediterranean locality. Oecologia 2005, 146, 484–495. [Google Scholar] [CrossRef]
  63. Moore, L.M.; Lauenroth, W.K. Differential effects of temperature and precipitation on early- vs. late- flowering species. Ecosphere 2017, 8, e01819. [Google Scholar] [CrossRef] [Green Version]
  64. Hájková, L.; Hubálek, Z.; Kožnarová, V.; Bartošová, L.; Možný, M. Flowering of allergenically important plant species in relation to the North Atlantic Oscillation system and thermal time in the Czech Republic. Aerobiologia 2018, 34, 157–169. [Google Scholar] [CrossRef]
  65. Von Wuehlisch, G.; Krusche, D.; Muhs, H.J. Variation in temperature sum requirement for flushing of beech provenances. Silvae Genet. 1995, 44, 343–346. [Google Scholar]
  66. Schemske, D.W.; Willson, M.F.; Melampy, M.N.; Miller, L.J.; Verner, L.; Schemske, K.M.; Best, L.B. Flowering ecology of some spring woodland herbs. Ecology 1978, 59, 351–366. [Google Scholar] [CrossRef]
Figure 1. Location of the study area in central Slovakia.
Atmosphere 13 00195 g001
Figure 2. Temporal changes in mean monthly air temperature and mean monthly precipitation totals between 1951 and 1980 and the survey period, 1995–2020, at the Sliač meteorological station.
Atmosphere 13 00195 g002
Figure 3. Absolute (Δ, upper line) and standardised (Δ/STD, lower line) differences between mean monthly air temperature (1995–2020) and long-term mean (1951–1980) at the Sliač meteorological station.
Atmosphere 13 00195 g003
Figure 4. The course of mean air temperature during the growing season (April–September) at the Sliač meteorological station from 1995 to 2020. Both linear trend and long-term average for two periods are depicted.
Atmosphere 13 00195 g004
Figure 5. Onset of full-flowering phenophase for six spring-flowering species and the course of cumulative temperature during the crucial periods for flowering development in the period from 1995 to 2020. Statistically significant (p < 0.05) linear trends are marked in red.
Atmosphere 13 00195 g005
Figure 6. Onset of full-flowering phenophase for three summer-flowering species and the course of cumulative temperature during the crucial periods for flowering development in the period from 1995 to 2020. Statistically significant (p < 0.05) linear trends are marked in red.
Atmosphere 13 00195 g006
Table 1. Basic statistical characteristics for the onset of the FF phase during the survey period, 1995–2020.
Phenological GroupsSpeciesEarliest Onset
DOY (year)
Latest Onset
DOY (year)
Mean (DOY)STDE
(Days)
VR (Days)CV (%)
Early springPetasites albus67 (1998)112 (2013)90.810.64511.6
Pulmonaria officinalis81 (2014)115 (2013)100.47.3347.2
Mid springCarex pilosa93 (2014)120 (1996)107.76.9276.4
Dentaria bulbifera105 (2014)134 (1997)120.86.1295.1
Late springFragaria vesca114 (2014)137 (1997)128.55.8234.5
Galium odoratum120 (2018)139 (1997)131.04.8193.7
Early summerVeronica officinalis146 (2018)175 (1997)159.76.3293.9
Mid summerMycelis muralis171 (2018)191 (1997)182.74.9202.7
Late summerCampanula trachelium194 (2015)222 (2004)203.46.5283.2
DOY = day of year, STDE = standard error, VR = variation range, CV = coefficient of variation.
Table 2. Correlation (r values) with significance levels (*** p < 0.001, ** p < 0.01, * p < 0.05) between the onset of the FF phase and two meteorological variables during the different periods of the growing seasons from 1995 to 2020.
Phenological GroupSpeciesPeriodTemperature (r Value)Precipitation (r Value)
Early springPetasites albusII.–III.−0.658 ***0.207
III.−0.542 **0.204
Pulmonaria officinalisII.–III.−0.745 ***0.080
III.−0.682 ***0.164
Mid springCarex pilosaIII.–IV.−0.751 ***0.255
IV.−0.2890.309
Dentaria bulbiferaIII.–IV.−0.816 ***0.114
IV.−0.617 ***0.357
Late springGalium odoratumIII.–IV.−0.719 ***0.087
IV.−0.663 ***0.443 *
Fragaria vescaIII.–IV.−0.780 ***0.322
IV.−0.550 **0.484 *
Early summerVeronica officinalisIV.–V.−0.672 ***0.108
V.−0.430 *0.076
Mid summerMycelis muralisIV.–VI.−0.771 ***0.357
V.–VI.−0.735 ***0.288
VI.−0.597 **0.280
Late summerCampanula tracheliumIV.–VI.−0.488 *0.515 **
IV.–VII.−0.612 ***0.268
V.–VII.−0.619 ***0.121
VII.−0.492 *0.347
Table 3. Cumulative daily temperature (°C) with a threshold value of 0 °C during the years from 2010 to 2020.
Phenological GroupsSpeciesCumulative Daily Temperature Over 0 °C
AverageMinMaxCV (%)STD
Early springPetasites albus223.4177.9287.716.937.8
Pulmonaria officinalis294.2268.1325.46.117.8
Mid springCarex pilosa337.6278.2402.810.134.1
Dentaria bulbifera483.4362.6559.910.249.4
Late springFragaria vesca572.0510.7655.46.838.6
Galium odoratum632.3536.1740.99.258.0
Early summerVeronica officinalis996.3907.41152.66.665.3
Mid summerMycelis muralis1438.01333.11571.84.158.5
Late summerCampanula trachelium1820.81662.61992.25.294.4
CV = coefficient of variation, STD = standard deviation.
Table 4. Cumulative daily temperature (°C) with a threshold value of 5 °C during the years from 2010 to 2020.
Phenological GroupsSpeciesCumulative Daily Temperature Over 5 °C
AverageMinMaxCV (%)STD
Early springPetasites albus142.965.5227.333.047.2
Pulmonaria officinalis210.6135.8257.518.639.1
Mid springCarex pilosa252.4178.5329.419.749.7
Dentaria bulbifera395.5269.5486.514.557.5
Late springFragaria vesca484.1413.8581.910.651.5
Galium odoratum544.4451.7619.19.451.2
Early summerVeronica officinalis908.4814.41079.18.779.2
Mid summerMycelis muralis1350.11240.11450.04.764.0
Late summerCampanula trachelium1732.91530.31898.56.1106.0
CV = coefficient of variation, STD = standard deviation.
Publisher’s Note: MDPI stays neutral with regard to jurisdictional claims in published maps and institutional affiliations.

