Abstract
ELF recordings, especially in the 0–50 Hz range (Schumann Resonances), have gained great interest during the last twenty years because of their possible relation to many geophysical, climatological, solar, and even biological phenomena, which several well-known scientists have reported. A very important question that still has not been answered is whether some particular variations in the Schumann Resonances (SR) band operate as precursors of forthcoming seismic activity. Greece and the wider Mediterranean area are a very seismic territory where medium size earthquakes (4–6.5 Richter) occur very often, contributing to a high percentage of the natural hazards of the area. In our effort to make evident how effective and prerequisite SR recordings are in the detection of forthcoming earthquakes, we analyze data collected for almost five years by two SR stations located in the north and the south edge of the Greek territory, respectively. We have come to the conclusion that particular SR modulations are very useful in the predictability of forthcoming seismic activity, but they need to be completed with additional observations of adjoining effects which can contribute to the final decision.
1. Introduction
Earthquakes (hereafter EQs) constitute one of the most serious natural hazards that impact most of the world. Other natural hazards, like floods, hurricanes, tsunamis, or forest fires are in most of the cases restricted to certain zones of the earth like the monsoon zone in Asia, the Gulf of Mexico, the Pacific coasts or the Amazonian. On the other hand, earthquakes affect most of the earth. The most requested solution for EQ hazards is reliable prediction, something which still in the present appears to be unsolved. The EQ research for years has surpassed the narrow limits of seismology or the wider area of geophysics to become a multi-scientific problem which covers the general topic of physics. Ionospheric physics, atmospheric electricity, informatics and advanced mathematical methods have been involved in the problem of EQ prediction for the last twenty years.
A vast number of methods and proposals on this subject have been communicated, which can be classified in the following four groups. The first group comprises methods based on mathematical analysis and modelling of pure seismic data. A second group considers various ionospheric disturbances as preseismic signals. The third is a group of pure seismological methods based on statistics of the seismogenic history of specific areas close to geological trenches, and the fourth is a group of methods which seeks seismic precursors in the electromagnetic time series of fields and currents of different kinds and frequencies. The last group is the most popular because many EQ quasi-precursors are more electromagnetic than purely seismological. Interesting reviews on these subjects have been written by Hayakawa [1,2], Pulinets and Boyarchuk [3], Hayakawa and Molchanov [4,5], and Hayakawa and Hobara [6]. On the other hand, in many articles, single EQs or a small sample of them have been studied [7,8,9,10,11,12]. At first, in a short but comprehensive communication, Love and Thomas [13] pointed out that EQs occur quite independently from any solar influence on the earth. This is an important boundary because it narrows the field of EQ precursor research from the ground to the upper ionospheric layers. Several methods, theoretical tools, models and simulations have been applied in the effort of significant EQ prediction [14]. T-complexity or approximate entropy has been applied by Karamanos et al. [15,16] with hopeful results, while applications of Time Frequency Representation (TFR) have been presented by Mahdavi et al. [17]. Recent applications of machine learning methodologies gave interesting results from the academic side of the problem [10,11].
Since the middle of the 20th century, the importance of ionospheric modulations to seismic research had been understood. Davis and Baker [18] wrote a pioneering article on ionospheric disturbances when a strong EQ occurred in Alaska. The technological improvements of the next years enriched science with more effective instruments. High resolution GPS total electron content (TEC) has been used for detailed studies of ionospheric disturbances. Tsugava et al. [19], using this technique, revealed TEC variations immediately after the EQ in the pacific Coast of Tohoku. The same technique has been applied in an EQ in India by Namgaladge et al. [20], where they also detected TEC variations at the time of EQ onset. Additional improvements in observational methods have been offered using satellite data. Harrison et al. [21], treating data from the DEMETER satellite, detected changes in the natural ELF recordings at night before EQs. Increases in the ULF wave activity observed by DEMETER were also detected when the satellite was flying over Sichuan China before the EQ in May 2008 [22]. From the beginning of the 21st century, a new idea came in the relevant research field: the Schumann Resonances. Schumann Resonances are Extremely Low Frequencies (ELF) in the range of 2–50 Hz which were described theoretically by Schumann [23] and discovered experimentally by Balser and Warner [24,25]. The first review on this interesting subject was written by Galejs [26], who described the basic elements of the Schumann Resonances. Systematic research on the association of electromagnetic/ionospheric disturbances with seismic activity has been extended the last two decades to the formulation of a trusty mechanism which can explain relations between EQs and the upper ionosphere.
Hayakawa et al. [27] advanced the field by including the aspect of the gyrotropic waves which were described by Sorokin and Hayakawa [28]. Waves from the ground with frequencies around 15-20Hz excite gyroscopic waves, which can cause enhancements in the 3rd mode of the Schuman Resonances. Nickolaenko et al. [29] ascribed observational anomalies appearing in Schumann Resonance spectra to radio wave scattering above the EQ epicenter from non-uniform conductivity in the mesosphere. Schekotov et al. [30] presented a short-term EQ prediction method that involved treating low-frequency magnetic fields from the Ultra-Low Frequencies (ULF) (0,01-0,1 Hz to the Extremely Low Frequencies (ELF) (1–30 Hz) in the Schumann Resonance band.
In our effort to study the interference of the ELF waves in the geophysics of East Mediterranean, systematic Schumann Resonance observations began in Greece in 2016, first in northern Greece and later in the south [31,32].
At the moment, the predominant scenario connecting EQs, ionospheric disturbances and ULF/ELF/LF perturbations starts with ionizing gases which emanate from the ground through micro-cracking created by micro-vibrations of the ground days, or even weeks, before the main seismic shock. The ionized gases, perhaps Radon, modify air conductivity between the surface and the E and perhaps F ionospheric layers, which subsequently create low-frequency radio noise modifications [33]. This is a reasonable hypothetical scenario which is presently being addressed by observations and a robust theory description.
Concerning our case, the present study could be ranked in the fourth group of methods we mentioned above, which are pure experimental methods that attempt to identify coupling between EQs and SR perturbations one by one.
2. Place, Time, Kind, and Main Characteristics of ELF Observations in the Greek Area
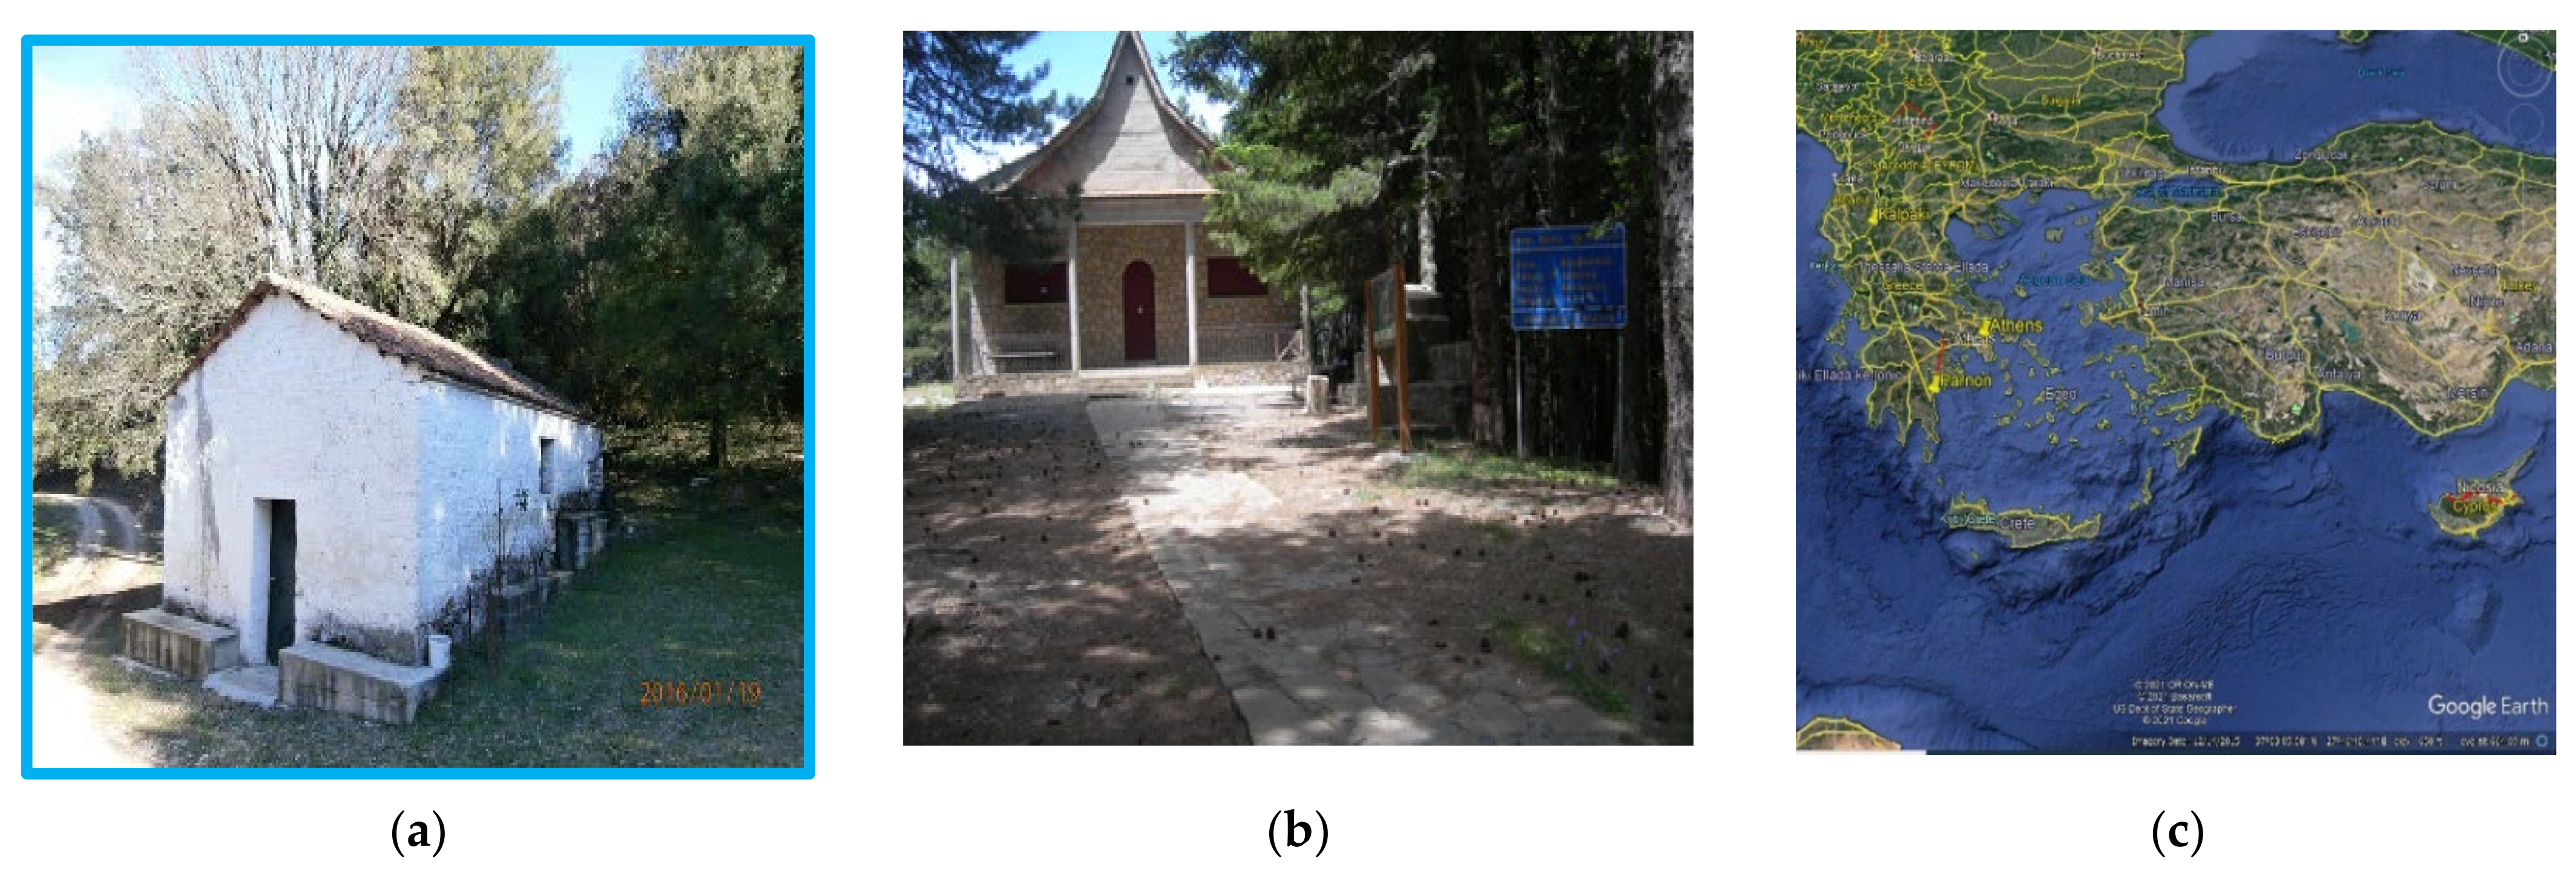
There are two sites of Extremely Low Frequency in the band of Schumann Resonance (0–50 Hz) (hereafter ELF/SR) observations in Greece. The first is in northern Greece, close to the Greek-Albanian border, by the village of Doliana (39.54° N 20.34° E) (hereafter NORTH) and the second is in southern Greece, on mount Parnon (1450 m), close to the town of Sparta in the territory of Laconia (37°13′18.33″ N 22°36′42.12″ E) (hereafter SOUTH) (Figure 1). Both sites are located in the countryside, far from any electromagnetic contamination, at least five kilometers far from the nearest village, functioning as ideal surroundings for SR measurements. The systems which operate in both cases are portable, but very accurate. They consist of one 60 cm coil orientated in the North-South direction, an amplification system and a logger. Both of the coils contain a mu-metal core with relative magnetic permeability on the order of 105 and 40,000 turns of copper wire with a diameter of 0.25 mm.
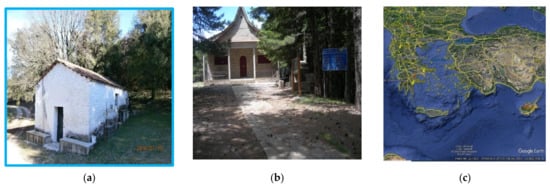
Figure 1.
Observation sites recording ELF/SR measurements in the Greek area, NORTH (a) SOUTH (b) and the orientation and distance between them (c). Building (a) is a little hospitable countryside chapel while building (b) is a forest shelter. In the map (c), the European-Asiatic arc of crush between the European and Asiatic tectonic plates (south of the island Creta), which makes east Mediterranean a very seismic area, is evident.
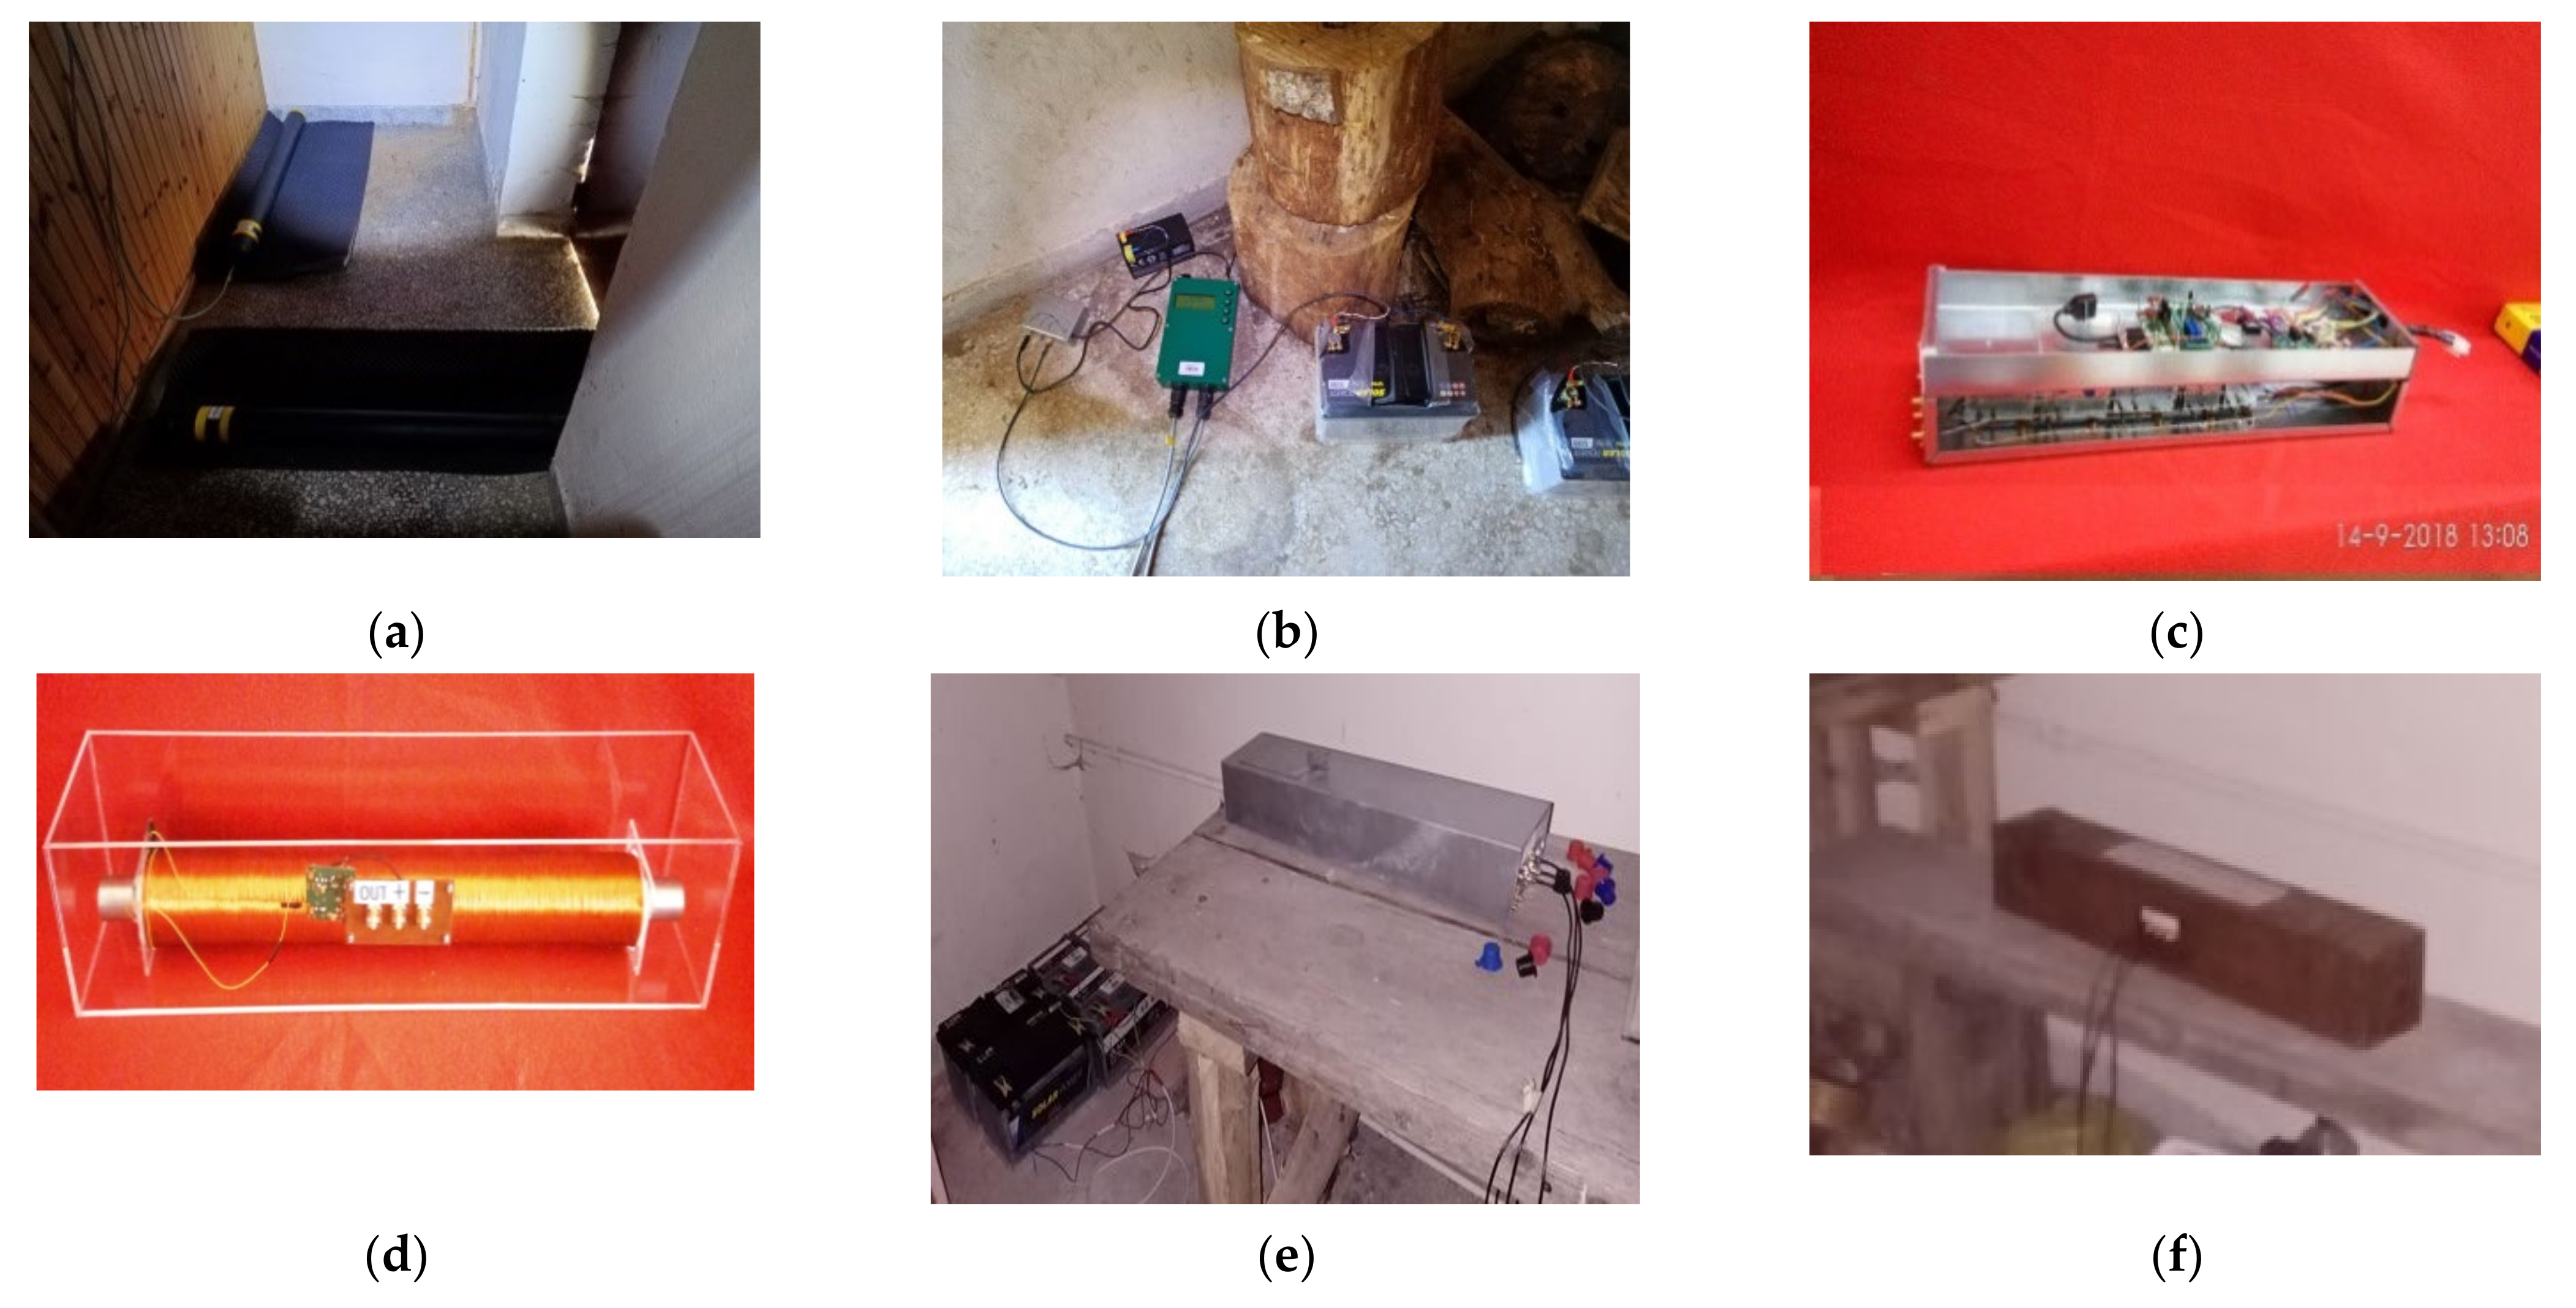
A preamplifier and a seven-stage cascade amplifier together with a filtering system ensure a clear gain of the SR signal. Finally, an acquisition and processing system digitizes and organizes data in 10-min files before they are stored on an SD card. A set of batteries provides energy to the system, thus minimizing electric current noise. Additional technical details and structural demands have been described extensively in Tatsis et al. [34,35] and Votis et al. [36]. A broad view of the instruments appears in Figure 2.

Figure 2.
Instrumentation at the observation sites. Photos (a,b) shows the Polish system (coils and logger, respectively) are presented. The next photos show the Greek system, in laboratory presentation (c,d) and in working mode (e,f).
NORTH started operating in the middle of 2016, but due to the COVID-19 pandemic and the restrictions to travelling, it was forced to interrupt operation after March 2020. It started operating again in September 2021. SOUTH started to operate in Spring 2020 and is still active because the mountain area where is located and the route to it are far from inhabited areas, which contributed to the operation of this site during the pandemic. From the summer of 2020, a Polish system consisting of two coils was hosted in SOUTH (Parnon). The system was established by the AGH University of Krakow and the data collected so far are valuable. Technical information of the Polish system can be found in the reports by Mlynarczyk et al. [37,38].
A sample of a typical 10-min file of raw, data together the relevant spectrum recorded by our systems, is presented in Figure 3. This is a benchmark for comparison with ELF perturbations and any divergence from the standard form of Figure 3.
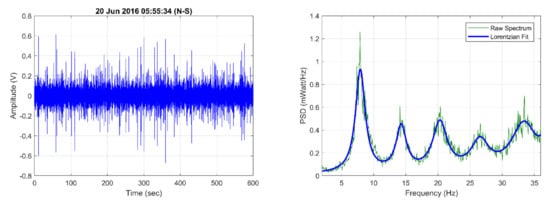
Figure 3.
Typical (normal) 10-min measurements (left) and corresponding power spectrum (right) which can be used as a reference shape. The blue curve is a typical Lorenzian fit. The SR modes close to 7.6, 14, 21, 27 and 35 Hz are clearly evident.
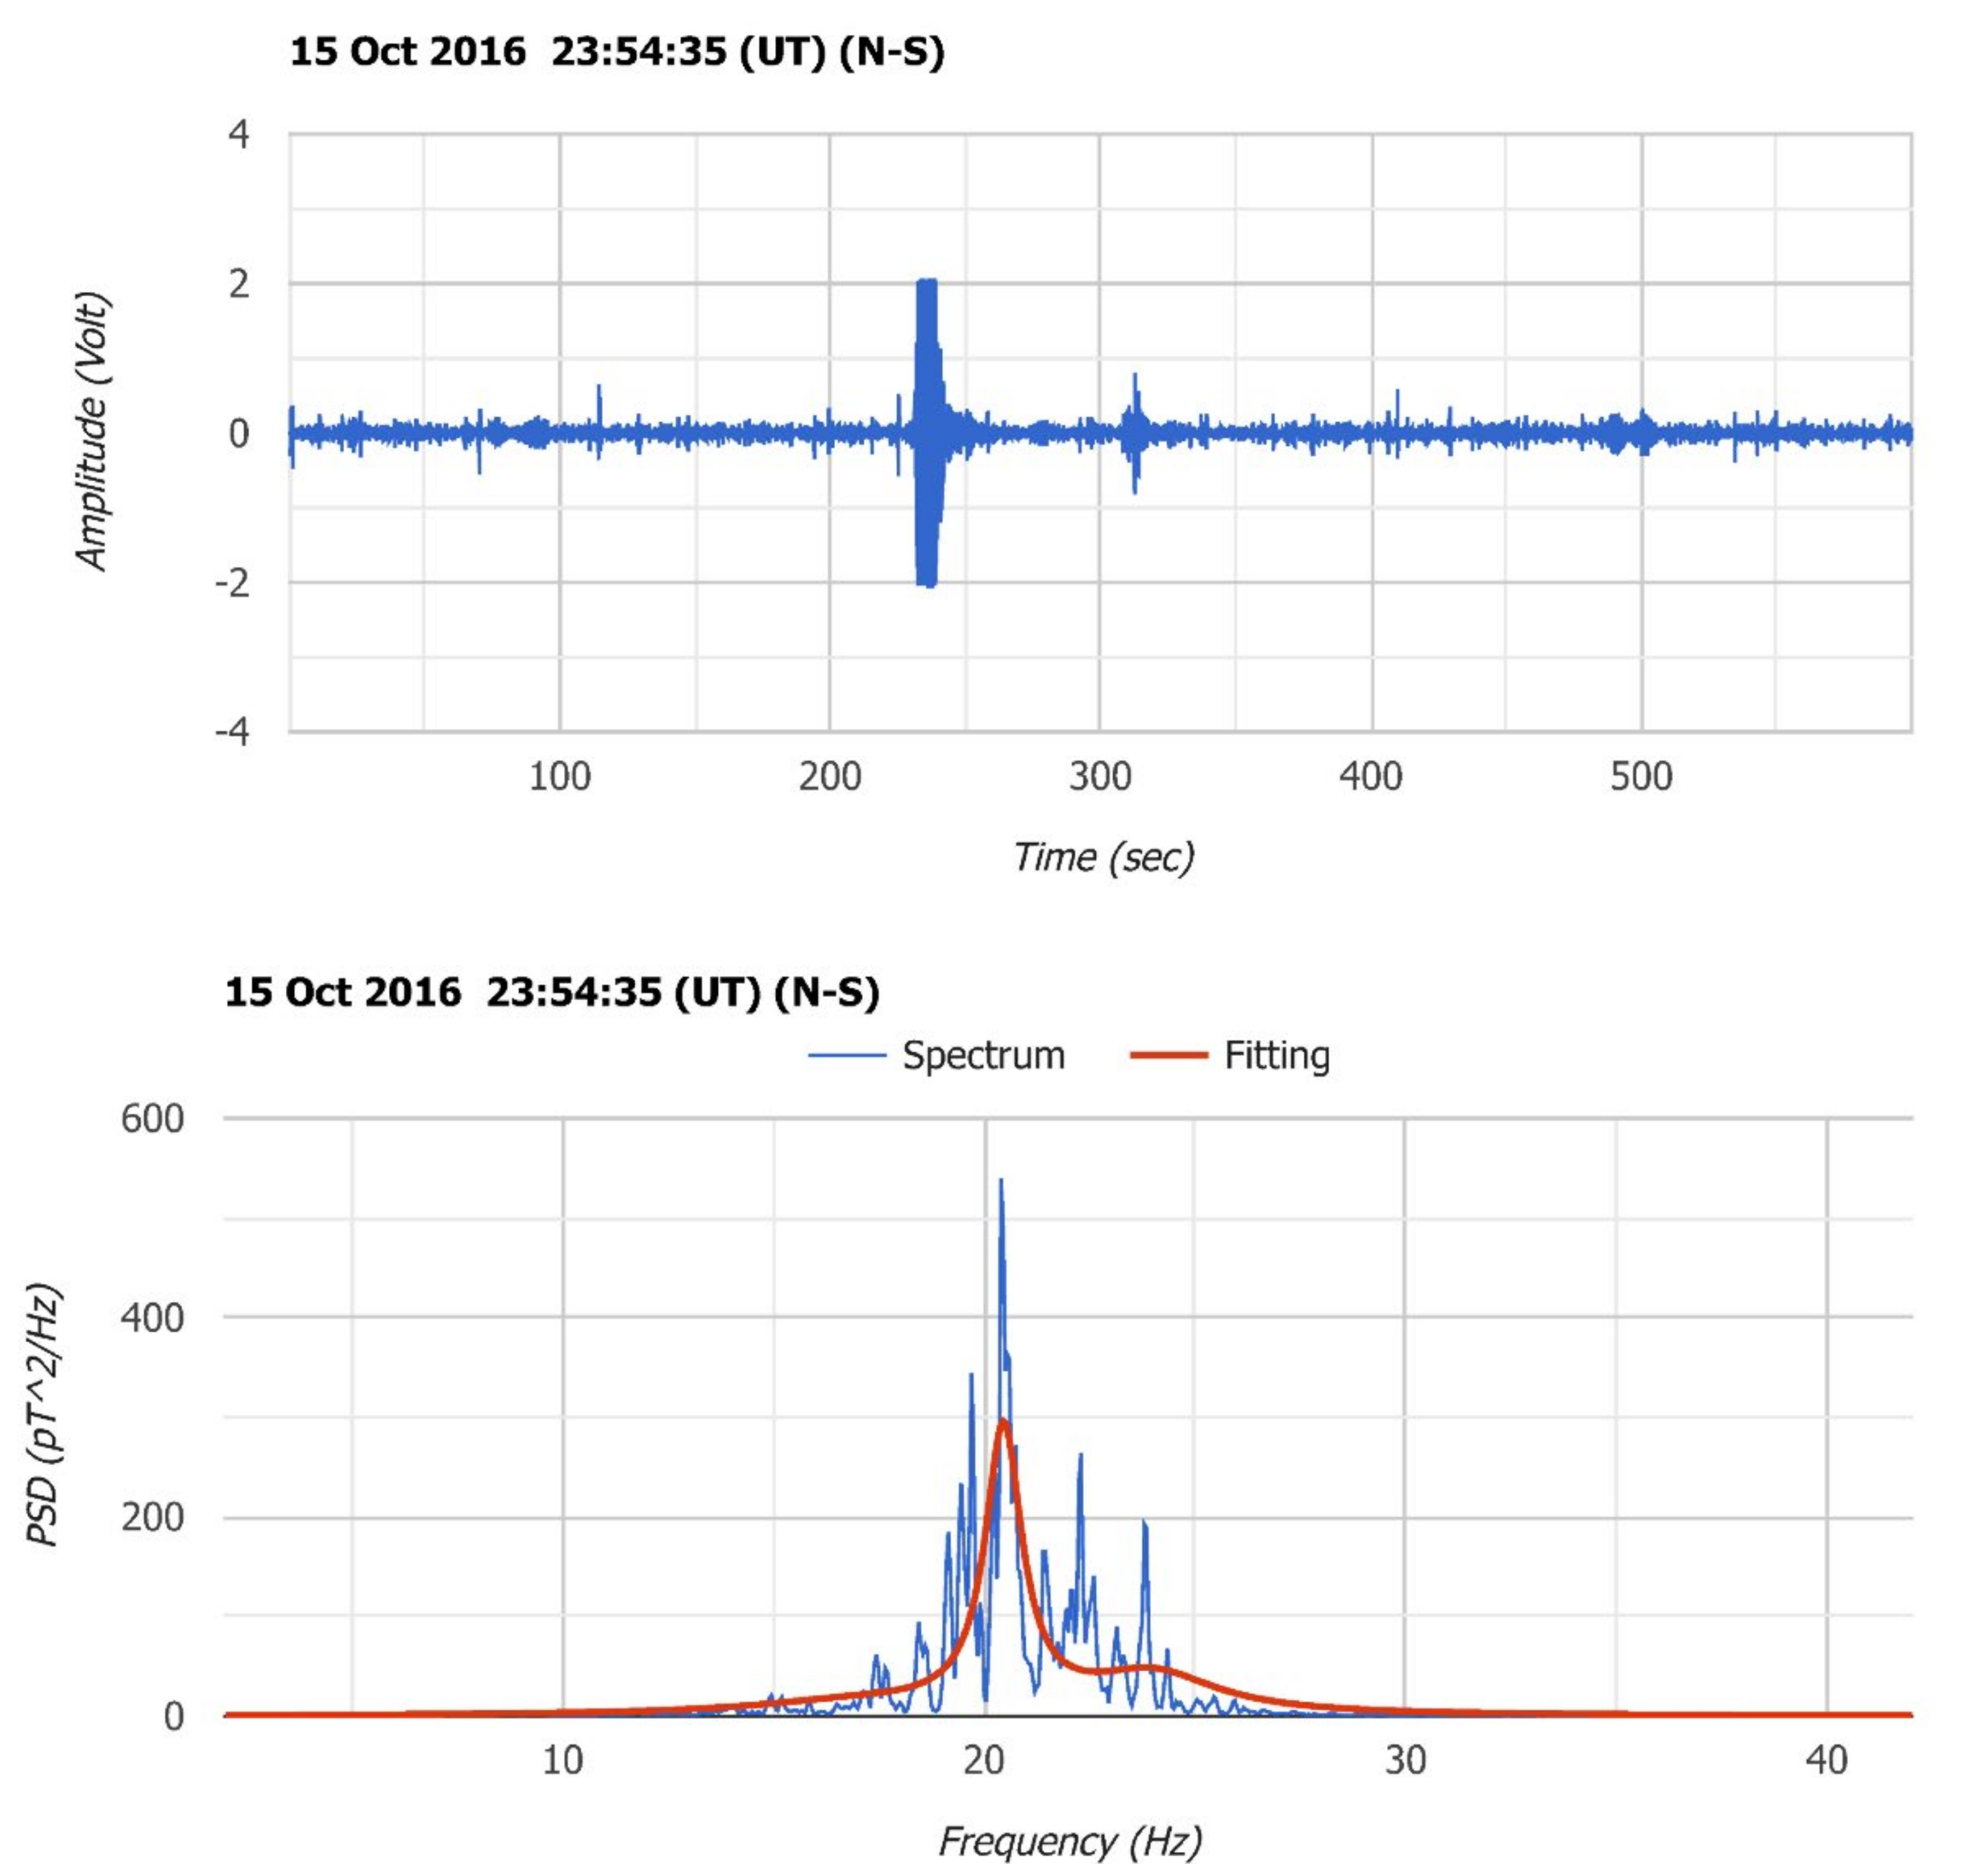
In contrast, a possible preseismic signal is depicted in Figure 4.
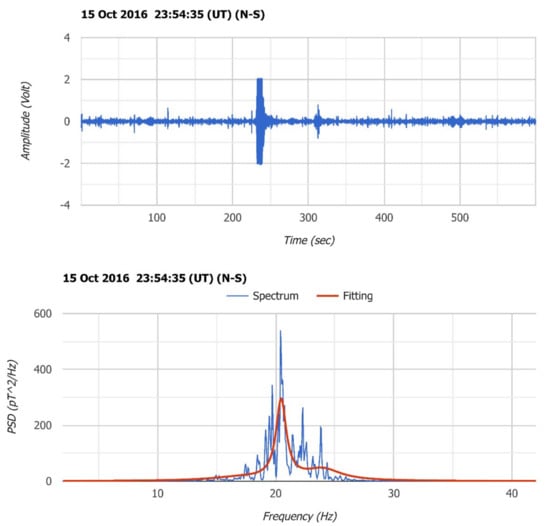
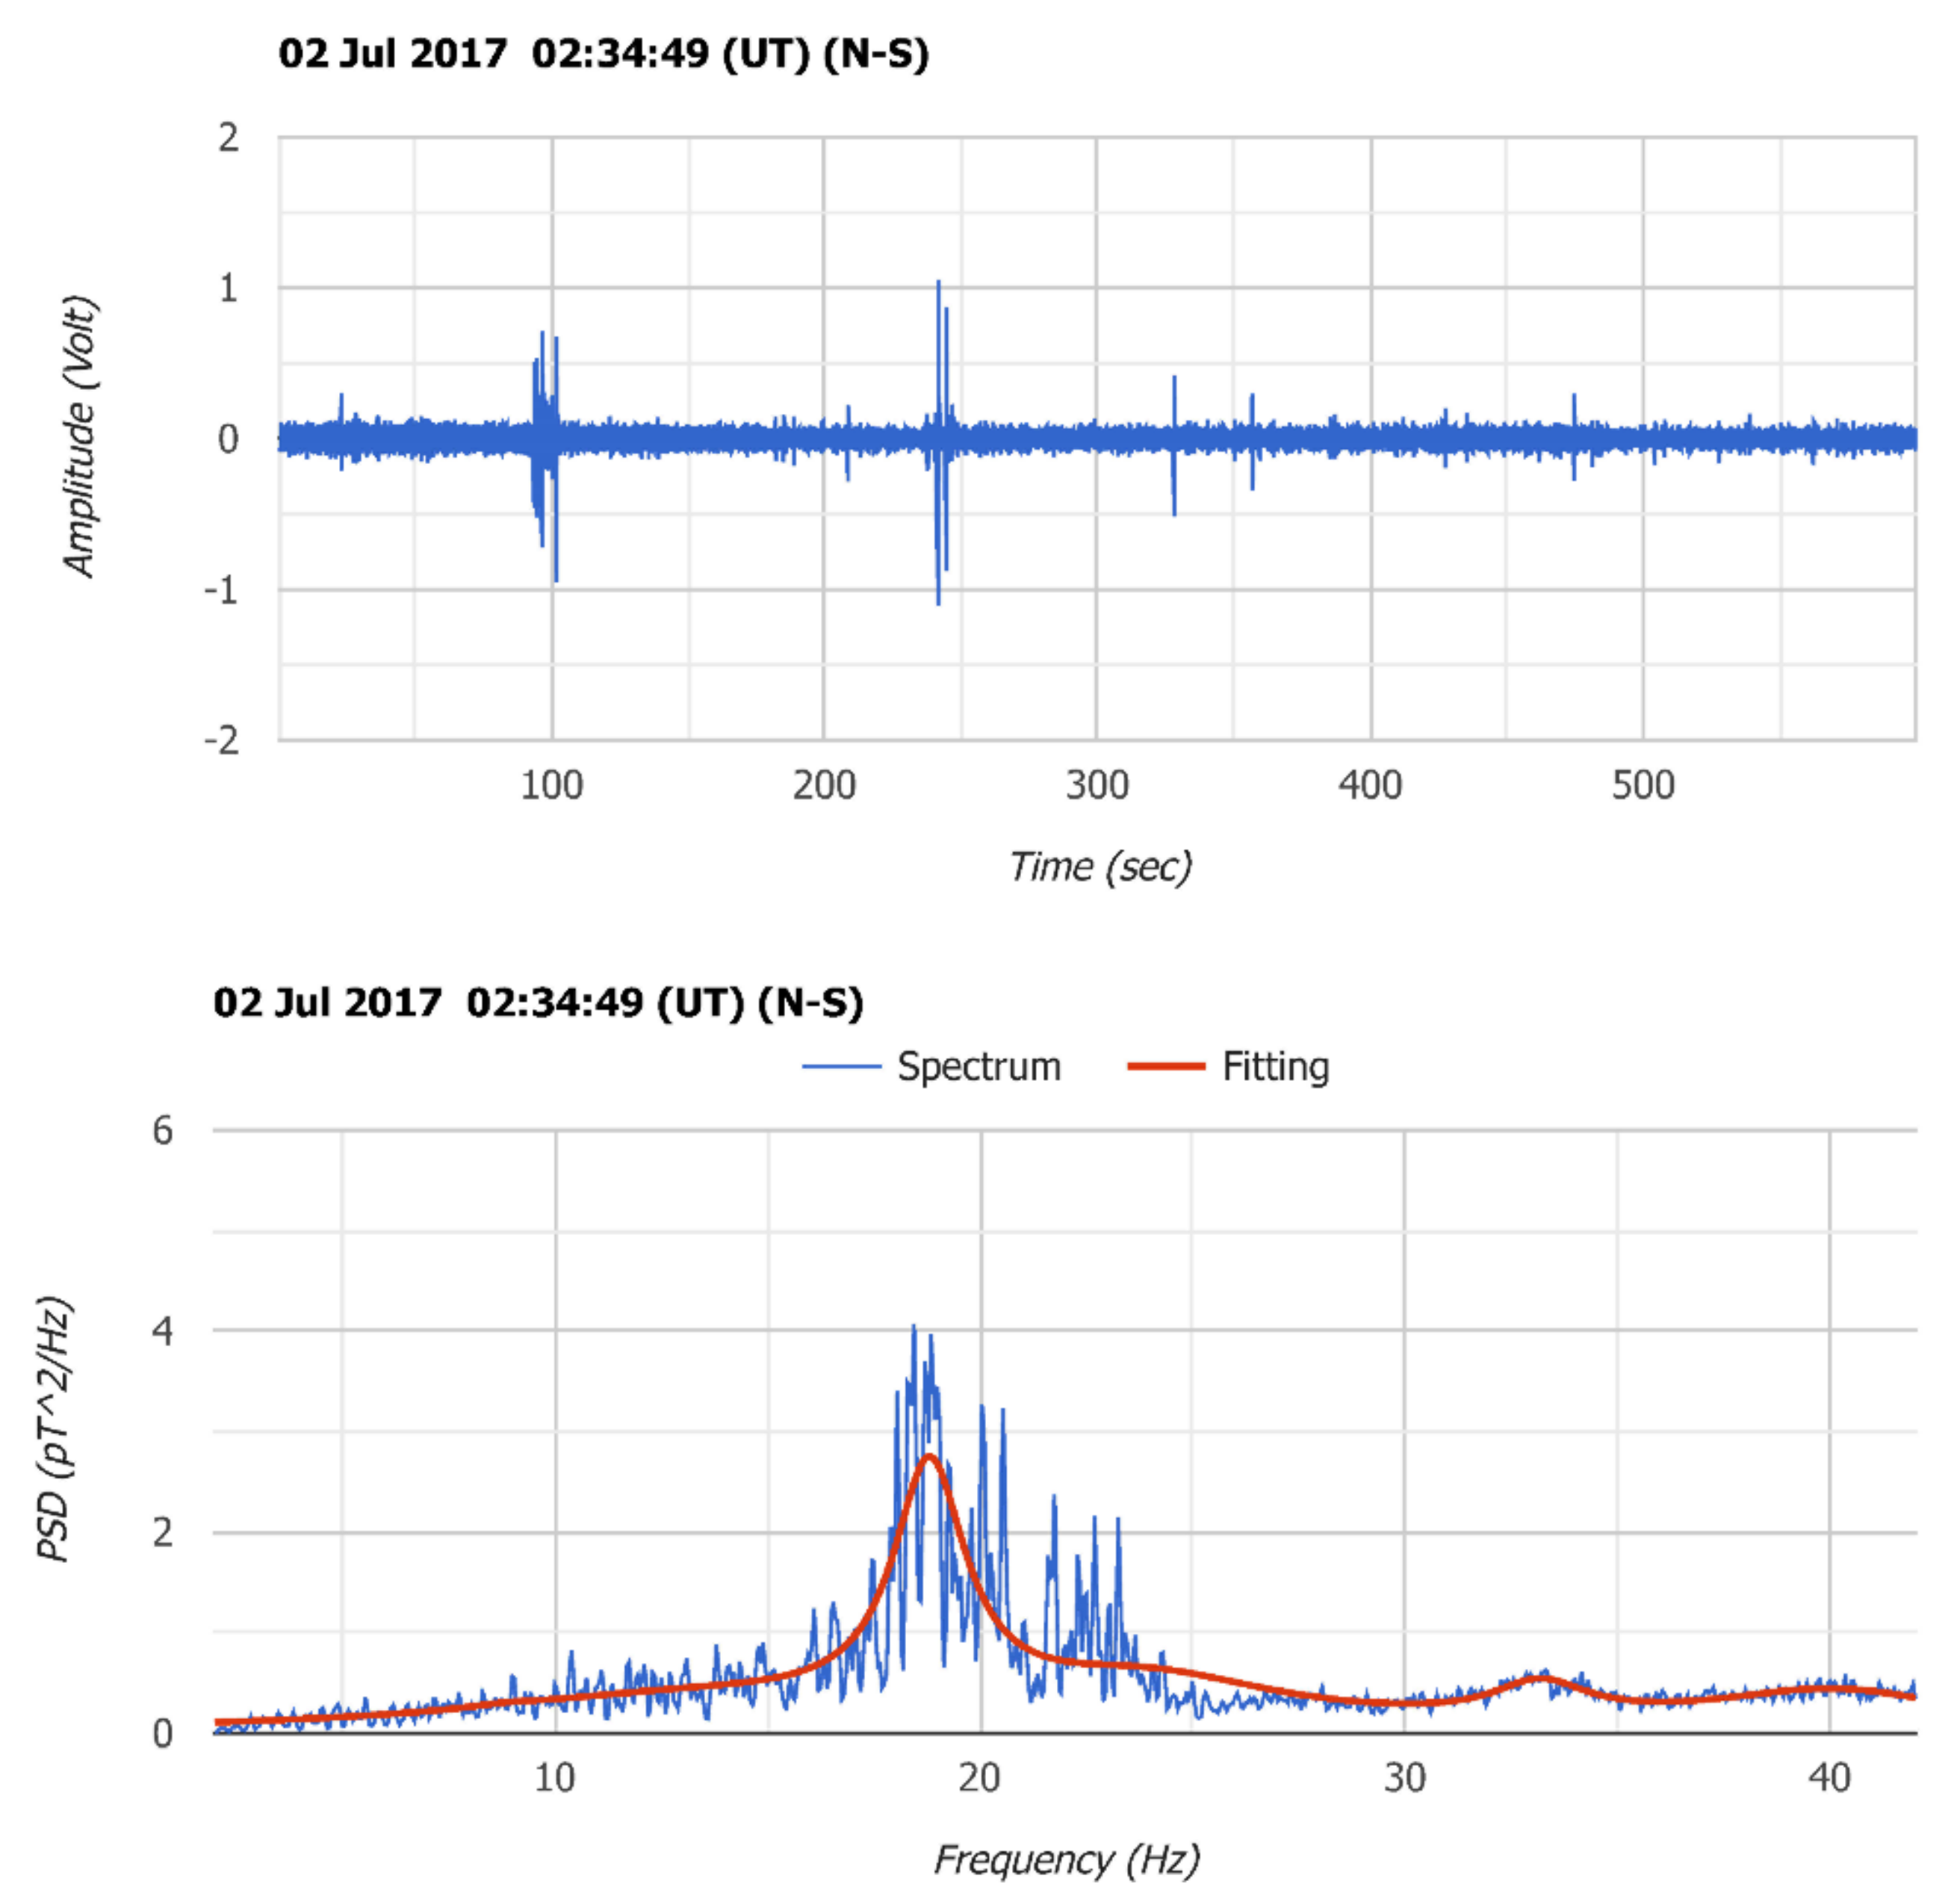
Figure 4.
Possible preseismic signal. A strong saturated signal of a few seconds occurred in the upper panel, where a 10-min file of raw data is presented. The relevant spectrum in the lower panel centers most of its power around the frequency of 20 Hz.
Similar signals appeared before the most of the EQs registered during the time the two Greek observation sites were operating [9,10,11].
There are a few preliminary characteristics and prerequisites which have been detected in these signals. Their morphologies are described in Figure 4. The time of their appearance varies from ten days to a few hours before the main EQ shock. The number of signals in the pre-EQ period is not stable. In some cases, there are 2–3 single signals scattered throughout one week, while in some other cases a couple of weak signals start to appear about ten days before the EQ occurrence, becoming more prevailent and stronger closer to the time of the main shock. Two main restrictions intervene in the conjugation of possible preseismic signals (hereafter PPS) and EQs, which can interfere with the appearance of an event. The first is that the EQs magnitude should be larger than 4.0 Richters (hereafter, R), at least. The second is that the epicenter of the main EQ should not be further than 250 km from the ELF observation site. The last restriction indicates that PPS and EQ coupling is a strictly local phenomenon and does not work for very long distances and weak shocks.
Concerning the physical meaning of the PPS’s, the first doubt that occurred to us was that these signals were recordings of simple movements of the coils caused by preseismic ground vibrations or other anthropogenic noises, but subsequent experiments indicated that concern was not valid [39].
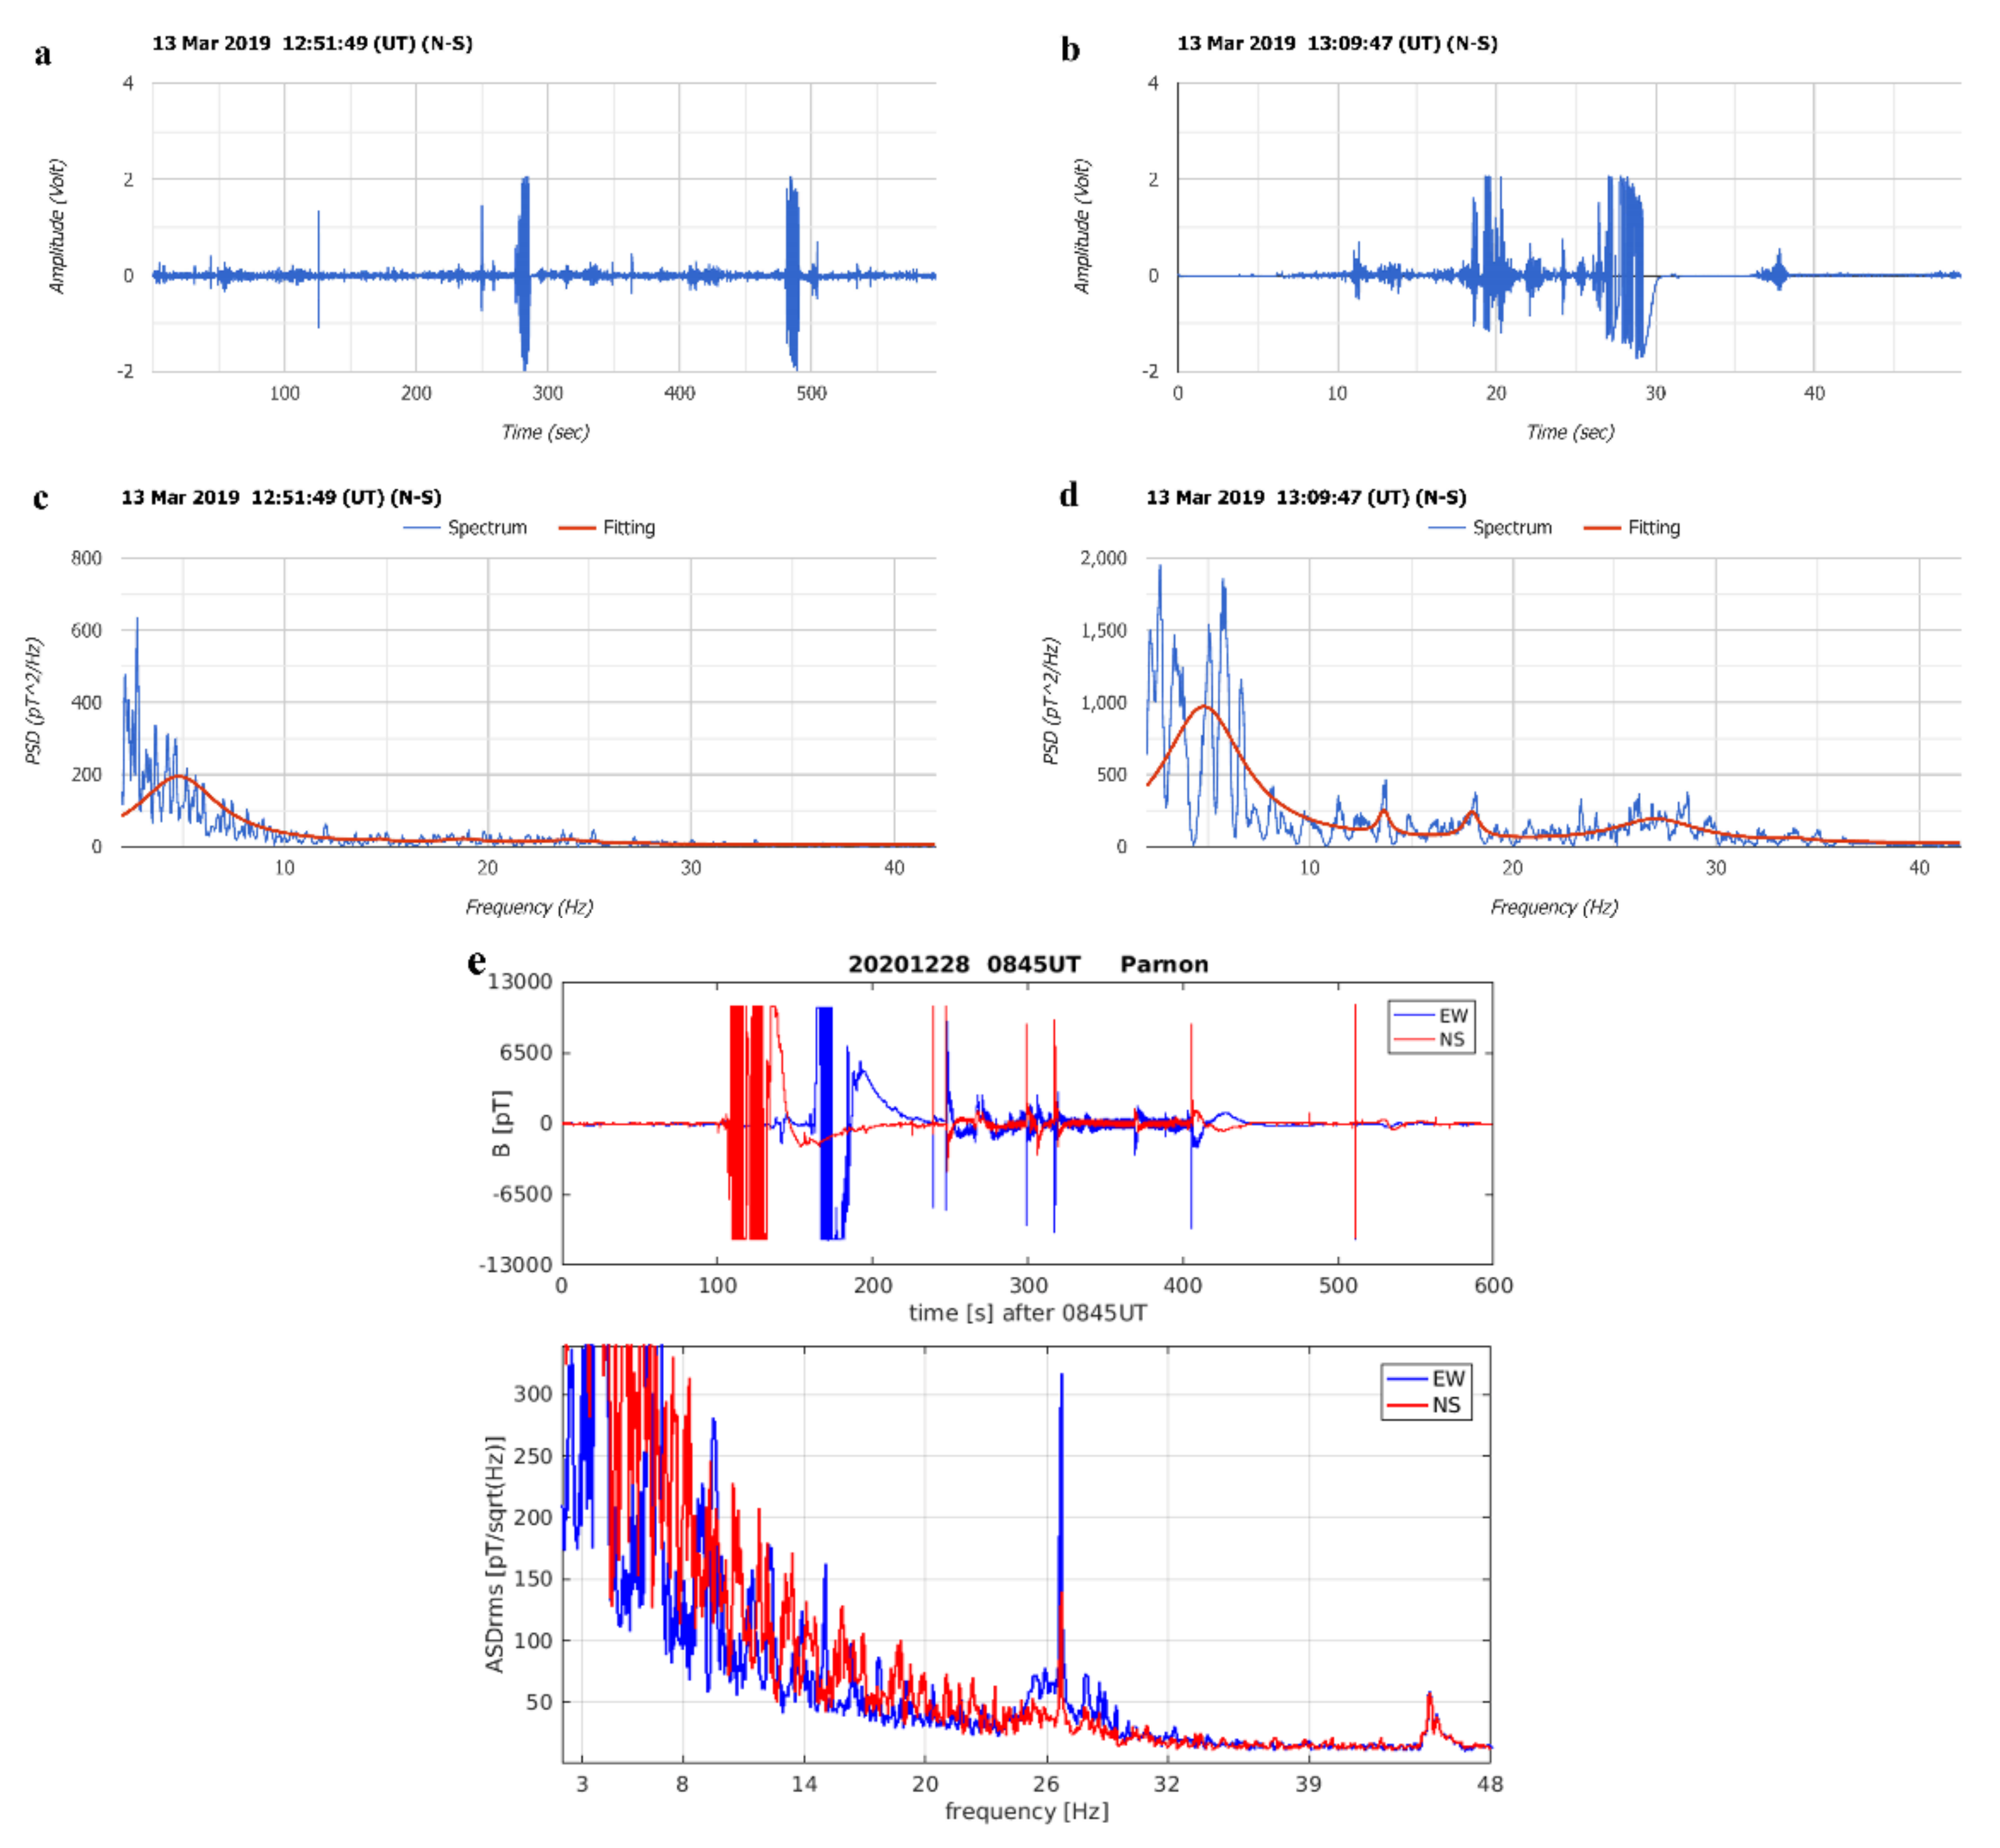
Figure 5 depicts signals enforced by artificial movement of the coils (vibration by hand) simulating ground movements. It is evident that these recordings present elements different from a typical PPS (Figure 4).

Figure 5.
(a,c) Two vibrations of the Greek coil by hand in the N-S and E-W directions (narrow stripes) and (b,d) two additional intensive vibrations clockwise and anti-clockwise by hand made twenty minutes later (right panel). In (e), vibrations of the Polish system coils are depicted.
The vibrations by hand appearing in Figure 5 simulated all the possible movements an EQ could force on the coils. However, the relevant spectra do not resemble a PPS spectrum like that shown in Figure 4. The principal PPS characteristic of the concentration of the spectrum power in the range of 20–25 Hz does not appear during these coil movements. These results indicate that the main doubt that PPSs could be caused by ground movements or other kind of electromagnetic noises should be excluded [39].
3. Observation and Evaluation of Possible Pre-Seismic ELF Perturbations
3.1. Cases Recorded by the NORTH Site
The locality of the coupling between PPS and EQ requires to separate observations in two groups each one for events around the North and South observation sites, respectively.
Table 1 and Table 2 contain EQ’s they occurred in the prerequisite distance (250 km) of the two observation sites during the periods the systems were active.

Table 1.
Identification of twelve earthquakes with magnitude ≥4.0 Richters that occurred in the broader area of north Greece from October 2016 to the end of 2017 within a distance of 250 km from NORTH.
Table 2.
Identification of sixteen earthquakes with magnitude ≥4.0 Richters that occurred in the broader area of south Greece from September 2020 to the end of 2021 within a distance of 250 km from SOUTH.
When the NORTH observational site was active (January 2016–March 2020), twelve (12) mid-magnitude EQs (4-5,5 R) were recorded within about 250 km around it. The main parameters of these EQs are recorded in Table 1. Slight differences were detected between the seismicity catalogs published by the ecmc-cmsc website https://www.emcs-cmsc.org (accessed on 10 December 2021) and the National Observatory of Athens (NOA) https://www.noa.gr/ (accessed on 10 December 2021). For seismicity in the Greek area, relevant parameters follow the National Observatory of Athens catalogues due to direct close observations available. The magnitudes given by ecsm-cmsc are presented in parentheses.
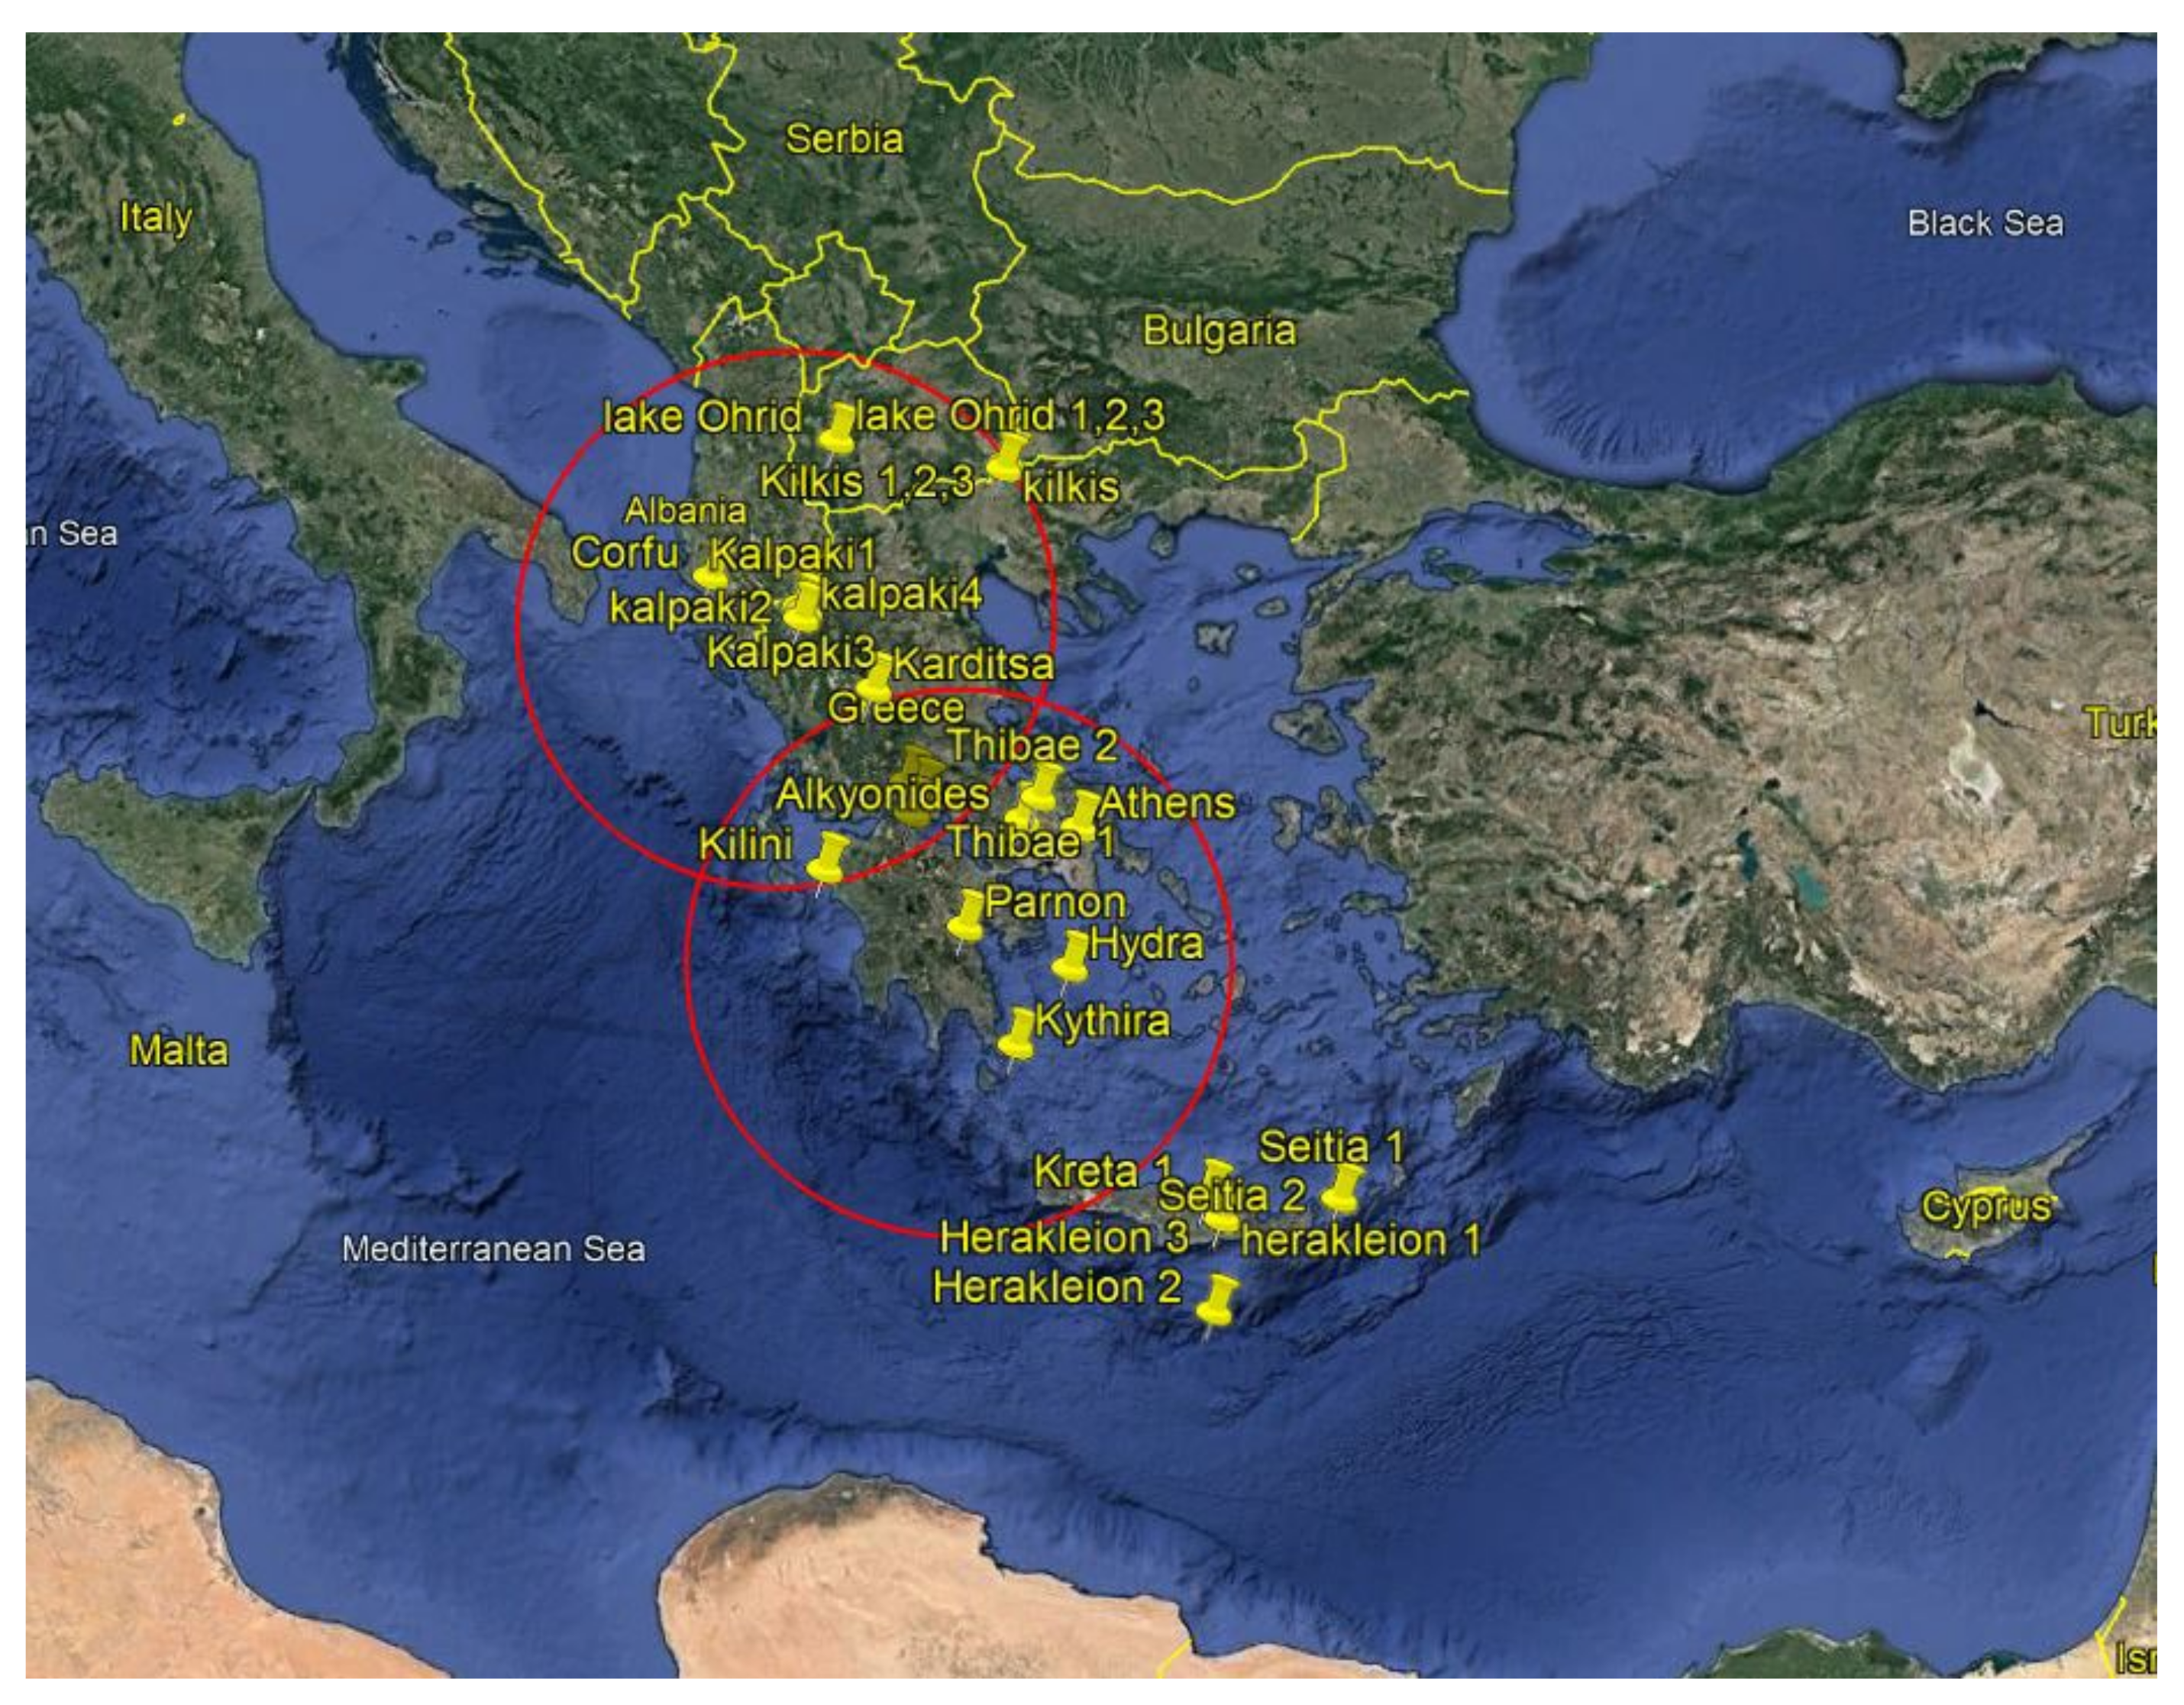
Figure 6 shows a map of the broader north and south Greek area, indicating the locations of the EQ occurrences mentioned in Table 1 and Table 2.

Figure 7 shows a case study which stimulated us to open this project, due to the vicinity of the event to our NORTH observational site (case 1 in Table 1). On the 15 October, 2016, at UT = 20:14:48, a strong surface (10 km deep) EQ = 5.4 R occured just 3.4 km away from our observational site.

Figure 7.
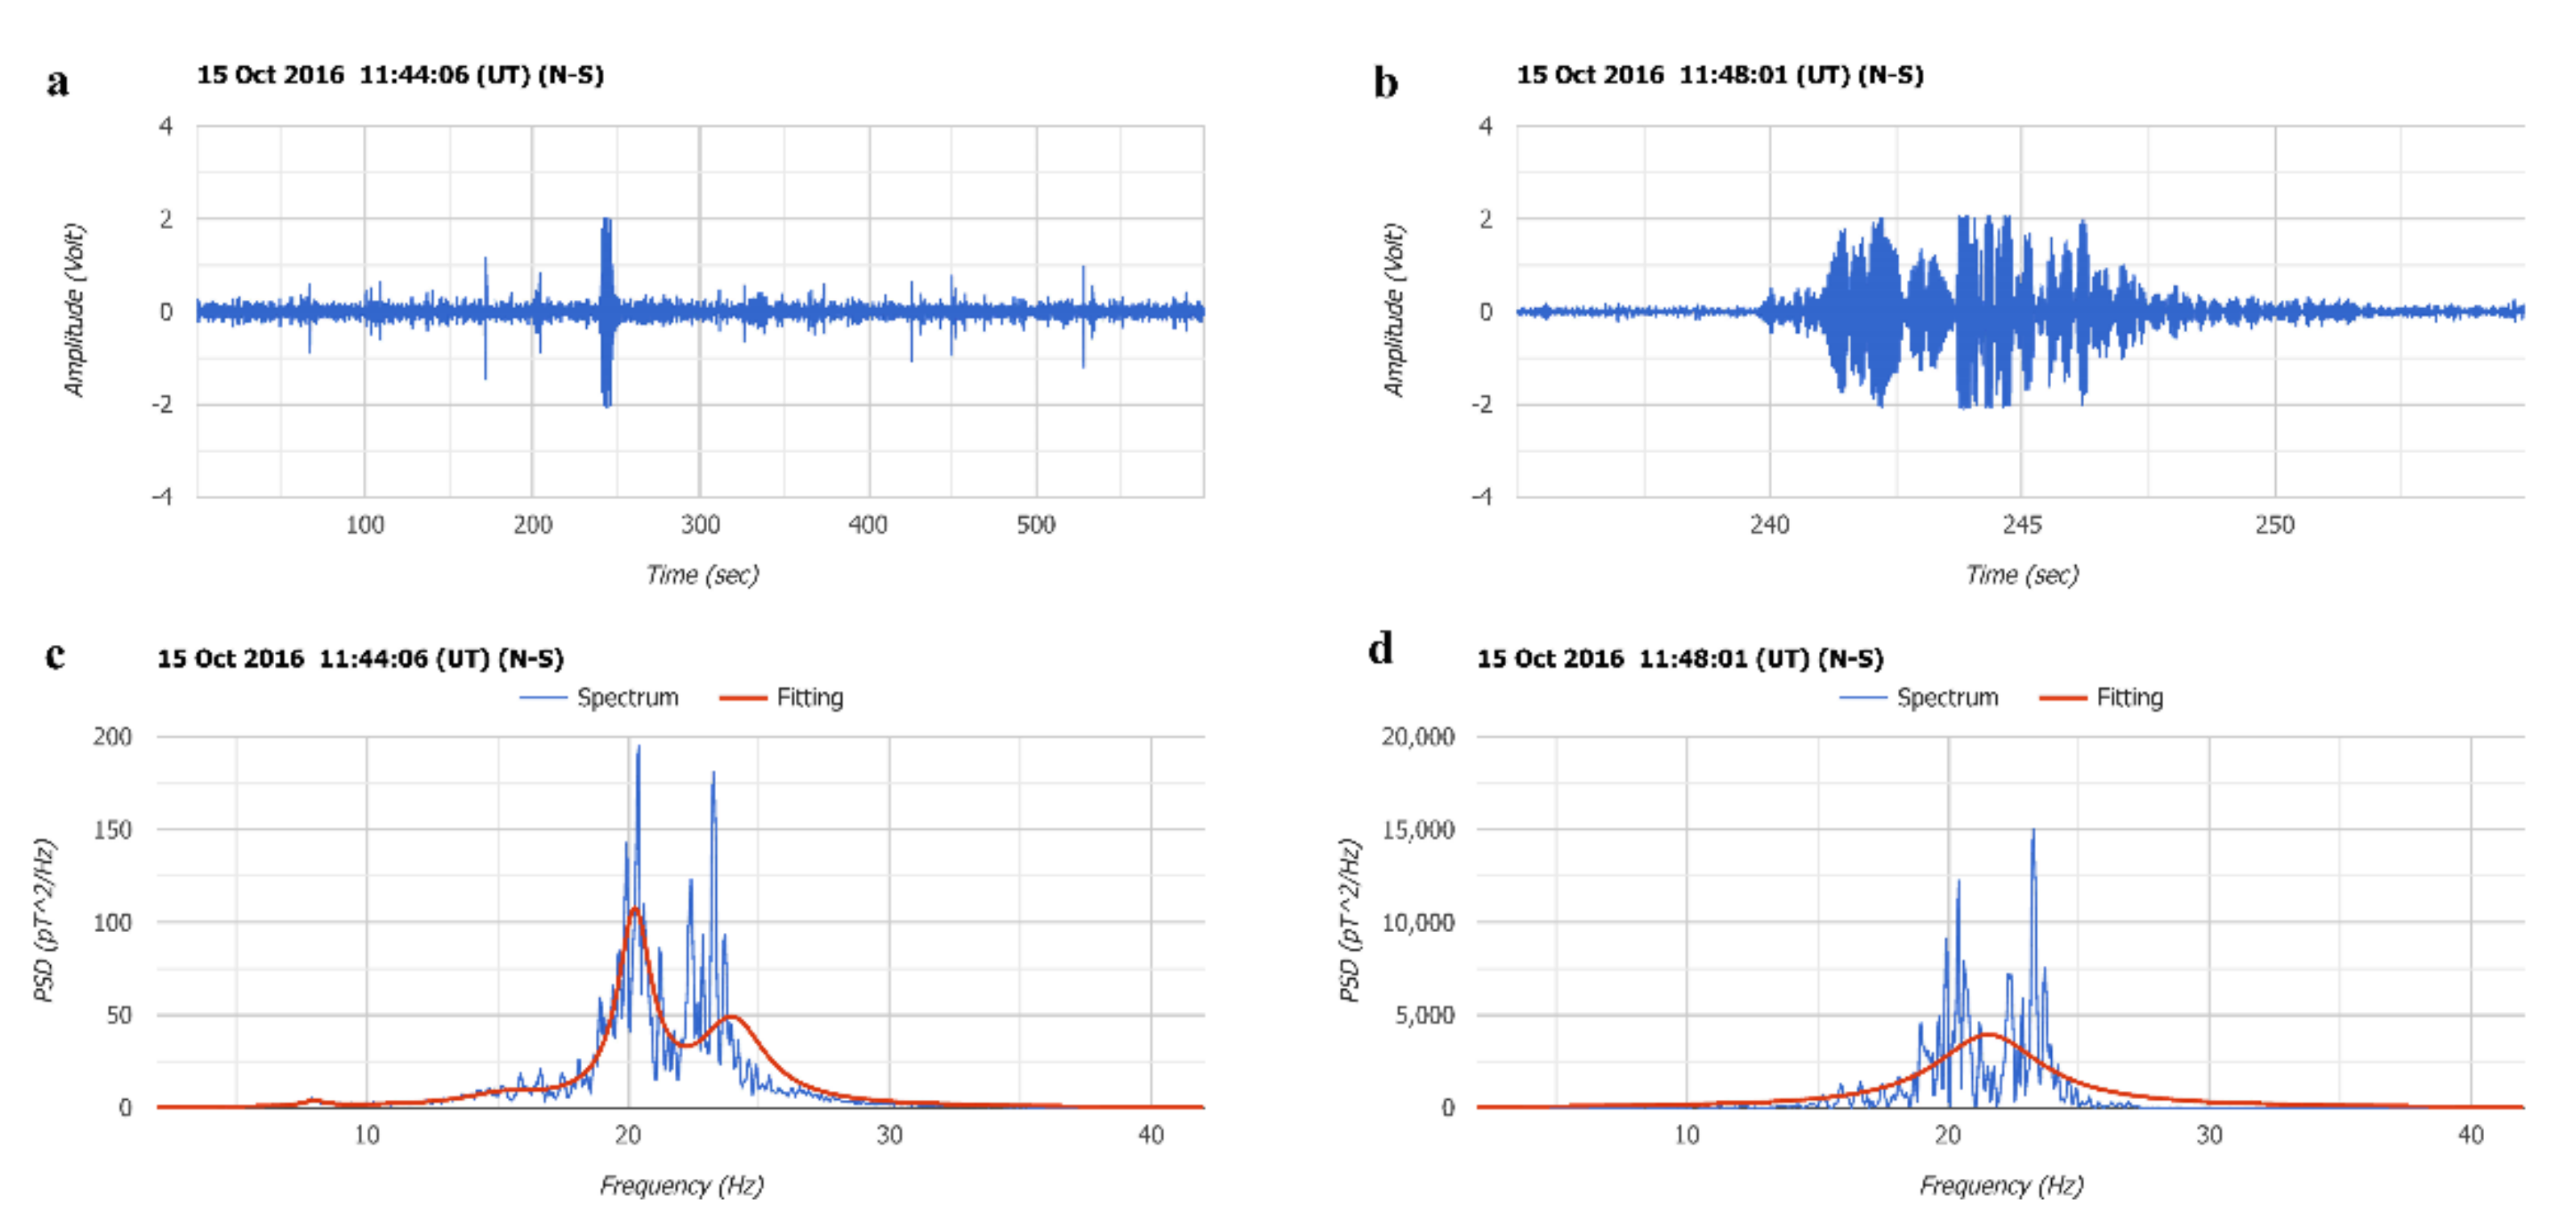
(a) Raw data and (c) the relevant spectrumof the last PPS received eight and a half hours (8.5 h) before the main EQ = 5.4 R shock (20:14:48 UT) at the Greek town Kalpaki (Event no. 1 of Table 1) are depicted. In (b,d) a magnified clip between 235–255 s, where the narrow stripe of the raw data appears is presented.
Although the EQ epicenter was almost under NORTH (3.4 km away), no movement elements, like those seen in Figure 5 appear. This was preliminary, but strong, evidence that PPSs have no relation with ground vibrations. As shown in the right panel of Figure 7, we attempted a simple signal analysis by magnifing the narrow data stripe in the left upper panel between 235–255 s. Details of this analysis indicate that the deviation of the spectra in Figure 7 from those of Figure 5 had not relation to coil vibrations from ground movements. Instead, the PPS shown in the left upper panel of Figure 7 was the reason for the spectra deviations between Figure 5 and Figure 7.
As shown in Figure 8, we attempted the application of a more sophisticated signal analysis like the Time-Frequency Transformation (TFT) method. There are two panels based on the Figure 7 left panel, where we applied a Short Time Fourier Transform (STFT).
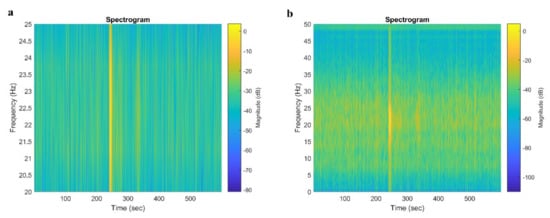
Figure 8.
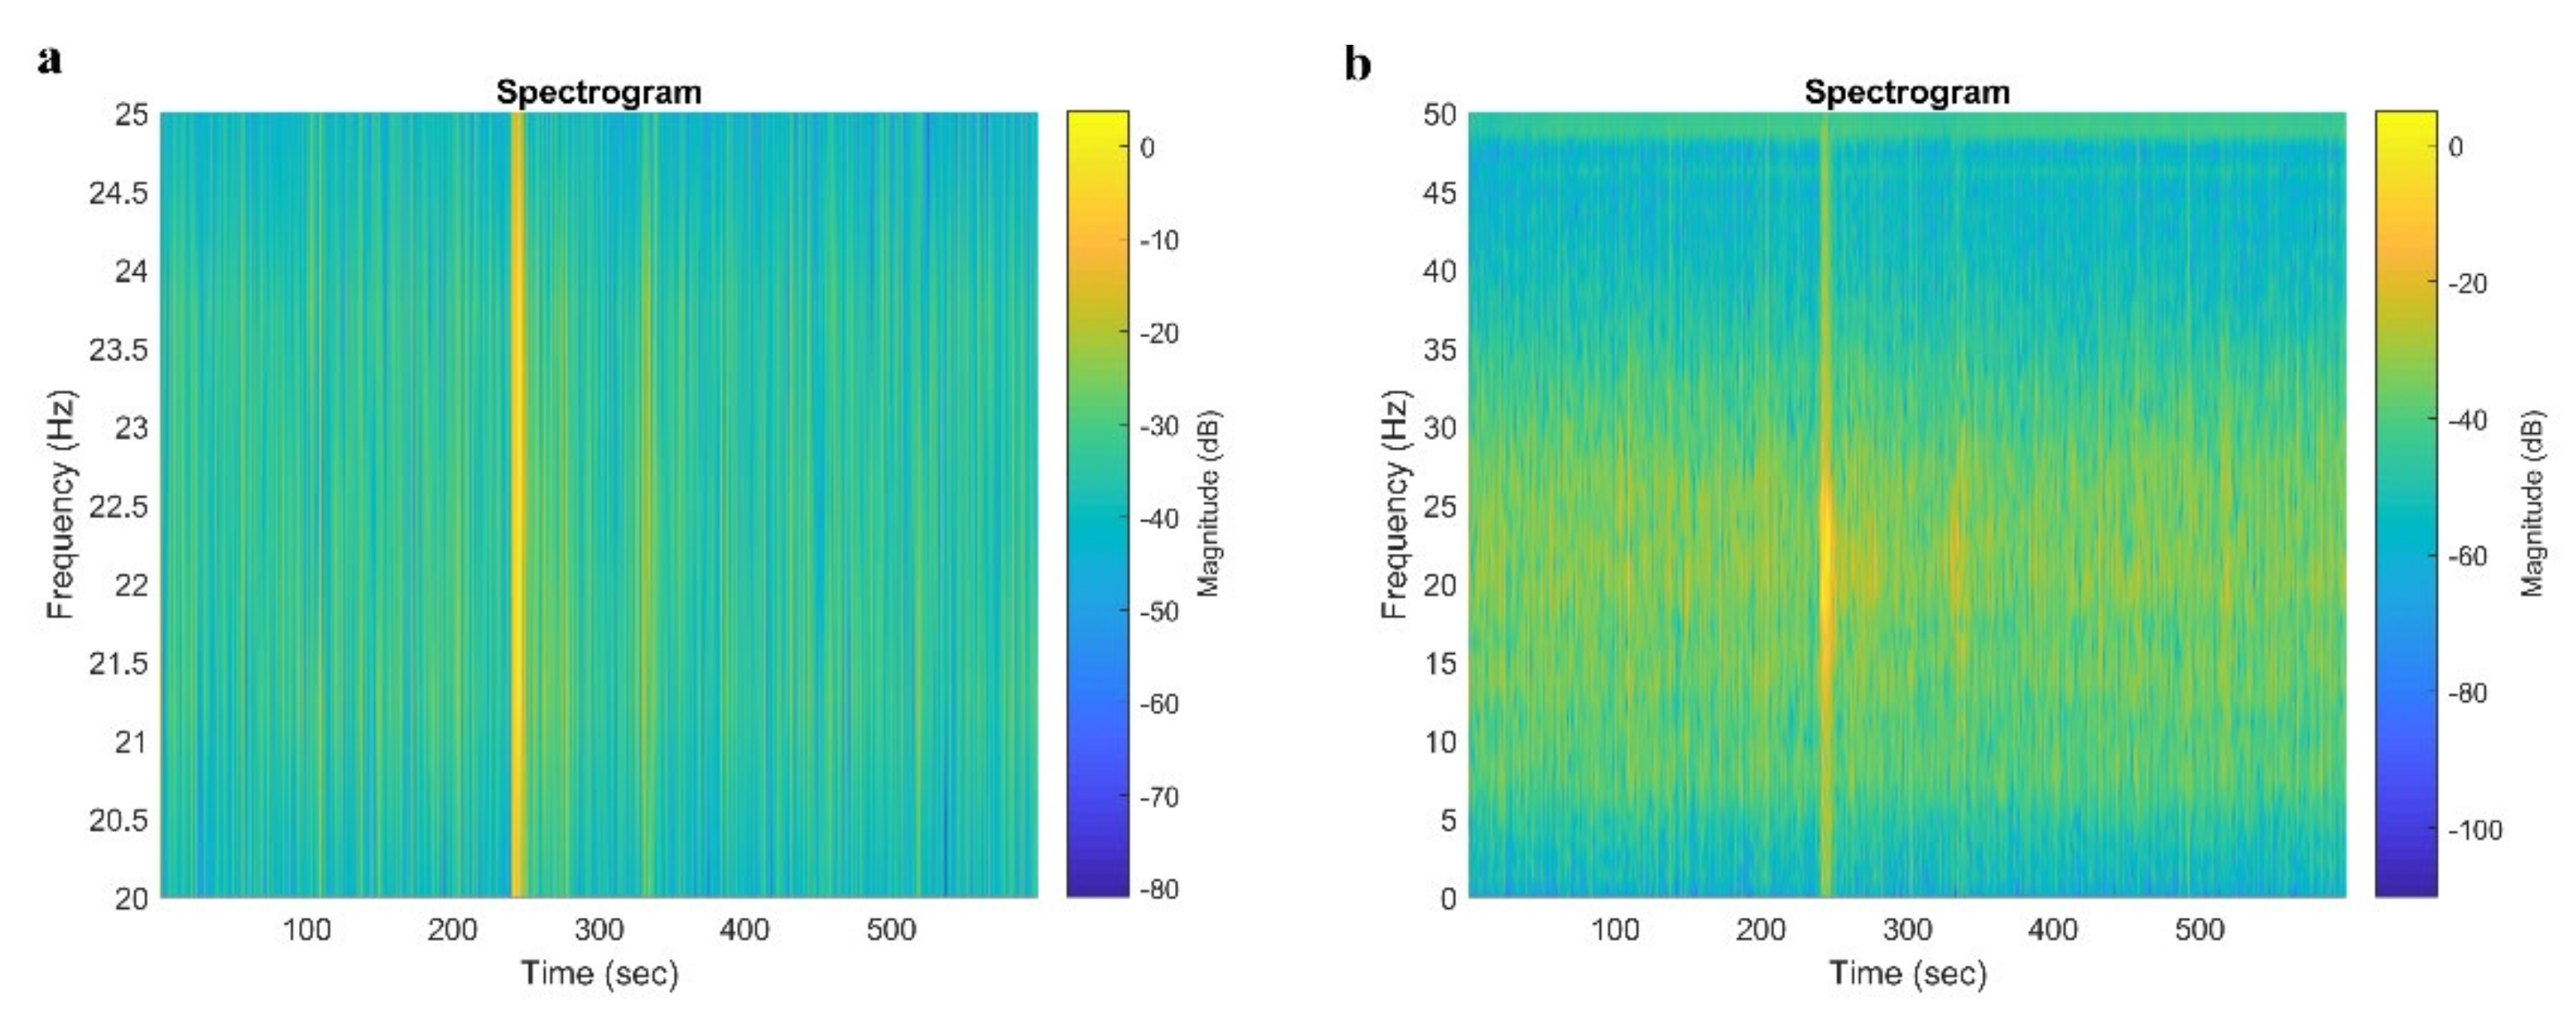
Two figures received by a STFT analysis of the signal of the Figure 7. In the (a) panel the analysis was restricted to the range of 20–25 Hz while in the (b) panel the analysis wasexpanded to the total range of 0–50 Hz.
From both panels of Figure 8, it is clear that a characteristic frequency range of 20–25 Hz was present at around 240 s.
Recordings taken some distance from the observational site EQs, which strengthen the argument of the independency of PPSs from ground vibrations or anthropogenic noises, are presented in the Figure 9.
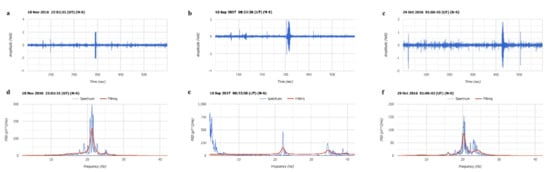
Figure 9.
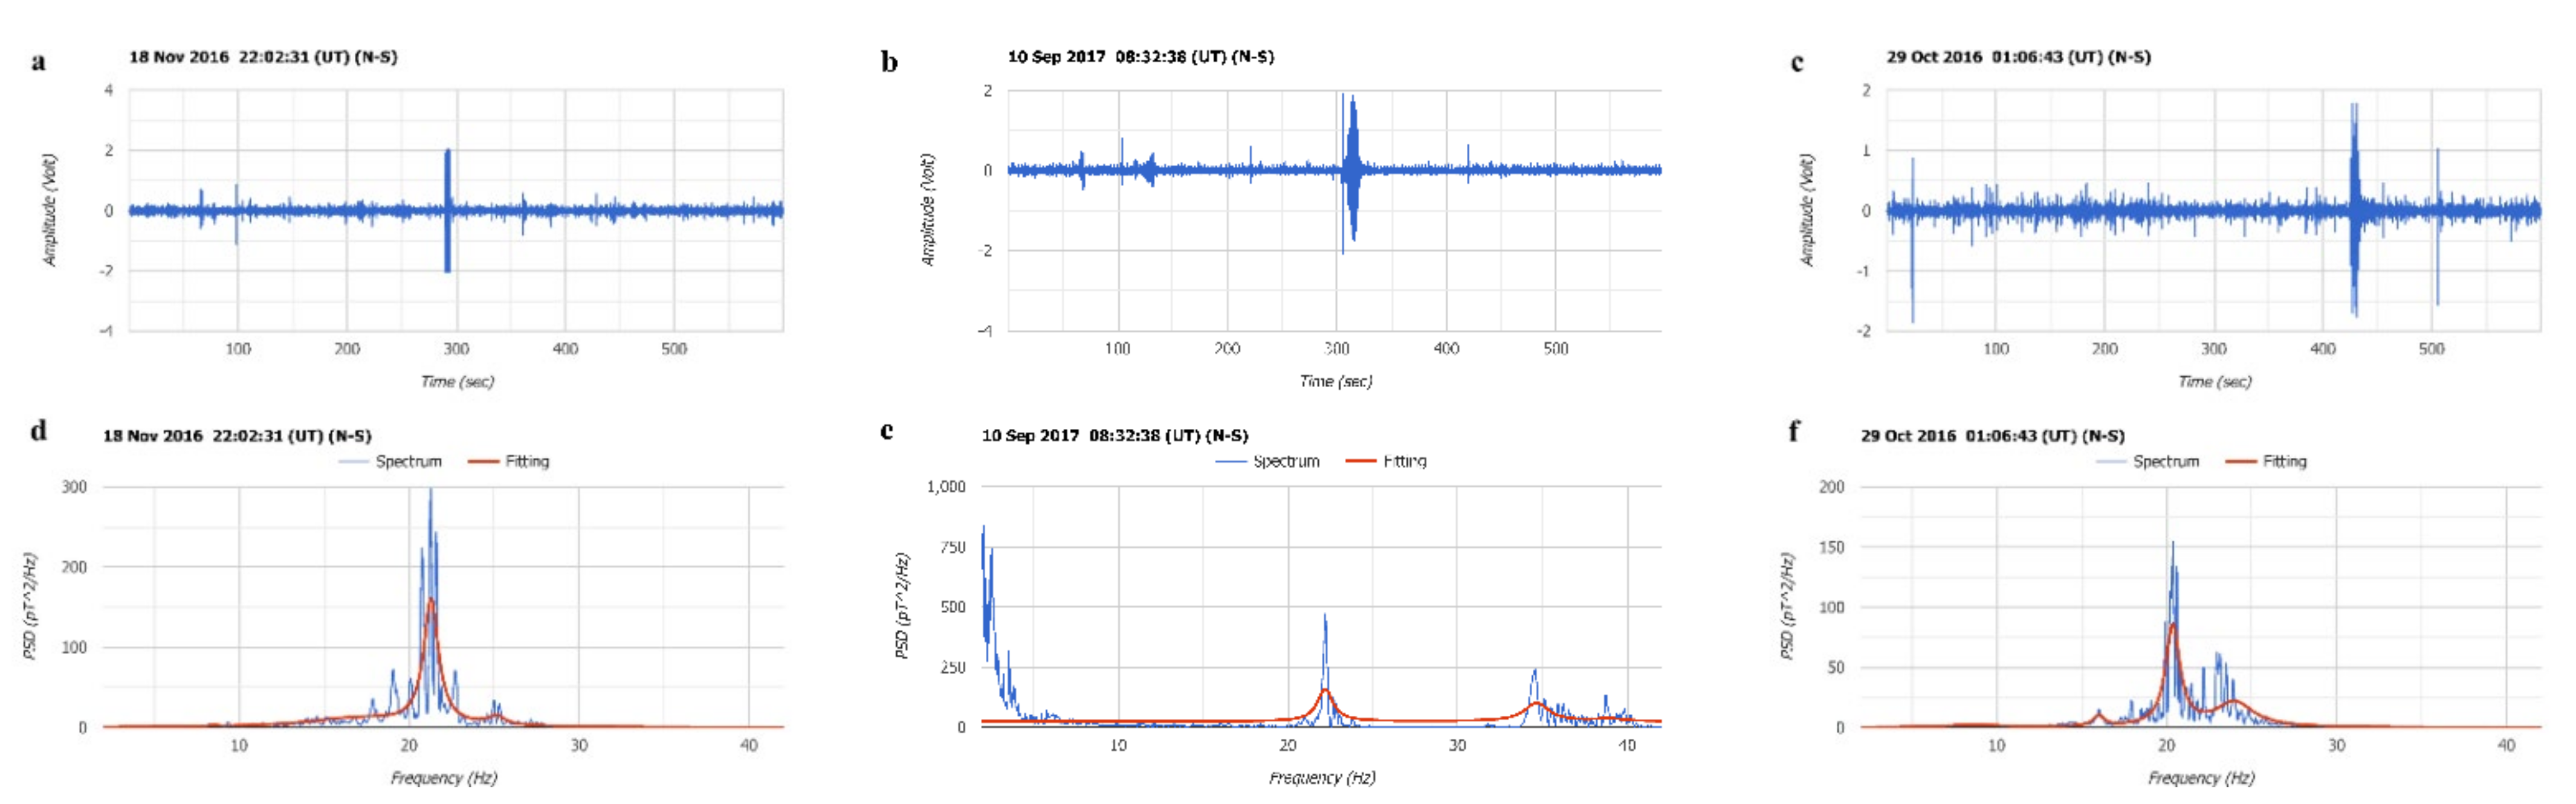
(a,d) the last PPSs received before the EQ = 4.9 R which occurred close to the town of Kilkis (case 8 of Table 1), (b,e) the EQ = 4.9 R near the Greek town of Karditsa (case no. 12 of Table 1) and in (c,f) the main EQ = 4.4 R which occurred at the Greek island Corfu (case no. 5 in Table 1).
In the first panel of Figure 9, the last PPS recorded before the 4.9 R EQ which occurred close to the town of Kilkis, located almost 218 km away from the observational site, is presented (case 8 of Table 1). In the middle panel, the last PPS before the EQ = 4.9 R which occurred near the town of Karditsa (case 12 of Table 1) is presented, and the third panel presents the last PPS before the EQ = 4.4 R which occurred in the island of Corfu (case no. 5 of Table 1). The distances of these cases from NORTH varied from 88 to 218 km, spacing which does not support the idea that PPSs may be caused by ground movements.
In Figure 10 we present a case from outside of Greek territory. This was a PPS recorded before a series of EQs 4.2R, 5.0 R and 4.2 R in intensity, which occurred on the 2, 3 and 7 July 2017, close to lake Ohrid in FYROM (North Macedonia), which is 161 km away from NORTH (cases no. 9–11 of Table 1). Successive EQs very close to each other create idendification problems which will be analysed in Section 4.

Figure 10.
PPS recorded before a series of three EQs in Lake Ohrid, 161 km north of Greece (cases 9, 10, 11 of Table 1).
3.2. Cases Recorded by the SOUTH Site
We proceed with the more recent cases of the period 2020–2021 (Table 2) which were recorded by both the Polish and the Greek systems installed in the forest shelter of mount Parnon. This table contains sixteen EQs stronger than 4.0 R, at a distance of a little more than 250 km from the site of SOUTH (Parnon). Most of the EQs of this sample had their epicenters in the sea close to the Euro–Asiatic trench, something which add some particularities in recording and interpreting signals. The main features of sea-located EQs is that PPSs appear several days before the EQs, while most of the EQs appear in series very close one to the other. The samples of the cases 3 to 7, where five EQs occurred within 30 days, or cases 9–12, where three EQs occurred in 40 days, were noted to have this feature. Finally, another interesting feature is that although the EQs occurred further that 250 km from the observational site, they were recorded by both systems at SOUTH (cases 7, 10, 11 of Table 2). Recording behavior for EQs recorded further than the empirical distance of 250 km is something which needs additional study.
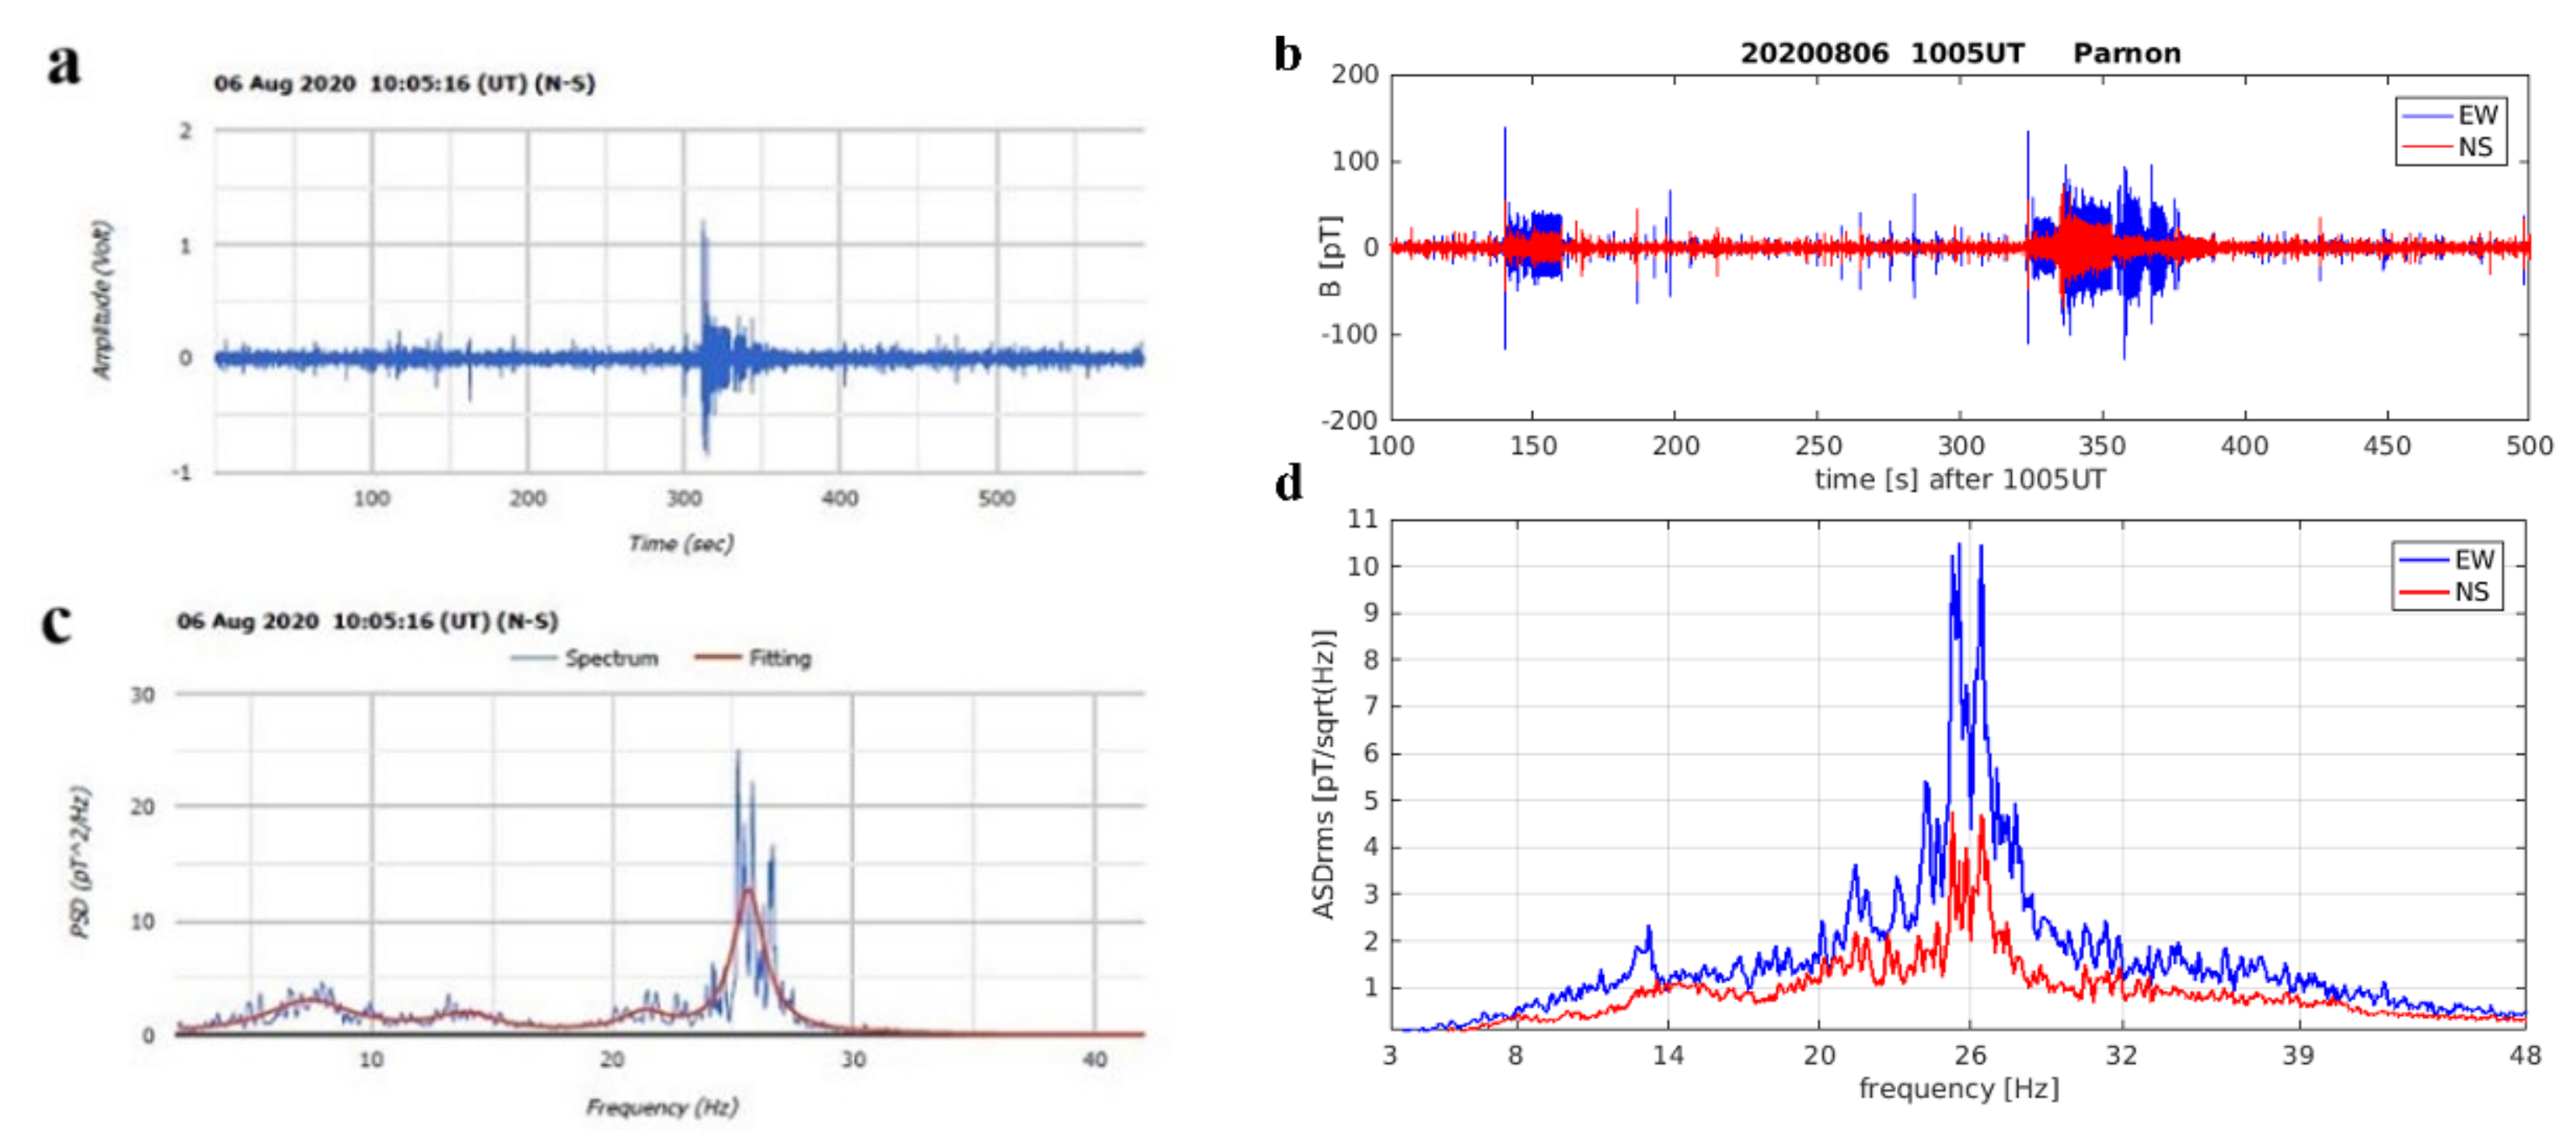
In Figure 11, PPSs recorded by the two systems, Greek and Polish, ten days before the EQ = 5.0 R which occurred in the sea area of the island of Hydra are presented (case 2 of Table 2). The clarity of the spectrum recorded by the Polish E–W coil (blue line) is noteworthy.

Figure 11.
Typical PPSs recorded by the Greek (a,c) and the Polish systems (b,d) ten days before an EQ of 5.0 R which occurred in the sea area of the island Hydra. Differences from the artificial vibrations of Figure 5 are evident.
In the Figure 12, two very characteristic PPSs are depicted. The reason is that a long period of seismicity with four main EQs within one month began (cases 03–07 of Table 2). The first EQ occurred in the area of the small but very seismogenic island of Alcyonides but very soon it was followed by a number of EQs in the whole area of South Greece.
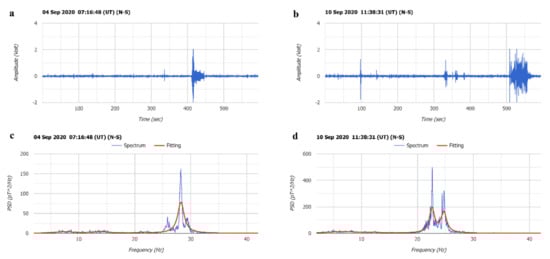
Figure 12.
(a,c) PPS recorded on the 4th of September, 2020 and (b,d) on the 10 September 2020, one day before the EQ 4.2 R which occur on the 11 September 2020 on the small island of Alkyonides,.
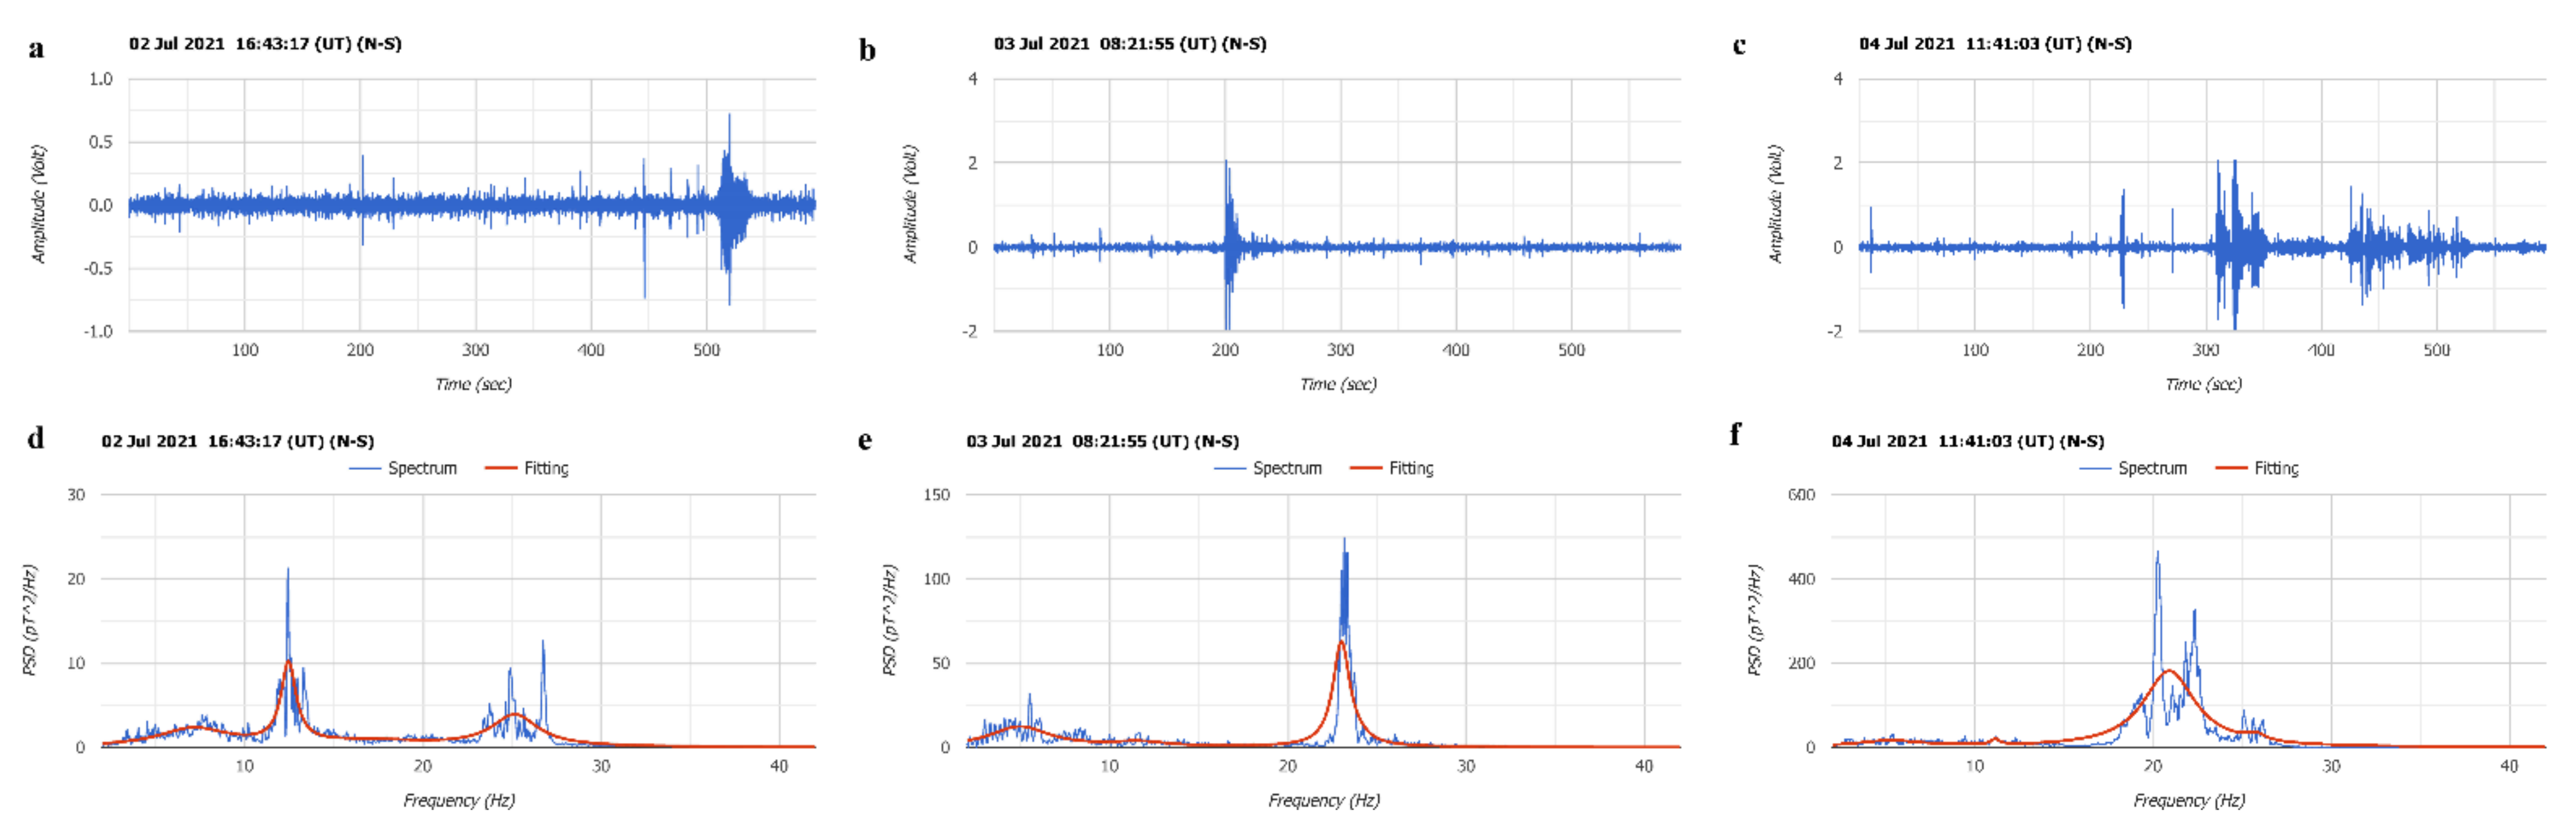
In Figure 13, three PPSs were recorded for three successive days before an EQ = 4.2 R which occurred in Heraklion of the island Kreta. This was the “flag” for the opening of a series of EQs that continued for the whole month of July 2021 in the South Greek area (cases 10–14 of Table 2). A large number of EQs 3–4.5 R occurred in the island of Kreta and the town of Thebes, north of Athens, from the beginning of July 2021 until the October of the same year.
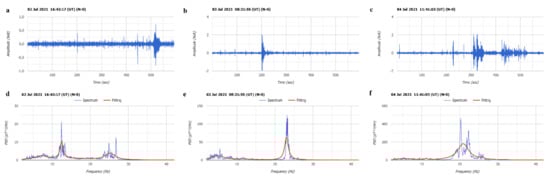
Figure 13.
PPSs recorded on (a,d) the 2, (b,e) 3 and (c,f) 4 July 2021 before the EQ = 4.2 R which occurred on the 5th of July in Heraklion, on the island of Creta.
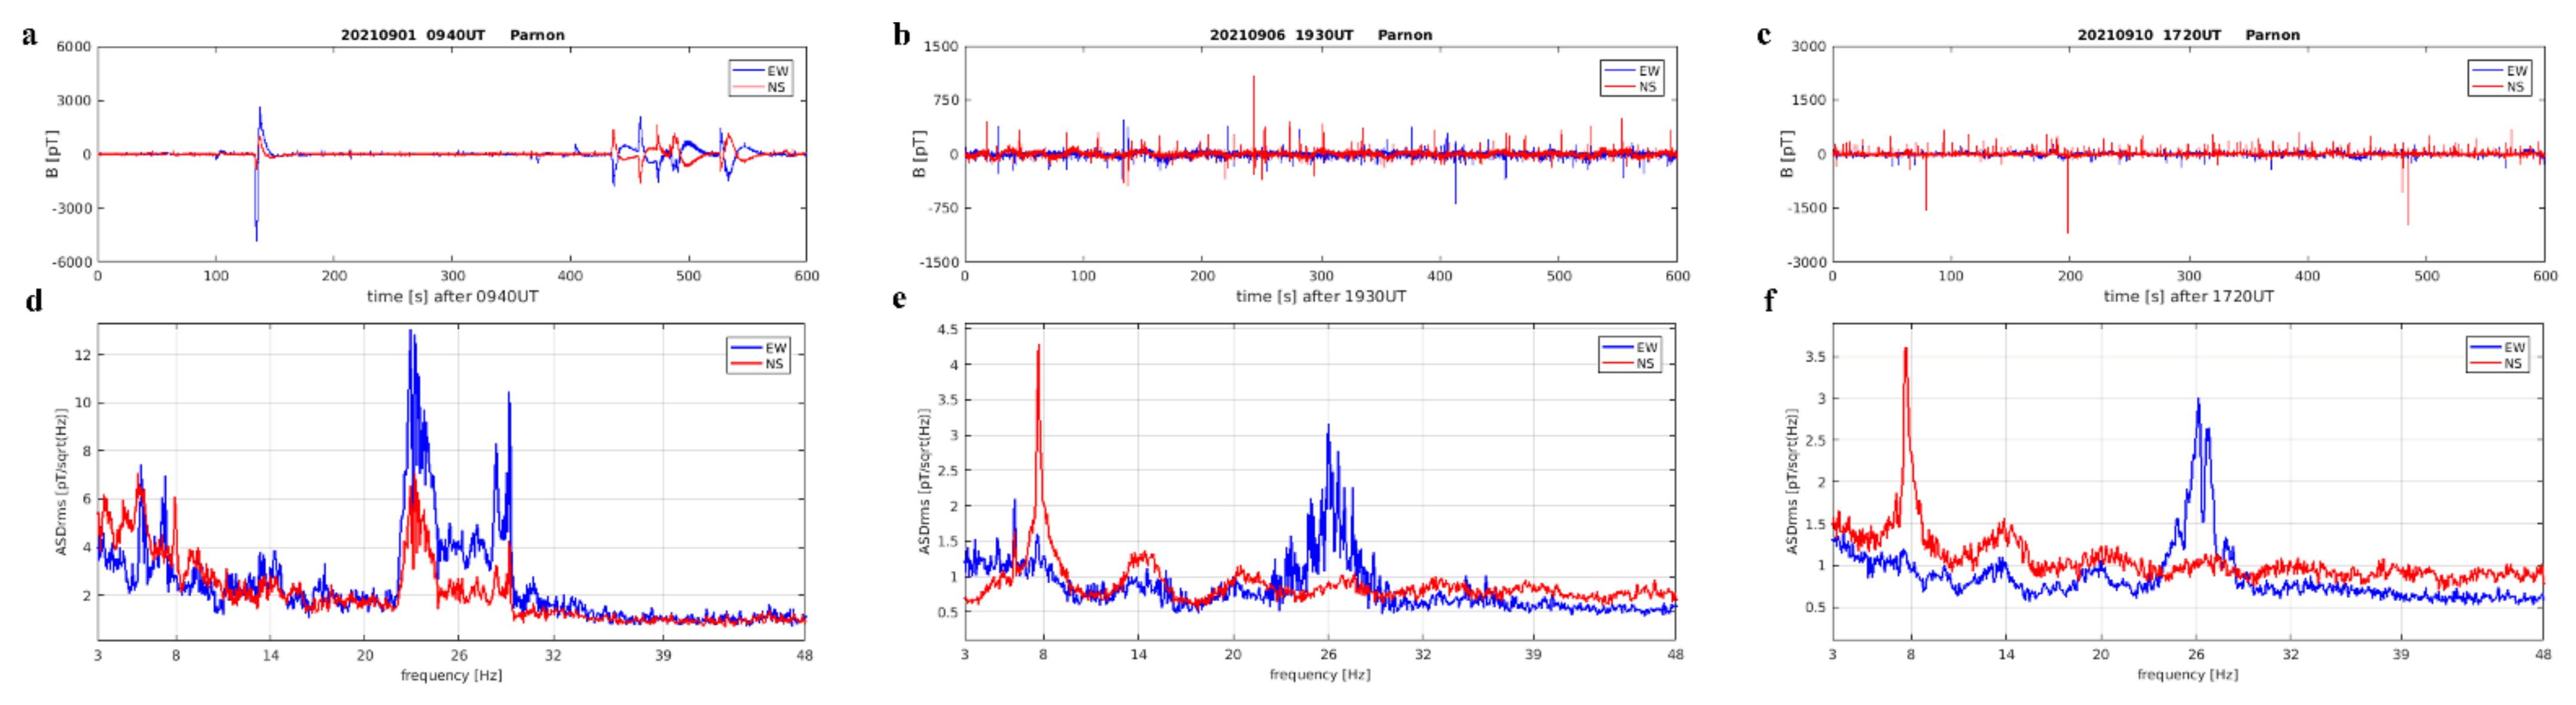
At the beginning of September 2021, the Greek system broke down, but the Polish system will fill the gap very well until the Greek instrument is repaired. In Figure 14 it can be seen that three very important PPSs occurred in the first ten days of September 2021, marking the last three EQs of Table 2. From the observational point of view, it is very interesting how the E–W coil, which is absent from the Greek system, contributed to the PPS recording.
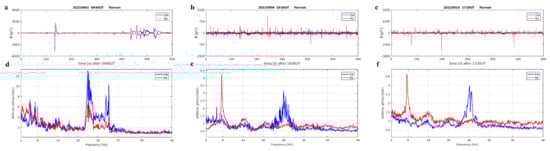
Figure 14.
Very interesting PPSs from the Polish system occurred in the first ten days of September 2021. (a) Time series, (d) Spectrum on 1 September 2021. (b) Time series (e) Spectrum on 6 September (c) Time series, (f) Spectrum on 10 September. PPS signals were clearly recorded by the E–W coil of the system (blue line).
4. Discussion
Several questions and doubts will be answered in this section. To start with, it is necessary to note that the PPSs appear always before the occurrence of an EQ which covers the specifications set in the Section 2. That is, a magnitude higher than 4 Richters and distance from the site of less than 250 km. The time of the PPS appearance varies from 10 days at the most to a few hours at the least before an EQ occurrence. However, a small number of “orphan” signals, independent from EQs, have been detected, which may reflect stochastic geomagnetic changes. In any case, they were very few and they did not affect the tendency of PPSs to match to seismicity.
Another question which should be answered is the difference between PPSs coming from territorial and seaborn EQs. PPSs related to territorial EQs were clear when they appeared close to the time of occurrence of the main shock. Seaborn EQs were related to less clear PPSs which occurred several days before the main shock, and EQs further than 250 km away were detected by both systems in SOUTH. This is a subject which needs additional research.
Something which makes ambiguous the use of the PPSs as seismic precursors is the frequency of the EQ occurrences in Greek territory. PPSs appear mainly before the first shock of an EQ, but sometimes they follow the metaseismic sequence which occurs after any EQ. In a case where several EQs occur in a short period in various areas within the distance of the 250 km limit, something very common in the Greek territory, it is not possible to identify which EQ matches which PPS. If PPSs were studied in a country where EQs are relatively rare events, like central Europe, identification would be much easier. A network of observation sites which could apply triangulation could perhaps locate the epicenter of a certain EQ and then match it to the relevant PPSs. This is not possible in densely populated countries because SR observational sites should have very strict specifications, including isolation, safety, far from electromagnetic inflictions, etc., which re difficult to achieve in a densely inhabited country. A circle of 250 km radius is a very small space in which to place at least three sites which may meet these strict criteria.
Finally, taking in mind this method’s advantages and disadvantages, we could say that PPSs detected in SR recordings before EQs are a very hopeful way of local EQs prediction, but not enough. Several additional observations must also be completed, which, together, could contribute to significant decisions about a forthcoming seismic activity. Continuous real time data from Radon measurements, atmospheric conductivity, and ionospheric observations by a dense network of sites is necessary to approach a method for making realistic decisions about the possibility of an EQ stronger than 4.0 Richters to occur in a certain place.
As concerns our case, the experience from the Polish system hosted in our SOUTH site was that SR measurements should be applied in two directions, N–S, E–W and perhaps also OZ, in geomagnetic coordinates. In cases where the Polish system was involved, PPSs were recorded very clearly in the E-W coil. A perpendicular antenna measuring the electric component of SR signal is also necessary.
An observation site should contain two or three coils in the N–S, E–W and perhaps OZ geomagnetic directions, a vertical antenna for measuring the electric component of the SR range, and a meteorological mast or cage for estimating weather conditions and to access radon, atmospheric conductivity and ionospheric data within an area 250 km.
Real time data transfer should be also available. Planning a complete ELF/SR station sounds easy, but accumulation of instruments, even at some distance one from the other, most of which need supply from the electric network, introduce a number of unsurpassed difficulties.
We are not very optimistic that such projects could be supported by governmental resources because EQs prediction studies have low priority at the public organizations planning research activities. Fortunately, private companies and foundations still try to bridge the financial gap in this direction.
5. Conclusions
After five years of SR observations, in two different sites of the Greek area, by three different systems, a long time series of data and a long record of EQs that occurred during the period the sites were functional, we came to some preliminary conclusions. The main subject of our study was the relation of SR perturbations with forthcoming seismic activity, something which is very important for a very seismogenic country like Greece. The initial conclusion is that these observations are very hopeful but not enough to contribute significantly to the very important problem of confident EQ prediction. It is very clear that SR observations should be improved while additional observations should contribute to the final decision of an EQ prediction. In addition, a confident mechanism of the connection from the ground to the ionosphere should be established.
Magnetic SR measurements should be made in three directions, and the electric component should be also recorded. At the same time, parallel radon and ionospheric observations should complete the main SR dataset before a determination of an upcoming EQ should be announced.
In a few words, SR observations in the direction of EQ prediction are a useful component of the complicated mechanism of the EQ study and forecast, but this method needs improvement and completion.
Author Contributions
Conceptualization, V.T. and I.C.; methodology, J.M. and I.C.; software, G.T. and J.M.; validation, I.C., G.T. and V.T.; investigation, V.C.; writing—original draft preparation, V.T.; writing—review and editing, V.T. and V.C.; supervision, C.R.; project administration, C.R. All authors have read and agreed to the published version of the manuscript.
Funding
This research received no external funding.
Data Availability Statement
The data that support the findings of this study are available from the corresponding author, [V.T.], upon reasonable request.
Acknowledgments
We would like to thank the forest service of the Lakonia prefecture in the town of Sparta, especially the director G. Zakkas and the forest personnel S. Petrakos, K. Samartzis, N. Sourlis, and K. Tsagaroulis for their valuable contribution in the establishment and the service of our South Observation Site near the village of Vamvakou. We would also like to thank the residents and the ecclesiastical committee of the town of Doliana in Northern Greece, especially the retired teacher and principal of the local school G. Skordos for offering the necessary accommodation needed for the establishment of our North Observation Site. Finally, we would like to address a warm thank you to the Mariolopoulos–Kanaginis Foundation for Environmental Sciences for initial financial support as well as to the Research Committee of the Academy of Athens for supplementary support.
Conflicts of Interest
The authors declare no conflict of interest.
References
- Hayakawa, M. Earthquake Precursor Studies in Japan. In Pre-Earthquake Processes: A Multidisciplinary Approach to Earthquake Prediction Studies; American Geophysical Union: Washinton, DC, USA, 2018; pp. 7–18. [Google Scholar]
- Hayakawa, M.; Tomakazu, A.; Rozhnoi, A.; Solovieva, M. Very low to Low Frequency Sounding of Ionospheric Perturbations and Possible Association with Earthquakes. In Pre-Earthquake Processes: A Multidisciplinary Approach to Earthquake Prediction Studies; Ouzounov, D., Pulinets, S., Hattori, K., Taylor, P., Eds.; American Geophysical Union: Washinton, DC, USA, 2018; pp. 277–304. [Google Scholar]
- Pulinets, S.; Boyarsschuc, K. Ionospheric Precursors of Earthquakes; Springer Science & Business Media: Berlin/Heidelberg, Germany, 2004; p. 15. [Google Scholar]
- Hayakawa, M.; Molchanov, O.A. Seismo-Electromagnetics: Lithospere-Atmosphere-Ionosphere Coupling; Terra Scientific Publishing: Tokyo, Japan, 2002. [Google Scholar]
- Hayakawa, M.; Molchanov, O.A. Seismo-Electromagnetics: As a New Field of Radiophysics: Electromagnetic Phenomena Associated with Earthquakes. URSI Radio Sci. Bull. 2007, 2007, 8–17. [Google Scholar]
- Hayakawa, M.; Hobara, Y. Current status of electromagnetics for short -term earthquake prediction. Geomat. Nat. Hazards Risk 2010, 1, 115–155. [Google Scholar] [CrossRef]
- Schvets, A.V.; Hayakawa, M.; Molchanov, O.A.; Ando, Y. A study of ionospheric response to regional seismic activity by VLF radio sounding. Phys. Chem. Earth 2004, 29, 627–637. [Google Scholar] [CrossRef]
- Schvets, A.V.; Hayakawa, M.; Meakana, S. Results of subionospheric radio LF monitoring prior to the Tokachi (M = 8, Hokkaido, 25 September 2003 earthquake. Nat. Hazards Earth Syst. Sci. 2004, 4, 647–653. [Google Scholar] [CrossRef] [Green Version]
- Christofilakis, V.; Tatsis, G.; Votis, G.; Contopoulos, I.; Repapis, C.; Tritakis, V. Significant ELF perturbations in the Schumann Resonance band before and during a shallow mid-magnitude seismic activity in the Greek area (Kalpaki). J. Atmos. Sol. Terr. Phys. 2019, 182, 138–146. [Google Scholar] [CrossRef]
- Florios, K.; Contopoulos, I.; Christofilakis, V.; Tatsis, G.; Chronopoulos, S.; Repapis, C.; Tritakis, V. Pre-seismic Electromagnetic Perturbations in Two Earthquakes in Northern Greece. Pure App. Geophys. 2020, 177, 787–799. [Google Scholar] [CrossRef]
- Florios, K.; Contopoulos, I.; Tatsis, G.; Christofilakis, V.; Chronopoulos, S.; Repapis, C.; Tritakis, V. Possible Earthquake Forecasting in a narrow Space-Time-Magnitude Window. Earth Sci. Inform. 2021, 14, 349–364. [Google Scholar] [CrossRef]
- Oikonomou, C.; Haralambous, H.; Pulinets, S.; Khadka, A.; Shukra, R.; Paudel, R.; Barta, V.; Muslim, B.; Kourtidis, K.; Karagioras, A.; et al. Investigation of Pre-Earthquake Ionospheric and Atmospheric Disturbances for Three Large Earthquakes in Mexico. Geosciences 2021, 11, 16. [Google Scholar] [CrossRef]
- Love, J.J.; Thomas, N.J. Insignificant solar-terrestrial triggering of earthquakes. Geophys. Res. Lett. 2013, 40, 1165–1170. [Google Scholar] [CrossRef]
- Tehseen, R.; Farooq, M.; Abid, A. Earthquake Prediction Using Expert Systems: A Systematic Mapping Study. Sustainability 2020, 12, 2420. [Google Scholar] [CrossRef] [Green Version]
- Karamanos, K.; Perantzakis, A.; Kapiris, P.; Nikolopoulos, S.; Kopanas, J.; Eftaxias, K. Extractihg preseismic electromagnetic, signatures in terms of symbolic dynamics. Nonlinear Processes Geophys. 2005, 12, 835–848. [Google Scholar] [CrossRef]
- Karamanos, K.; Dakopoulos, D.; Aloupis, K.; Peratzakis, A.; Athanasopoulou, S.; Nikolopoulos, S.; Kapiris, P.; Eftaxias, K. Study of pre-seismic Electromagnetic signals in terms of complexity. Phys. Rev. 2006, 74, 016104. [Google Scholar] [CrossRef]
- Mahdavi, A.; Roshandel, A.; Kahoo, M.R.; Monfared, M.S. Application of the local maximum synchrosqueezing transform for seismic data. Dig. Signal Process. 2021, 110. [Google Scholar] [CrossRef]
- Davis, K.; Baker, D.M. Ionospheric effects observed around the time of the Alaskan earthquake of March 28, 1964. J. Geophys. Res. 1965, 70, 2251–2253. [Google Scholar] [CrossRef]
- Tsugawa, T.; Saito, A.; Otsuka, Y.; Nishioka, M.; Maruyama, T.; Kato, H.; Nagatsuma, T.; Murata, K.T. Ionospheric disturbances detected by GPS total electron content observation after the 2011 off the Pacific coast of Tohoku Earthquqke. Earth Planets Space 2011, 63, 875–887. [Google Scholar] [CrossRef] [Green Version]
- Namgaladge, A.; Karpov, M.; Knyazeva, M. Seismogenic disturbances of the ionosphere during high geomagnetic activity. Atmosphere 2019, 10, 359. [Google Scholar] [CrossRef] [Green Version]
- Harrison, G.R.; Aplin, L.K.; Rycroft, J.M. Atmospheric electricity coupling between earthquake regions and the ionosphere. J. Atmos. Sol. Terr. Phys. 2010, 72, 376–381. [Google Scholar] [CrossRef] [Green Version]
- Walker, S.N.; Kadirkamanathan, V.; Pokhotelov, O.A. Changes in the ultra-low frequency wave field during the precursor phase to the Sichuan earthquake: DEMETER observations. Ann. Geophys. 2013, 31, 1597–1603. [Google Scholar] [CrossRef] [Green Version]
- Schumann, W.O. On the free oscillations of a conducting sphere which is surrounded by an air layer and an ionosphere shell. Z. Nat. 1952, 7, 149–154. (In German) [Google Scholar]
- Balser, M.; Wagner, C. Observations of Earth–Ionosphere Cavity Resonances. Nature 1960, 188, 638–641. [Google Scholar] [CrossRef]
- Balser, M.; Wagner, C.A. Diurnal power variations of the Earth-ionosphere cavity modes and their relationship to worldwide thunderstorm activity. J. Geophys. Res. 1962, 67, 619–625. [Google Scholar] [CrossRef]
- Galejs, J. Schumann Resonances. Radio Sci. J. Res. 1965, 69, 1043. [Google Scholar] [CrossRef]
- Hayakawa, M.; Ohta, K.; Sorokin, V.M.; Yaschenko, J.; Izutsu, J.; Hobara, Y.; Nickolaenko, A.P. Interpretation in terms of gyroscopic waves of Schumann-resonce -like line emissions observed at Nakatsugawa in possible association with nearby Japanese earthquakes. J. Atmos. Sol. Terr. Phys. 2010, 72, 1292–1298. [Google Scholar] [CrossRef]
- Sorokin, V.M.; Hayakawa, M. On the generation of narrow -banded ULF/ELF pulsations in the lower ionospheric contucting layer. J. Geophys. Res. 2008, 113, A06306. [Google Scholar] [CrossRef] [Green Version]
- Nickolaenko, P.A.; Galuk, P.Y.; Hayakawa, M. The effect of a compact ionosphere disturbance over the earthquake: A focus on Schumann resonance. Int. J. Appl. Sci. 2018, 5, 11–39. [Google Scholar] [CrossRef]
- Schekotov, A.; Chebrov, D.; Hayakawa, M.; Belyaev, G.; Berseneva, N. Short-term earthquake prediction in Kamchatka using low-frequency magnetic fields. Nat. Hazards 2020, 100, 735–755. [Google Scholar] [CrossRef]
- Tatsis, G.; Votis, C.; Christofilakis, V.; Kostarakis, P.; Tritakis, V.; Repapis, C. A prototype data acquisition and processing system for Schumann resonance measurements. J. Atmos. Sol. Terr. Phys. 2015, 135, 152–160. [Google Scholar] [CrossRef] [Green Version]
- Tatsis, G.; Votis, C.; Christofilakis, V.; Kostarakis, P.; Tritakis, V.; Repapis, C.; Kalavrezos, P. Preliminary Measurements of Schumann’s Resonances (SR) in the Greek. J. Eng. Sci. Technol. Rev. 2016, 9, 61–64. [Google Scholar] [CrossRef]
- Pulinets, S.; Ouzounov, D. Intergeospheres Interaction as a Source of Earthquake Precursor’s Generation; EMSEV International Workshop: Potenza, Italy, 2018; pp. 17–21. [Google Scholar]
- Tatsis, G.; Christofilakis, V.; Chronopoulos, S.K.; Kostarakis, P.; Nistazakis, H.E.; Repapis, C.; Tritakis, V. Design and Implementation of a Test Fixture for ELF Schumann Resonance Magnetic Antenna Receiver and Magnetic Permeability Measurements. Electronics 2020, 9, 171. [Google Scholar] [CrossRef] [Green Version]
- Tatsis, G.; Christofilakis, V.; Chronopoulos, S.; Baldoumas, K.; Sakkas, G.; Paschalidou, A.; Kassomenos, P.; Petrou, I.; Kostarakis, P.; Repapis, C.; et al. Study of the variations in the Schumann resonances parameters measured in a Southern Mediterranean environment. Sci. Total Environ. 2020, 715, 136926. [Google Scholar] [CrossRef]
- Votis, C.I.; Tatsis, G.; Christofilakis, V.; Chronopoulos, S.K.; Kostarakis, P.; Tritakis, V.; Repapis, C. A new portable ELF Schumann resonance receiver: Design and detailed analysis of the antenna and the analog front-end. J. Wirel. Com. Netw. 2018, 2018, 155. [Google Scholar] [CrossRef] [Green Version]
- Mlynarczyk, J.; Popek, M.; Kulak, A.; Klucjasz, S.; Martynski, K.; Kubisz, J. New Broadband ELF Receiver for Studying Atmospheric Discharges in Central Europe; Baltic URSI Symposium: Poznan, Poland, 2018. [Google Scholar]
- Mlynarczyk, J.; Kulak, A.; Popek, M.; Iwanski, R.; Klucjasz, S.; Kubisz, J. An analysis of TLE-associated discharges using the data recorded by a new broadband ELF receiver. In Proceedings of the XVI International Conference on Atmospheric Electricity, Nara, Japan, 17–22 June 2018. [Google Scholar]
- Tritakis, V.; Contopoulos, I.; Florios, C.; Tatsis, G.; Christofilakis, V.; Baldoumas, C.; Repapis, C. Anthropogenic Noise and its Footprint on ELF Schumann Resonance Recordings. Front. Earth Sci. 2021, 9, 163. [Google Scholar] [CrossRef]


Publisher’s Note: MDPI stays neutral with regard to jurisdictional claims in published maps and institutional affiliations. |
© 2022 by the authors. Licensee MDPI, Basel, Switzerland. This article is an open access article distributed under the terms and conditions of the Creative Commons Attribution (CC BY) license (https://creativecommons.org/licenses/by/4.0/).