Abstract
Northern China was hit by a severe dust storm on 15 March 2021, covering a large area and bring devastating impact to a degree that was unprecedented in more than a decade. In the study, we carried out a day-and-night continuous monitoring to the path of the moving dust, using multi-spectral data from the Chinese FY-4A satellite combined with the Japanese Himawary-8 from visible to near-infrared, mid-infrared and far-infrared bands. We monitored the whole process of the dust weather from the occurrence, development, transportation and extinction. The HYSPLIT(Hybrid Single Particle Lagrangian Integrated Trajectory) backward tracking results showed the following two main sources of dust affecting Beijing during the north China dust storm: one is from western Mongolia; the other is from arid and semi-arid regions of northwest of China. Along with the dust storm, the upper air mass, mainly from Siberia, brought a significant decrease in temperature. The transport path of the dust shown by the HYSPLIT backward tracking is consistent with that revealed by the satellite monitoring. The dust weather, which originated in western Mongolia, developed into the “3.15 dust storm” in north China, lasting more than 40 h, with a transport distance of 3900 km, and caused severe decline in air quality in northern China, the Korean peninsula and other regions. It is the most severe dust weather in the past 20 years in east Asia.
1. Introduction
Sand and dust storms are severe environmental issues and air pollution events occurring in arid and semi-arid regions of the world [1,2]. In northeast Asia, deserts and sandy lands distributed in Mongolia and northwest China are the main sources of dust storms impacting the densely populated areas in China, Korea and Japan [3]. The dust storm occurred in northern China during 14–16 March 2021 (the “3.15” dust storm hereafter) significantly affected the air quality of north China and caused serious casualties and property losses in Mongolia. The great intensity, wide range of influence and long duration features of this dust storm are rare in the past decade, enabling it to become “the most serious dust storm in the past decade” and arousing widespread concern in the whole society. In Liang’s paper, the authors analyzed the transport process of the mega dust storm by comprehensively analyzing various types of satellite remote sensing data and ground-based observations, combining with HYSPLIT backward trajectory tracking analysis technique [1]. In another research project, Filonchyk investigated the synoptic conditions using the ERA5 data from the European Center for Medium Range Weather Forecasts (ECMWF), and the research revealed the influence scope and distribution characteristics of particulate matter using combined data from ground-based observation network and satellite remote sensing data of the “3.15” dust storm [2].
On dust storm monitoring, satellite remote sensing has incomparable advantages over the ground-based station observation in terms of coverage [4,5]. Meanwhile, comparing with polar-orbit satellites, geostationary satellites have outstanding advantages in time continuity [6,7,8]. With the progress of satellite remote sensing technology in recent years, the new generation of geostationary environmental satellites can realize continuous and real-time monitoring of dust storm via the multi-channel observation data from visible light, short-wave infrared, medium-wave infrared and long-wave infrared [9,10]. As for the “3.15” dust storm, different kinds of polar-orbit satellite data provided helpful understanding of the event [1,2]. However, due to the limitation of polar-orbiting satellites, continuous monitoring of dust transport process cannot be realized. In this paper, we carried out a continuous and real-time remote sensing monitoring of the “3.15” dust storm using remote sensing data from the Chinese FY-4A satellite and Japanese Himawari-8 satellite.
2. Data and Methodology
2.1. FY-4A AGRI and Himawari-8 AHI Data
FY-4A is the first satellite of the new generation of China’s geostationary meteorological satellite, which was launched in December 2016 and transferred to operation in September 2017, and is positioned above the equator at 104.7° E. The imaging radiometer AGRI (advanced geostationary radiation imager) is equipped with 14 spectral bands, with the highest visible resolution of 0.5 km and infrared resolution of 4 km. The satellite in orbit supports the following two observation modes: the full disk every hour and the China region every 5 min. Himawari-8 is another commonly used geostationary satellite data source in Asia. It was launched in 2014 and located at 140.7° E above the equator [11]. Its equipped AHI (Advanced Himawari Imager) has 16 spectral bands, with the highest resolution of visible light of 0.5 km and the infrared resolution of 2 km [12].
In this paper, FY-4A AGRI and Himawari-8 AHI fast scan mode were used to monitor dust. Relevant technical parameters of two load channels are shown in Table 1 below.

Table 1.
Key Technical Parameters of FY-4A AGRI and Himawari-8 AHI.
The data used in this paper are from the L1 data of FY-4A AGRI and Himawari-8 AHI after radiometric calibrations and location corrections. In this paper, UTC time shall be stipulated as the uniform time zone, and ground-based observational data shall also be converted into UTC time.
2.2. Dust Monitoring Algorithms
In this paper, dust monitoring mainly involves the following three algorithms: daytime dust identification, daytime dust intensity calculation and nighttime dust identification. Next, we will give a short introduction for these identification algorithms, and more details can be found in Luo’s previous literature [9,10].
2.2.1. Daytime Dust Identification Algorithm
Radiation reflected by dust particles affects satellite observations from visible to thermal infrared channels. In the paper, we used a synthetic algorithm for dust identification, which mainly based on information from near-infrared, short-wave infrared and medium -wave infrared channels, with split window infrared channel and visible channels as auxiliaries. Four parameters, named comparable intensity index of near-infrared, water vapor absorption index of medium-wave infrared, difference index of short-wave infrared and ratio index of split window infrared, respectively, were used to identify dust [9,10].
2.2.2. Dust Intensity Calculation Algorithm
The dust storm, especially a severe dust storm, different from other types of underlying surfaces, has an albedo peak at 1.6 μm band. Moreover, the 1.6 μm band radiation has a linear relationship with dust intensity [10]. For a weak dust storm or floating dust, split window infrared channels were used as a supplement to generate more accurate dust intensity. In the research, we calculated the dust intensity index using the 1.6 μm channel albedo index and split window infrared channels ratio index, and the mapping relationship consistent with the meteorological standard is established. The detailed calculation methodology was provided in Wu’s and Luo’s papers [4,9].
2.2.3. Night Dust Identification Algorithms
During the nighttime, the visible and near infrared channels cannot be functioning properly, and the radiation and reflection characteristics of short-wave infrared channels change as well, which makes identifying dust difficult. In the meantime, due to the lack of effective surface observation at night, dust intensity calculation algorithm cannot be established. Therefore, in this paper, we only establish the dust identification algorithm without providing the dust intensity index at night.
As a kind of atmospheric suspended particulate matter, the reflection characteristic of dust is similar to that of medium and low clouds, but the radiation characteristics between them are quite different, especially at water vapor channels. Nighttime dust identification algorithms consist of 3 steps. First, 8.5 and 11.5 μm channels were utilized to calculate water vapor distribution index, to distinguish dust from medium and high clouds [6,13]; second, split window infrared channels were utilized to separate dust from medium and low clouds; last, 3.7 μm channel was utilized to exclude the influence of low clouds and fogs on dust identification [13].
3. Main Result and Analysis
3.1. Satellite Remote Sensing Monitoring of Sandstorm Occurrence—Development—Extinction Process on 15 March 2021
3.1.1. Dust Emission and Transportation Process in Mongolia
Figure 1 showed the initial stage of dust emission and the evolution at every 10 min intervals thereafter (Figure 1).
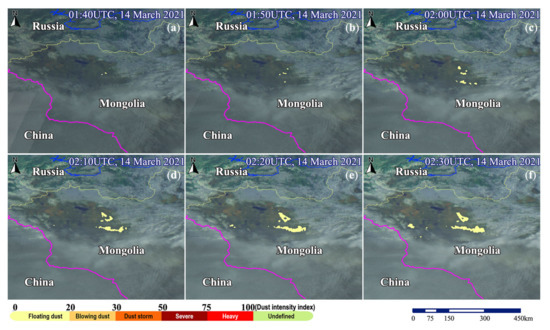
Figure 1.
The initial stage of dust emission and development in Mongolia. (a–f) respectively correspond to dust distribution of every 10 minutes in the initial stage of dust emission.
From Figure 1, we can see the dust weather started at 1:40 (UTC) on 14 March 2021. Subsequently, the dust area continued to move eastward and expanded rapidly. By 2:30, the dust area in central and western Mongolia had developed into an area of 700–800 km from west to east and more than 100 km from north to south.
Then, the dust continued to move eastward, and formed a dust storm in the west of Ulaanbaatar around 7:00 (Figure 2). CNN news from the General Administration of National Emergency of Mongolia reported that the dust storm in the west of Ulaanbaatar caused the death of 6 people, led to more than 80 people becoming missing and left severe property damage (https://edition.cnn.com/2021/03/15/asia/beijing-sandstorm-decade-intl-hnk/index.html, accessed on 20 March 2021).
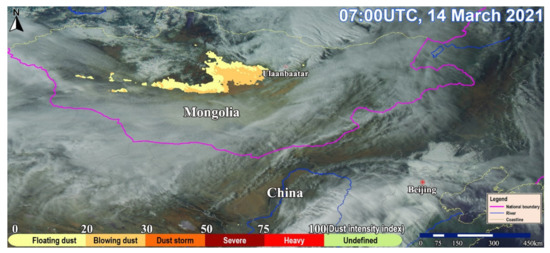
Figure 2.
The formation of dust storm in the west of Ulaanbaatar in Mongolia.
After 7:00, the dust changed its moving direction transport from east to southeast towards China and crossed the China–Mongolia border from Erenhot, China and adjacent areas at around 13:00, 14 March (Figure 3).
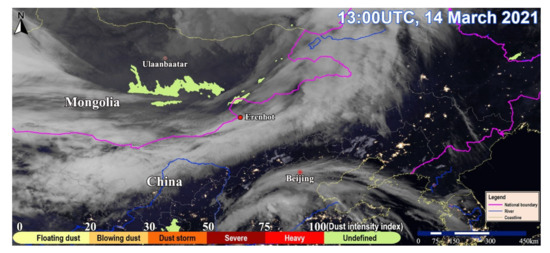
Figure 3.
The dust transport crossed the China–Mongolia border from Erenhot, China at around 13:00, 14 March.
Figure 3 showed the scene of dust entering China through Erenhot and adjacent areas. However, the dense clouds belt of the Mongolian cyclone in front of the dust affected the monitoring of the complete dust distribution area.
3.1.2. Dust Transports in China
After crossing the China–Mongolia border, the dust continued to move southward during 13:00 to 18:00 14 March (Figure 4).
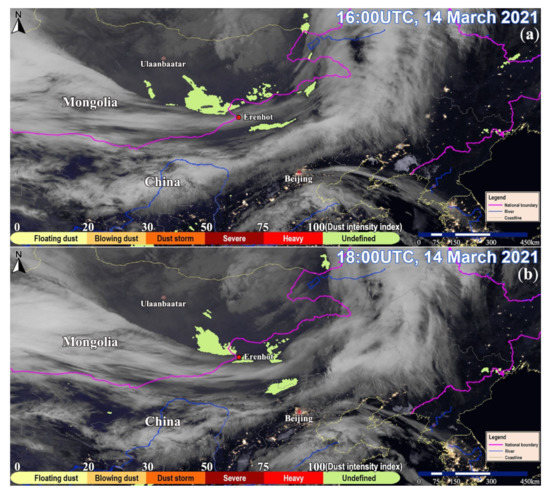
Figure 4.
The dust transport in China. (a) and (b) correspond to the scenes of dust crossing the China-Mongolia border into China at 16:00 and 18:00 (UTC) on 14 March 2021.
In Figure 4, the dust moved across northern China at night local time, and the monitoring was affected both by the nighttime and dense clouds. we can see that the dust transport routes were divided into two, as follows: one was northeastward to northeast China, and the other was southward and arrived in the north Beijing at around 18:00.
3.1.3. Dust Arrival in Beijing
The dust continued to move towards Beijing and arrived in Beijing at around 19:00 on 14 March. Figure 5 showed the arrival of dust near northern Beijing at 19:00.
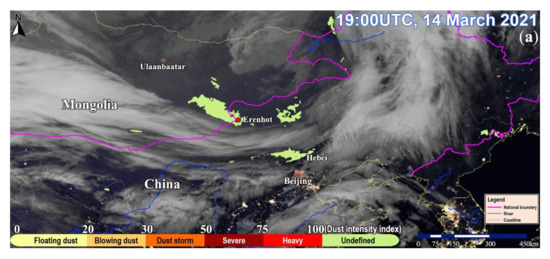
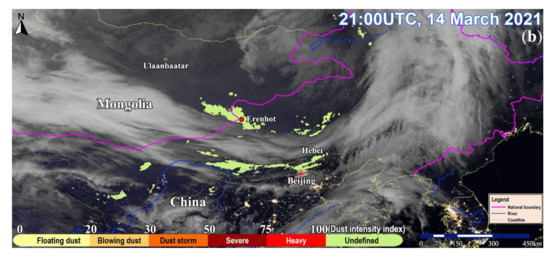
Figure 5.
Dust air mass arrived in surrounding area of Beijing and formed dense floating dust. (a) and (b) correspond to the scenes at 19:00 and 21:00 (UTC) on 14 March 2021.
In Figure 5, dust monitoring was affected by the following two factors: firstly, the mixing effects of dense clouds and the Mongolia cyclone, secondly, the inoperativeness of dust intensity calculation by the nighttime. However, from the ABC news, Beijing was hit by dust storm from March 14 to 15, during which the dust weather had developed into a dust storm in some area of Beijing (https://www.abc.net.au/news/2021-03-15/beijing-choked-by-the-worst-dust-storm-in-a-decade/13250174, accessed on 20 March 2021).
3.1.4. At the Same Time, Dust Emission Occurred in Hexi Corridor-Hetao and Moved Eastward
At 21:00, while Beijing was hit by dust weather, dust emission and floating dust weather swept through many places in Hexi Corridor to Hetao, northwest China. From 22:00 to 23:00, strong winds lift large amounts of sand and dust into the atmosphere and moved eastward (Figure 6).
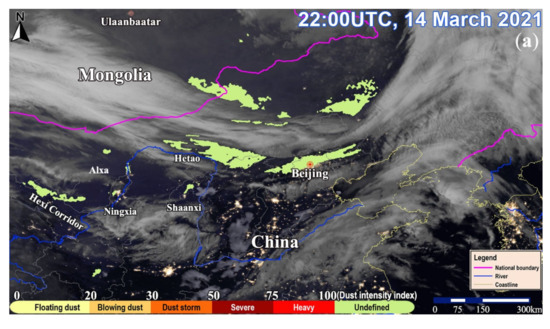
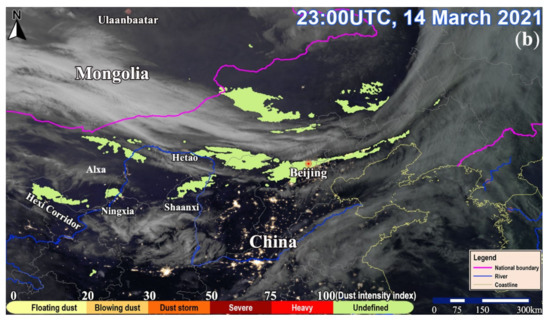
Figure 6.
Dust emission and floating dust weather occurred in Hexi Corridor and moved eastward. (a) and (b) correspond to the scenes at 22:00 and 23:00 (UTC) on 14 March 2021.
From Figure 6, we can see that dust moved eastward and arrived in western Beijing at around 23:00, 14 March.
3.1.5. Dust Storm in Northern China
From 23:00 14 March to 8:00 15 March, despite the influence of dense clouds, we can see a large area of northern China was covered by dusts (Figure 7).
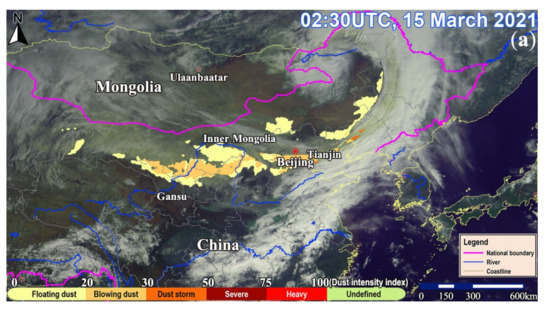
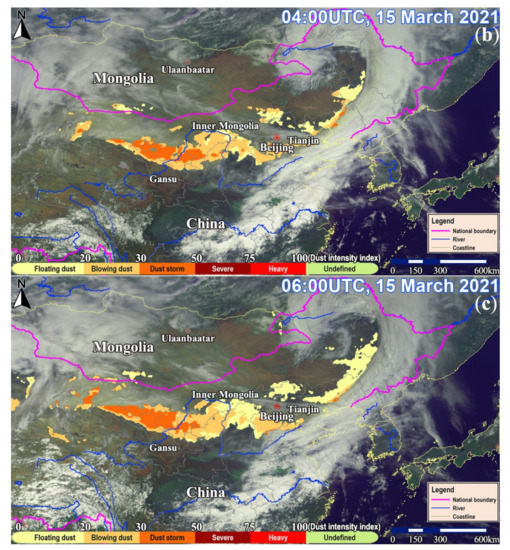
Figure 7.
Dust distribution over north China and developed into dust storm at some part areas. (a–c) correspond to the scenes at 2:30, 4:00 and 6:00(UTC) on 15 March 2021 respectively, and the dust from western China developed into dust storm in the eastward transportation process.
Figure 7 showed that large areas of dust spread over Beijing, Hebei, Tianjin, Inner Mongolia and other areas/regions of northern China. The dust weather had developed into a dust storm in Beijing and northwest of China around 4:00–6:00 15 March. Because China was by day at that time, dust monitoring intensity was able to separate various dust storm levels. In addition, due to the influence of dense cloud belt in front of dusts, we cannot monitor the entire area of dust cover and dust storm.
3.1.6. The Dust Storm Gradually Dissipated
As the dust continued to move eastward, and the affected area continued to expand, the dust storm reaches its maximum influencing range at around 10:00 15 March (Figure 8). Later on, since 16:00, the dust storm had gradually dissipated, and finally dispersed to northeast China, the Korean Peninsula and the Japanese Sea by around 19:00 15 March.
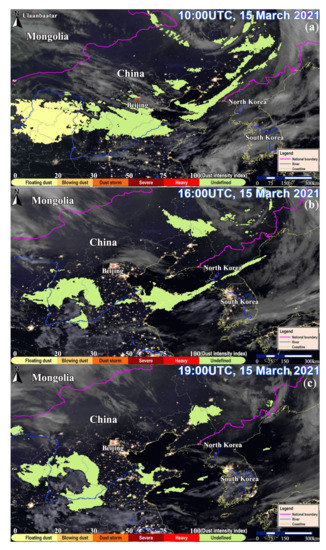
Figure 8.
The dust storm gradually dissipated. (a–c) correspond to the scenes at 10:30, 16:00 and 19:00 on 15 March 2021 respectively, and the dust storm gradually dissipated in northeast China and adjacent areas.
3.2. PM10 Surface Observation
China Meteorological Administration has been running an PM-10 ground-based operational observation network in north China (Figure 9). During the severe dust storm, PM10 observational data from the network provided independent comparative data for satellite monitoring.
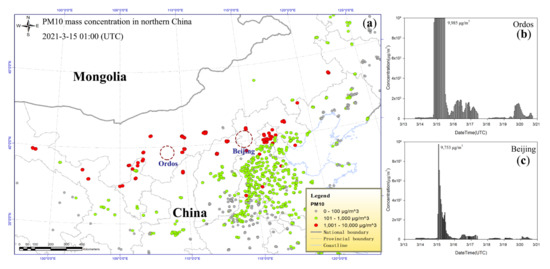
Figure 9.
PM10 ground-based observation network (a) and variation of PM10 observation at Ordos (b) and Beijing (c).
Figure 9 showed that the observed PM10 mass concentration data marked in red in North China is much higher than those from stations marked in green at 1:00 15 March 2021, indicating northern China as the main affected areas of the dust storm. Figure 9b,c showed the variation of PM10 concentration during the dust storm represented by Ordos and Beijing, respectively. The Maximum PM10 concentration at Ordos was 9985 μg/m3 from 20:00 14 March to 10:00 15 March, and that at Beijing it reached 9753 μg/m3 at 01:00 15 March, which was consistent with that observed by the satellite monitoring.
4. HYSPLIT Trajectory Tracking Analysis
As an effective analytical tool in atmospheric science, HYSPLIT (Hybrid Single Particle Lagrangian Integrated Trajectory) model is widely used in the dust storms monitoring and simulation [14,15,16,17]. In the paper, we randomly selected two locations A (40.62° N, 116.41° E) and B (39.54° N, 116.41° E) at 2:00 15 March during the dust storm to represent the northern and southern parts of Beijing, respectively, for HYSPLIT backward trajectory tracking for 48 h. Figure 10 and Figure 11 showed the backward trajectory tracking results, respectively.
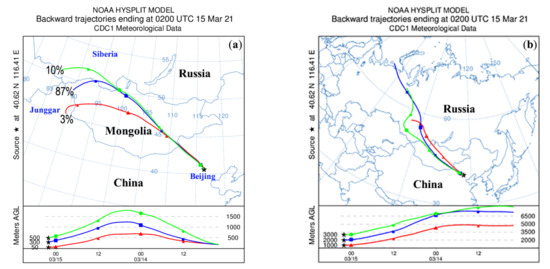
Figure 10.
48 h backward trajectory tracking results for location A. (a) and (b) correspond to the backward trajectory of air masses from the surface to 500 m and from 1000 m to 3000 m, respectively.
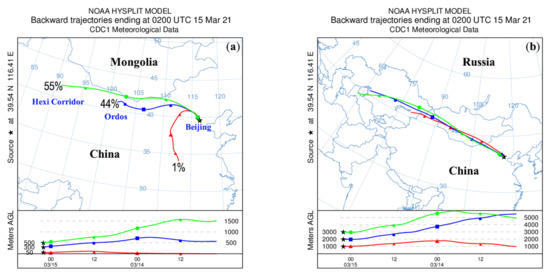
Figure 11.
48 h backward trajectory tracking results for location B. (a) and (b) correspond to the backward trajectory of air masses from the surface to 500 m and from 1000 m to 3000 m, respectively.
From Figure 10, dusts affecting northern Beijing came from the following three source areas: 87% from northwestern Mongolia, 10% from southern Siberia of Russia, and 3% from Junggar Basin in China. The backward tracking also showed during the long-distance transport, the dust was blown from surface to a height of 500–1800 m, transporting over a long distance in the wind before gradually falling down to the surface. Moreover, air masses from high latitudes such as Russian Xindi island and Ural Mountain drop in height during transport to northern Beijing, leading to a sharp temperature decline accompanied by the dust weather.
Figure 11 showed that dusts affecting south Beijing mainly comes from arid and semi-arid regions in western China such as Hexi Corridor (55%), and Ordos (44%), with a small amount of dust coming from central China (1%). The upper air mass most from Siberia drops in height during the transportation to southern Beijing resulting in a process of surface cooling.
According to the HYSPLIT analysis, there are two main sources of dusts that affected Beijing during the north China’s dust storm, as follows: one is from western Mongolia and the other is from northwest of China. At the same time, the upper air mass mainly comes from Siberia, bringing a significant cooling weather. Comparison between the HYSPLIT analysis and satellite monitoring showed that the backward trajectory of the low-level air mass, which mainly represents the dust transport path, is consistent with that revealed by satellite monitoring.
5. Conclusions
Influenced by the Mongolia cyclone, the dust weather originated in western Mongolia and developed into the “3.15 dust storm” in north China. The whole process of dust weather lasted for more than 40 h, with a transport distance of 3900 km, causing severe decrease in air quality in northern China, the Korean peninsula and other regions. In the paper, we carried out a day-and-night continuous satellite monitoring using combined data from visible light channel, near-infrared channel, mid infrared to thermal infrared channels and window area of the FY-4A AGRI and Himawari-8 AHI. The conclusions are as follows:
- (1)
- Integrated use of observation data from different channels of geostationary satellites can realize a day-and-night continuous monitoring of dust transport process in large areas, providing important information for us to understand dust transport route, dust sources and affecting regions.
- (2)
- Backward trajectory tracking analysis showed that there are two main sources of dust: one is from northwest Mongolia, and the other is from west China. In the process of dust transportation, the upper atmosphere mainly comes from Siberia region, which results in a remarkable temperature decline accompanied by the dust weather.
- (3)
- Comparisons showed that the dust transporting route monitored by satellite is consistent with that of HYSPLIT analysis.
- (4)
- Two aspects need to be solved by satellite monitoring, as follows: one is the dust intensity clarification during nighttime, the other is to eliminate effects of thick clouds such as the Mongolian cyclone on intracloud dust monitoring.
Author Contributions
Conceptualization, F.H. and A.D.; methodology, J.L.; software, J.L. and S.L.; validation, S.G. and R.L.; formal analysis, F.H. and R.L.; investigation, J.L. and F.H.; data curation, J.L. and S.G.; writing—original draft preparation, F.H.; writing—review and editing, A.D.; visualization, J.L. and S.L.; supervision, J.L.; project administration, F.H.; funding acquisition, F.H. and A.D. All authors have read and agreed to the published version of the manuscript.
Funding
This research was funded by the National Science Foundation of China (grant 41675031), and the NRSCC(National Remote Sensing Centre of China)-ESA(European Space Agency) cooperation Programme Dragon 5 (ID: 59055).
Institutional Review Board Statement
Not applicable.
Informed Consent Statement
Not applicable.
Data Availability Statement
No data was reported.
Acknowledgments
The authors gratefully acknowledge the NOAA Air Resources Laboratory for the READY website (http://ready.arl.noaa.gov, accessed on 28 March 2021) for generating HYSPLIT trajectories used in this publication.
Conflicts of Interest
The authors declare no conflict of interest.
References
- Liang, P.; Chen, B.; Yang, X.; Liu, Q.; Li, A.; Mackenzie, L.; Zhang, D. Revealing the dust transport processes of the 2021 mega dust storm event in northern China. Sci. Bull. 2021, 67, 21–24. [Google Scholar] [CrossRef]
- Filonchyk, M. Characteristics of the severe March 2021 Gobi Desert dust storm and its impact on air pollution in China. Chemosphere 2021, 287, 132219. [Google Scholar] [CrossRef] [PubMed]
- Shao, Y.; Dong, C. A review on East Asian dust storm climate, modeling and monitoring. Glob. Planet. Chang. 2006, 52, 1–22. [Google Scholar] [CrossRef]
- Wu, Y.; Guo, J.; Zhang, X.; Tian, X.; Zhang, J.; Wang, Y.; Duan, J.; Li, X. Synergy of satellite and ground based observations in estimation of particulate matter in eastern China. Sci. Total Environ. 2012, 433, 20–30. [Google Scholar] [CrossRef] [PubMed]
- Romano, F.; Ricciardelli, E.; Cimini, D.; Di Paola, F.; Viggiano, M. Dust Detection and Optical Depth Retrieval Using MSG-SEVIRI Data. Atmosphere 2013, 4, 35–47. [Google Scholar] [CrossRef] [Green Version]
- Fuell, K.K.; Guyer, B.J.; Kann, D.; Molthan, A.L.; Elmer, N. Next generation satellite RGB dust imagery leads to operational changes at NWS Albuquerque. J. Oper. Meteorol. 2016, 4, 75–91. [Google Scholar] [CrossRef]
- Sowden, M.; Mueller, U.; Blake, D. Review of surface particulate monitoring of dust events using geostationary satellite remote sensing. Atmos. Environ. 2018, 183, 154–164. [Google Scholar] [CrossRef]
- Sowden, M.; Mueller, U.; Blake, D. What temporal resolution is required for remote sensing of regional aerosol concentrations using the Himawari-8 geostationary satellite. Atmos. Environ. 2019, 216, 116914. [Google Scholar] [CrossRef]
- Luo, J.N.; Zheng, X.J.; Zhu, F.K.; Xian, D.; Yang, W.X.; Tu, Z.F.; Li, M.X. Meteorologically Dangerous Level of Dust Storm Occurrence in China. J. Desert Res. 2011, 31, 185–190. (In Chinese) [Google Scholar]
- Luo, J.N.; Xu, Z.; Qi, Y.G. Global Dust Remote Sensing with the FengYun-3 Satellite. J. Desert Res. 2015, 35, 690–698. (In Chinese) [Google Scholar]
- Kotaro, B.; Kenji, D.; Masahiro, H.; Akio, I.; Takahito, I.; Hidekazu, I.; Yukihiro, K.; Takuya, M.; Hidehiko, M.; Tomoo, O. An Introduction to Himawari-8/9 Japan’s New-Generation Geostationary Meteorological Satellites. J. Meteorol. Soc. Japan. Ser. II 2016, 94, 151–183. [Google Scholar]
- Da, C. Preliminary assessment of the Advanced Himawari Imager (AHI) measurement onboard Himawari-8 geostationary satellite. Remote Sens. Lett. 2015, 6, 637–646. [Google Scholar] [CrossRef]
- Schmit, T.J.; Griffith, P.; Gunshor, M.M.; Daniels, J.M.; Goodman, S.J.; Lebair, W.J. A Closer Look at the ABI on the GOES-R Series. Bull. Amer. Meteor. Soc. 2017, 98, 681–698. [Google Scholar] [CrossRef]
- Ashrafi, K.; Shafiepour-Motlagh, M.; Aslemand, A.; Ghader, S. Dust storm simulation over Iran using HYSPLIT. J. Environ. Health Sci. Eng. 2014, 12, 9. [Google Scholar] [CrossRef] [PubMed] [Green Version]
- Draxler, R.R.; Ginoux, P.; Stein, A.F. An empirically derived emission algorithm for wind-blown dust. J. Geophys. Res. Atmos. 2010, 115, D16212. [Google Scholar] [CrossRef]
- Özdemir, E.T.; Korkmaz, F.M.; Yavuz, V. Synoptic analysis of dust storm over Arabian Peninsula: A case study on February 28, 2009. Nat. Hazards 2018, 92, 805–827. [Google Scholar] [CrossRef]
- Rajaee, T.; Rohani, N.; Jabbari, E.; Mojaradi, B. Tracing and assessment of simultaneous dust storms in the cities of Ahvaz and Kermanshah in western Iran based on the new approach. Arab. J. Geosci. 2020, 13, 1–20. [Google Scholar] [CrossRef]
Publisher’s Note: MDPI stays neutral with regard to jurisdictional claims in published maps and institutional affiliations. |
© 2022 by the authors. Licensee MDPI, Basel, Switzerland. This article is an open access article distributed under the terms and conditions of the Creative Commons Attribution (CC BY) license (https://creativecommons.org/licenses/by/4.0/).