Abstract
Simulating WAves Nearshore (SWAN) on a structured grid over the Louisiana shelf in the northern Gulf of Mexico is used to evaluate the performance of three different classes of formulations for quantifying wind input and whitecapping dissipation. The formulations include Komen based on the mean spectral parameters, Westhuysen based on the saturation concept of the wave groups, and the most recent observation-based physics package ST6. The evaluation was implemented for two summer months (July and August 2015) to assess these formulations for a low wave energy period. The modeling area consists of the Louisiana inner shelf with the offshore open boundary located beyond the continental shelf. The model was forced using the spatially variable Climate Forecast System Reanalysis (CFSR) wind field and wave parameters obtained from the NOAA’s WAVEWATCH-III (WWIII) model along the open boundaries. Simulated wave parameters and spectra regarding each formulation were evaluated and compared with measured wave data at NDBC stations; comparisons showed that the most appropriate formulation for the simulation of low energy waves for the study area to be ST6. The e performance of each whitecapping formulation was described by examining 1D/2D spectra and the source term balance at different met-ocean conditions during the simulation period. It was also shown that the inaccuracies in the input wind field and boundary conditions can substantially contribute to the model inaccuracy.
1. Introduction
The generation and propagation of surface gravity waves are one of the most immediate effects of atmospheric forcing in the oceans, seas, and other water bodies [1,2]. Waves are primarily generated by wind shear interacting with the water surface. Waves can be generated locally and can travel long distances away from the source region in the form of swells. Determining accurate wave characteristics with the appropriate spatial and temporal resolution is of great importance in different offshore and nearshore regions, including studying coastal sediment transport, nearshore hydrodynamics, and wave energy characterization [3,4,5,6,7,8,9].
Passing hurricanes and tropical storms occasionally affect the northern Gulf of Mexico. The waves generated by hurricanes in the Gulf of Mexico are well studied, especially using numerical models [9,10,11,12,13,14]. There are different dominant meteorological conditions in the region throughout the year. From mid-September to mid-May, the Louisiana shelf is frequently affected by cold fronts during which strong winds come from general northerly directions [15,16,17,18]. Cold fronts occur with a frequency of 3–10 days and last for 2–4 days. Due to the direction and severity of the associated winds, large waves over the Louisiana shelf are expected during cold fronts. In contrast, low energy swell waves can be expected from the outside of the shelf (from the southern quadrant) after cold fronts. Summer is characterized by southeasterly to southwesterly winds with a significant decline in wind energy [19]; thus, in general, smaller wave heights over the shelf are expected compared to non-summertime. However, swell waves can significantly affect shelf areas from the southeast to the southwest during summer. A few modeling studies of cold front-generated waves over the northern Gulf of Mexico demonstrated the effectiveness of numerical models in generating waves during cold fronts over the Louisiana shelf [9,18,20] while simulating waves during fair-weather summer conditions has been less reported. For both conditions, an essential element of the modeling is selecting the appropriate approach for quantifying the whitecapping source term in the model. Allahdadi et al [9] implemented a detailed calibration and verification of the Simulation WAve Nearshore (SWAN) wave model in the Gulf of Mexico with the main focus on higher energy waves during cold fronts and tropical storms. They verified the three available whitecapping formulations incorporated in SWAN, including [3,4,21], using the observations at the location of 9 NDBC and 2 WAVCIS buoys, and concluded that when using the default parameters, [21] resulted in the best model performance statistics. They then calibrated the parameters associated with [21] during hurricanes and cold front event tropical storm events. They concluded that compared to the cold front events, a larger dissipation coefficient is required to achieve the best wave height and period match during tropical storms.
In SWAN, there are three classes of wind input/whitecapping formulation: (1) Komen-type models [3,21] that have been used in different spectral models for several decades and quantify whitecapping based on the mean spectral parameters such as mean wave number and mean spectral steepness, (2) saturation-based model of Van der Westhuysen [4] that works based on the concept of wave spectra saturation as a trigger for wave dissipation, and (3) the observational-based ST6 model that is more modern and has been incorporated in SWAN from version 41.31A. The Komen approach has been widely used in different wave modeling studies over the last three decades. However, this approach exhibits shortcomings, including unrealistic dissipations when a mixed sea-swell condition exists. Although, the saturated-based model of Westhuysen [4] showed significant improvements in the simulation of wave parameters for both conditions of mixed seas and swells and wind–wave only. However, some recent studies showed that this approach needs more calibrations to accurately represent the fetch-limited growth curve [22] and hence underestimates wave height and period in most cases [23].
In the present study, low energy waves in the Gulf of Mexico that are most typical of the summertime are simulated using the above three wind input/whitecapping approaches incorporated in SWAN. Then the most appropriate approach is determined by comparing the results with observations. The behavior of each approach is discussed based on the spectral properties of waves during the specific low energy period and source term variations during the simulation. Forcing accuracy, including wind field and boundary conditions, will also be investigated to determine the potential inaccuracies. Although there are many studies on the behavior of different whitecapping formulations (e.g., [18,23]), their primary focus is on high energy waves during storms or high energy swells. The present study is one of the first attempts to investigate the source terms during low energy waves, especially in the Gulf of Mexico. The motivation for this study is the fact that the frequency of occurrence for low energy waves is much higher than that of short-term extreme high energy waves. This persistent effect of this high occurrence can significantly impact different disciplines of coastal science. One example is the continuous effect of low energy waves on coastal sediment transport that can cause cumulative effects comparable to extreme events [24,25].
Another example is characterizing wave energy resources on the nearshore. Although wave models used for characterization are usually calibrated and verified for specific atmospheric events other than fair-weather conditions. Yet, low energy waves can be important operationally regarding the amount of exploitable energy [9].
2. Study Area and Field Data
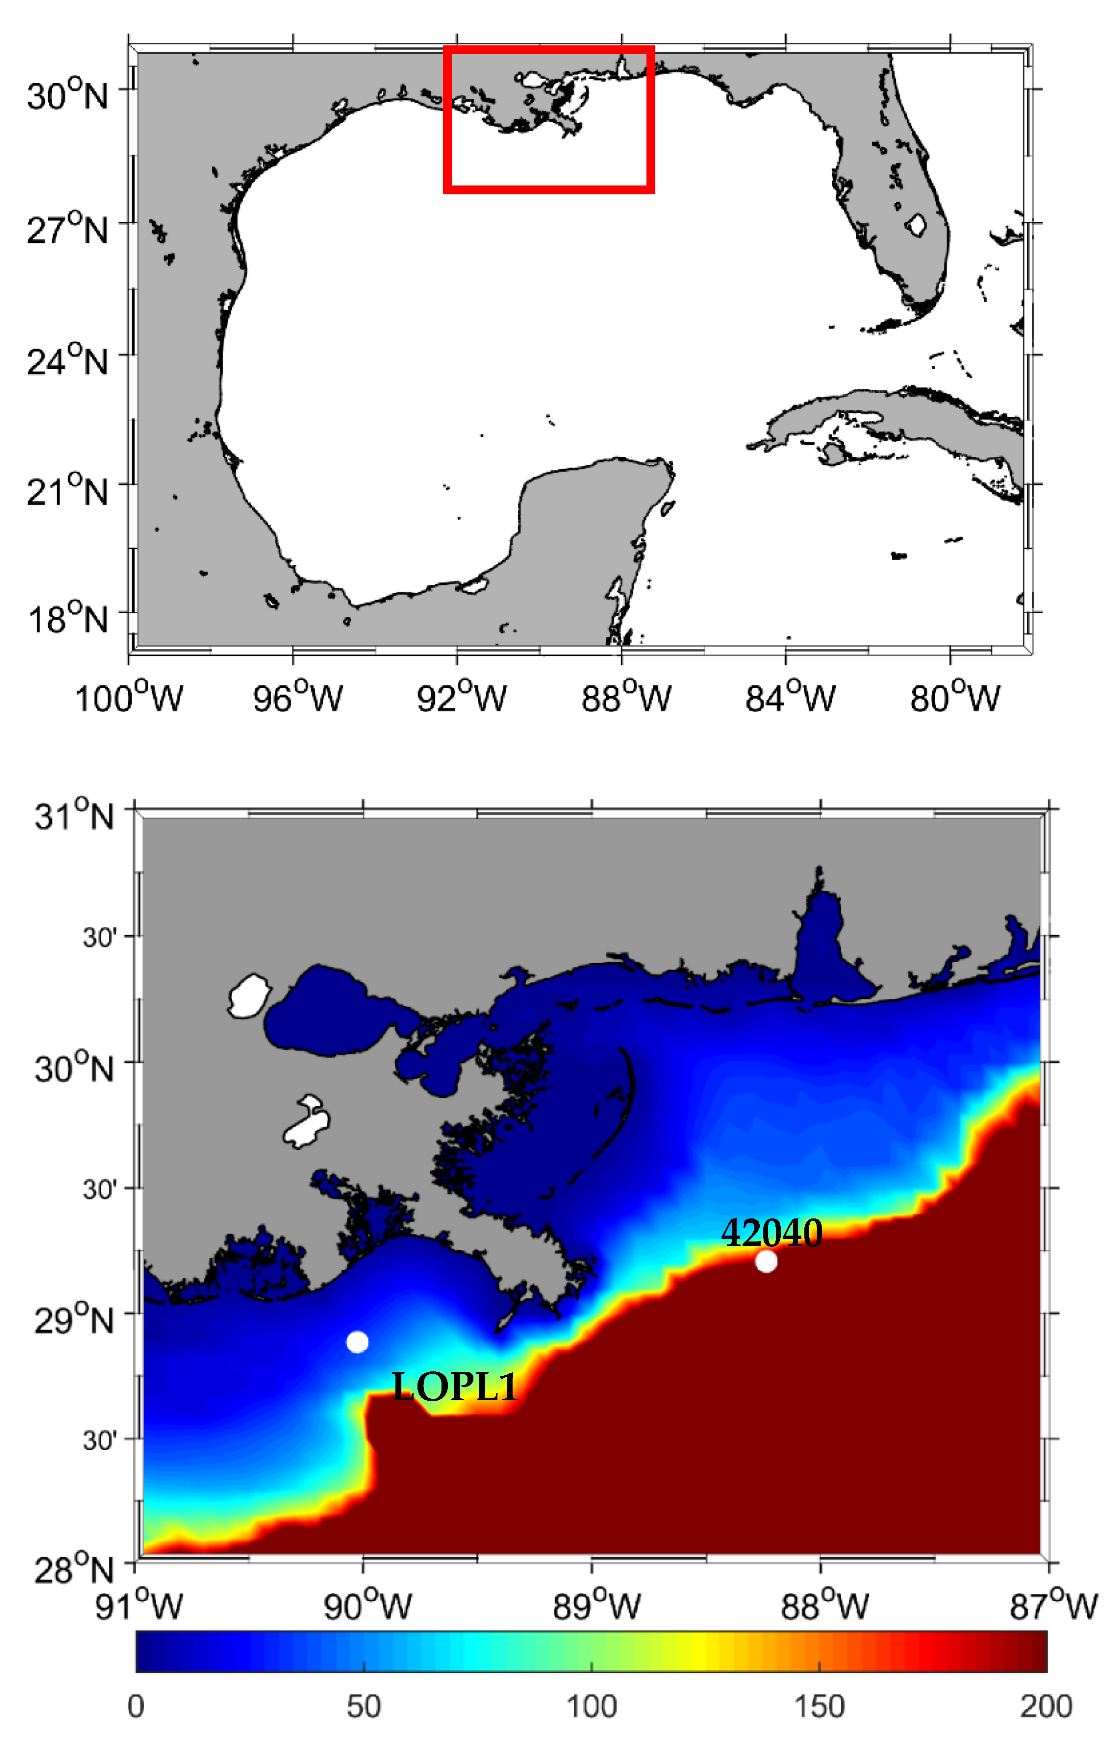
The study area is the Louisiana shelf in the northern Gulf of Mexico (Figure 1). This area is affected by different meteorological phenomena, including tropical storms, cold fronts, and fair-weather summertime atmospheric events.
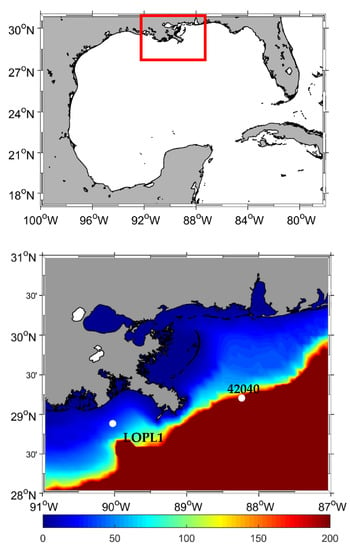
Figure 1.
(Upper panel) General extent of the modeling area in the Gulf of Mexico (red box), (lower panel) Model bathymetry and location of NDBC wave buoys on the Louisiana shelf used for model evaluation. Colors show water depth in meters.
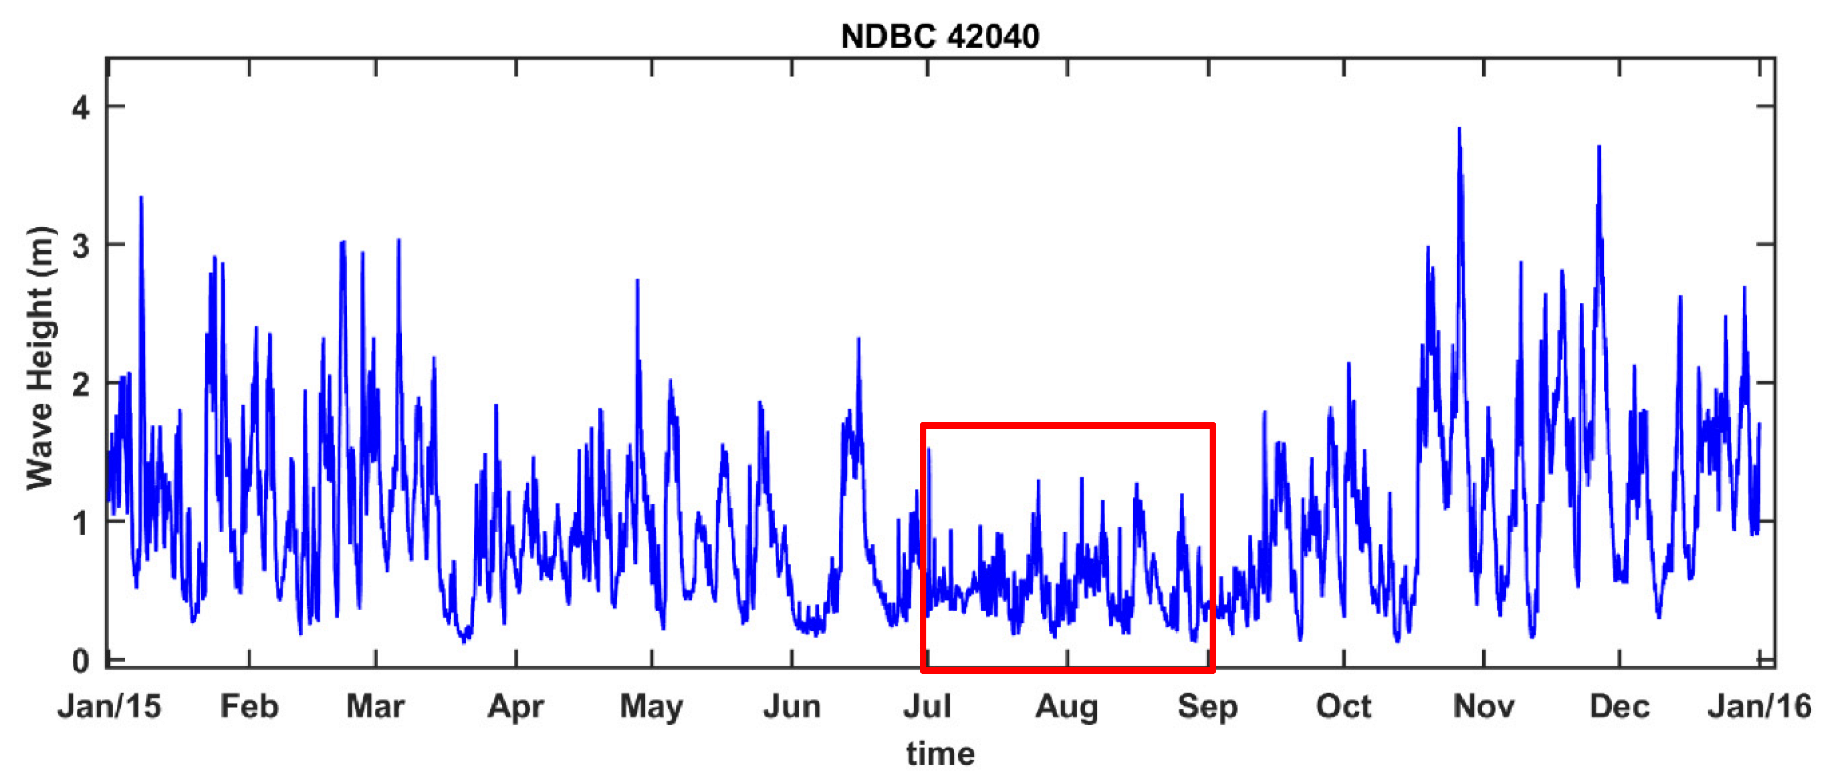
In the present study, the low energy waves during fair-weather conditions of summertime in the northern Gulf of Mexico are investigated by simulation between July and August 2015 (Figure 2).
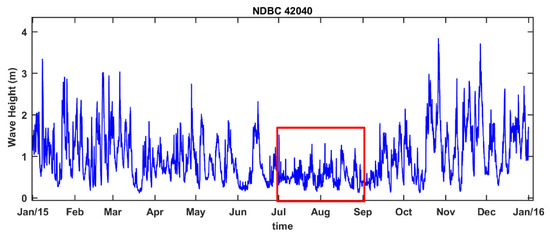
Figure 2.
Significant decline in wave height in July and August 2015 (specified by the red box) based on measurements at station NDBC 42040.
Wave data, including significant wave height and mean period from two stations on the east and west of the Mississippi birds-foot Delta, are used for the evaluation of simulation results for each whitecapping approach. Locations of these stations, including NDBC buoy 42040 and LOPL1, are shown in Figure 1. Table 1 presents more information about the observation stations.

Table 1.
NDBC wave buoy 42040 and LOPL1 information and wave parameters used for model evaluation.
3. Model Specifications
3.1. Numerical Model
Wave generation and propagation over the Louisiana shelf were modeled using SWAN, which is a 3rd generation spectral phased averaged model that solves the equation of conservation of wave action energy density [26]:
where E is wave energy that varies with relative angular frequency and propagation direction, is wave action density, and denote longitude and latitude, respectively, , , represent wave group velocity in the direction of longitude, latitude, in the frequency space, and directional space, respectively. R is the earth’s radius, is the sum of all source terms accounting for generation or dissipation of wave energy; σ is relative wave radian frequency (with no current), and t is time.
The source term on the right-hand side of Equation (1) is the sum of several terms representing different parameters in deep or shallow water:
In the above equation is wave growth by the wind, and are nonlinear transfers of wave energy through three-wave and four-wave interactions, respectively. Dissipation terms include ,, and that represent wave decay due to whitecapping, bottom friction, and depth-induced wave breaking, respectively. The wave growth by wind, four-wave interaction, and whitecapping dissipation are active over the modeling area regardless of water depth, but the three-wave interaction (triad), bottom friction, and depth-induced wave breaking are specifically effective only in shallow to very shallow areas.
3.2. Wind Input and Whitecapping Formulations
Two mechanisms, including linear and exponential waves, are considered in SWAN for simulating wave growth by wind input energy [26]:
In the above equation, A represents the linear wave growth by wind, and the second term, which is the product of coefficient and spectral energy , accounts for the exponential growth. A and are functions of wind shear stress, wave phase velocity, and the ratio of air to water densities. Using linear wave growth in SWAN is optional and is estimated based on [27]. The exponential wave growth formulation depends on the whitecapping approach used in the simulations and can be selected based on [3,21,28]. Two classes of whitecapping formulations are included in SWAN: traditional formulations based on the mean wave steepness over the wave spectra and a newer approach based on the local wave steepness that can include the effect of swell waves on wave growth and dissipation separately. The formulation proposed by [3] is the main whitecapping approach based on the mean wave steepness that is incorporated in SWAN [26]:
In the above equations, is the rate of energy dissipation by whitecapping, is the average of wave frequency over the spectra, is wave number for the specific spectral component for which calculations are performed, is the average of wave numbers over the spectra, is the energy spectral component corresponding to a frequency of and direction of , is the whitecapping coefficient, is a parameter for adjusting wave period that varies between 0 and 1, is the mean spectral steepness, the spectral steepness corresponding to the Pierson-Moskowitz spectrum, ad is the total energy of the wave spectrum.
The whitecapping formulation by [4] considers the interaction of shore waves generated by wind with longer swell waves by representing the dissipation based on the local wave number and wave steepness:
where is defined as the azimuthal-integrated spectral situation and is a threshold value for the spectral saturation with the default value of . Wave breaking due to whitecapping occurs when is larger than . In the above equations, is water depth, is the acceleration due to gravity, is the wave group velocity and is a function of the wave age. This formulation considers separate relationships for dissipation of each wind wave and swells and combines them using a smoothed transition function ():
where represents the total dissipation due to whitecapping, denotes dissipation of breaking waves (wind-waves), and is the dissipation term for non-breaking waves (swell waves). Equation (13) is based on the fact that the waves that are locally generated by winds have smaller length and larger steepness, hence they break after reaching a threshold and lose energy through whitecapping. Unlike the wind-waves, swells with long lengths and small steepness do not break and only lose energy through turbulence interaction. Therefore, the total dissipation due to whitecapping is the combination of the dissipation for breaking and non-breaking waves as calculated using Equation (13).
Wind input formulation of [28] that includes the effect of both linear and quadratic terms on wave growth is used in integration with the Westhuysen whitecapping.
ST6 is a relatively new whitecapping formulation incorporated in SWAN since version 41.20, released in 2018 [29]. ST6 physics package includes parameterizations of non-breaking dissipation (swell wave decay) as an external sink term. The non-breaking term (Equation (14)) was formulated by adopting previous methods [30,31]. Due to the wind input parameterization, the model with ST6 physics simulates young waves better.
The non-breaking dissipation or swell wave decay (Equaton (14)) and the whitecapping dissipation (Equation (15)) [29,31] as sink terms are implemented as follows:
where, b1 is defined between 2 × 10⁻⁴ and 14 × 2 × 10−4 [32]. T1 is the inherent breaking term and traditional function of the wave spectrum. T2 is expressed as an integral of the wave spectrum below wavenumber (k) and the cumulative effect of short-wave breaking or dissipation due to longer waves at each frequency or wavenumber. T1 and T2 are calculated using threshold spectral density.
4. Input Data
4.1. Modeling Area and Bathymetry Data
The present study used the structured version of SWAN (41.31). Hence, a rectangular modeling area was considered to simulate wave generation and propagation over the Louisiana shelf. The model extends from longitudes of −90° W to −88° W and from latitudes of 28° N to 31° N (Figure 2). The spatial resolution of this finite difference grid is 1 km in both longitude and latitude directions. Bathymetry data from the coastal relief model product with a spatial resolution of 3 arc-s (~90 m) obtained from the National Geophysical Data Center (NGDC) were used to interpolate water depths over the computational grid (Figure 1).
4.2. Wind Forcing
Spatial-varying wind fields from Climate Forecast System Reanalysis (CFSR) with spatial and temporal resolutions of 0.312 degrees and 1 h, respectively, were used for wave simulations. This product showed an appropriate accuracy for wave simulation along the U.S. East Coast and in the Gulf of Mexico, as reported by [9,33]. The summertime wind climate in the Gulf of Mexico is dominated by winds mainly from the southern quadrant. Wind direction changes from west to southeast, although winds occasionally shift to the northerly or southeasterly directions.
Figure 3 shows two examples of CFSR wind fields during August 2015, with prevailing winds varying from west to southeast. Times (4 August 2015 12:00) and (17 August 2015 12:00) were selected and are later used for further examination of the model results.

Figure 3.
Examples of CFSR wind filed during August 2015, left panel: time , right panel: time .
4.3. Boundary Conditions
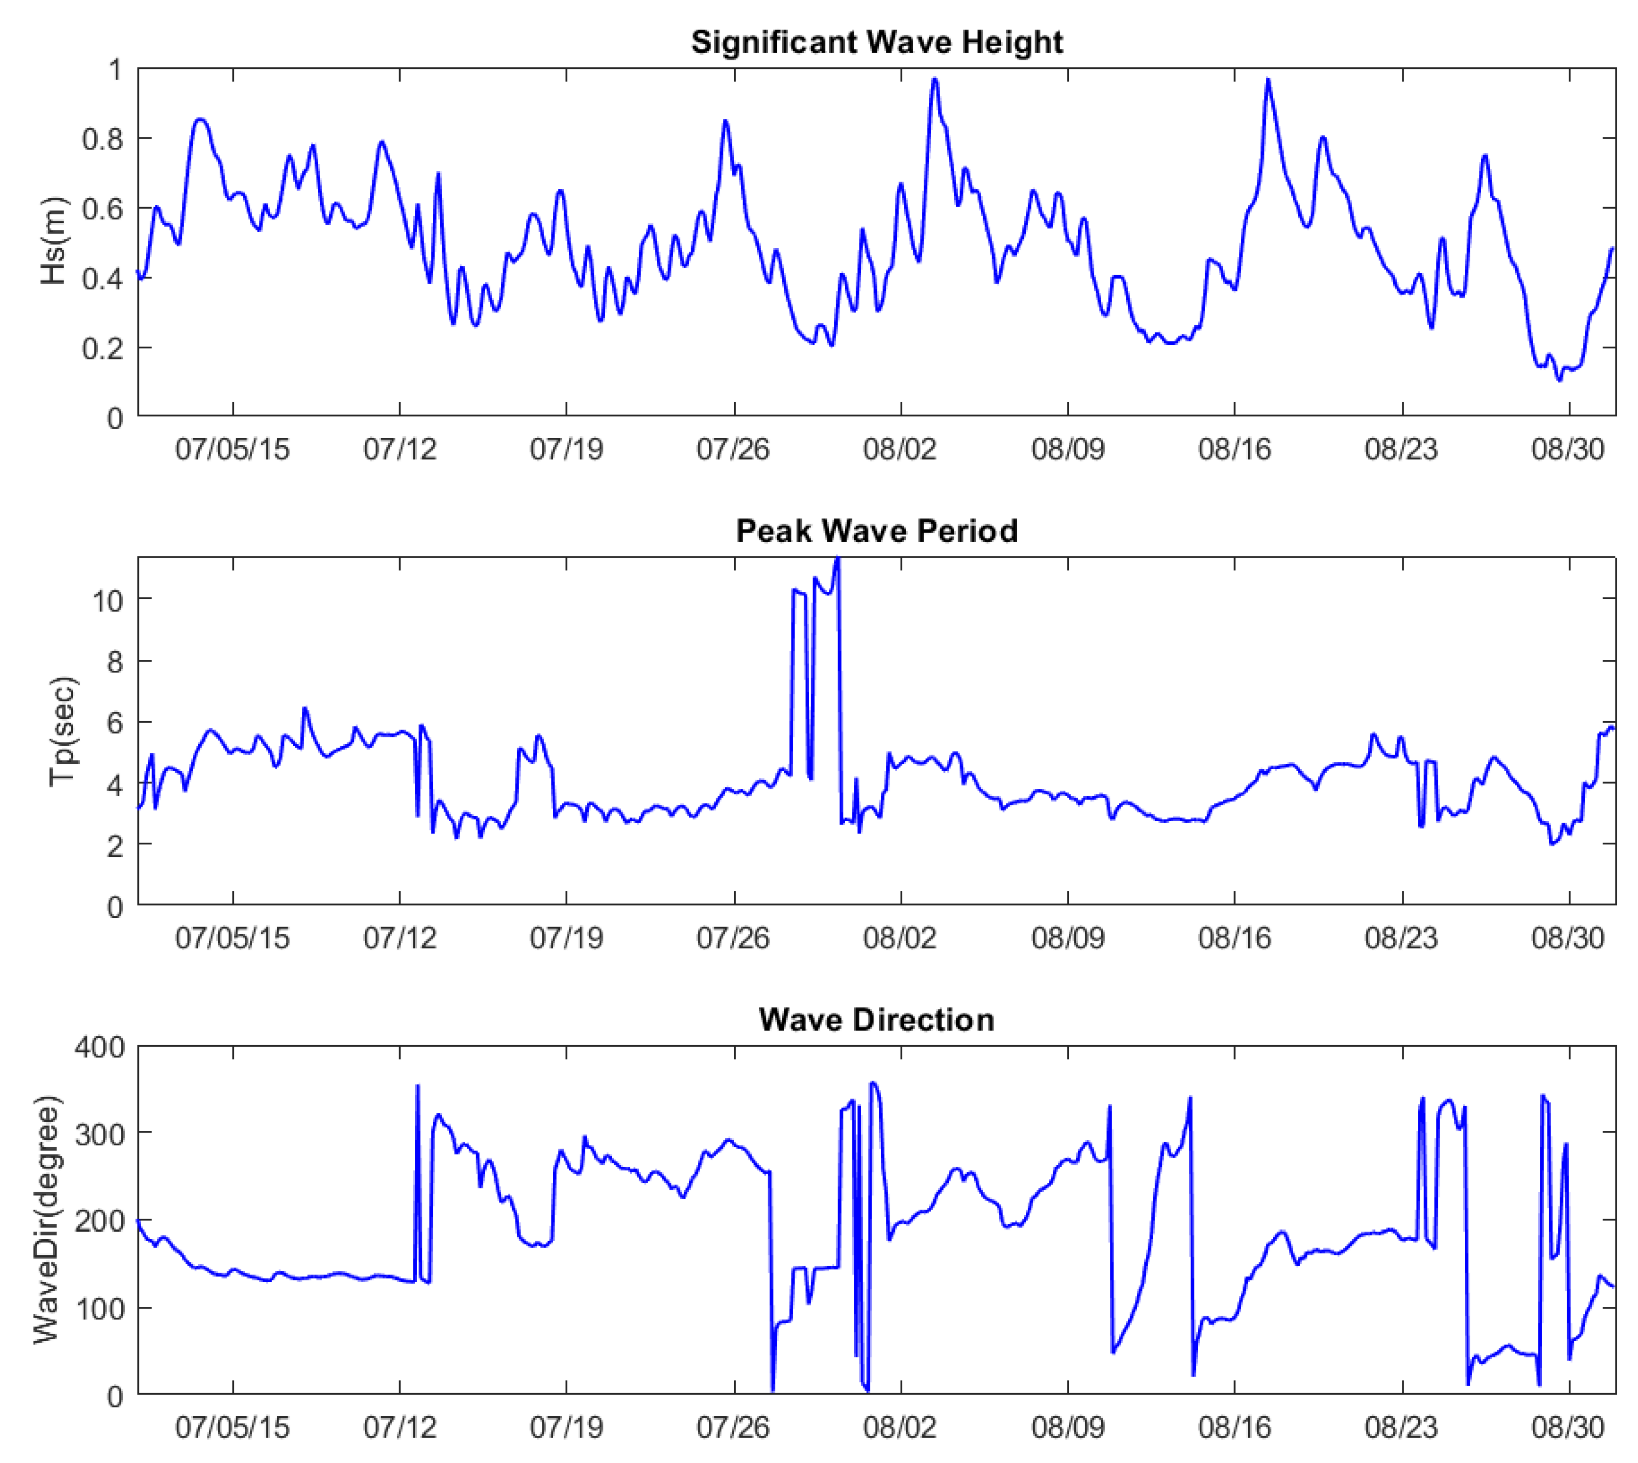
Boundary conditions along the open boundaries of the model were obtained from the Gulf of Mexico and the Northwest Atlantic 30-year hindcast by NOAA. The database was prepared by long-term simulation of waves using WAVEWATCH-III (WWIII) [34] forced by hourly winds from CFSRR. The spatial resolution of the WWIII model is 1/6 degree, and the temporal resolution is three hours. The model uses the ST4 physics package to include exponential wave evolution and whitecapping [35]. ST4 is an older whitecapping parametrization than ST6 and represents the dissipation of wind-generated waves in the spectral space considering wave breaking statistics and the attribution of swell decay as propagating over the oceanic basins. This formulation was derived to be consistent with field observation of swell dissipation [34]. Significant wave height, direction, and peak period at 3-h intervals were extracted along the three open boundaries of the model domain. Wave data extracted at the middle of the southern open boundary during the simulation period (July and August 2015) are shown in Figure 4. During this time, wave height was always less than 1 m with an average of 0.5 m, resulting from a substantial decline in wind stress over the inner and outer Louisiana shelf during summertime [19]. Regardless of small significant wave heights, peak periods were relatively large, with a maximum higher than 10 s and an average of 4.5 s, which implies swell propagation toward the inner Louisiana shelf. The dominant wave direction during this period was south to the west (180–270 degrees), which is typical during this time of the year.
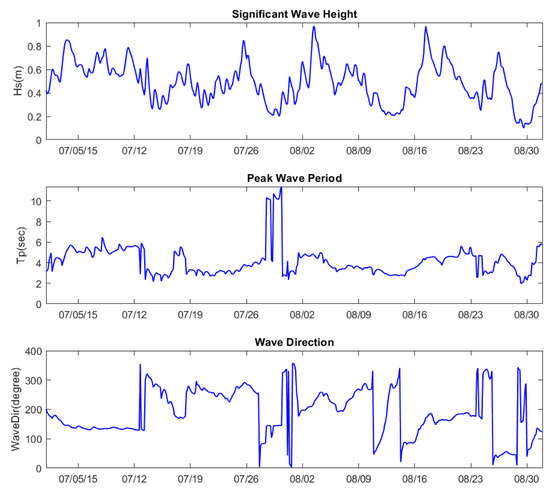
Figure 4.
Timeseries of wave parameters: significant wave height (top panel), peak period (middle panel), and wave direction (bottom panel) from the WWIII hindcast in the middle of model southern boundary during July–August 2015.
5. Model Setup
Different methods and data sources were used to find appropriate modeling parameters for model setup. Since the non-stationary mode was used for the present simulation, the computational time step was one of the key parameters. According to the recommendations of the SWAN user manual [26] and sensitivity tests, the time step of 10 min was selected. Furthermore, spectral characteristics, including the number of frequency and directional bands, minimum frequency, and maximum frequency, were obtained based on the tested values in the literature (e.g., [33,36,37,38]). Table 2 summarizes the model setup for the present simulations. A JONSWAP (Joint North Sea Wave Observation Project) energy-frequency distribution with the average enhancement parameter () was selected for converting the parametric wave data to 2-D spectra following [33,38]. Other shape parameters used for JONSWAP spectrum are = 0.09 and = 0.07. As for physical parameters, a different representation of the JONSWAP spectrum compared to the traditional one is used. In this version, instead of wind speed and fetch length, wave height, and period are directly used to establish the spectrum. In SWAN, the wave height and period from the boundary condition data along with the shape parameters are directly used to establish the JONSWAP spectra. The rest of the parameters for resolving different source terms were selected based on the default values from SWAN documentation (SWAN, 2015). For whitecapping dissipation and wind input, three different approaches, including Komen [3], Westhuysen [4], and ST6, were examined to determine the most appropriate one for the study area.

Table 2.
Summary of model setup parameters.
6. Evaluation of Whitecapping Formulation
The whitecapping formulations and the model setup configurations are shown in Table 2. The model was run for July and August 2015. For the present simulation, examining different whitecapping formulations could be relevant due to the specific wave climate of the Louisiana shelf during summer. In this area, waves generated by local winds (seas) dominate during the non-summer months, while a combination of seas and swells could dominate during summer.
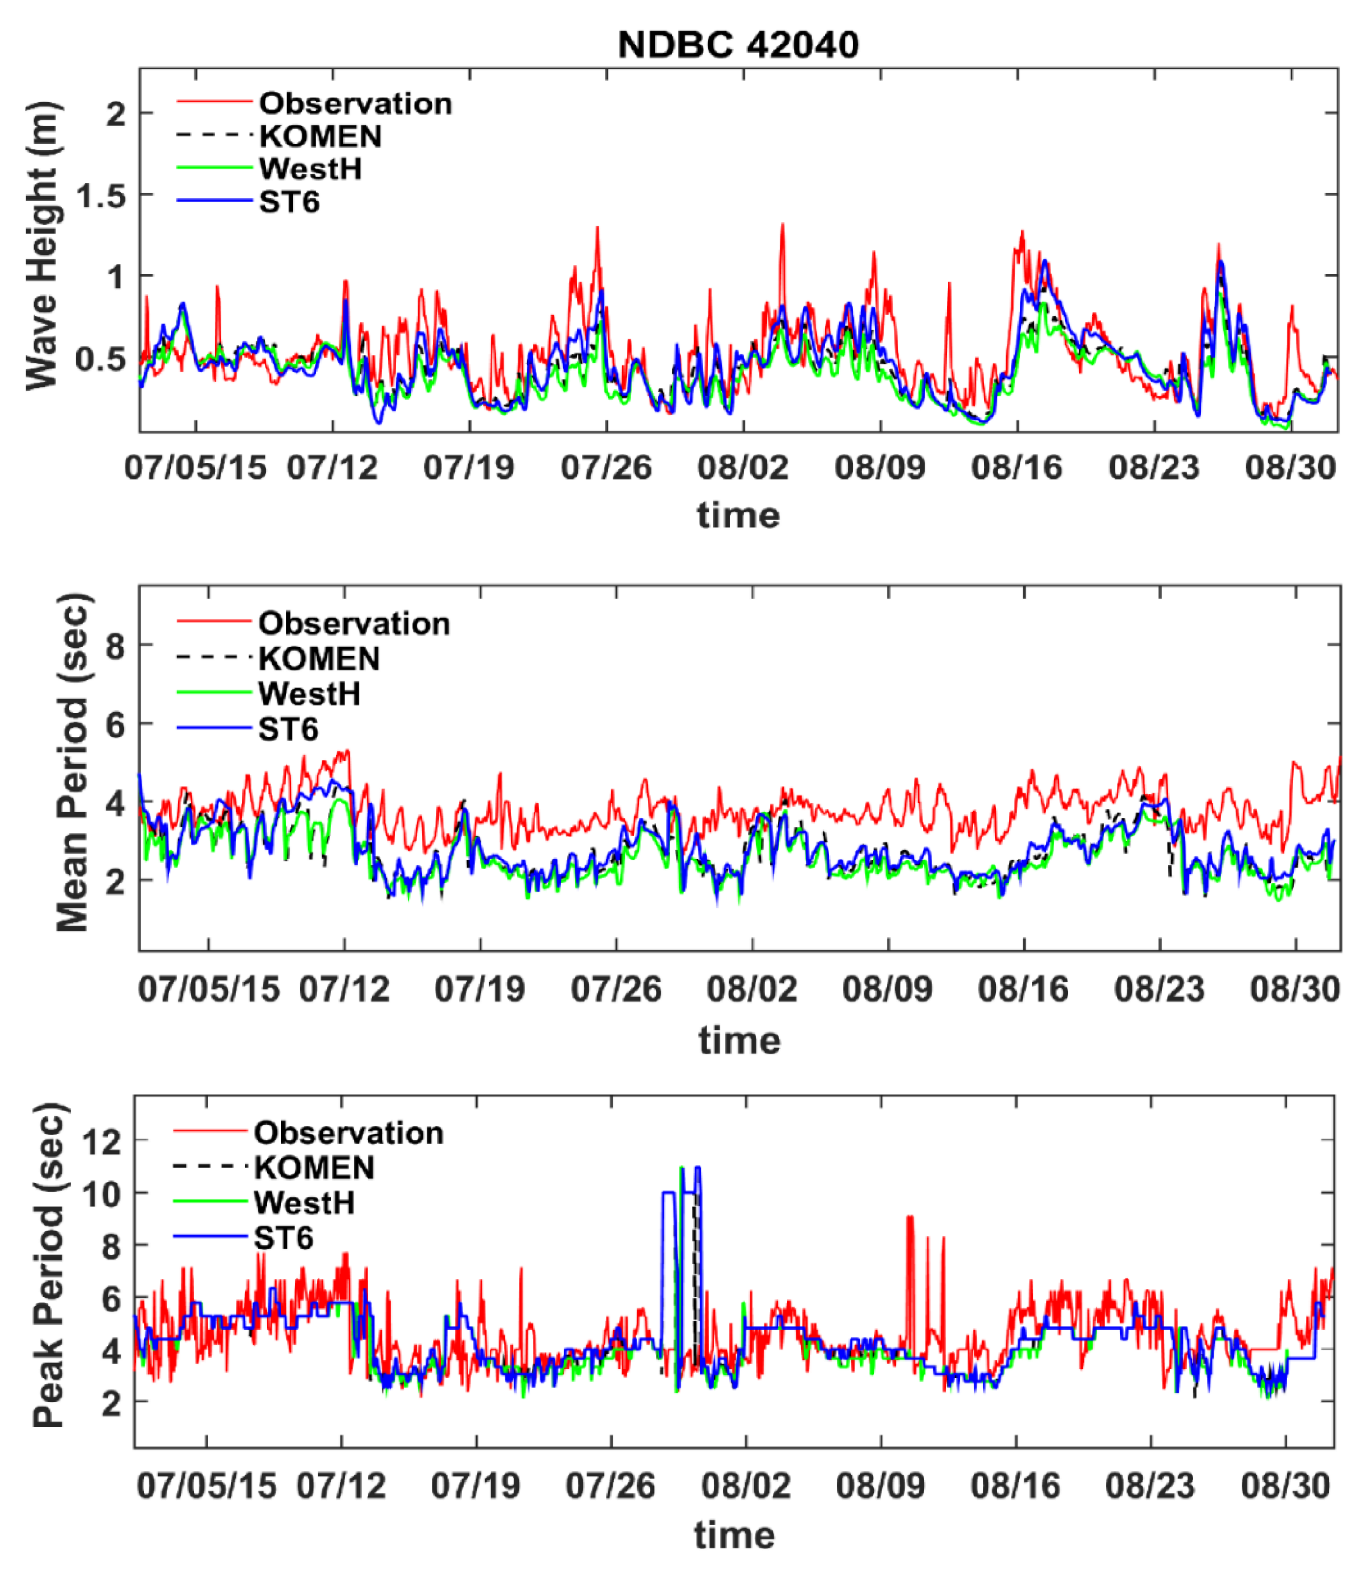
Simulation results for different whitecapping formulations were compared with observations at two stations, LOPL1 and 42040, on the west and east of the Mississippi birds-foot Delta, respectively. At NDBC 42020, wave height, mean wave period, and peak wave period were measured that were used for model evaluation (Figure 5). Timeseries comparison for wave height shows that all whitecapping formulations underestimate wave height during the two months of simulation. The maximum wave height during the two months of simulation at this station is 1.4 m, with several other peaks during this time. The simulation results underestimated almost all these peaks.
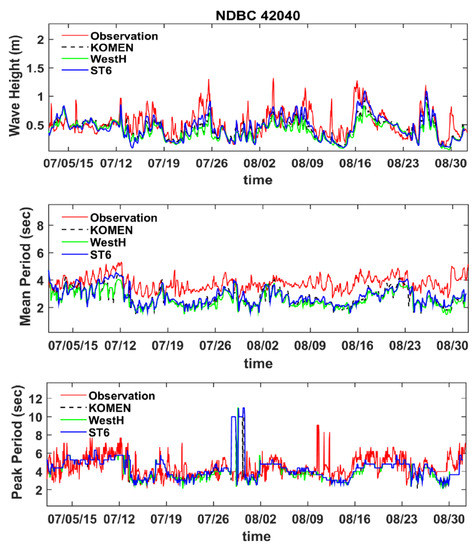
Figure 5.
Comparison of simulated wave parameters using different whitecapping formulations with observations at NDBC 42040 between July and August 2015.
However, ST6 resulted in higher wave heights closer to observations than the other two formulations. All three formulations simulated similar mean wave periods that generally underestimated the observed wave mean period by about 1 s. Underestimation in significant wave heights and mean wave periods could be partly due to the accuracy of wind and boundary condition data discussed in Section 7.3. However, a part of this inconsistency is attributed to the model physics associated with wind input and whitecapping dissipation. This is discussed in Section 7.1 and Section 7.2. All three models perform relatively well in estimating the wave peak period, and it is evident that the non-linear wave interaction approach used in SWAN is an appropriate method of transfer of wave energy to the spectral peak within the frequency domain. Some discrepancies in the simulation of the peak period can be described by examining the accuracy of the boundary condition data (Section 7.3).
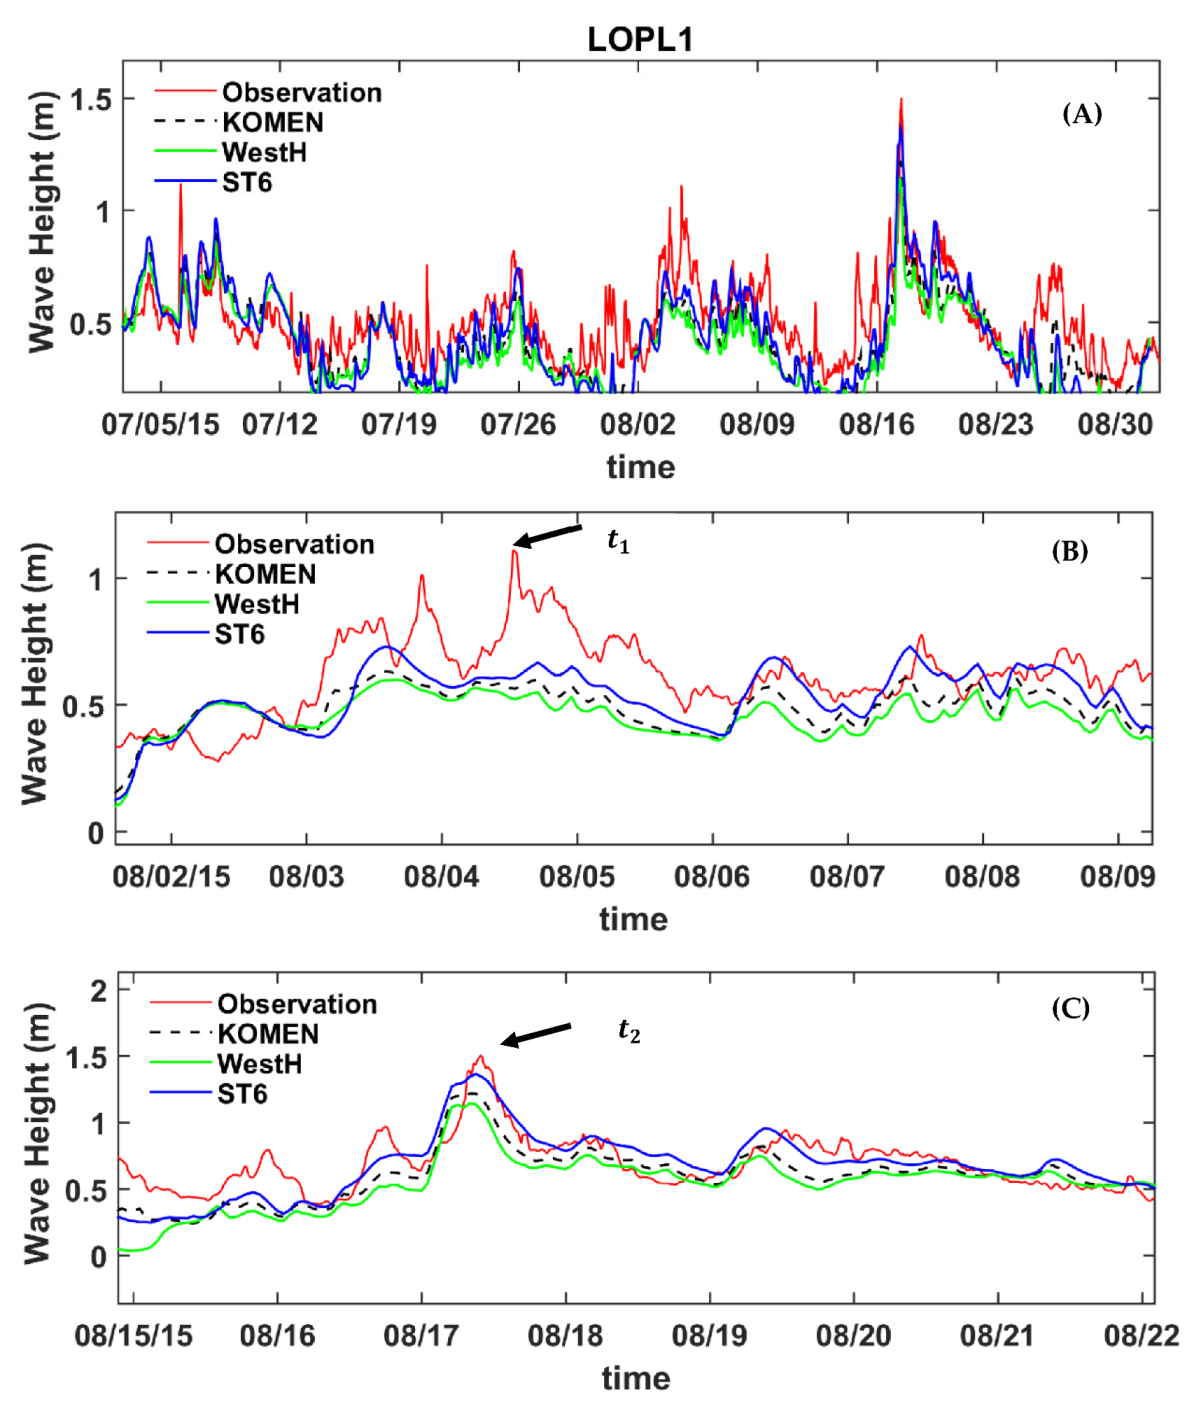
Station LOPL1 is located on the Louisiana inner-shelf 65 km west of the birds-foot delta. At this station, only wave height measurements were available during the simulation. Simulated wave heights for all three whitecapping formulations are compared with measurements at this station (Figure 6). The maximum observed wave height between July and August 2015 at LOPL1 is 1.5 m, slightly larger than NDBC 42040. Similar to NDBC 42040, at this station, wave height is generally underestimated by all whitecapping, with ST6 exhibiting the largest wave heights that are more consistent with observations (Figure 6A). For a more detailed examination of the simulation results at this station, two distinct events of larger wave heights focusing on the peak values at and (Figure 2) are considered (Figure 6B,C). Figure 6B shows a close view of model results compared with measurements for one week from 2 to 9 August 2015. Although all model approaches missed the peak of wave height at time , the better performance of ST6 is clear. As shown in Figure 3, this peak corresponds to wind from west to southwest with a speed of 4–6 m/s over the Louisiana shelf. The second investigated time slot from 15 to 22 August 2015 focused on time (Figure 6C), which is an excellent example of the high performance of ST6 during the simulation. Two distinct wind directions, southwest and southeast, were dominant on the western and eastern parts, respectively, of the model at this time when wind speed exceeded 7 m/s (Figure 3).
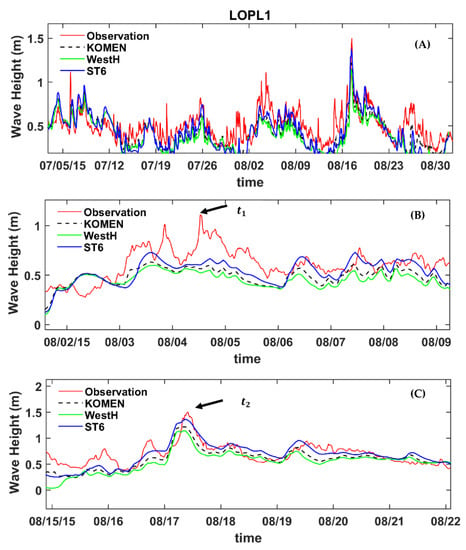
Figure 6.
(A). Comparison of simulated wave height using different whitecapping formulations with observations at LOPI1 between July and August 2015, (B) detailed comparison focusing on time , (C) detailed comparison focusing on time .
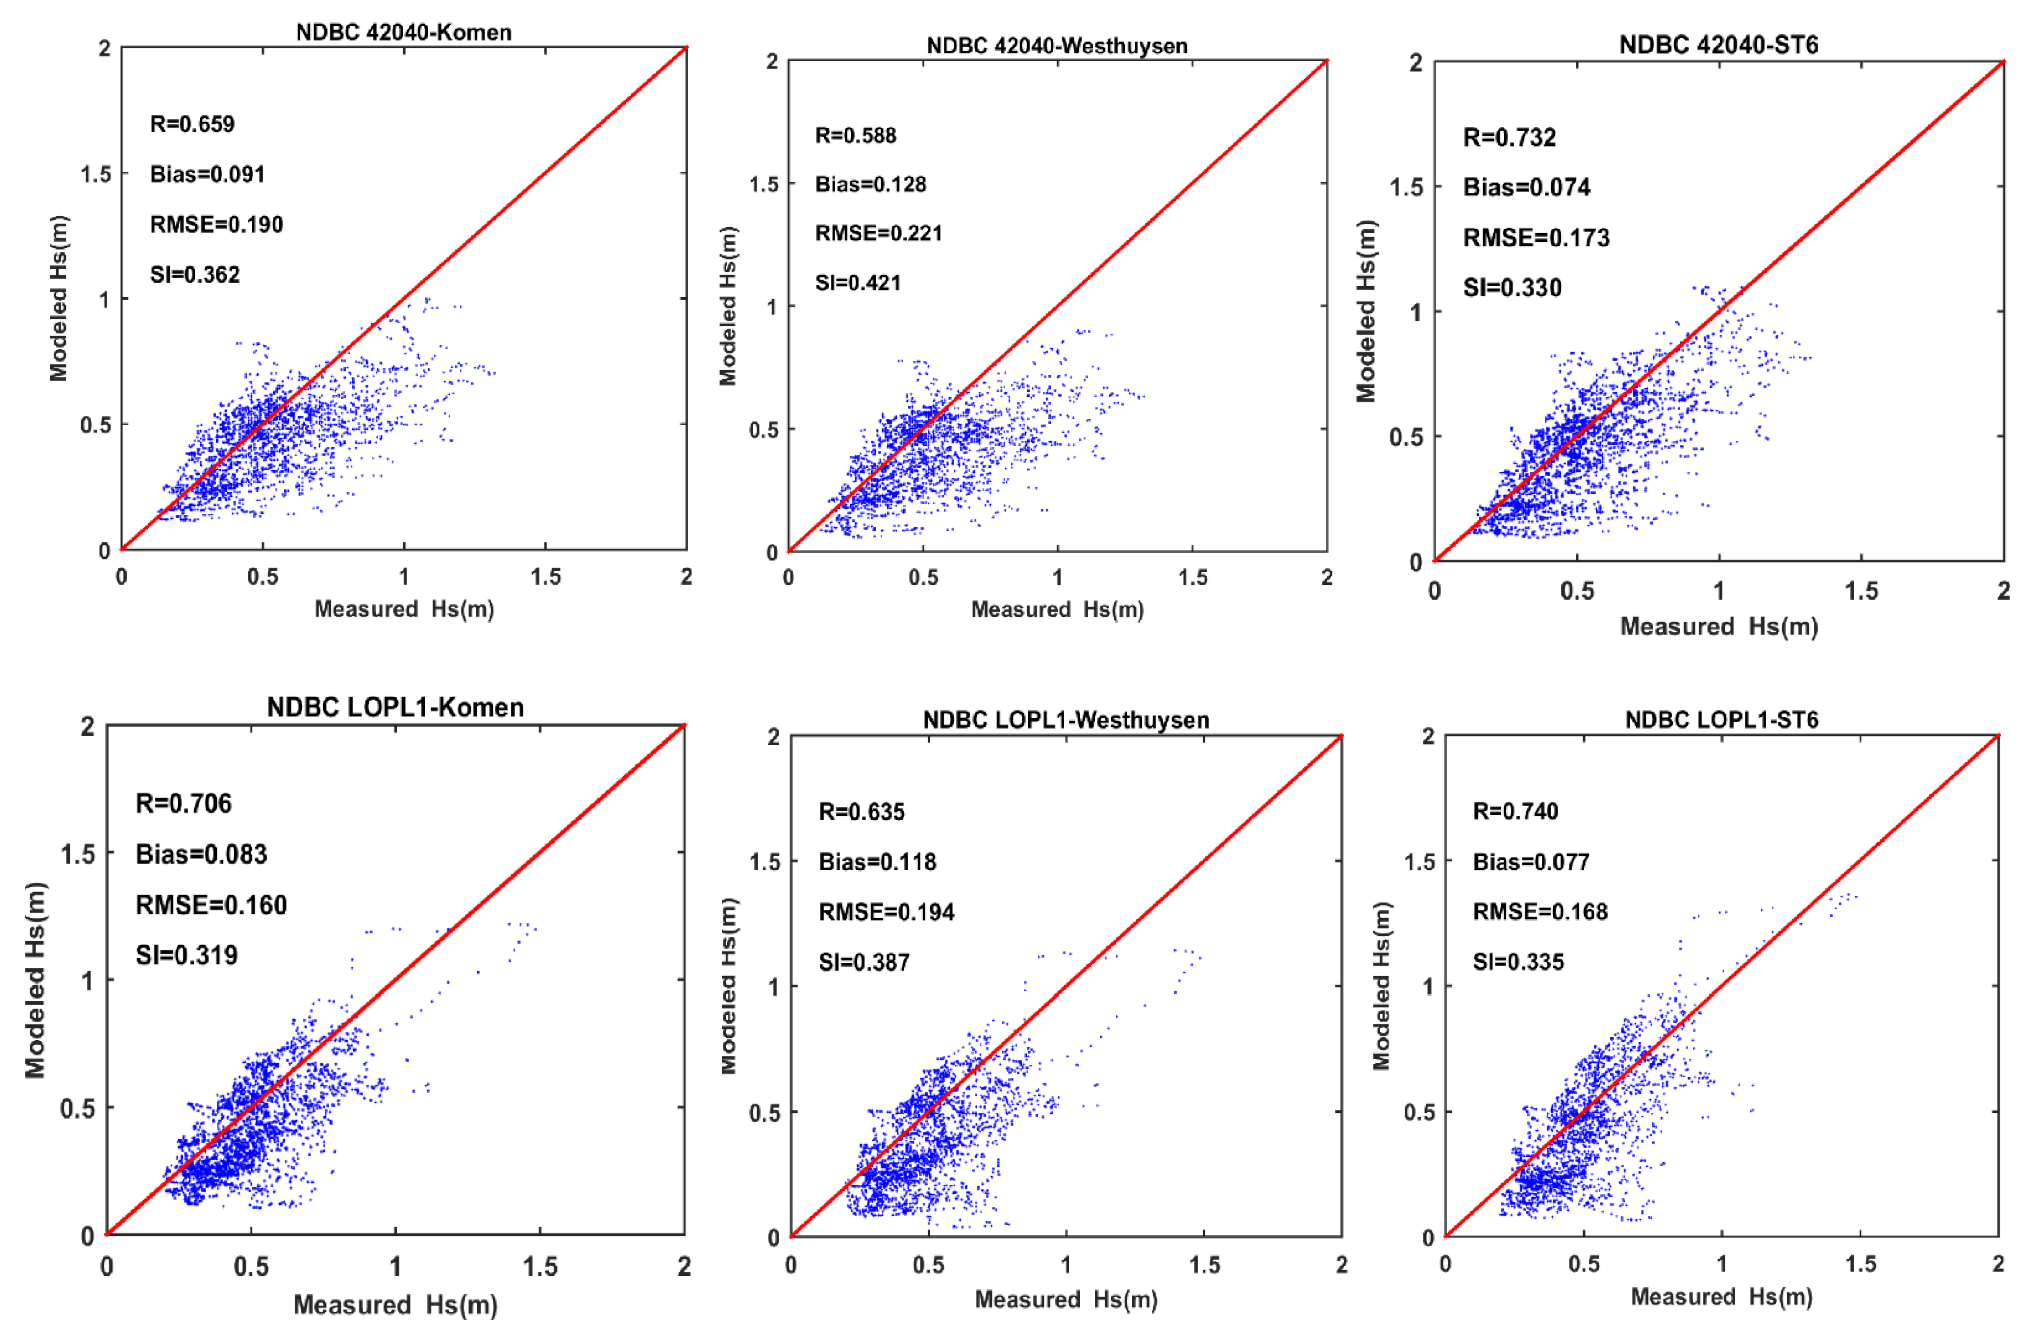
To quantify the performance of each whitecapping formulation in simulating wave heights at these two stations, four standard metrics, including Pearson correlation coefficient (R), bias, root mean square error (RMSE), and scatter index (SI), were employed (Appendix A for detailed formulations). As expected, the metrics show a better performance of ST6 at both stations (Figure 7). At NDBC 42040, using the ST6 increases the correlation coefficient to 0.732 compared to 0.588 and 0.659 for Westhuysen and Komen, respectively. Bias and RMSE as metrics representing the model general and average error decrease when using ST6. For example, the RMSE value decreases to 0.173 m compared to 0.221 m and 0.190 for Westhuysen and Komen, respectively. A similar pattern is shown at LOPL1. For instance, the bias at this station decreases to 0.074 m, while for Westhuysen and Komen, the bias is 0.128 m and 0.091 m.
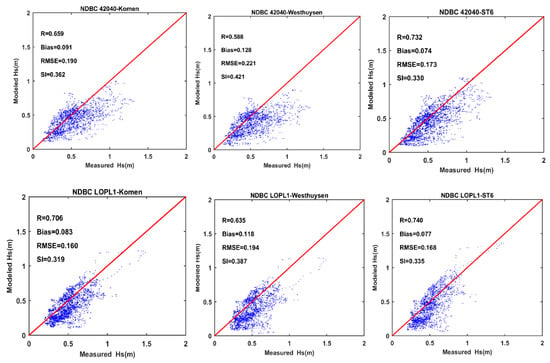
Figure 7.
Scatter plots and model performance statistics for simulated wave height using the three whitecapping formulations compared to observations. Upper panels: NDBC 4040, lower panels: LOPL1, left panels: Komen, middle panels: Westhuysen, right panels: ST6.
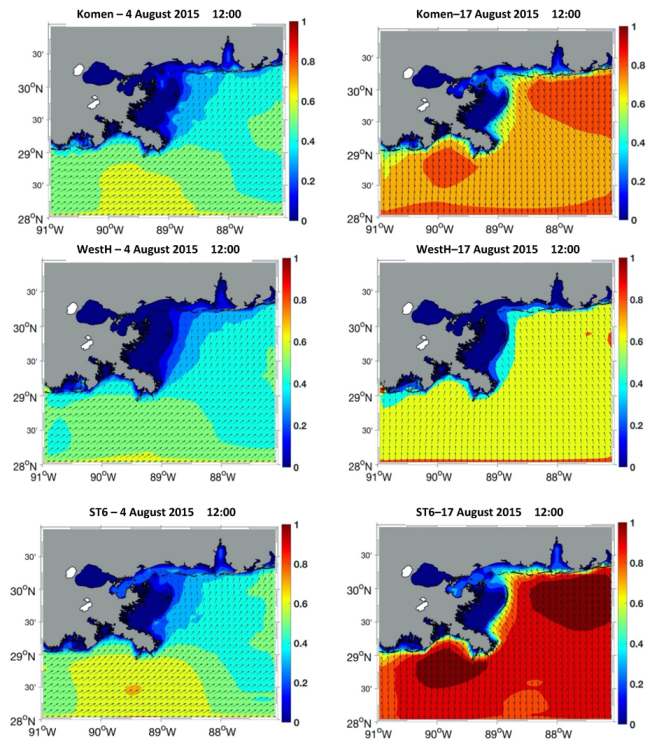
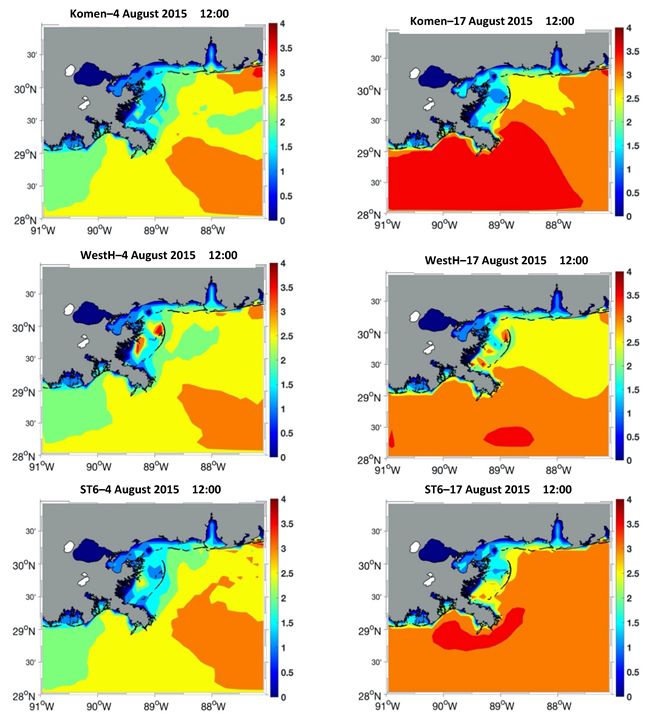
Examples of simulation result for the wave height, direction, and mean wave period at two timesteps of and using each of the three whitecapping formulations are presented in Figure 8 and Figure 9. As seen in Figure 5, Figure 6 and Figure 7 and discussed before, the simulated wave height from ST6 was generally larger than the other two formulations. At time , ST6 and Komen have similar spatial distributions for the wave height, which correspond to the westerly wind direction. However, ST6 shows a broader area for the larger wave heights and an additional core with slightly larger heights than the surrounding areas. Westhuysen represents the smallest wave heights and shows more differences from the other two methods. At time , the differences between the approaches are much more distinct, and again, ST6 simulated the largest wave heights that are more than 1 m on the west of the birds-foot delta and off Mobile, Alabama. As with time , Westhuysen simulated the smallest wave heights, generally around 0.6 m. This underestimation is due to the approach that the model energy balance was maintained during the development of this formulation. This is discussed in the next section. Unlike the wave heights, simulated mean wave periods using the three approaches are more or less similar, especially at time with lower energy waves than time . This is also evident in Figure 5, showing the timeseries of the mean wave period during the two-month simulation period. At time , all models show a maximum of 3 s for the mean wave period with a similar spatial pattern (Figure 9; left panel). The differences are clearer for the higher energy timestep (). At this time, the Komen simulation generates broader offshore areas with a maximum wave period of 3.5 s, which is different from the other two models (Figure 9, right panel). Additionally, over the inner-shelf region on the east of the birds-foot Delta, Westhuysen underestimated the wave period compared to the other two models. These behaviors can be explained based on these three models’ wind input/whitecapping formulations. This is discussed in the next section.
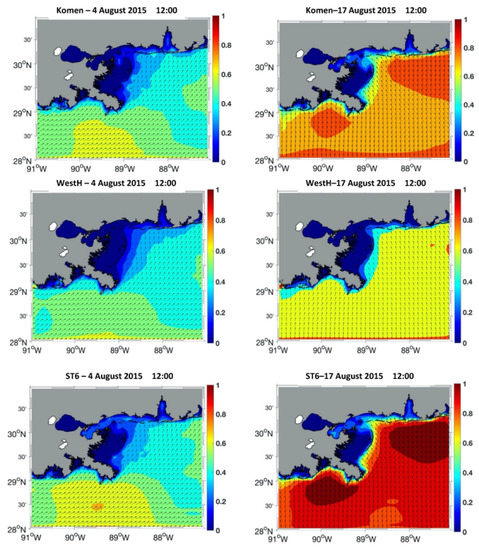
Figure 8.
Significant wave height (Hs) (m) and direction at (8/4/2015; 12:00, left panels) and (8/17/2015 12:00, right panels) corresponding to simulations using Komen, Westhuysen, and ST6 whitecapping formulations.
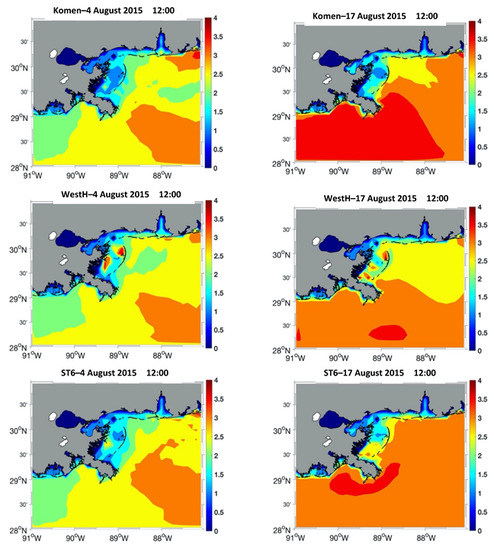
Figure 9.
Mean wave period (s) at (4 August 2015; 12:00:00) and (17 August 2015) correspond to simulations using Komen, Westhuysen, and ST6 whitecapping formulations.
7. Discussion
7.1. Model Performance in Simulation of Spectral Variations
Estimating wave parameters in spectral models such as SWAN proceeds with generating wave frequency-direction spectra using the direct energy input from winds and the energy transported to each computational grid from open boundaries. Each wind input/whitecapping formulation has its wind energy transfer relationship to the water surface and the corresponding approach for the evolution of frequency-direction spectra. In deep water and in the absence of the shallow water effect (as is the case for most of the modeling region with regard to the dominant wave height and period), wind input, whitecapping dissipation, and non-linear wave-interaction account for developing and stabilizing the shape of the frequency spectrum, its peak frequency, and energy peak. The directional distribution also depends on the rate of energy transfer to different directions with various deviations from the wind direction that also depends on the type of wind input/whitecapping formulation used in the modeling.
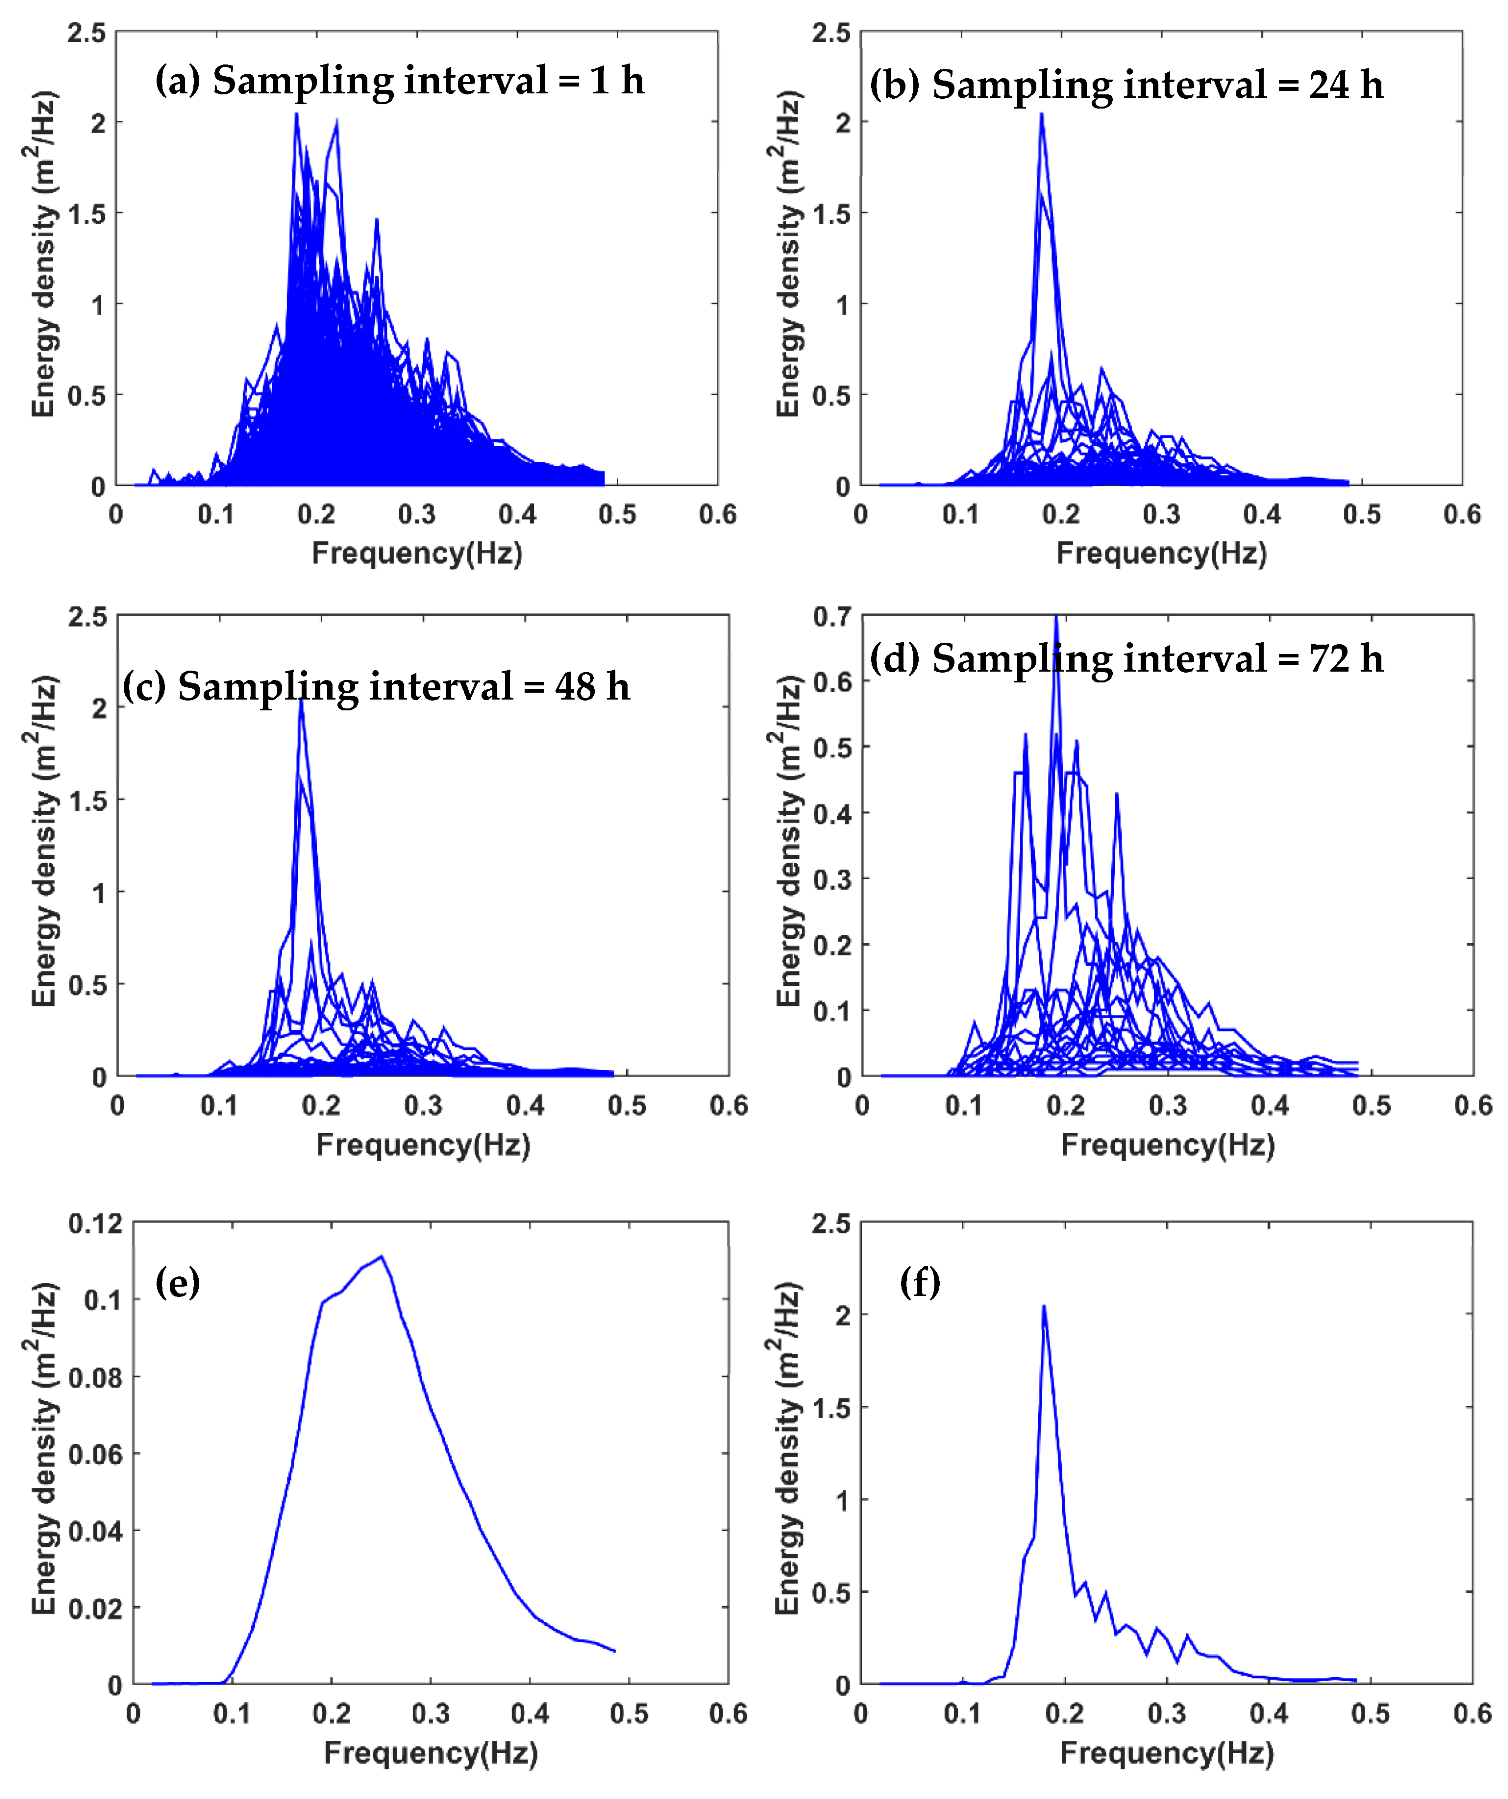
Before evaluating model performance in simulating the frequency spectra in the study area, it would be helpful to examine the observed spectra during the simulation period to understand the dominant frequency and spectral shapes during this period. Among the two stations used in this study, only NDBC 42040 included frequency spectrum data measured every one hour. The frequency of resolution of spectral data measured by NDBC buoys varies from 0.005 Hz to 0.02 Hz depending on the frequency. It should be noted that NDBC does not provide the spectral confidence limit for the spectra measured by buoys. It can be calculated using the available raw spectral data and using the Chi-square probability distribution, but is not in the scope of this study. In this study the main purpose of presenting the measured spectra and comparing the measured spectra with simulation results was showing the general model consistency with observations, not a quantitative/statistical analysis. Frequency spectra measured at this location were plotted at different sampling intervals to convey useful information about the spectral properties of the station during the simulation period (Figure 10a–d). The smaller sampling interval of 1 h was used to show the general frequency band and energy ranges available in the measurements, while the larger sampling intervals (24, 48, and 72 h) were used to show the spectral shapes more clearly. Although, due to the instrument limitation, the maximum measured wave frequency is 0.48 Hz. The 1-h plot shows that this frequency almost corresponds to near-zero energy on the high-frequency tail of the spectrums. Therefore, it can be inferred (Figure 10) that the peak frequency during these two months is 0.15–0.25 Hz with a dominant value of 0.2 Hz. From lower time resolution spectra (every 24, 48, and 72 h), it can be inferred that the frequency spectra can take single peak, double, or even multiple peak shapes depending on the available wind and swell systems. The average measured spectrum during this period shows a single peak spectral variation with the peak frequency of 0.25 Hz and the energy peak of 0.11 m2/Hz (Figure 10e), while for the spectrum corresponding to the maximum spectral peak, the values of peak frequency and energy peak are 0.18 Hz and 2.1 m2/Hz, respectively (Figure 10f).
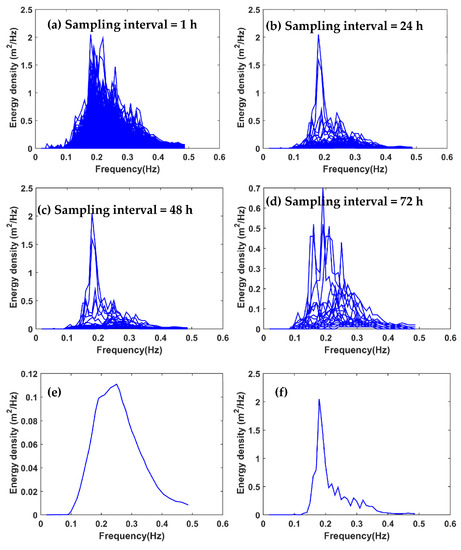
Figure 10.
Accumulative plots of measured frequency spectra at NDBC 42040 with different sampling intervals between July and August 2015, (a) sampling interval = 1 h, (b) sampling interval = 24 h, (c) sampling interval = 48 h, (d) sampling interval = 72 h, (e) average spectrum between July and August 2015, (f) the spectrum corresponding to the maximum spectral energy peak during this period.
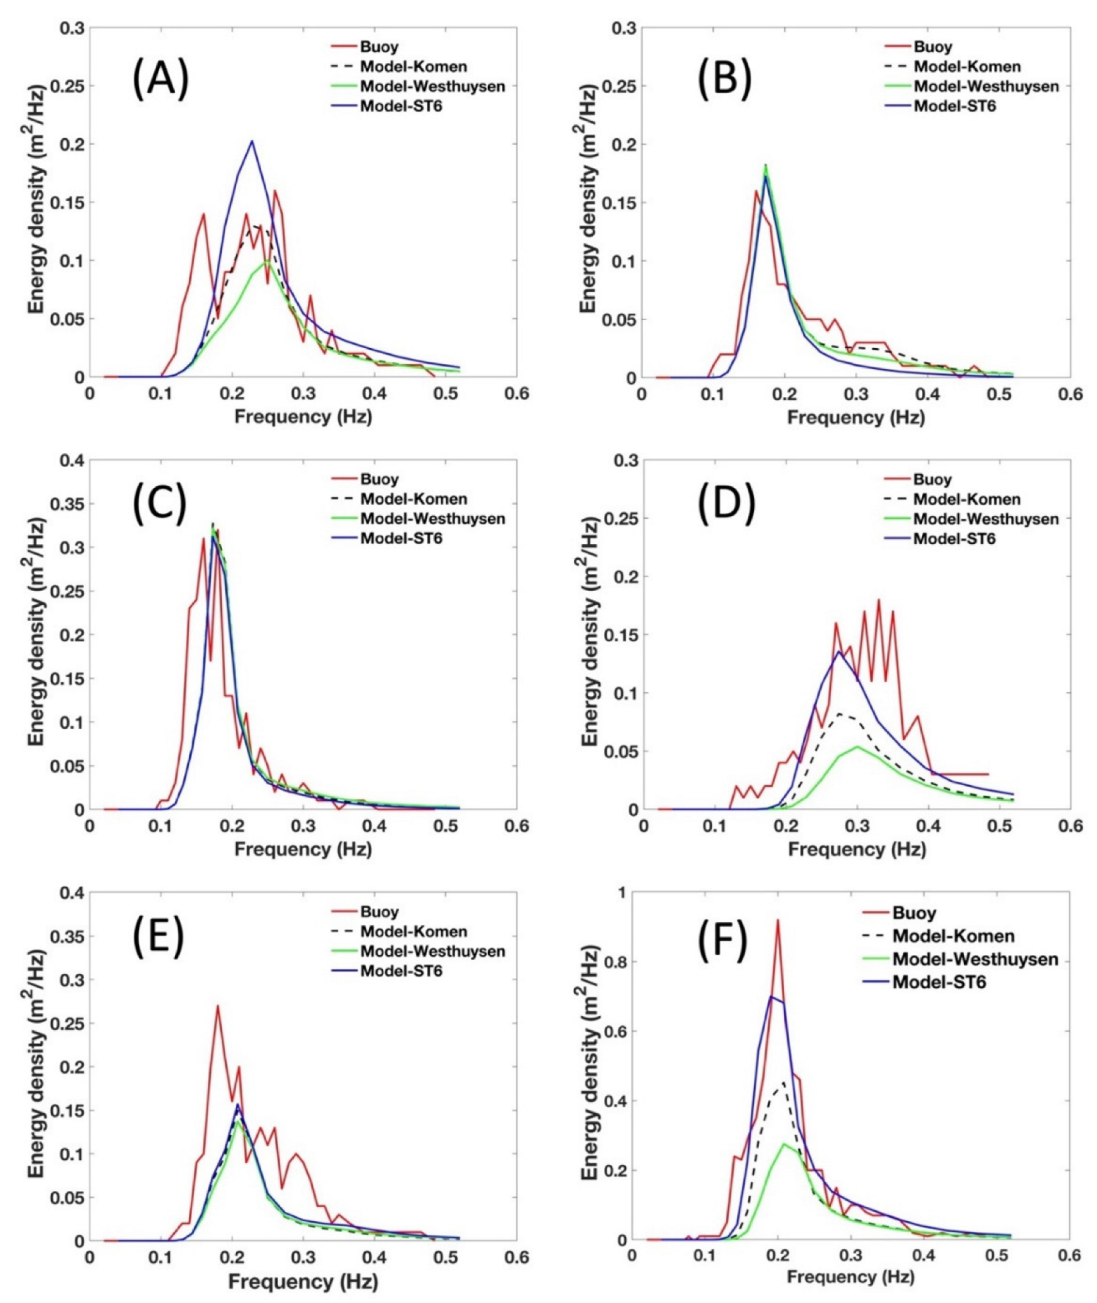
A comparison of simulated frequency spectra (Figure 11) at NDBC 42040 using the three whitecapping formulations with measured spectra shows that, generally, ST6 simulated higher spectra peaks than the other two methods, while the simulated peak frequencies are more or less similar for all three methods. Figure 11 shows sample comparisons for six different times, including time and , formerly used to examine wind field and wave parameters. In most cases, Komen and Westhuysen underestimate the energy corresponding to the higher frequency lobe of the spectrum, although ST6 underestimated this part in some cases too. All the models fail to simulate the additional peaks that appeared in this higher frequency part (Figure 11B,D,E). It indicates that during the low energy wave incident, the model may not perform well in representing the double/multiple wave systems. Several reasons can contribute to this underestimation. One main reason can be the effect of short-term wind speed and direction fluctuation that is smoothed when using the one-hourly modeled wind for simulation. These fluctuations can produce short waves that may contribute to additional high-frequency peaks in wave spectra. These fluctuations can generate the high-frequency peaks in Figure 11B,E. Additional peaks in the frequency spectrum appear when multiple wave systems are present. Usually, high-frequency wind waves are combined with low-frequency swells. However, in cases that swells are low energy with a low peak period, some of their energy is transferred to the high-frequency lobe of the spectrum. This could be the case for some periods with minor swell energy. In these cases, if the peak period of the boundary swells is not accurate enough, the high-frequency energies in the spectrum could be underestimated. The following section presents more details about the accuracy of the boundary condition data. In the case of Komen formulation, failing to represent double/multi-peaked spectra could be regarding the intrinsic properties of this approach in overestimating the dissipation in a mixed seas-swell sea state [4,23]. Since the dissipation in this approach is a function of average spectral properties, the distinction between seas and swells may not be accurate. Westhuysen formulation, as seen, significantly underestimates the spectral peak of energy and energy corresponding to the low-frequency lobe of the spectra. This is consistent with the wave height underestimation of this approach, as shown in Figure 5, Figure 6, Figure 7 and Figure 8.
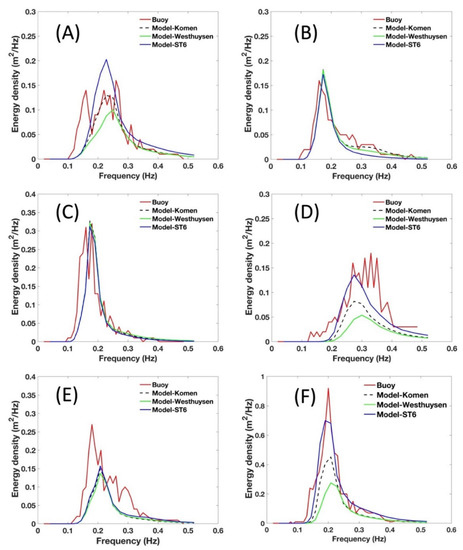
Figure 11.
Wave spectrum on (A) 3 July 2015; (B) 10 July 2015; (C) 11 July 2015; (D) 23 July 2015; (E) 4 August 2015 (), and (F) 17 August 2015 ( ).
The Westhuysen approach’s tendency to underestimate wave energy and wave height has also been reported by [23] along the U.S. East Coast during high energy nor’easters. They found that this model needs more calibration to comply with the traditional growth curves [22]. Specifically, they argued that this approach could underestimate the wave energy during the fetch limited wave growth. Significant underestimation of wave height at time , which is almost fetch-limited, is consistent with this conclusion. The underestimation of spectra peak by Westhuysen and Komen and the better performance of ST6 during storm conditions has also been reported by [39] for the North Sea. Spectral energy underestimation by Komen and Westhuysen formulations also occurs for higher and lower frequencies than the peak frequency. Hence, the simulated frequency spectra by these two formulations are generally narrower than those of ST6 in the frequency domain.
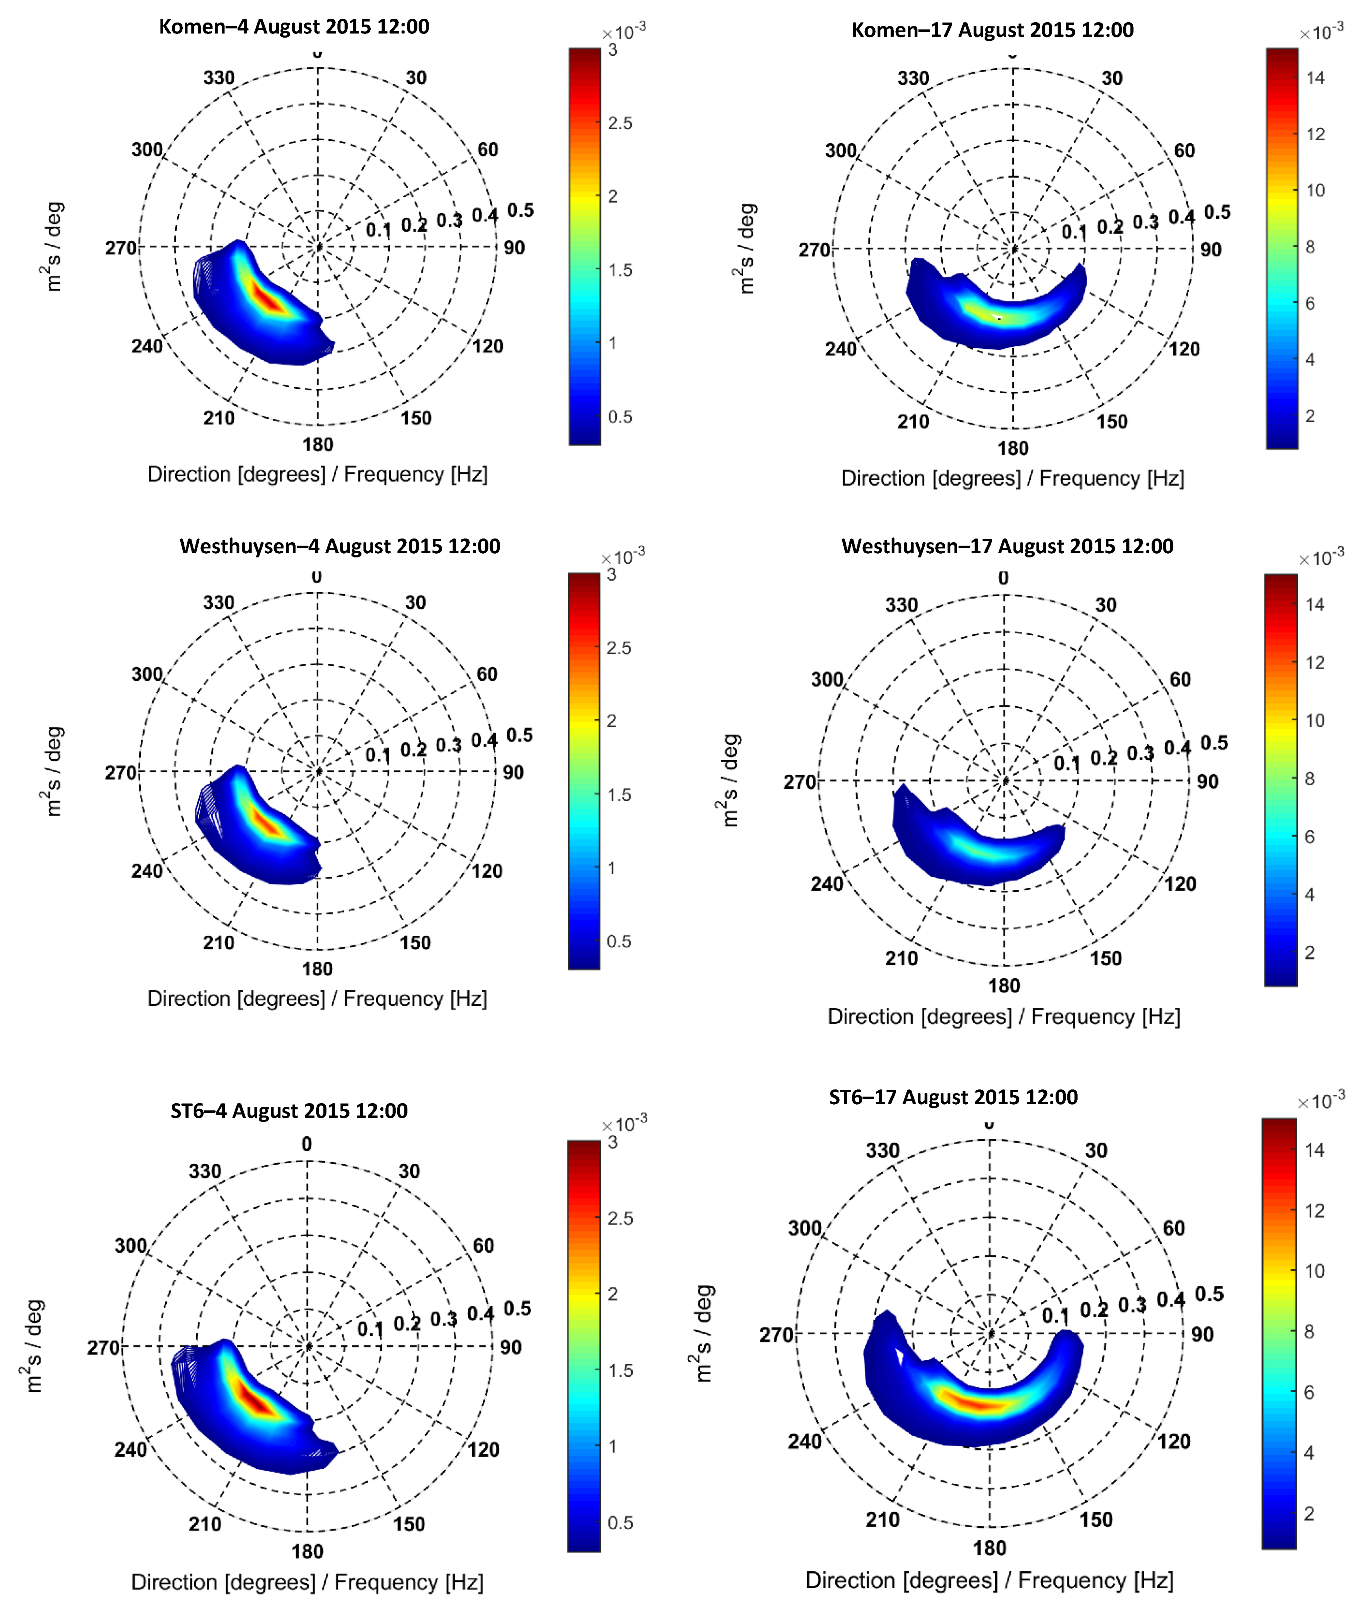
The different performance of the three whitecapping formulations has also been investigated by examining simulated 2D (frequency-direction) spectra. The comparisons for time and at LOPL1 (Figure 12). At time , all three simulated 2D spectra show the general direction of the southwest for the spectral components. However, ST6 simulated a broader spectrum in directional space, especially for the high energy core of the spectrum. While for Komen and Westhuysen, wane energy spreads from 180 to 20 degrees (clockwise), ST6 covers the directional sector between 165 and 270. This wider spreading regarding ST6 is clearer at time (right panels). At this time, the directional coverage of ST6 simulation is from 90 to 285 degrees, while this coverage for the other two formulations is from 130 to 270 degrees. The narrower directional coverage of spectra simulated by Komen and Westhuysen is consistent with [23], which compared the simulated spectra with observations. Ref. [40] stated that this narrow directional coverage is an intrinsic shortcoming of whitecapping formulations such as [21], which is very similar to [2]. They reported that whitecapping approaches and their wind input counterpart might not be able to simulate spectral opponents with large directional deviations from the mean wind direction due to their interaction with the quadruplet (non-linear interaction) term. Similar to frequency spectra, ST6 showed higher energies in the high energy core of the spectra.
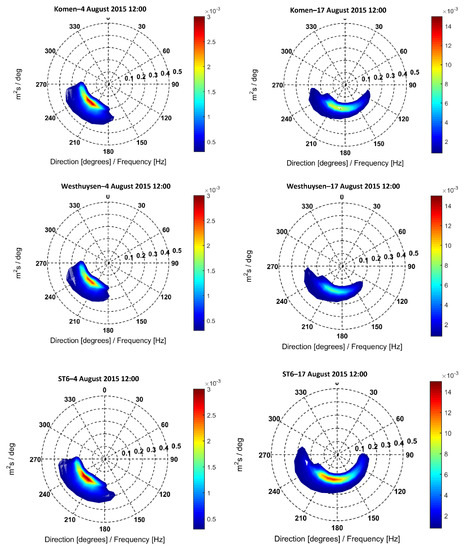
Figure 12.
Simulated frequency-direction spectra by different whitecapping formulations at LOPL1 at (left panel) time and (right panel) time .
7.2. Effect of Source Term Balance on Simulation Performance of Each Whitecapping Formulation
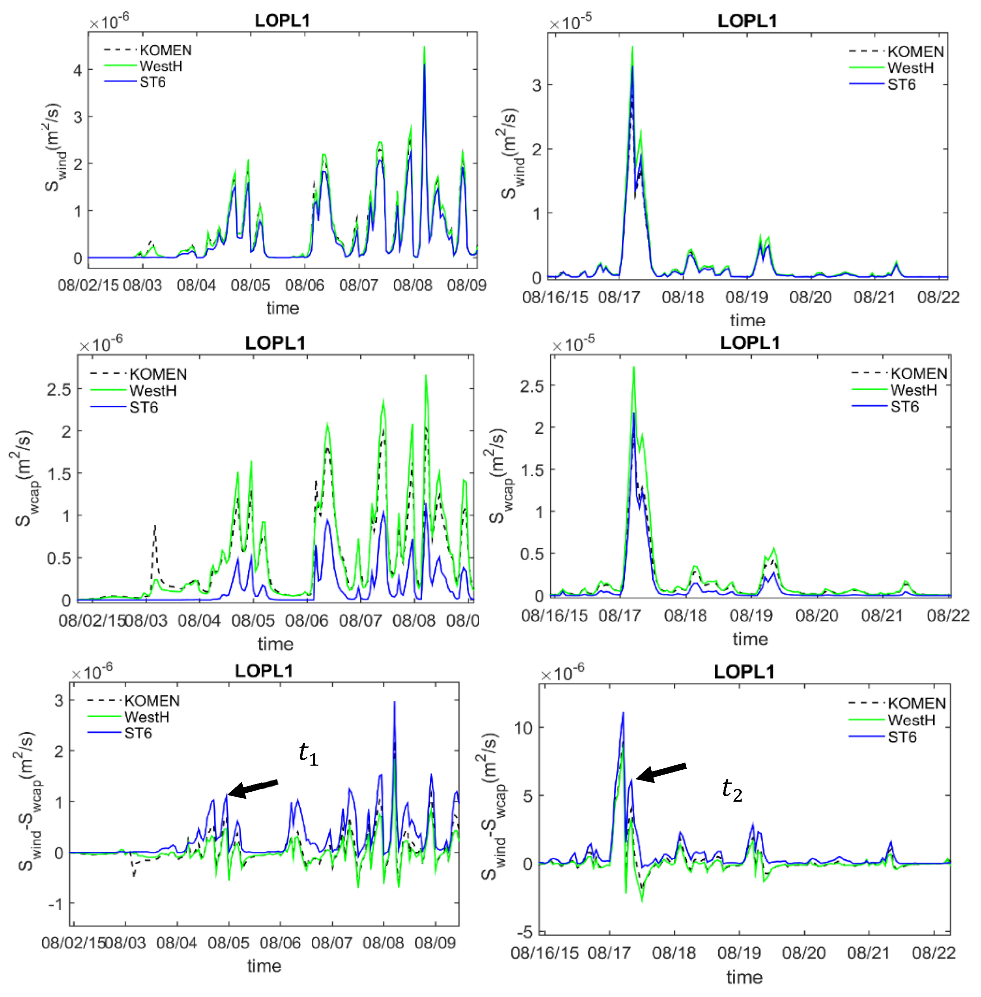
Three main source terms, including wind input, whitecapping, and quadruplet, contribute to the evolution of wave spectra. The generated spectral energy is balanced and redistributed at each timestep by whitecapping and quadruplet, respectively [2]. The resultant source term balance contributes to the final shape of the spectra and the associate wave parameters [41]. As shown in the previous section, Komen and Westhuysen generally underestimated wave heights during the two months of simulation, while the simulated values for mean wave periods were very similar. Both parameters, especially mean wave periods, were underestimated compared to observations. These results can be described by examining the source term balance from each model. The quantified values for wind input, whitecapping, and their difference that accounts for the total energy contributing to the total energy of the spectra for all three whitecapping formulations are compared and investigated at LOPL1 and during one-week periods containing times and (Figure 13). At both timesteps, the amount of wind input regarding the three formulations are more or less similar with a Westhuysen simulating a larger wind input and ST6 simulating the smallest one (Figure 13, upper panels). Unlike the wind input, whitecapping dissipation values simulated by different models are significantly different, especially ST6, compared to the other two models. The estimated whitecapping dissipation by ST6 is 50–70 smaller than that of Westhuysen at time slot 1 and up to 20 % smaller in time slot 2 (Figure 13, middle panels). The estimated whitecapping by Komen was more similar to that of Westhuysen but smaller than that. The difference between the wind input and whitecapping dissipation shows the net amount of energy contributing to the spectral redistribution and estimating wave parameters. As illustrated in the lower panel of Figure 13, this net amount is significantly larger for ST6 compared to the other two methods. The net energy corresponding to times and is specified in Figure 13. The comparative values for the three whitecapping formulations are consistent with the wave height differences between the three models in Figure 6B,C. However, it is only at time where the simulation accuracy is acceptable. Regardless of the differences in the amount of simulated net energy consequently, all models simulate similar patterns of wave height variations. In many cases, such as time , even the pattern of variations is different from the observations. This inconsistency could be due to inaccuracies associated with input data discussed in the following subsection.
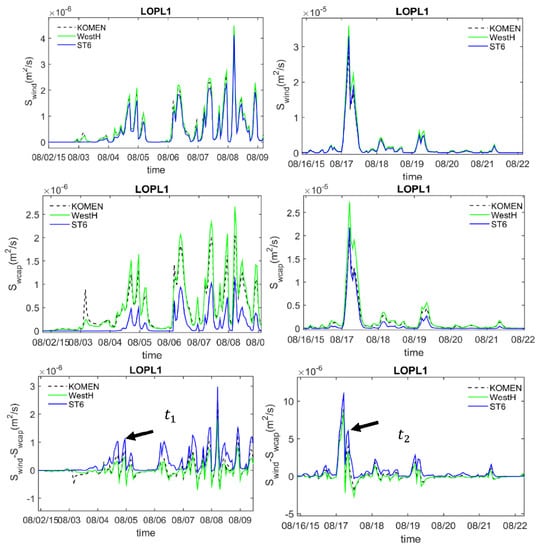
Figure 13.
Timeseries of source term variations at LOPL1 for the two-time slots focusing on (left panels) time and (right panel) time . Upper panels: wind input, middle panels: whitecapping dissipation, lower panel: wind input-whitecapping dissipation. The arrows in the two lower panels are corresponding to the peaks of wave height shown in Figure 6A,B as times t1 and t2.
7.3. Effect of Forcing Accuracy
The accuracy of model forcing directly contributes to the accuracy of simulated waves. This section investigates the accuracy of the wind field and the model boundary condition and their effect on the model accuracy.
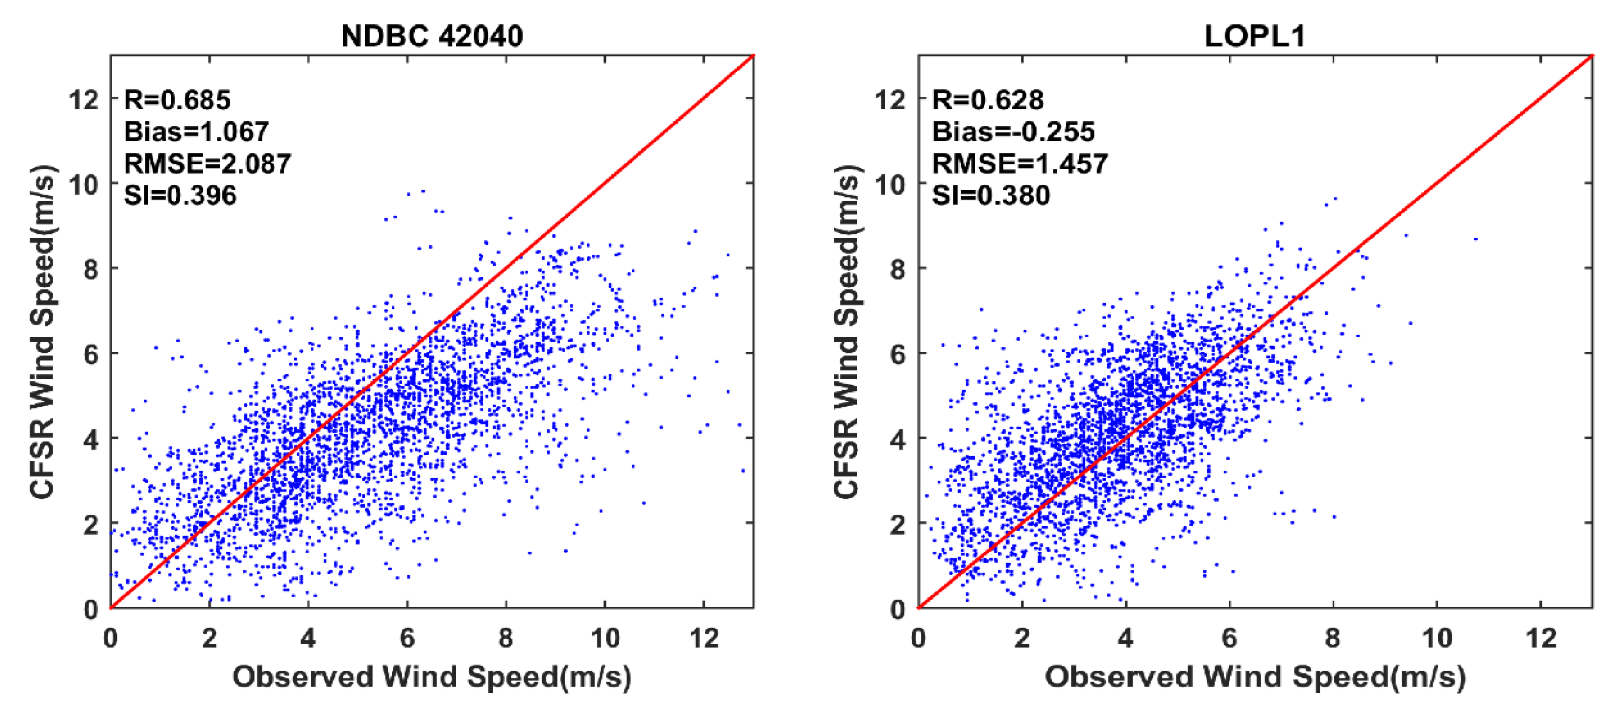
Wind is one of the major model forcings, and its energy is transferred to the surface water as fluctuations that eventually generate waves. Many studies have investigated the effect of inaccuracies in the wind field on wave modeling (e.g., [33,42,43]). For the CFSR wind field that was used in the present study, [33] showed that the average error (RMSE) in the 10 m wind speed estimation increased from 1.71 for a location 600 km off the Cape Hatters, NC, on the East Coast of the United States to 3.0 m/s for a location only 6 km from the shoreline. They also found that the scattering from the observed values can potentially increase for smaller wind speeds (smaller than 7–10 m/s). It indicates that the average error for smaller wind speeds can be even larger. In this paper, CFSR wind field used in the simulating was evaluated using the observed wind speeds at the same stations used for wave parameter evaluation (LOPL1 and NDBC 42040). The observed wind at these two stations was reduced to the standard level of 10 m and was compared with the 10 m wind from the CFSR model (Figure 14). For each station, comparison statics are also presented. The wind RMSE at NDBC 42040 and LOPL1 are 2.08 and 1.45 m/c, respectively. Since during the simulation period, wind speed is predominantly smaller than 10 m/s, this amount of error in wind speed means at least a 15–20% inaccuracy in the wind speed. Relatively low correlation coefficients (0.68 and 0.62) compared to other regions (such as that of [33] for the U.S. East Coast) show that on many occasions, CFSR wind does not follow the variation, a pattern of observations that could make significant inaccuracies in wave simulation results (such as time in Figure 6B).
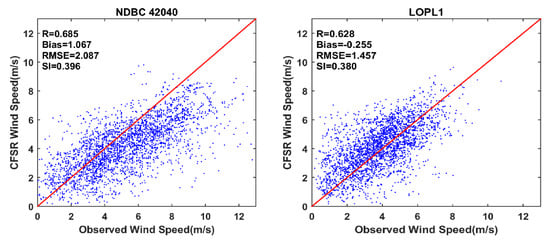
Figure 14.
Evaluation of CFSR wind speed at NDBC 42040 and LOPL1.
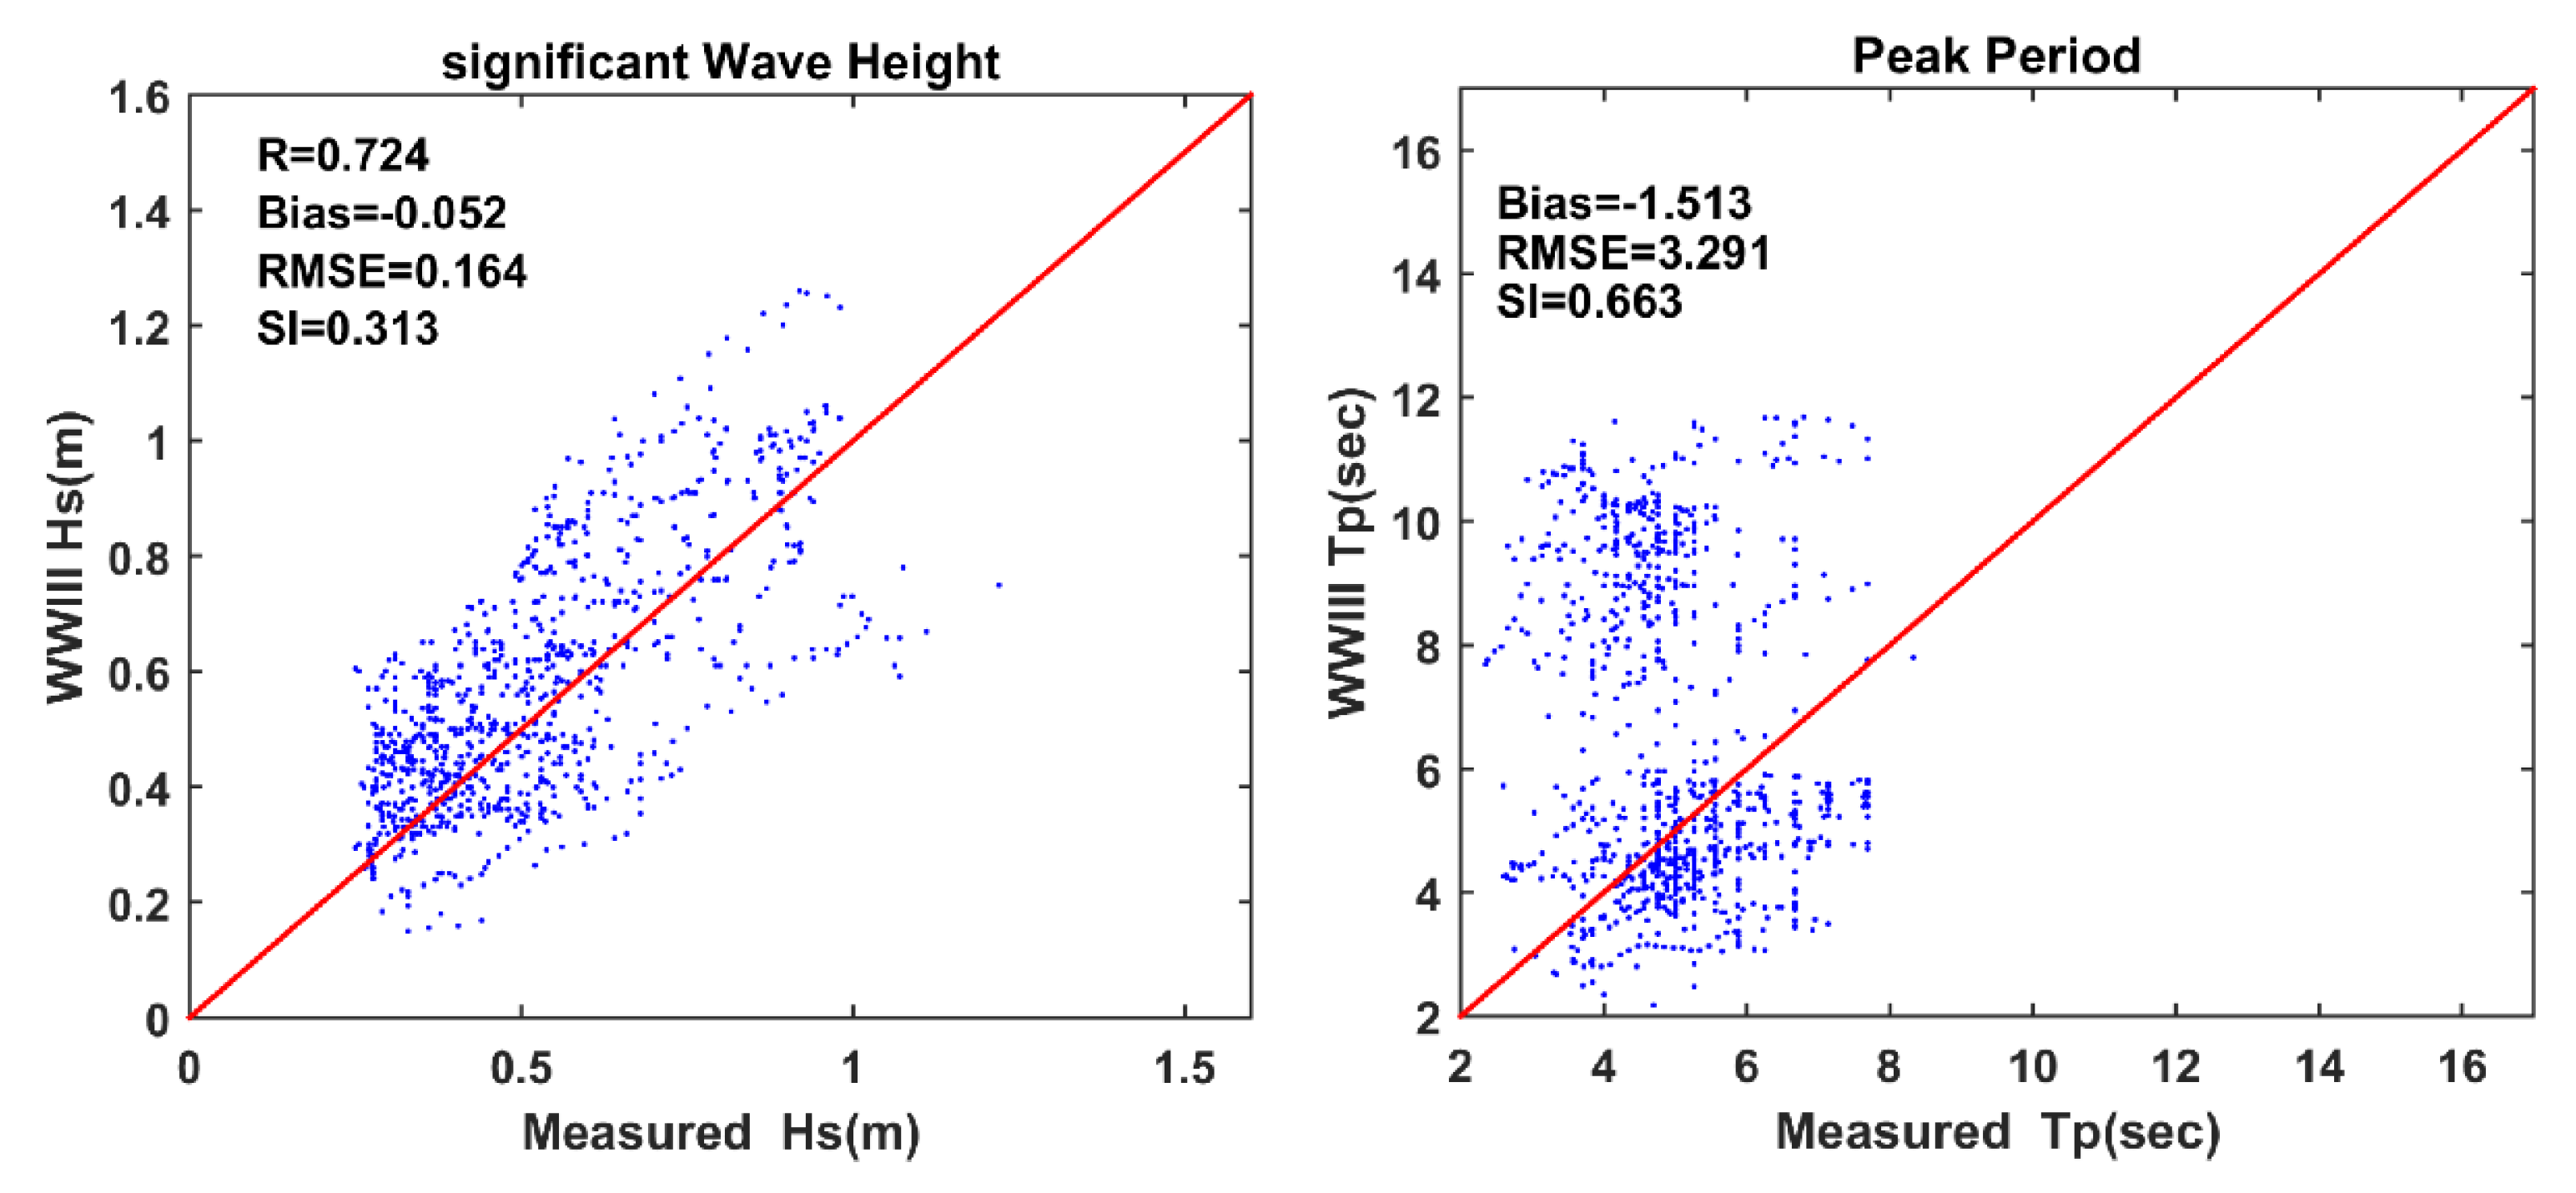
The other important model forcing is the data prescribed at the open boundaries. The WWIII data used in the present modeling as the boundary condition provide relatively high accuracy for the simulated wave height and a fair accuracy for the wave peak period (https://polar.ncep.noaa.gov/waves/hindcasts/nopp-phase2.php, last accessed on 15 September 2022). However, the evaluation provided by NOAA shows that in the Gulf of Mexico, the simulation accuracy of the wave period significantly declines during the summer months. The evaluation of WWIII data at NDBC 42001, located just south of the model southern boundary, confirms this conclusion (Figure 15). The accuracy of the wave height is fair compared to the high accuracy of wave height simulation that also includes the high energy waves in different references (e.g., [9,41]). The average error (RMSE) in wave height representation is 0.16 m. However, the peak wave period does not show any correlation with measurements, while a large average error of 3.29 is calculated for the peak period. This poor peak period can significantly affect the frequency spectra of the boundary waves that eventually shift the frequencies of the simulated spectra over the shelf toward inconsistent values with observations, as shown in Figure 11. It can eventually contribute to the model underestimation of the mean period (Figure 5).
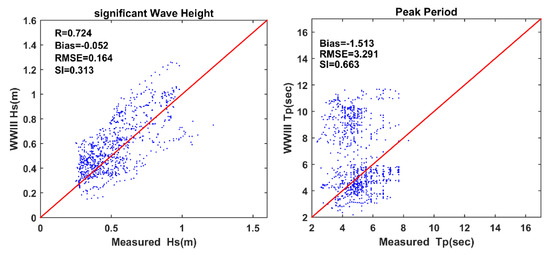
Figure 15.
Evaluation of boundary condition wave height and peak wave period at NDBC 42001 just south of the model southern boundary.
8. Summary and Conclusions
A wave modeling study using structured SWAN was implemented over the Louisiana shelf in the northern Gulf of Mexico to evaluate the performance of three different whitecapping formulations incorporated in SWAN during the low energy summer fair-weather conditions and the effect of forcing inaccuracies on model accuracy was investigated. Input data, including wind from the CFSR model, waves along the WWIII database open boundaries, high-quality bathymetry data, and modeling parameters from reliable resources, were used to prepare the initial model setup. Three different approaches for resolving the whitecapping dissipation, including [2,4,31], were used to determine the most appropriate approach for the wave condition of the study area during the modeling period. Wave modeling was implemented for the fair-weather conditions during July–August 2015, during which the wind energy and the wave height significantly declined compared to other months. Examining simulations based on the three whitecapping approaches by comparing with data at two stations on the east and west of the Mississippi birds-foot Delta and calculating error metrics (Pearson correlation coefficient, RMSE, bias, and SI) showed that the ST6 produced a higher accuracy wave field for the study area. Simulation results were further examined for wave height and period. These results confirmed that the Westhuysen approach generally underestimated wave height and period over the Louisiana shelf, which is consistent with previous studies and confirms that this formulation needs a recalibration for the fetch-limited part of the growth curve. Simulation using ST6 results in not only larger wave heights consistent with observations but also high accuracy in simulating spectral peaks in frequency spectra and the high- and low-frequency lobes of the spectra. Unlike the intrinsic properties of whitecapping formulations such as Komen, ST6 successfully simulated the directional components of the 2D spectra at large deviations from the mean wind direction. Inaccuracies in the forcing, including wind field and boundary condition data, were also investigated. Wind speed discrepancies from the observed wind could significantly contribute to the accuracy of the wave model. Average errors of 1.45–2 m/s in wind speed were estimated for CFSR wind compared to wind observations at NDBC 42040 and LOPL1. It was shown that wind speed discrepancies and failing to follow the observation variation pattern could contribute to wave model inaccuracies. As for boundary wave data, the peak period with a large average error and different patterns from the observation was found to be an important factor in inaccuracies in a simulation of the mean wave period.
This research and previous studies [39] show that ST6 could be a more reliable physics package for both high and low energy waves. This is an important conclusion since it will let the spectral model use a single consistent physics package for all different conditions. This is critical for the simulation of waves in regions such as the Gulf of Mexico and other regions such as the Gulf of Oman [44] that are affected by different atmospheric forcing and swell systems throughout the year.
The wind and wave data used in this study for forcing the model and along the open boundaries are from CFSR and WWII that are of the highest quality data in the Gulf of Mexico and elsewhere in the world [18,43]. Using other data such as ERA5 is associated with its own errors in simulation and does not undermine the role of selecting an appropriate whitecapping formulation to increase the modeling accuracy. In fact, here we are limited with the accuracy of the input data, hence whitecapping formulation can be way to improve the modeling accuracy. Examining different input data was not in the scope of our simulation and the CFSR and WWII datasets were used based on several other previous studies that used these data successfully in the region (e.g., [23,33,43]). However, the results from this study can be beneficial for the future studies that use other data such as ERA5 as the wind field and boundary conditions.
Using a limited modeling area with open boundaries is a common way to reduce the number of computational grid points and optimize simulation cost/time [24]. However, smaller modeling region includes smaller number of buoys with available wave data. As for the present study, only two wave buoys (both in the inner-shelf region) were available for model verification. Hence, the model results should be cautiously used for the offshore regions.
Author Contributions
Model setup and running, plotting results, preparing discussions, manuscript writing, N.C.; model setup and running, plotting result, conceptualization, manuscript editing, M.N.A.; writing and editing, Conceptualization, C.L. All authors have read and agreed to the published version of the manuscript.
Funding
This study was supported by NOAA through GCOOS with NOAA-NOS-IOOS-2016-2004378 and BOEM #M14AC00023 and #M15AC00015.
Institutional Review Board Statement
Not available.
Informed Consent Statement
Not applicable.
Data Availability Statement
The simulation results presented in this paper can be regenerated using SWAN, and the setup is clearly described in the manuscript. Buoy data used for model evaluation can be accessed through the link provided in the manuscript.
Acknowledgments
The work was conducted by the research team at Wave-Current-Surge Information System (WAVCIS, wavcis.csi.lsu.edu, accessed on 15 September 2022). Our computation using the model was performed on the cluster computer of the Louisiana Optical Network Initiative (LONI) HPC systems at Louisiana State University.
Conflicts of Interest
The authors declare that they have no competing interest.
Appendix A. Model Performance Statistics
References
- Phillips, O.M. On the generation of waves by turbulent wind. J. Fluid Mech. 1957, 2, 417–445. [Google Scholar] [CrossRef]
- Miles, J.W. On the generation of surface waves by shear flows. J. Fluid Mech. 1957, 3, 185–204. [Google Scholar] [CrossRef]
- Komen, G.J.; Hasselmann, K. On the Existence of a Fully Developed Wind-Sea Spectrum. J. Phys. Oceanogr. 1984, 14, 1271–1285. [Google Scholar] [CrossRef]
- Van der Westhuysen, A.J.; Zijlema, M.; Battjes, J.A. Nonlinear saturation-based whitecapping dissipation in SWAN for deep and shallow water. Coast. Eng. 2007, 54, 151–170. [Google Scholar] [CrossRef]
- Hoefel, F.; Elgar, S. Wave-Induced Sediment Transport and Sandbar Migration. Science 2003, 299, 1885–1887. [Google Scholar] [CrossRef] [PubMed]
- Allahdadi, M.N.; Chegini, V.; Fotouhi, N.; Golshani, A.; Jandaghi, A.M.; Moradi, M.; Taebi, S. Wave Modeling and Hindcast of the Caspian Sea. In Proceedings of the 6th International Conference on Coasts, Ports, and Marine Structures, Tehran, Iran, 29 November 2004. [Google Scholar]
- Allahdadi, M.N.; Jose, F.; Stone, G.W.; D’Sa, E.J.; Rosati, J.D.; Wang, P.; Roberts, T.M. The Fate of Sediment Plumes Discharged from the Mississippi and Atchafalaya Rivers: An Integrated Observation and Modeling Study for the Louisiana Shelf, USA. In Proceedings of the Coastal Sediments 2011, Miami, FL, USA, 2–6 May 2011; pp. 2212–2225. [Google Scholar] [CrossRef]
- Li, Y.; Zhou, J. Unsteady Characteristics of Sediment Transport Under Non-harmonic Waves. Procedia Eng. 2015, 126, 285–289. [Google Scholar] [CrossRef][Green Version]
- Allahdadi, M.N.; He, R.; Ahn, S.; Chartrand, C.; Neary, V.S. Development and calibration of a high-resolution model for the Gulf of Mexico, Puerto Rico, and the U.S. Virgin Islands: Implication for wave energy resource characterization. Ocean Eng. 2021, 235, 109304. [Google Scholar] [CrossRef]
- Dietrich, J.C.; Zijlema, M.; Westerink, J.J.; Holthuijsen, L.H.; Dawson, C.; Luettich, R.A., Jr.; Jensen, R.E.; Smith, J.M.; Stelling, G.S.; Stone, G.W. Modeling hurricane waves and storm surge using integrally-coupled, scalable computations. Coast. Eng. 2011, 58, 45–65. [Google Scholar] [CrossRef]
- Atkinson, J.; Westerink, J.; Wamsley, T.; Cialone, M.; Dietrich, C.; Dresback, K.; Kolar, R.; Resio, D.; Bender, C.; Blanton, B.; et al. Hurricane Storm Surge and Wave Modeling in Southern Louisiana: A Brief Overview. Estuar. Coast. Model. 2008, 2007, 467–506. [Google Scholar] [CrossRef]
- Bunya, S.; Dietrich, J.; Westerink, J.J.; Ebersole, B.A.; Smith, J.M.; Atkinson, J.H.; Jensen, R.; Resio, D.T.; Luettich, R.A.; Dawson, C.; et al. A High-Resolution Coupled Riverine Flow, Tide, Wind, Wind Wave, and Storm Surge Model for Southern Louisiana and Mississippi. Part I: Model Development and Validation. Mon. Weather. Rev. 2010, 138, 345–377. [Google Scholar] [CrossRef]
- Kim, K.O.; Lee, H.S.; Yamashita, T.; Choi, B.H. Wave and storm surge simulations for Hurricane Katrina using coupled process based models. KSCE J. Civ. Eng. 2008, 12, 1–8. [Google Scholar] [CrossRef]
- Wang, D.-P.; Oey, L.-Y. Hindcast of Waves and Currents in Hurricane Katrina. Bull. Am. Meteorol. Soc. 2008, 89, 487–496. [Google Scholar] [CrossRef]
- Mossa, J.; Roberts, H.H. Synergism of Riverine and Winter Storm-Related Sediment Transport Processes in Louisiana’s Coastal Wetlands. Gulf Coast Assoc. Geol. Soc. Trans. 1990, 40, 635–642. [Google Scholar]
- Feng, Z.; Li, C. Cold-front-induced flushing of the Louisiana Bays. J. Mar. Syst. 2010, 82, 252–264. [Google Scholar] [CrossRef]
- Li, C.; Roberts, H.; Stone, G.W.; Weeks, E.; Luo, Y. Wind surge and saltwater intrusion in Atchafalaya Bay during onshore winds prior to cold front passage. Hydrobiologia 2010, 658, 27–39. [Google Scholar] [CrossRef]
- Chaichitehrani, N.; Li, C.; Xu, K.; Allahdadi, M.N.; Hestir, E.L.; Keim, B.D. A numerical study of sediment dynamics over Sandy Point dredge pit, west flank of the Mississippi River, during a cold front event. Cont. Shelf Res. 2019, 183, 38–50. [Google Scholar] [CrossRef]
- Allahdadi, M.N.; Jose, F.; Patin, C. Seasonal Hydrodynamics along the Louisiana Coast: Implications for Hypoxia Spreading. J. Coast. Res. 2013, 290, 1092–1100. [Google Scholar] [CrossRef]
- Keen, T.R. Waves and Currents During a Winter Cold Front in the Mississippi Bight, Gulf of Mexico: Implications for Barrier Island Erosion. J. Coast. Res. 2002, 18, 622–636. [Google Scholar]
- Janssen, P.A. Quasi-linear Theory of Wind-Wave Generation Applied to Wave Forecasting. J. Phys. Oceanogr. 1991, 21, 1631–1642. [Google Scholar] [CrossRef]
- Kahma, K.K.; Calkoen, C.J. Reconciling Discrepancies in the Observed Growth of Wind-generated Waves. J. Phys. Oceanogr. 1992, 22, 1389–1405. [Google Scholar] [CrossRef]
- Allahdadi, M.N.; He, R.; Neary, V.S. Predicting ocean waves along the US east coast during energetic winter storms: Sensitivity to whitecapping parameterizations. Ocean Sci. 2019, 15, 691–715. [Google Scholar] [CrossRef]
- Moghaddam, E.I.; Hakimzadeh, H.; Allahdadi, M.N.; Hamedi, A.; Nasrollahi, A. Wave-induced Currents in the Northern Gulf of Oman: A Numerical Study for Ramin Port along the Iranian Coast. Am. J. Fluid Dyn. 2018, 8, 30–39. [Google Scholar]
- Moghaddam, E.I.; Allahdadi, M.N.; Ashrafi, A.; Chaichitehrani, N. Coastal system evolution along the southeastern Caspian Sea coast using satellite image analysis: Response to the sea level fall during 1994–2015. Arab. J. Geosci. 2021, 14, 771. [Google Scholar] [CrossRef]
- SWAN. User Manual, Cycle III Version 41.01A; Delft University of Technology: Delft, The Netherlands, 2015. [Google Scholar]
- Cavaleri, L.; Rizzoli, P.M. Wind wave prediction in shallow water: Theory and applications. J. Geophys. Res. Earth Surf. 1981, 86, 10961–10973. [Google Scholar] [CrossRef]
- Yan, L. An Improved Wind Input Source Term for Third Generation Ocean Wave Modelling; Scientific report WR-No 87-8; Royal Netherlands Meteorological Institute: De Bilt, The Netherlands, 1987. [Google Scholar]
- Rogers, W.E.; Babanin, A.V.; Wang, D.W. Observation-Consistent Input and Whitecapping Dissipation in a Model for Wind-Generated Surface Waves: Description and Simple Calculations. J. Atmos. Ocean. Technol. 2012, 29, 1329–1346. [Google Scholar] [CrossRef]
- Ardhuin, F.; Chapron, B.; Collard, F. Observation of swell dissipation across oceans. Geophys. Res. Lett. 2009, 36, 1–5. [Google Scholar] [CrossRef]
- Zieger, S.; Babanin, A.V.; Erick Rogers, W.; Young, I.R. Observation-based source terms in the third-generation wave model WAVEWATCH. Ocean Model. 2015, 96, 2–25. [Google Scholar] [CrossRef]
- Young, I.R.; Babanin, A.; Zieger, S. The Decay Rate of Ocean Swell Observed by Altimeter. J. Phys. Oceanogr. 2013, 43, 2322–2333. [Google Scholar] [CrossRef]
- Allahdadi, N.; Gunawan, B.; Lai, J.; He, R.; Neary, V.S. High Resolution Wave modeling for Characterizing Wave Energy Resources along the U.S. East Coast. In Proceedings of the 2018 Ocean Sciences Meeting, Portland, OR, USA, 11–16 February 2018. [Google Scholar]
- Tolman, H.L. User Manual and System Documentation of WAVEWATCH-III Version 1.18; NOAA/NWS/NCEP/OMB Technical Note 166; National Centers for Environmental Prediction: Camp Springs, MD, USA, 1999; 110p. [Google Scholar]
- Ardhuin, F.; Rogers, E.; Babanin, A.V.; Filipot, J.-F.; Magne, R.; Roland, A.; Van Der Westhuysen, A.; Queffeulou, P.; Lefevre, J.-M.; Aouf, L.; et al. Semiempirical Dissipation Source Functions for Ocean Waves. Part I: Definition, Calibration, and Validation. J. Phys. Oceanogr. 2010, 40, 1917–1941. [Google Scholar] [CrossRef]
- Yang, Z.; Neary, V.S.; Wang, T.; Gunawan, B.; Dallman, A.R.; Wu, W.-C. A wave model test bed study for wave energy resource characterization. Renew. Energy 2017, 114, 132–144. [Google Scholar] [CrossRef]
- Battjes, J.A.; Janssen, J.P.F.M. Energy Loss and Set-Up Due to Breaking of Random Waves. In Proceedings of the 16th International Conference on Coastal Engineering, Hamburg, Germany, 27 August–3 September 1978; pp. 569–587. [Google Scholar]
- Hasselmann, K.; Barnett, T.P.; Bouws, E.; Carlson, H.; Cartwright, D.E.; Enke, K.; Ewing, J.A.; Gienapp, H.; Hasselmann, D.E.; Kruseman, P.; et al. Measurements of wind-wave growth and swell decay during the Joint North Sea Wave Project (JONSWAP). Deutches Hydrographisches Institut: Hamburg, Germany, 1973; 95p. [Google Scholar]
- Van Vledder, G.P.; Hulst, S.T.C.; McConochie, J.D. Source term balance in a severe storm in the Southern North Sea. Ocean Dyn. 2016, 66, 1681–1697. [Google Scholar] [CrossRef]
- Ardhuin, F.; Herbers, T.H.C.; Watts, K.P.; van Vledder, G.P.; Jensen, R.; Graber, H.C. Swell and Slanting-Fetch Effects on Wind Wave Growth. J. Phys. Oceanogr. 2007, 37, 908–931. [Google Scholar] [CrossRef]
- Group, T.W. The WAM model—A third generation ocean wave prediction model. J. Phys. Oceanogr. 1988, 18, 1775–1810. [Google Scholar] [CrossRef]
- Arab, A.R. Simulating Wave Dynamics in the Northern Gulf of Mexico and Barataria Pass; Louisiana State University and Agricultural & Mechanical College: Baton Rouge, LA, USA, 2022. [Google Scholar] [CrossRef]
- Ahn, S.; Neary, V.S.; Allahdadi, M.N.; He, R. A framework for feasibility-level validation of high-resolution wave hindcast models. Ocean Eng. 2022, 263, 112193. [Google Scholar] [CrossRef]
- Chaichitehrani, N.; Allahdadi, M.N. Overview of Wind Climatology for the Gulf of Oman and the Northern Arabian Sea. Am. J. Fluid Dyn. 2018, 8, 1–9. [Google Scholar]
Publisher’s Note: MDPI stays neutral with regard to jurisdictional claims in published maps and institutional affiliations. |
© 2022 by the authors. Licensee MDPI, Basel, Switzerland. This article is an open access article distributed under the terms and conditions of the Creative Commons Attribution (CC BY) license (https://creativecommons.org/licenses/by/4.0/).

