Article

Analysis of Spatio-Temporal Evolution Characteristics of Drought and Its Driving Factors in Yangtze River Basin Based on SPEI

1
National Supercomputing Center in Zhengzhou, Zhengzhou University, Zhengzhou 450001, China
2
The School of Geo-Science & Technology, Zhengzhou University, Zhengzhou 450001, China
3
The School of Computer and Artificial Intelligence, Zhengzhou University, Zhengzhou 450001, China
*
Authors to whom correspondence should be addressed.
These authors contributed equally to this work.
Atmosphere 2022, 13(12), 1986; https://doi.org/10.3390/atmos13121986
Submission received: 9 October 2022 / Revised: 21 November 2022 / Accepted: 22 November 2022 / Published: 28 November 2022

Abstract

:
Using a dataset of 114 meteorological stations in the Yangtze River Basin from 1980–2019, the standardized precipitation evapotranspiration index (SPEI) was calculated based on the Penman-Monteith evapotranspiration model for multiple time scales, and the spatial and temporal evolution characteristics and driving factors of drought in the Yangtze River Basin were analyzed by combining spatial and temporal analysis methods as well as geodetector. The main results obtained are as follows: (1) The climate of the Yangtze River Basin is an overall wet trend, and the trend of summer drought is more similar to the annual scale trend. (2) Most areas in the Yangtze River Basin showed mild drought or no drought, and there is little difference in drought condition among the Yangtze River Basin regions. The areas with drought conditions are mainly distributed in the southwest and east of the Yangtze River Basin. (3) There are significant seasonal differences in drought conditions in all regions, and the drought condition is more different in autumn compared to spring, summer and winter. (4) The average annual precipitation and elevation factors are the dominant driving factors of drought in the Yangtze River Basin, and the double-factor interaction has a greater influence on the drought variation in the Yangtze River Basin than the single-factor effect, indicating that the difference of drought condition in the Yangtze River Basin is the result of the combination of multiple factors.

1. Introduction

Drought is one of the most costly natural disasters, which has a very important impact on agricultural production [1], biodiversity [2], human health [3], hydrology [4] and other important fields related to human production and life. Droughts can be classified into four main types according to their causes [5]: meteorological drought, agricultural drought, hydrological drought and socio-economic drought. The frequency of drought events has become more frequent [6] because of the superposition of natural and anthropogenic factors [7] such as climate change and human activities. However, due to the complexity and variability of the many factors involved in drought, the identification and analysis of drought events pose a huge challenge.
The Yangtze River Basin is the largest basin in China, and it straddles the Qinghai-Tibet alpine region, the southwest tropical monsoon region and the central China subtropical monsoon region, with complex climatic conditions. The Yangtze River Basin, as a typical wet-semi-humid zone, has obvious alternation between wet and dry, and the Yangtze River Basin droughts are characterized by short-term fluctuations and the coexistence of droughts and floods, which makes the study of drought scenarios in the Yangtze River Basin particularly complex.
The drought index is an important method for quantitatively calculating the severity and impact of drought [8]. Drought indices are vital to objectively quantify and compare drought severity, duration, and extent across regions with varied climatic and hydrologic regimes [9]. In the past decades, a series of meteorological drought indexes have been developed, such as Standardized Precipitation Index (SPI) [10], Standardized Precipitation Evapotranspiration Index (SPEI) [11], Palmer Drought Severity Index (PDSI) [12] and Soil Moisture Deficit Index (SMDI) [13], which are widely used in different spatial scales globally, regionally, nationally and in different river basins [14]. The SPEI was proposed by Vicente Serrano et al. [11], which retains the core algorithms of the PDSI and SPI, and can combine multi-scale features with the ability to assess the impact of temperature change on drought [15]. At the same time, the temperature factor was considered, and the concept of potential evapotranspiration was introduced [16]. The SPEI is an important and useful tool for comparing meteorological drought [9]. Evapotranspiration is the major component of the water cycle, so a correct estimate of this variable is fundamental [17]. At present, there are two potential evapotranspiration models commonly used in the SPEI calculation process in China, which are Thornthwaite and Penman-Monteith. Temperature is the only meteorological element required in the Thornthwaite model. In contrast, the elements involved in the calculation based on the Penman-Monteith model, in addition to temperature, also take into account solar radiation, air pressure, wind speed, relative humidity and the geographical location of the meteorological station site [16]. If data permits, the Penman-Monteith model strikes a useful balance between consistency and minimal data requirements, requiring only the addition of minimum/maximum temperature and wind speed [9]. Liu et al. [18] calculated the SPEI (abbreviated as SPEI_TH and SPEI_PM, respectively) for the Chinese region using the Thornthwaite and Penman-Monteith models, respectively, and showed that SPEI_PM can describe the dry and wet variation characteristics of the study area relatively more reasonably.
SPEI has been widely used in drought research. Ling et al. [19] used SPEI to analyze the spatio-temporal evolution characteristics of drought in the Haihe River Basin from 1960 to 2020, and found that the frequency of drought was on the rise, with mild drought and moderate drought occurring frequently. Men et al. [20] analyzed the spatio-temporal characteristics of meteorological drought in the Chaobai River Basin, and the results showed that the variation trends of dry and wet conditions were not exactly the same at different time scales, but they were all mainly dominated by mild and moderate droughts. Wang et al. [21] used SPEI to analyze the effects of multi-temporal scale drought on vegetation dynamics in Inner Mongolia from 1982 to 2015, and found that the probability of vegetation productivity loss increased with increasing drought levels under different drought levels. Chen et al. [14] showed that SPEI_PM performed better than SPEI_TH in the results of drought monitoring in China, and that temperature changes in recent decades had the greatest weight in the natural factors causing drought. Li et al. [22] found that the SPEI_PM results for the Yangtze River Basin were better than SPI and SPEI_TH, but the study only used SPEI_PM to analyze the annual-scale drought evolution characteristics of the Yangtze River Basin without multi-scale analysis and analysis of drought drivers. Tian et al. [23] divided the Yangtze River Basin according to each sub-basin and used soil moisture data to study agricultural drought, but did not use SPEI for drought analysis. Huang et al. [24] analyzed the temporal evolution characteristics of drought area, spatial and temporal distribution characteristics of dry and wet scenarios, and change trends in the Yangtze River Basin based on PDSI; however, the PDSI used in this study lacked multi-scale characteristics and did not effectively analyze the multi-scale drought characteristics of the Yangtze River Basin, and the study also lacked the analysis of drought drivers in the Yangtze River Basin. However, when analyzing the conditions for the occurrence of drought events, previous studies often simply attributed them to average or extreme temperatures and precipitation, while ignoring the internal factors and exploring the patterns in the long-term changes of drought events, thus leading to a failure to effectively break through the core causes of regional drought phenomenon. Therefore, understanding the characteristics of drought and its influencing factors in the study area plays an important role in natural disasters and the pressure of production and life in the area.
At present, most studies on droughts in the Yangtze River Basin were conducted separately in time and space, without analyzing the characteristics and evolution of droughts at the overall spatial and temporal scales, and without analyzing the driving factors of droughts in the Yangtze River Basin. Exploring the distribution pattern, formation process and impact mechanism of meteorological drought in the Yangtze River Basin using spatial and temporal data models has important practical and realistic significance. Since the space-time cube model can ensure the continuity of spatio-temporal data, when compared with traditional spatio-temporal analysis, the space-time cube can show the spatio-temporal characteristics of the data as a whole, instead of only selecting individual years for analysis and presentation as in traditional spatio-temporal analysis. In this paper, the multi-scale SPEI of the Yangtze River Basin was visualized and analyzed by using the space-time cube model, and the clustering areas of the drought at each scale in the Yangtze River Basin were obtained by combining the time series clustering method. The trend of drought conditions in the Yangtze River Basin over the past 40 years was determined by using emerging hot spot analysis. Finally, the drought driving factors in the Yangtze River Basin were studied based on geodetector.

2. Materials and Methods
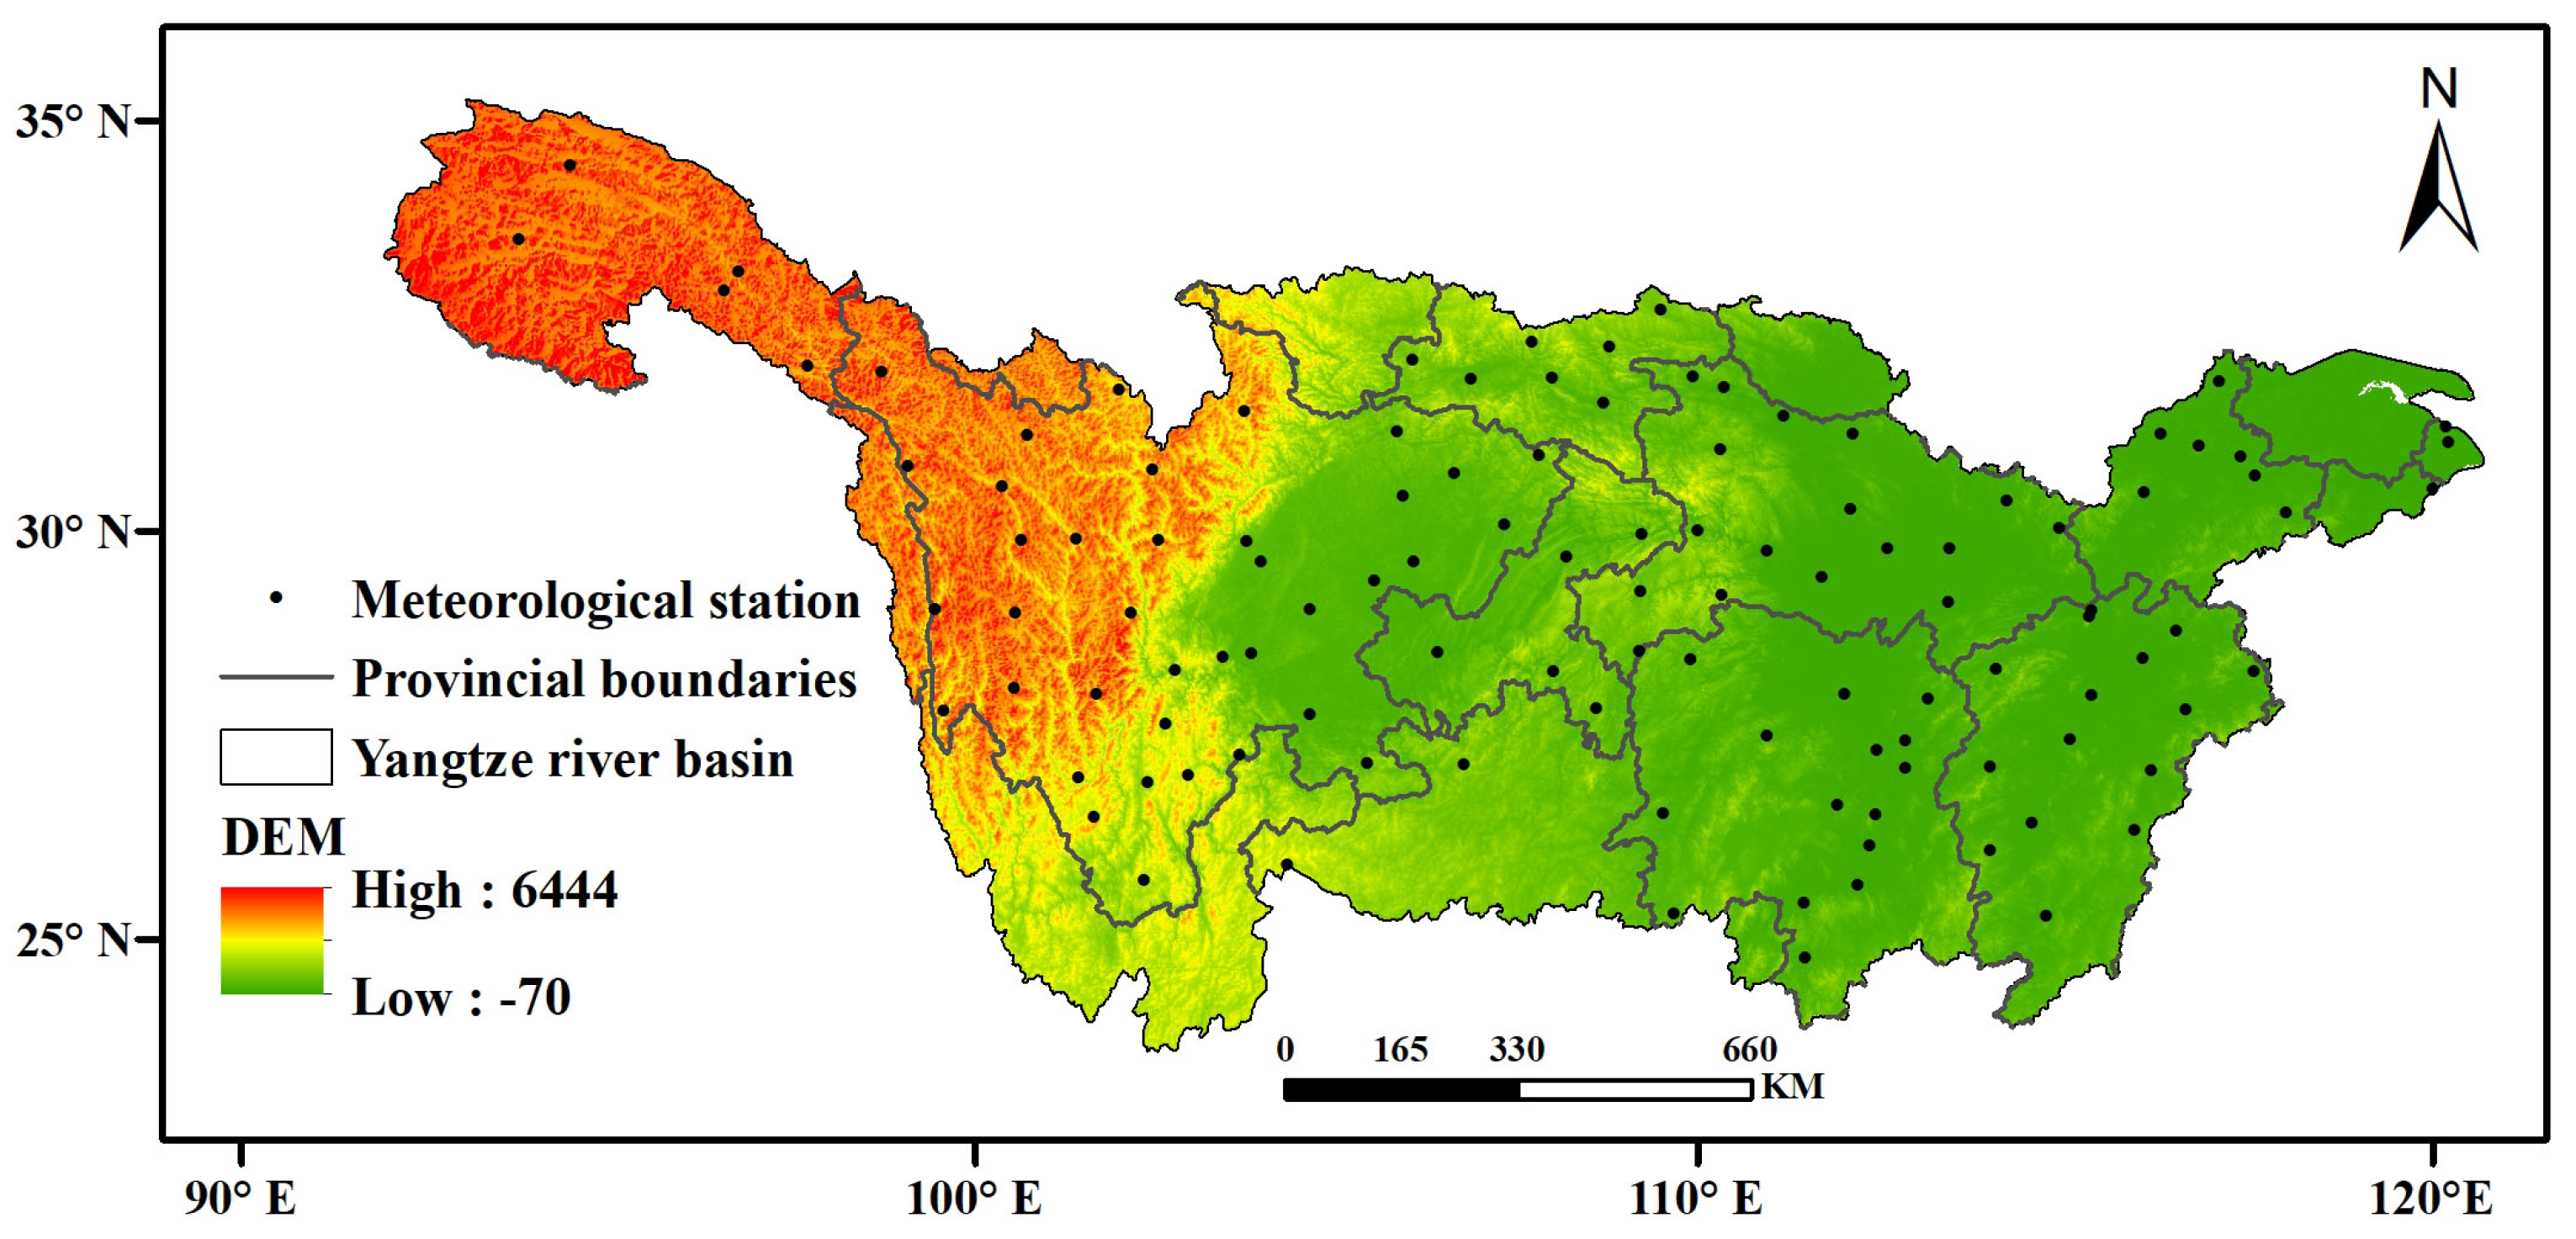
2.1. Study Region

The Yangtze River Basin covers a total area of 1.8 million square kilometers (Figure 1), accounting for 18.8% of China’s territory, making it the largest basin in Asia. The Yangtze River Basin spans the Qinghai-Tibet alpine region, the southwest tropical monsoon region and the central China subtropical monsoon region [22]. The vegetation in the upper reaches is dominated by alpine meadow and natural grassland, the forest vegetation in the middle reaches is dominated, and farmland is widely distributed in the middle and lower reaches and Sichuan Basin [23]. With rich resources, large population clusters, and rapid industrial development [25], it plays an important role in ecological integrity and ecosystem services.

2.2. Data Source

In this paper, 114 meteorological stations within the Yangtze River Basin were selected from 1980 to 2019, and data such as mean temperature and latitude were obtained from the China Meteorological Science Data Sharing Service (https://www.data.cma.cn/ accessed on 2 March 2020). In order to ensure the integrity of data in time series, the missing data of a few stations are interpolated by neighboring stations. The driving factor data (Table 1), provincial boundaries in the Yangtze River Basin and the boundary of the Yangtze River Basin were obtained from the Resource and Environmental Science and Data Center of Chinese Academy of Sciences (https://www.resdc.cn/ accessed on 26 March 2022) and Geospatial Data Cloud (https://www.gscloud.cn/ accessed on 20 March 2022).

2.3. Methods

2.3.1. Standardized Precipitation-Evapotranspiration Index

SPEI is the result of standardized difference between precipitation and potential evapotranspiration [24]. In this paper, the Penman-Monteith model was selected as the potential evapotranspiration model to calculate the multiscale SPEI values for the period 1980–2019 at 114 meteorological stations in the study area, which provided a more accurate method for calculating the potential evapotranspiration and can better reflect the regional dry and wet conditions [19]. The specific calculation process of SPEI_PM is as follows [11].
(1) The calculation of the reference crop evapotranspiration ( E T 0 ) was computed using the Penman-Monteith model with the following equation.
E T 0 = 0.408 Δ ( R n G ) + γ 900 T + 273 U 2 ( e s e a ) Δ + γ ( 1 + 0.34 U 2 )
where E T 0 is the evapotranspiration of the reference crop (mm/d), Δ is the slope of the saturated water pressure curve (kPa/°C), γ is the hygrometry constant (kPa/°C), R n is net solar radiation (MJ·m 2 ·d 1 ), G is the heat flux of soil (MJ·m 2 ·d 1 ), T is the average temperature during the calculation period (°C), U 2 is the average wind speed at 2 m above the ground, e s is the saturated water pressure (kPa), and e a is the actual water pressure (kPa).
(2) Calculate the difference between month-by-month precipitation and evapotranspiration.
D i = P E T 0
where D i is the difference between precipitation and evapotranspiration, P is the monthly precipitation, E T 0 is the actual monthly evapotranspiration.
(3) Normalization of D i data series. The log-logistic probability distribution F(x) is used to fit D i , and the SPEI value corresponding to each Di value is calculated.
w = 2 ln P
when the cumulative probability p ≤ 0.5:
S P E I = w c 0 + c 1 w + c 2 w 2 1 + d 2 w + d 1 w 2 + d 3 w 3
when the cumulative probability p ≥ 0.5:
S P E I = ( w c 0 + c 1 w + c 2 w 2 1 + d 2 w + d 1 w 2 + d 3 w 3 )
where d 1 = 1.432788, d 2 = 0.189269, d 3 = 0.001308, c 0 = 2.515517, c 1 = 0.802853, c 2 = 0.010328.

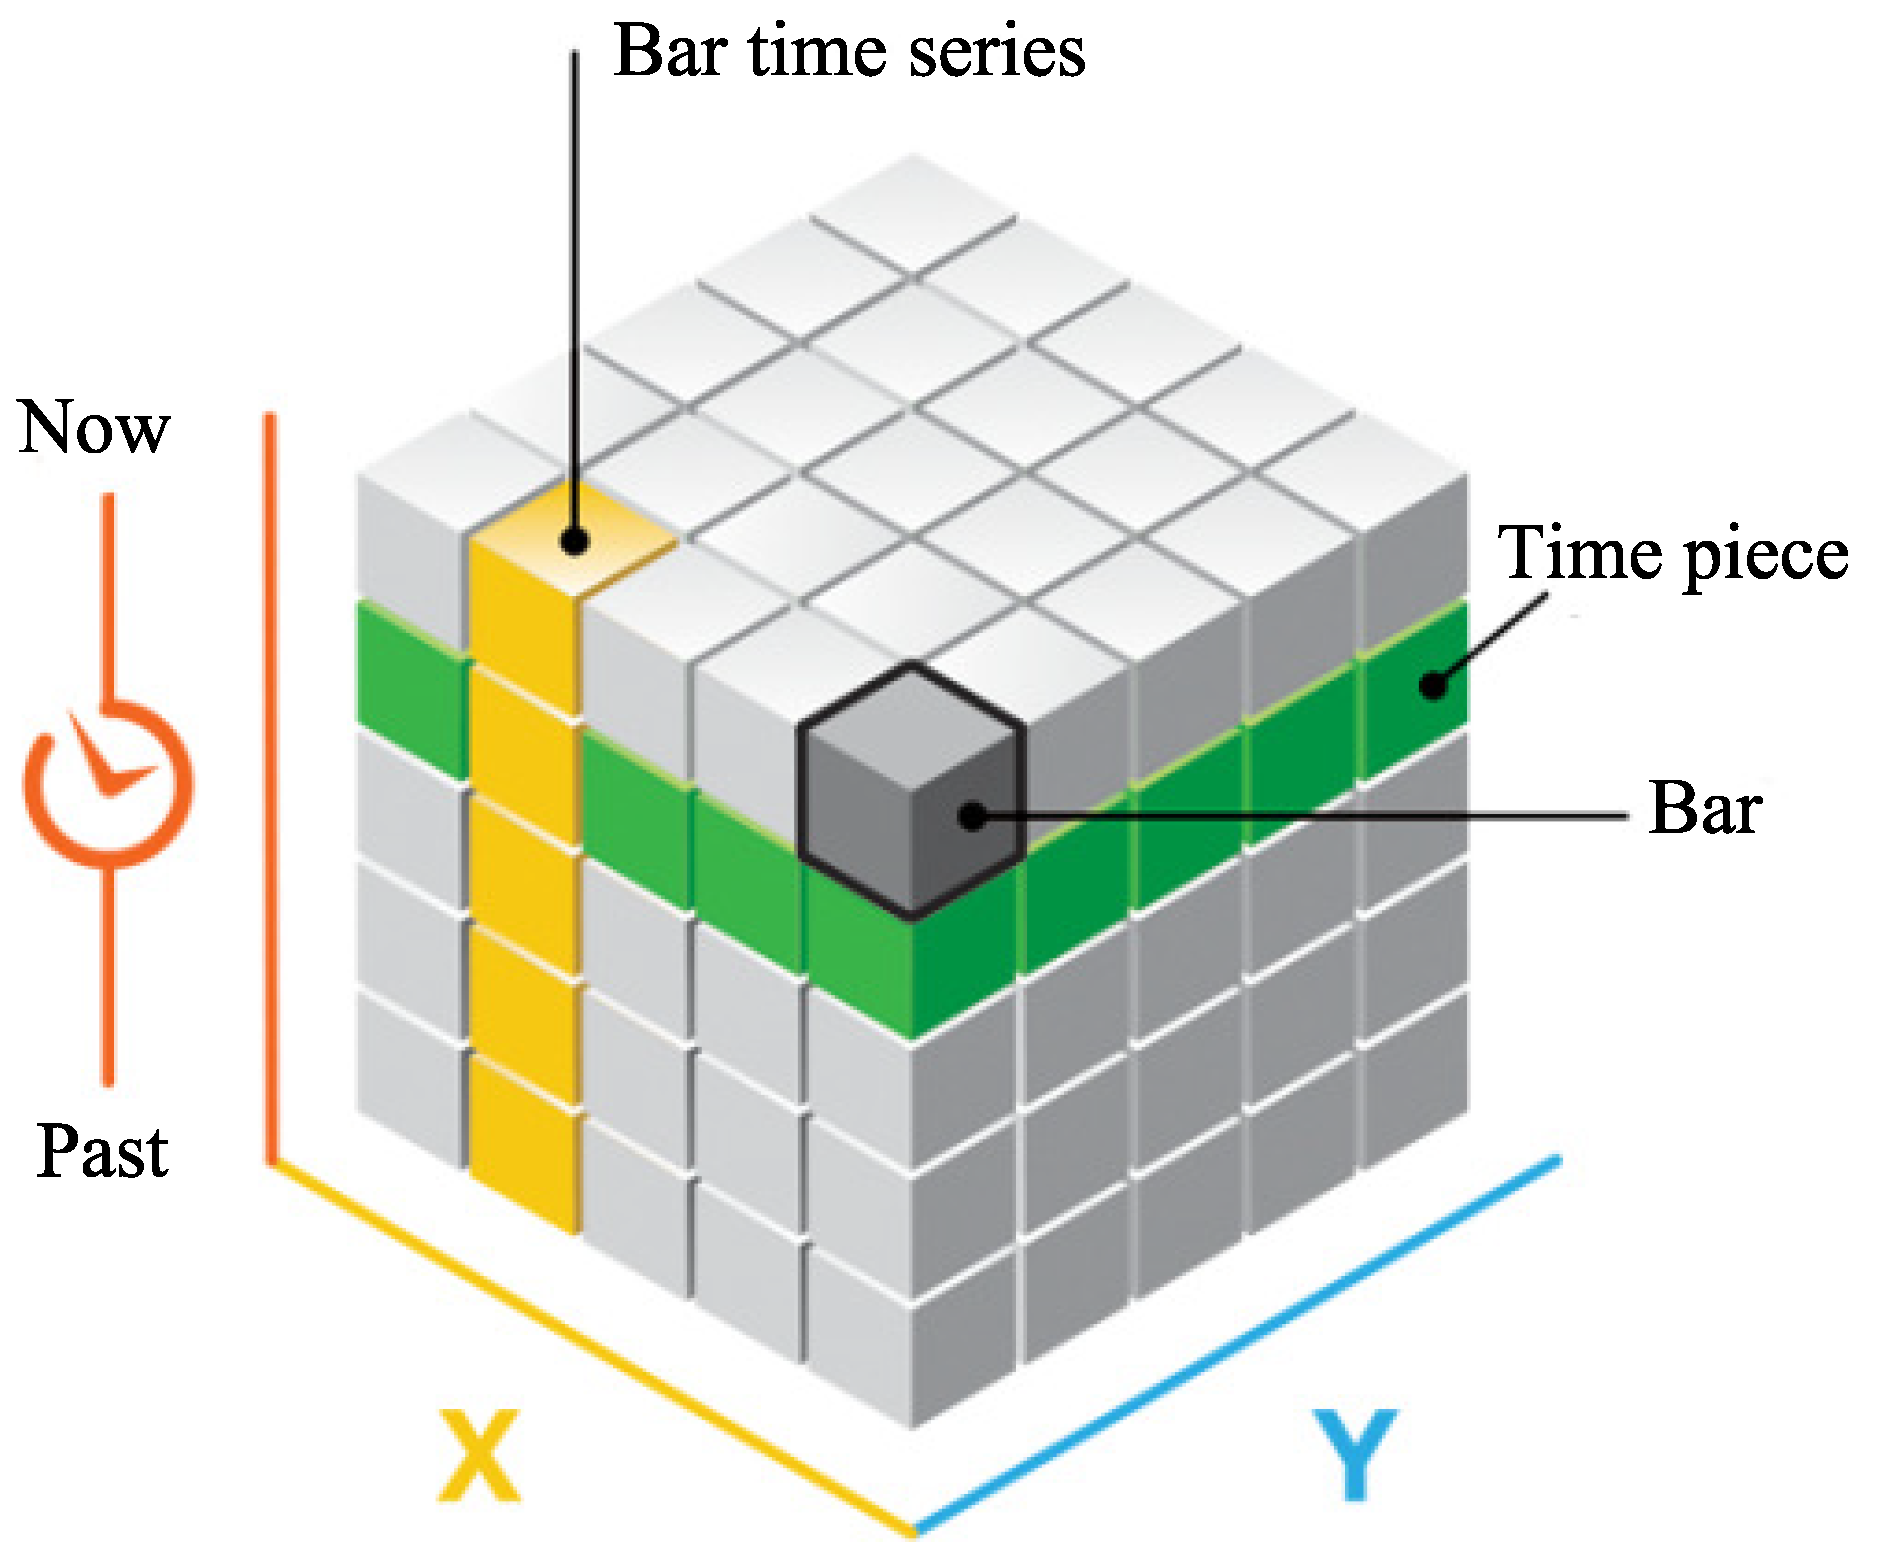
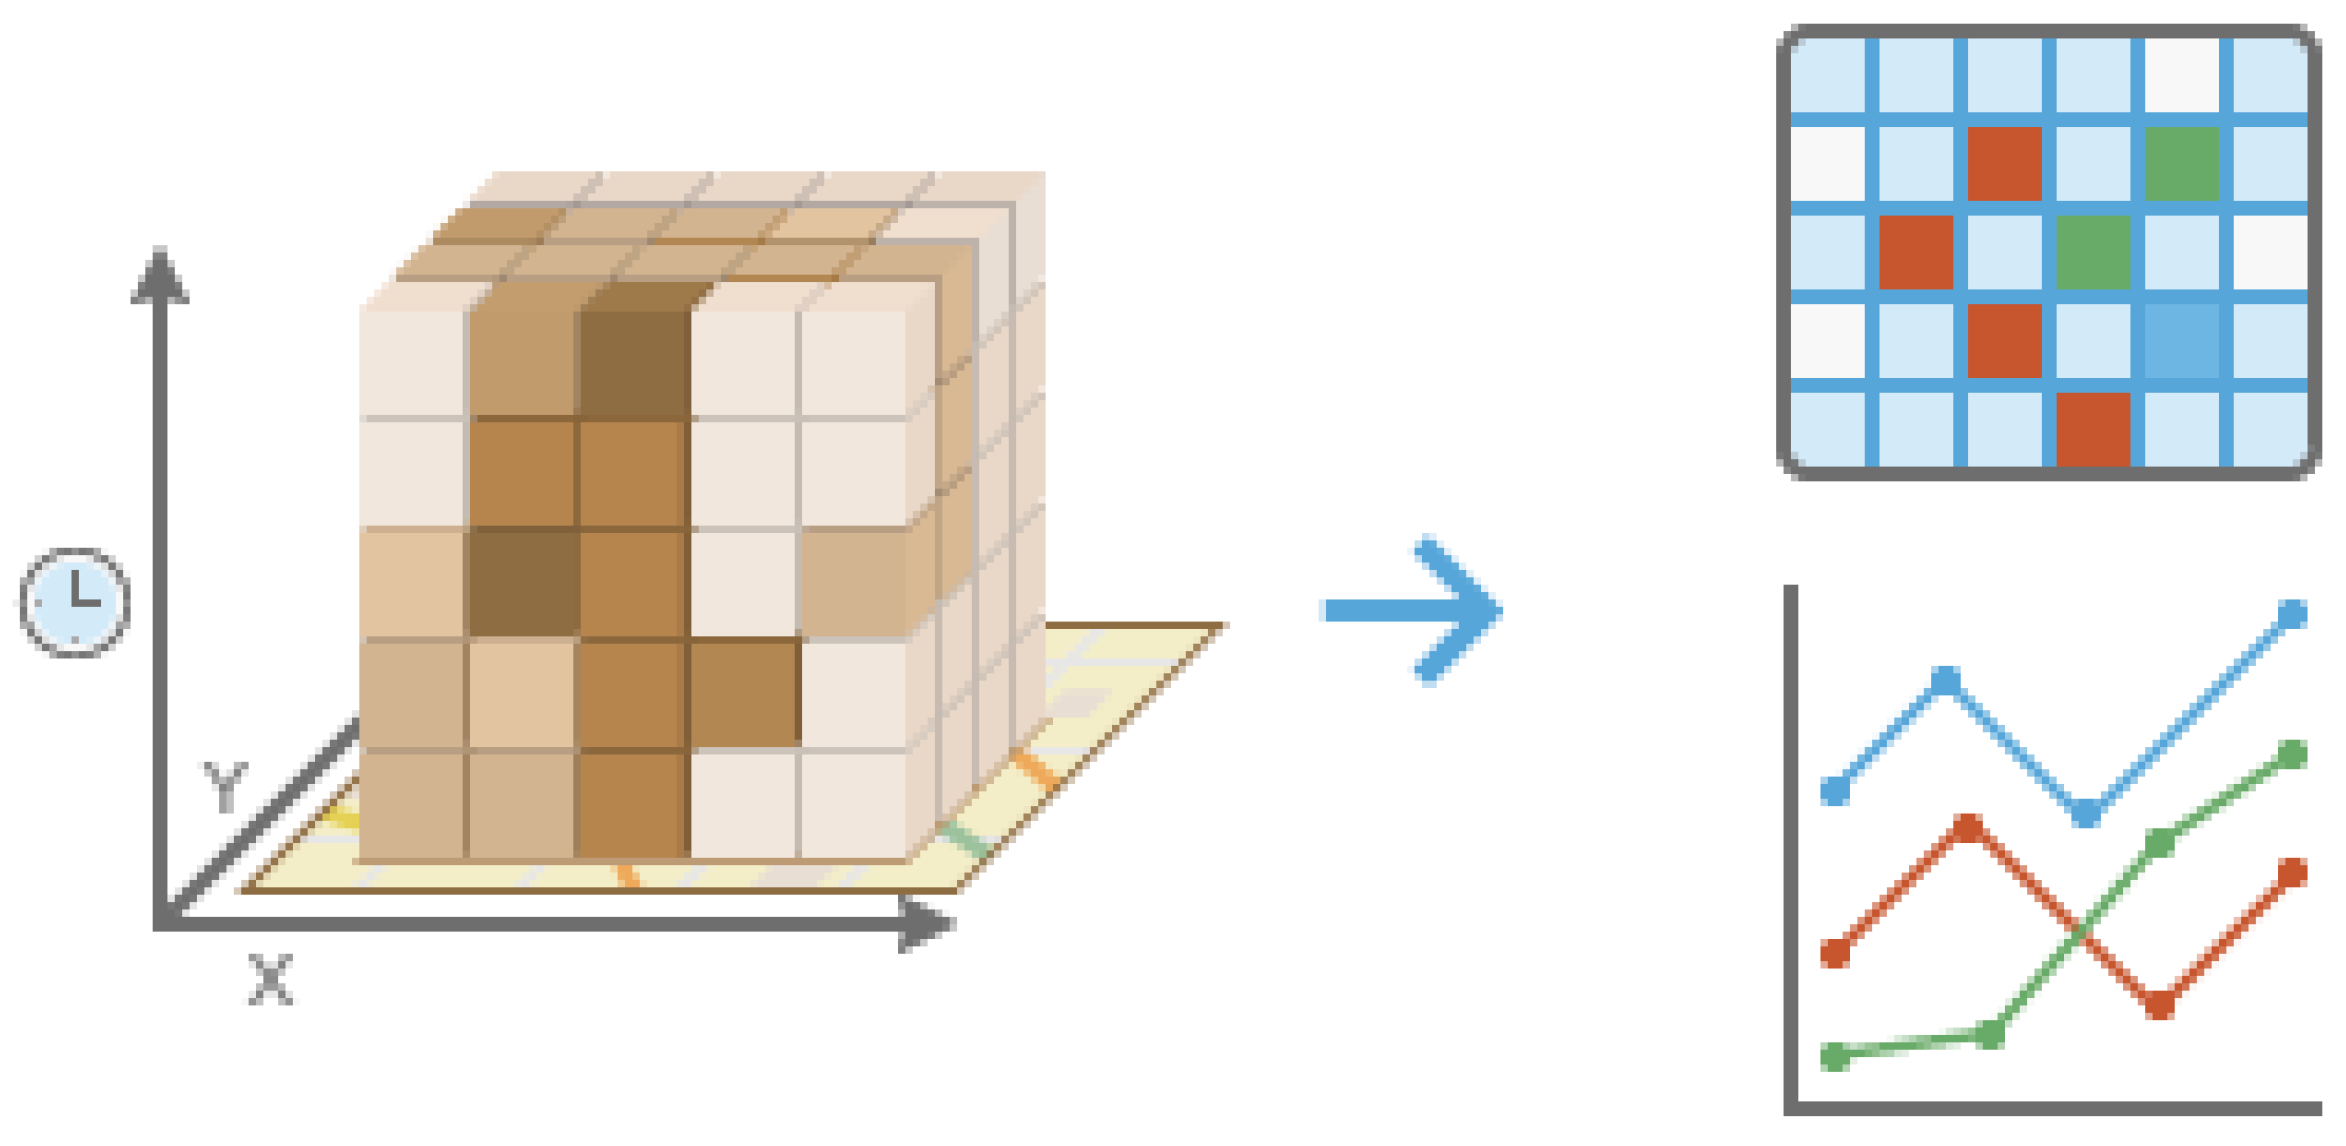
2.3.2. Space-Time Cube

The space-time cube model is a method to aggregate sample points into space-time bars [26]. By creating space-time cube (Figure 2), spatio-temporal data can be visualized in the form of time series analysis, integrated spatial analysis and temporal analysis models [27]. In Figure 2, X and Y represent the spatial location of the geographic entity, Z represents time. The bottom layer is the starting time and the top layer is the latest time, and each cube is composed of the attribute values corresponding to that time, and the values can be differentiated by setting different colors. Because the space-time cube model can ensure the continuity of spatio-temporal data, the space-time cube can show the spatio-temporal characteristics of the whole data when comparing with traditional spatio-temporal analysis [28], instead of the traditional spatio-temporal analysis, which can only visualize a single year, which destroys the continuity of time and ignores the possible interactions between spatio-temporal data [29]. As a temporal variable pattern, spatio-temporal analysis or model persistence metrics are considered worth exploring [30]. The model uses the geometric properties of the time dimension. Spatial entity is a concept of space-time body, and the description of geographic change is simple and straightforward [14]. Three-dimensional visualization of the space-time cube makes it easy to explain trends and patterns of big data over long time scales [31]. The spatio-temporal distribution characteristics, spatio-temporal evolution process, time series clustering analysis and emerging hot spot analysis analysis of drought in the Yangtze River Basin were explored by combining the thinking mode of spatio-temporal analysis, which can provide a scientific basis for the research on spatio-temporal changes of drought for relevant departments [28].

2.3.3. Time Series Clustering Analysis

Time series clustering groups regions with similar trends and patterns into a common cluster. These clusters are unlabeled and simply indicate the similarity of trends and patterns between different regions [32,33]. It is very difficult to analyze and mine the large amount of data and high-dimensional time series, which will affect the overall analysis results [34]. Due to the various applications of time series cluster analysis, there are many different TSC methods [35]. Based on the similarity of time series features, the time series set stored in the space-time cube is divided. It can aggregate time series based on three conditions: having similar time values, tending to increase and decrease at the same time and having similar repeating patterns [23] (Figure 3). In this paper, the SPEI data in the Yangtze River Basin from 1980 to 2019 was combined with the space-time cube model for time series clustering.

2.3.4. Emerging Hot Spot Analysis

Emerging hot spot analysis can identify the spatio-temporal trend and patterns of change in data [36], and analyze the hot or cold spots of a certain feature at the spatio-temporal scale. The Getis-Ord G i * statistic is calculated for each cube bar by specific neighborhood distance and prodomain time step parameters [37]. G i * statistic is the z-score. The obtained z-score allows to know where the clustering of high- and low-valued elements occurs in space. Mann–Kendall trend test method is used to test the trend of hot spot analysis results [38]. The results are divided into seven categories: new hot spot, sporadic hot spot, oscillating hot spot, new cold spot, sporadic cold spot, oscillating cold spot and no pattern detected [26]. Finally, according to the spatial pattern characteristics of the time series of each research unit, statistical analysis and the results of the Mann-Kendall trend test, the research results are classified into different types of spatio-temporal patterns for comprehensive expression according to certain classification principles [39]. In recent years, emerging hot spot analysis has been applied to different scientific fields [40,41].
The formula for G i * is as follows.
G i * = j = 1 n w i j x j X ¯ j = 1 n w i j S n j = 1 n w i j 2 ( j = 1 n w i j ) 2 n 1
where x j is the attribute value of element j, w i j is the spatial weight between elements i and j, n is the total number of elements, and
X ¯ = j = 1 n x j n
S = j = 1 n x j 2 n ( X ¯ ) 2

2.3.5. Geodetector

Geodetector is a new statistical method for detecting spatial stratified heterogeneity and revealing the driving factors behind it [42]. The core idea is based on the assumption that if an independent variable has a significant effect on a dependent variable, then the spatial distribution of the independent and dependent variables should have similarity [43,44]. Geodetector is good at analyzing type quantities, while sequential, ratio or interval quantities can be analyzed with appropriate discretization [45]. Geodetector can also be used for statistical analysis [42]. The core of the theory is to detect the consistency of spatial distribution pattern between the dependent variable and the independent variable through spatial stratified heterogeneity, and to measure the explanatory power of the independent variable on the dependent variable accordingly. Geodetector includes 4 detectors: factor detector, ecological detector, interaction detector and risk detector. These detectors are mutually perfect and supportive relationships in measuring the explanatory power of the independent variables on the spatial distribution of the dependent variable [46].
(a) Factor detector
Detecting the spatial stratified heterogeneity of the dependent variable Y and detecting the extent to which a factor X explains the spatial stratified heterogeneity of Y (Figure 4). The influence of each detection factor on the drought in the Yangtze River Basin can be calculated through factor detector, namely q. A larger q value means that the influence of a detection factor X on the drought in the Yangtze River Basin is greater. The expression is:
q = 1 h = 1 L N h σ h 2 N σ 2
where h is the stratification of variable Y or factor X, h = 1 , 2 , 3 , , L . N h and N are the number of units in layer h and the whole area, respectively. σ h 2 and σ 2 are the variances of the Y values for layer h and the whole region, respectively.
(b) Interaction detector
It is used to analyze the interaction between the factors [42], that is, to assess whether the factors X 1 and X 2 together increase or decrease the explanatory power of the dependent variable Y, or whether the effects of these factors on Y are independent of each other. The method of evaluation is to first calculate the q-values of the two factors X 1 and X 2 on Y: q ( X 1 ) and q ( X 2 ) , and calculate the value of q when they interact (Figure 5): q ( X 1 X 2 ) . Compare q ( X 1 ) , q ( X 2 ) and q ( X 1 X 2 ) .
Drought formation is the result of a combination of drivers [47]. Referring to existing studies [48,49,50,51], 4 major aspects were selected from natural factors (topographic and meteorological factors) and human factors (socio-economic factors and traffic factors), and a total of 12 detection factors X were selected (Table 2). Based on the study of drought differences in the Yangtze River Basin using the factor detector method, the strength of the two-factor effect on drought differences was studied using the interaction detector analysis.

3. Results and Discussion

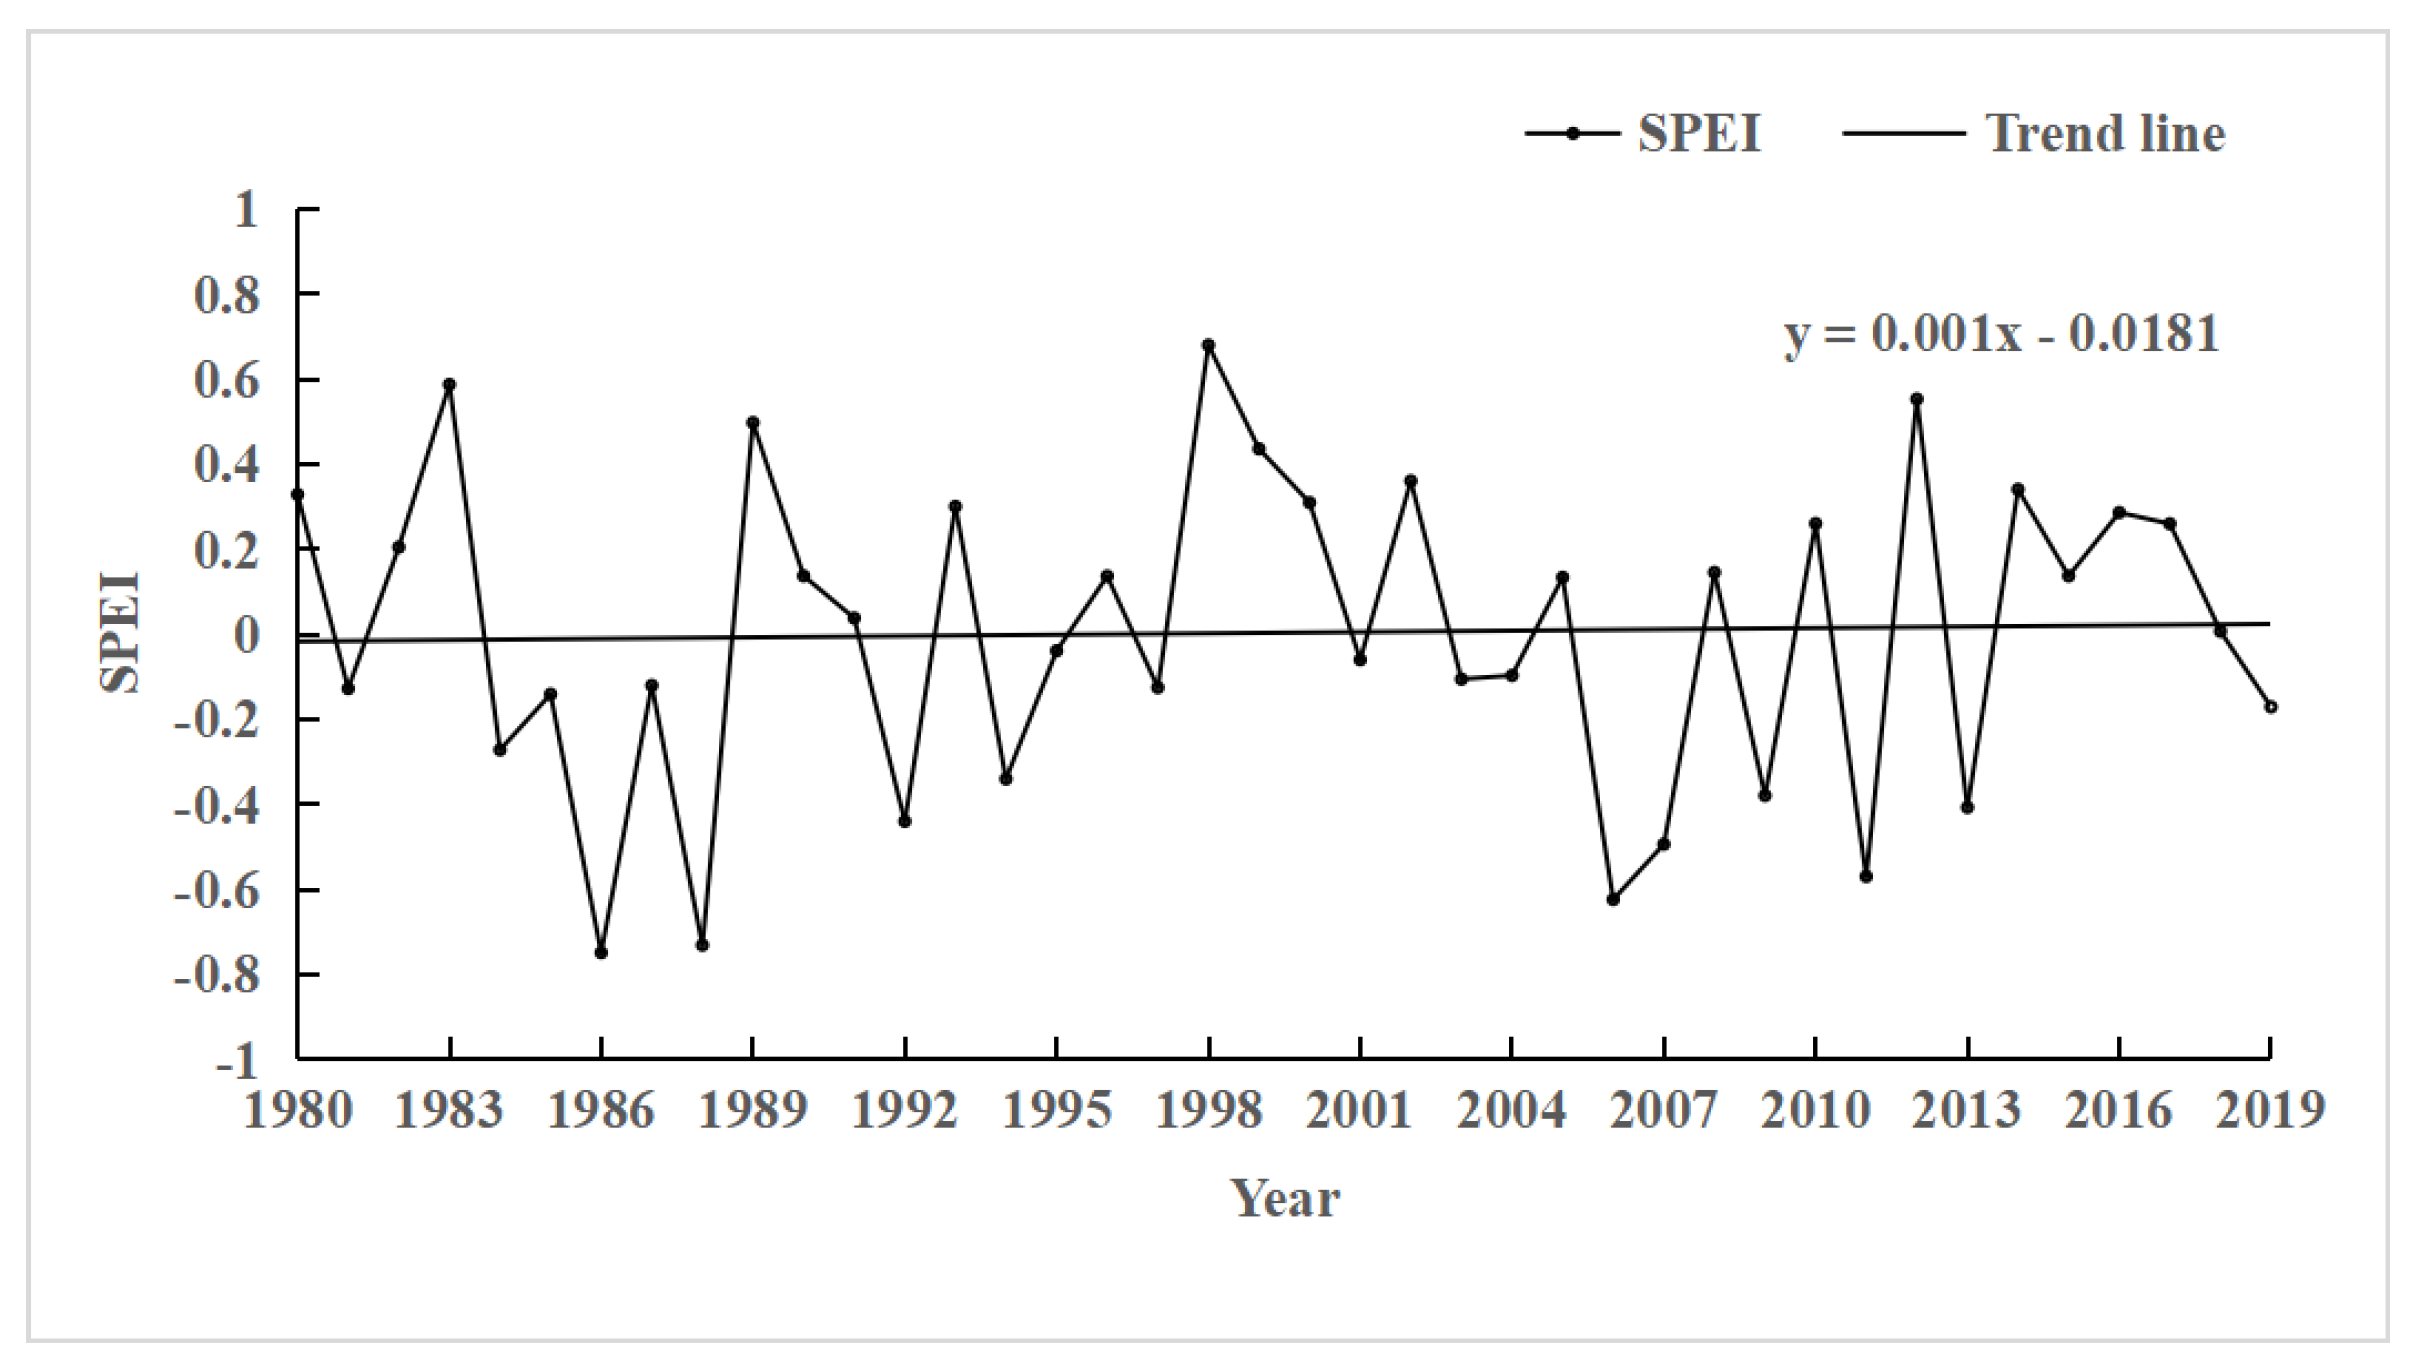
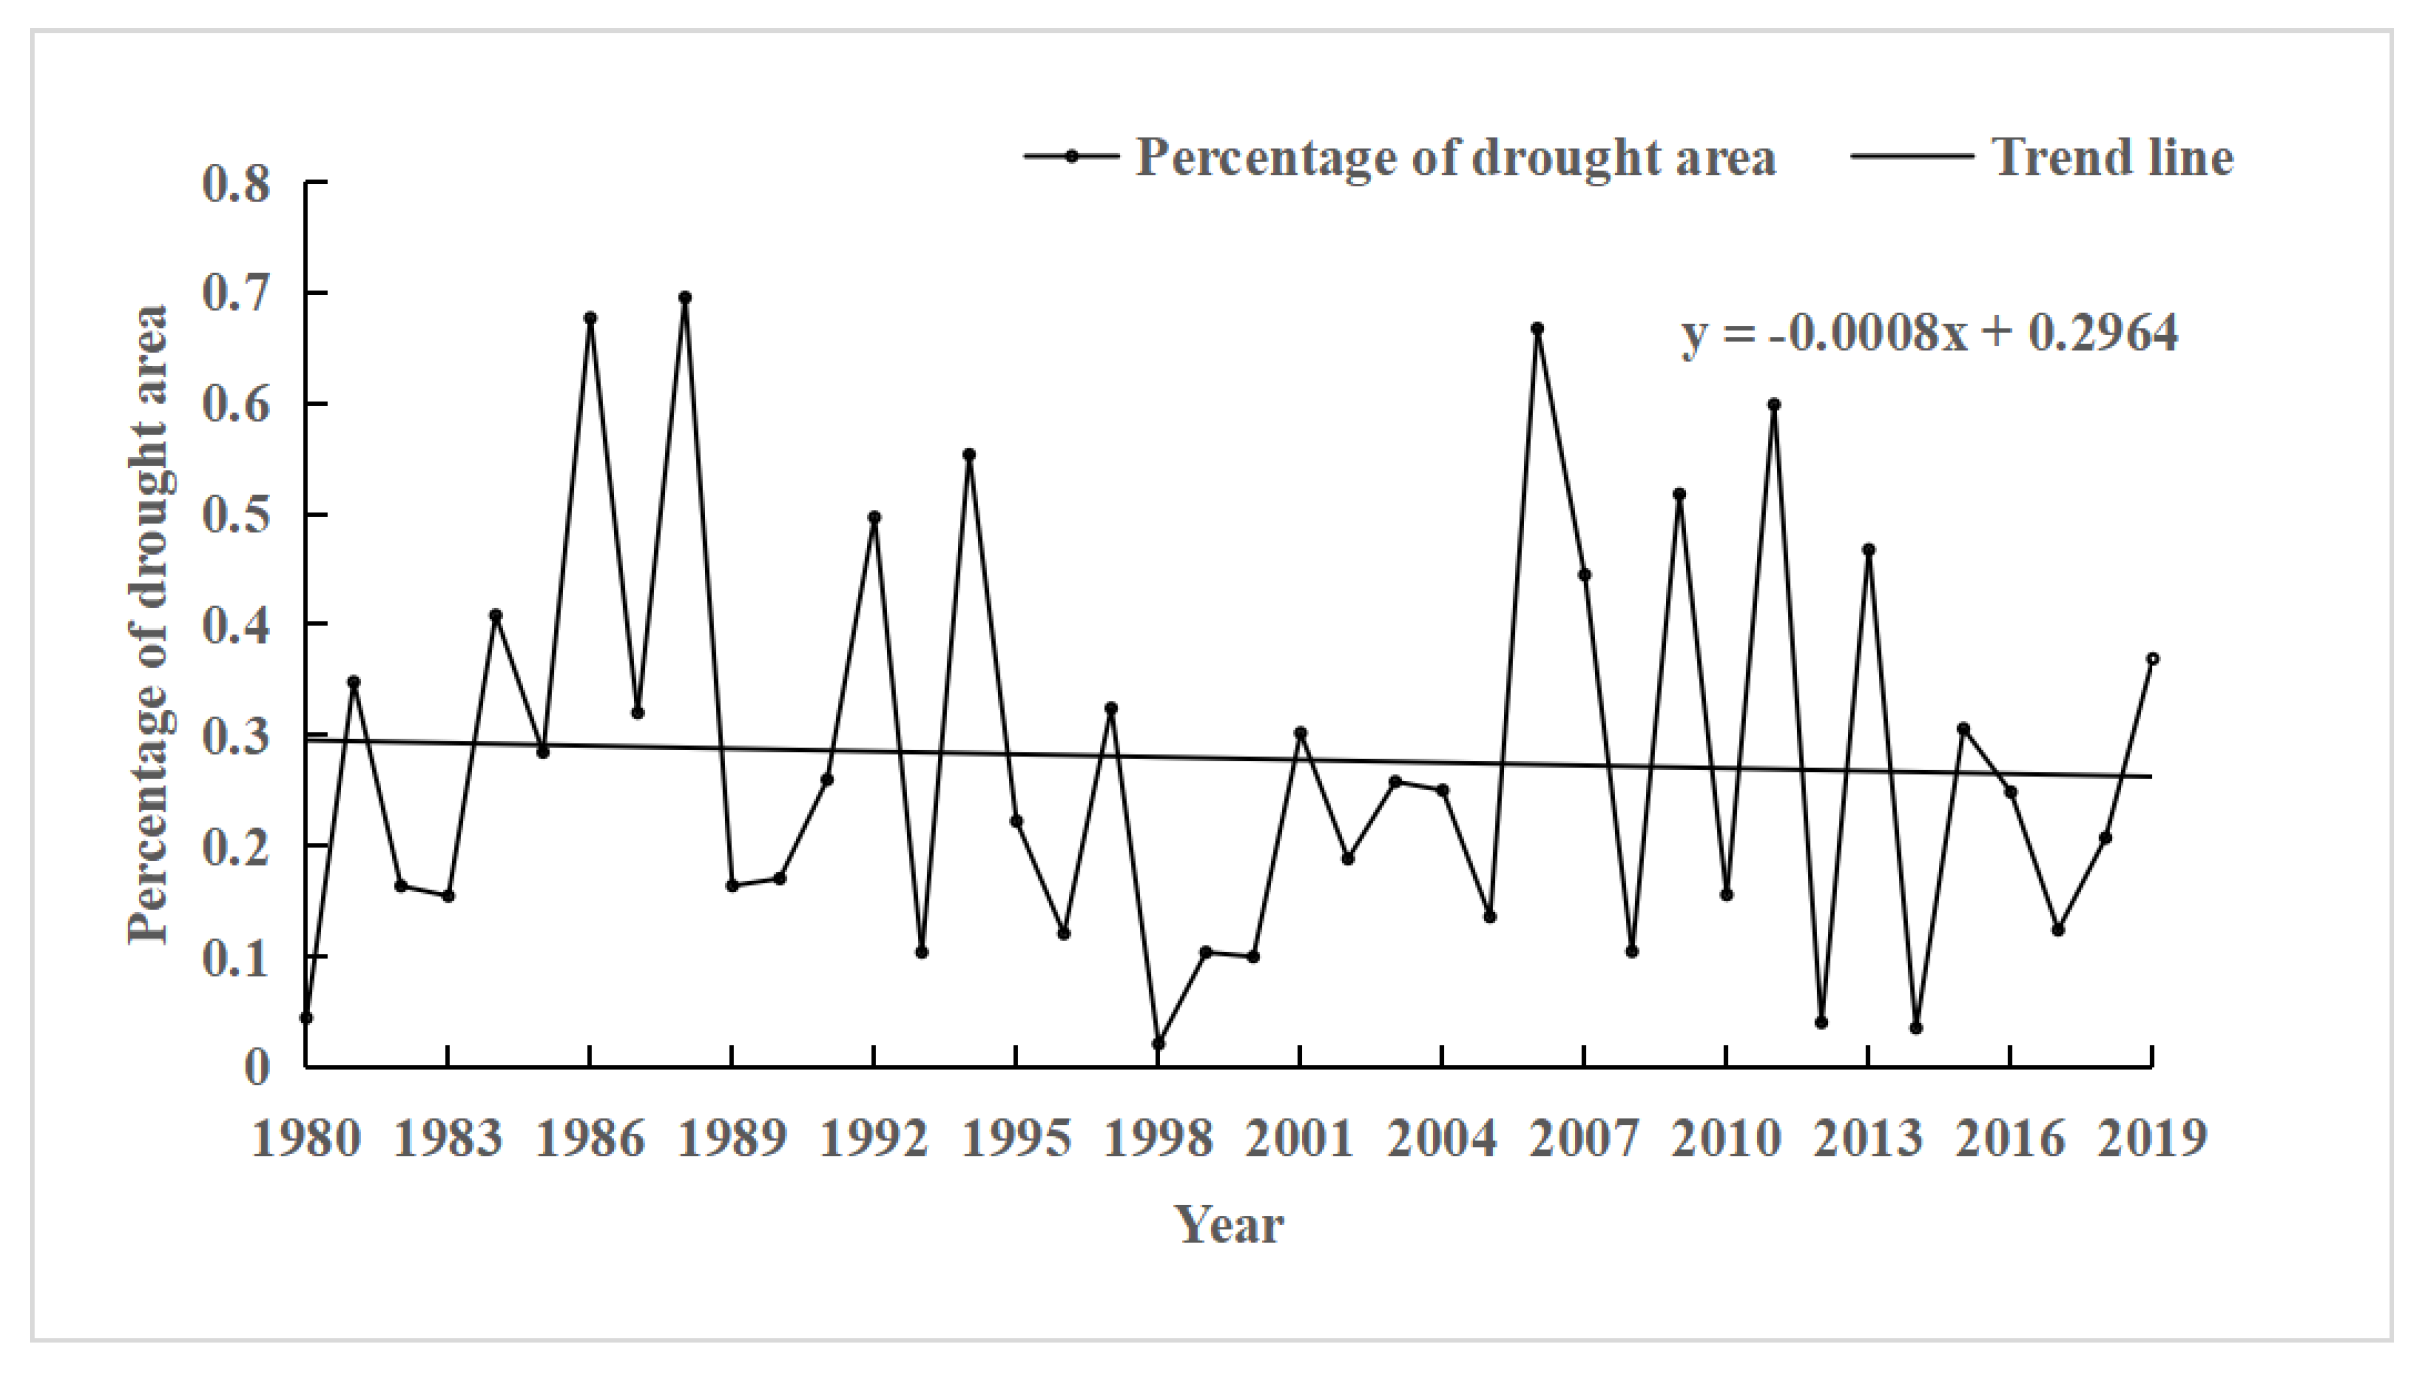
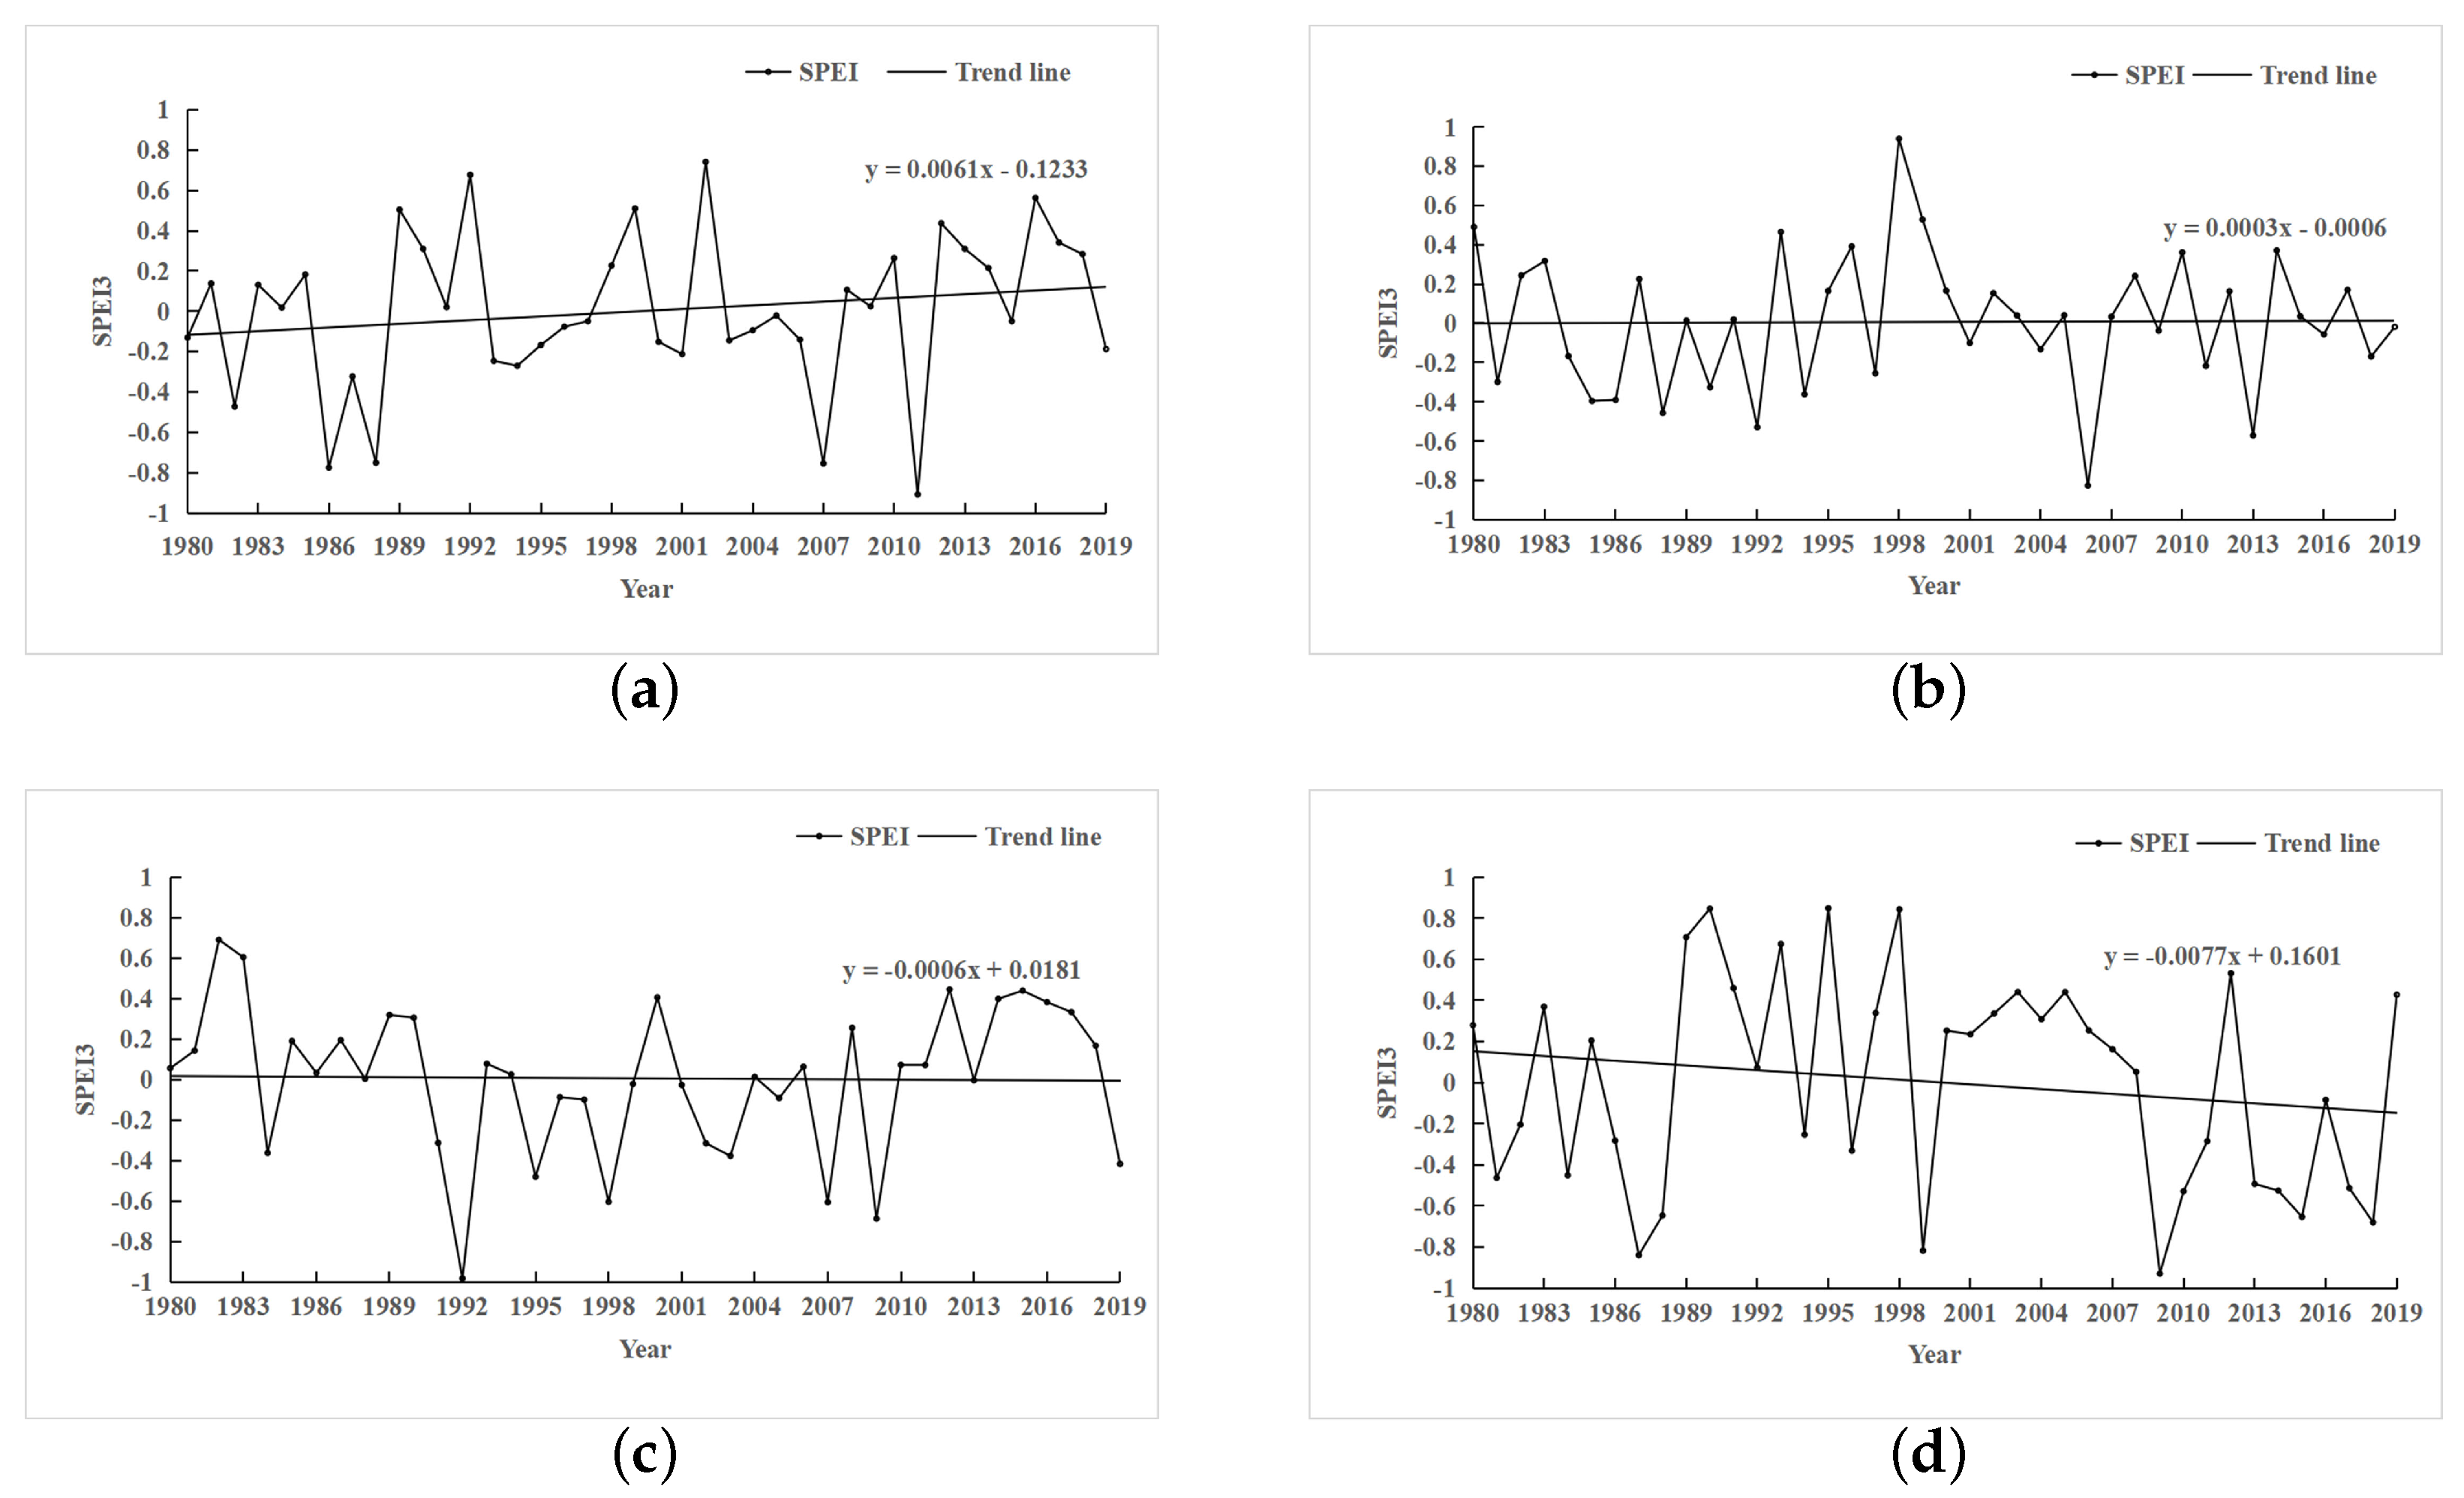
3.1. Temporal Variation Characteristics of Drought

As shown in Figure 6, from 1980 to 2019, the annual SPEI of the Yangtze River Basin showed a obvious form of positive and negative oscillations in the short term. The trend line shows that the overall rate of increase is 0.01/10a, indicating a wet trend in the climate of the Yangtze River Basin, which is consistent with the findings of Zhang et al. [52]. In the past 40 years, the drought periods in the Yangtze River Basin were mainly concentrated in 1986–1988 and 2006–2013, among which the drought intensity was higher in 1986, 1988 and 2006, and with SPEI values of −0.75, −0.73 and −0.62, respectively, indicating Mild drought. The wet periods were mainly concentrated in 1980–1983 and 1989–2005, among which 1983 and 1998 were relatively wet, with SPEI values reaching 0.59 and 0.68, respectively.
This paper counted the area of drought areas in each year, as shown in Figure 7. It can be found that the percentage of drought areas in 1986, 1988 and 2006 were 0.68, 0.70 and 0.67, respectively, which indicates that the majority of areas in that time node were in drought.
The seasons are defined according to the meteorological division method. The division rules of different seasons and months are in the order of March to May (spring), June to August (summer), September to November (autumn), and December to February of the next year (winter).
As show in Figure 8, the seasonal time scale results showed that the overall SPEI of each seasonal scale in the Yangtze River Basin from 1980–2019 showed significant positive and negative fluctuations compared to the annual scale. The following conclusions can be drawn from the trend line: in spring and summer, the SPEI values showed no significant increasing trend, with an increasing rate of 0.061/10a and 0.003/10a, respectively; in autumn and winter, the SPEI values showed no significant decreasing trend, with decreasing rates of 0.006/10a and 0.077/10a, respectively. Compared with other seasons, the frequency of winter drought in the Yangtze River Basin from 1980 to 2019 was higher, and the variation trend of summer SPEI was more similar to that of the annual scale.

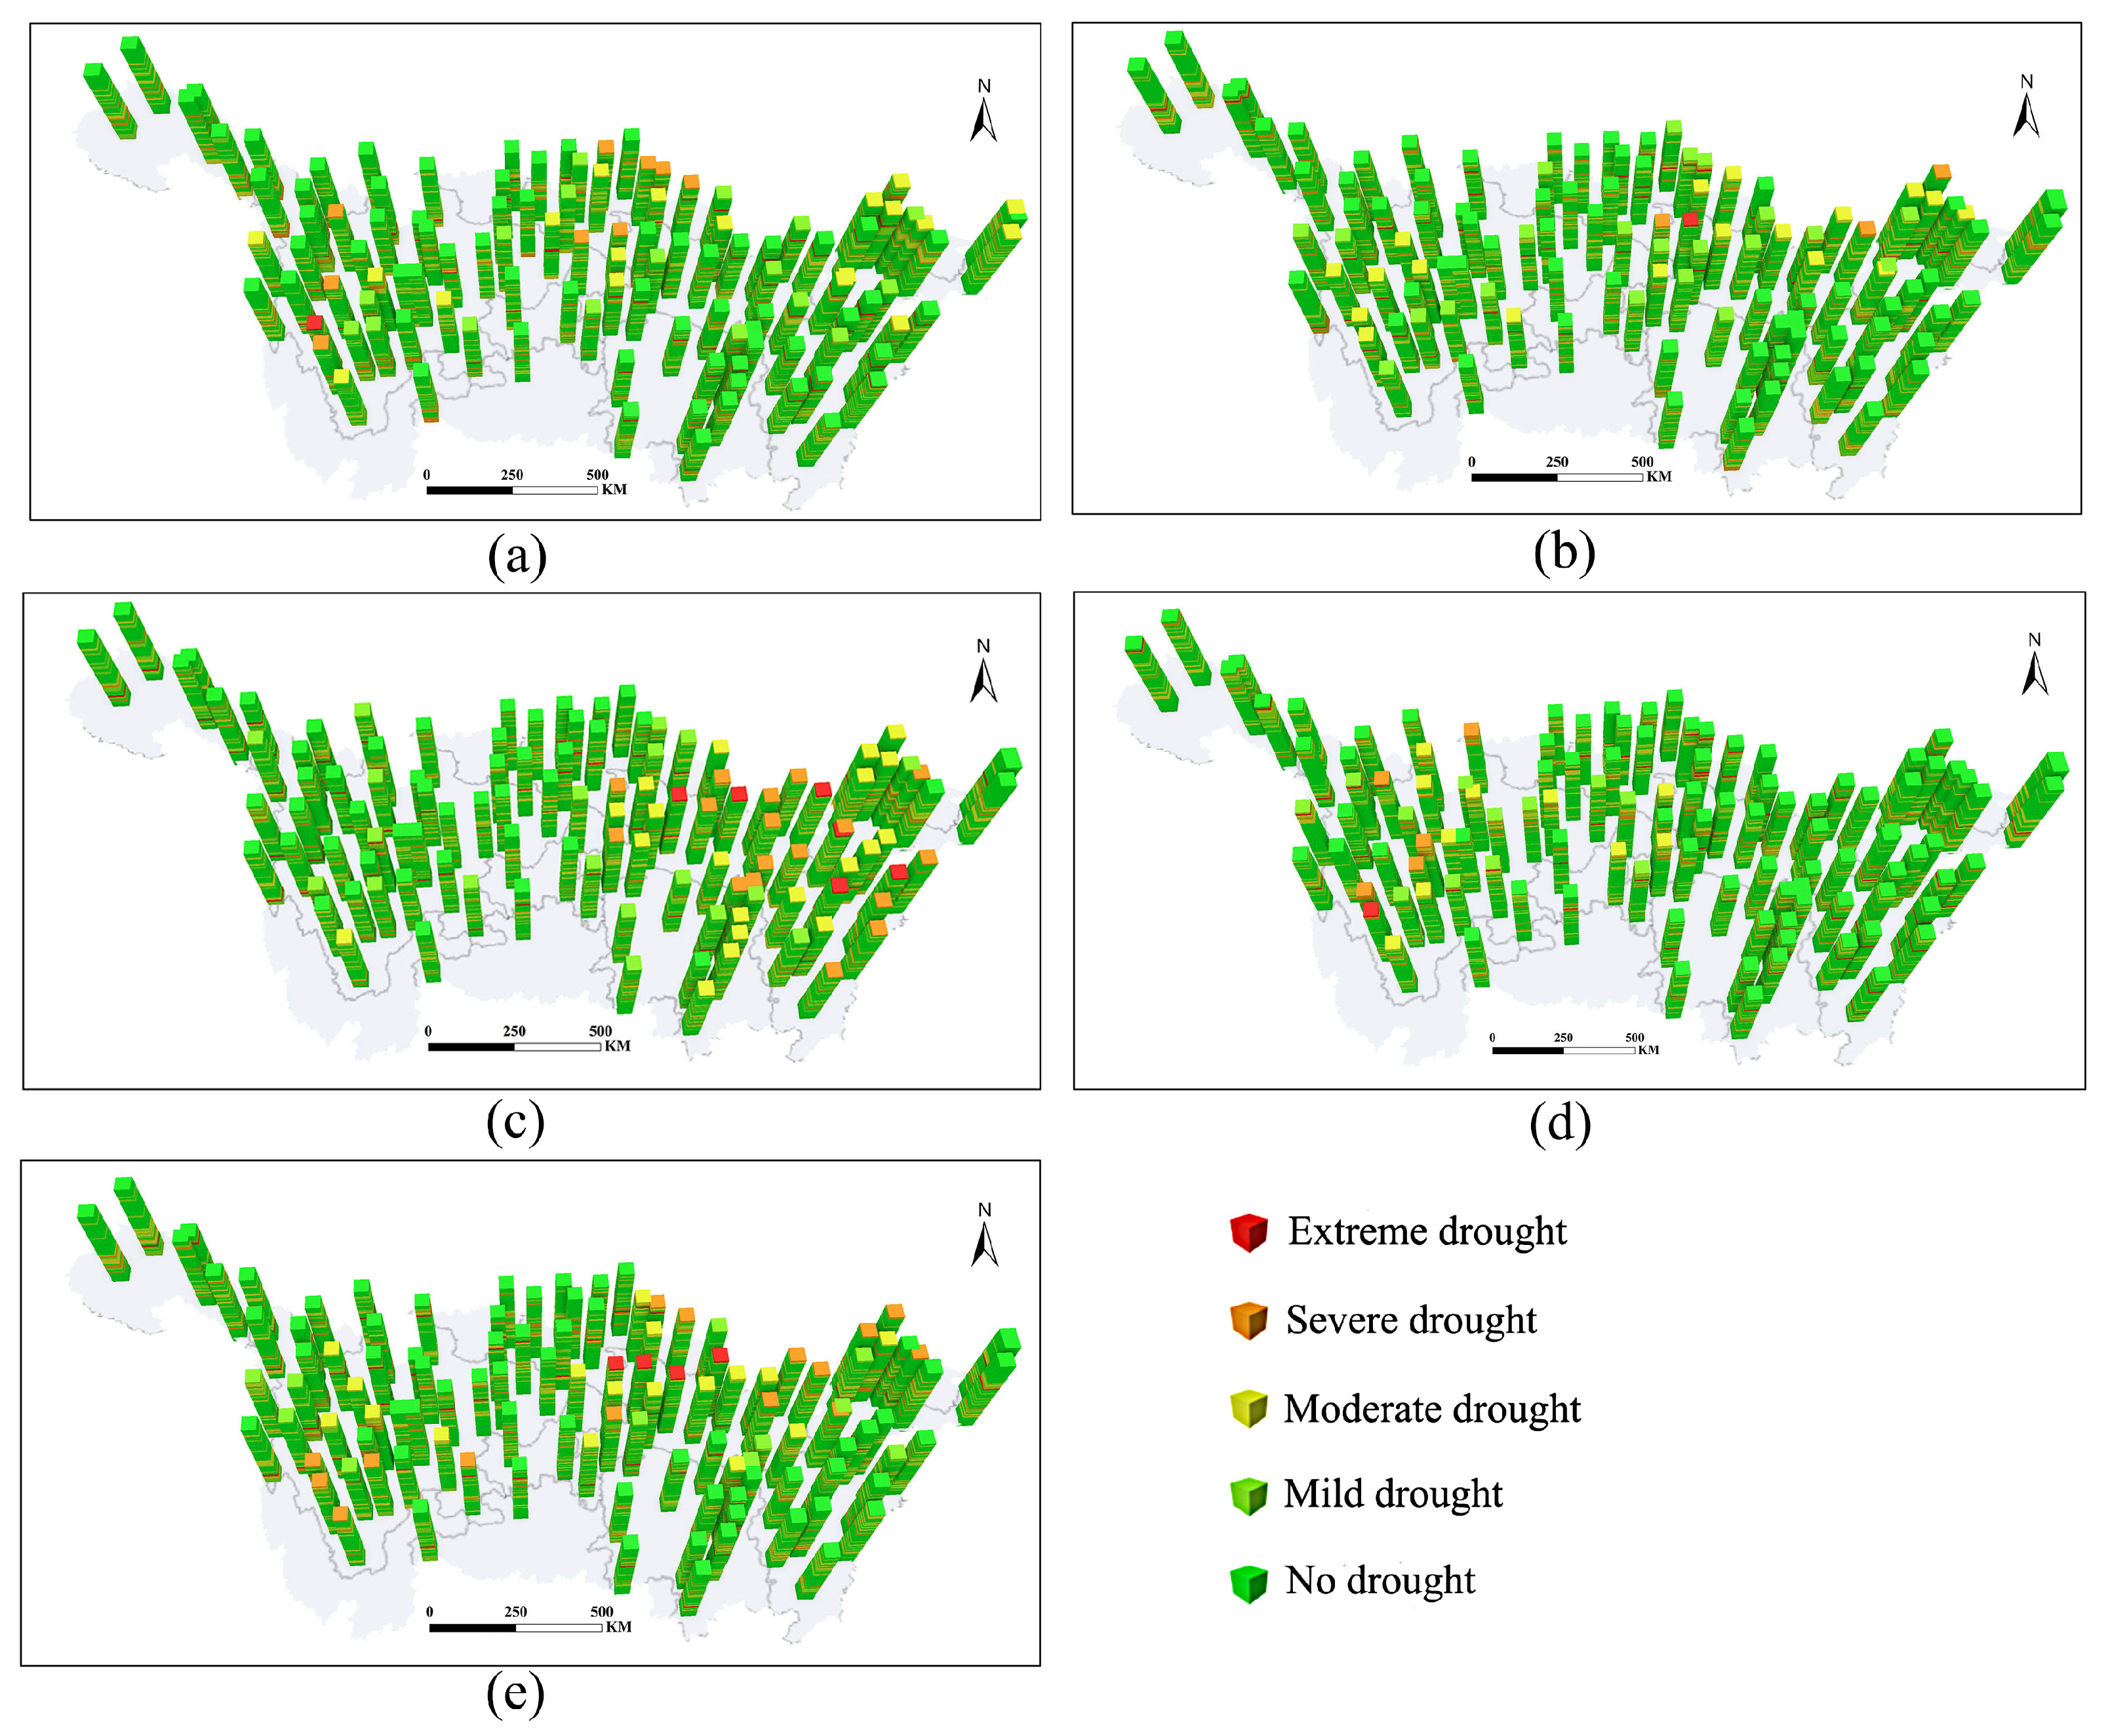
3.2. Spatial Variation Characteristics of Drought

3.2.1. Space-Time Cube for Multi-Scale SPEI

This paper combined with space-time cube model to demonstrate the spatio-temporal distribution of multi-scale SPEI of 114 meteorological stations in the Yangtze River Basin. Figure 9 shows the spatio-temporal monitoring of drought in the Yangtze River Basin at the seasonal scales of spring, summer, autumn, and winter, respectively. As a whole, most areas of the Yangtze River Basin and most of the time show light drought or no drought. From the perspective of time and space, there are obvious seasonal differences in drought conditions in the Yangtze River Basin. There is no perennial drought in the same season in different years, but the drought conditions has gradually improved in recent years, and summer is wetter than other seasons. From the annual scale (Figure 9e), the areas with severe drought were mainly distributed in the southwest and east of the Yangtze River Basin. On the whole, drought occurred at each meteorological station, and there were three main conditions: early drought conditions were more severe and gradually improved, early drought conditions were good but gradually deteriorated, and always in no drought or mild drought state.

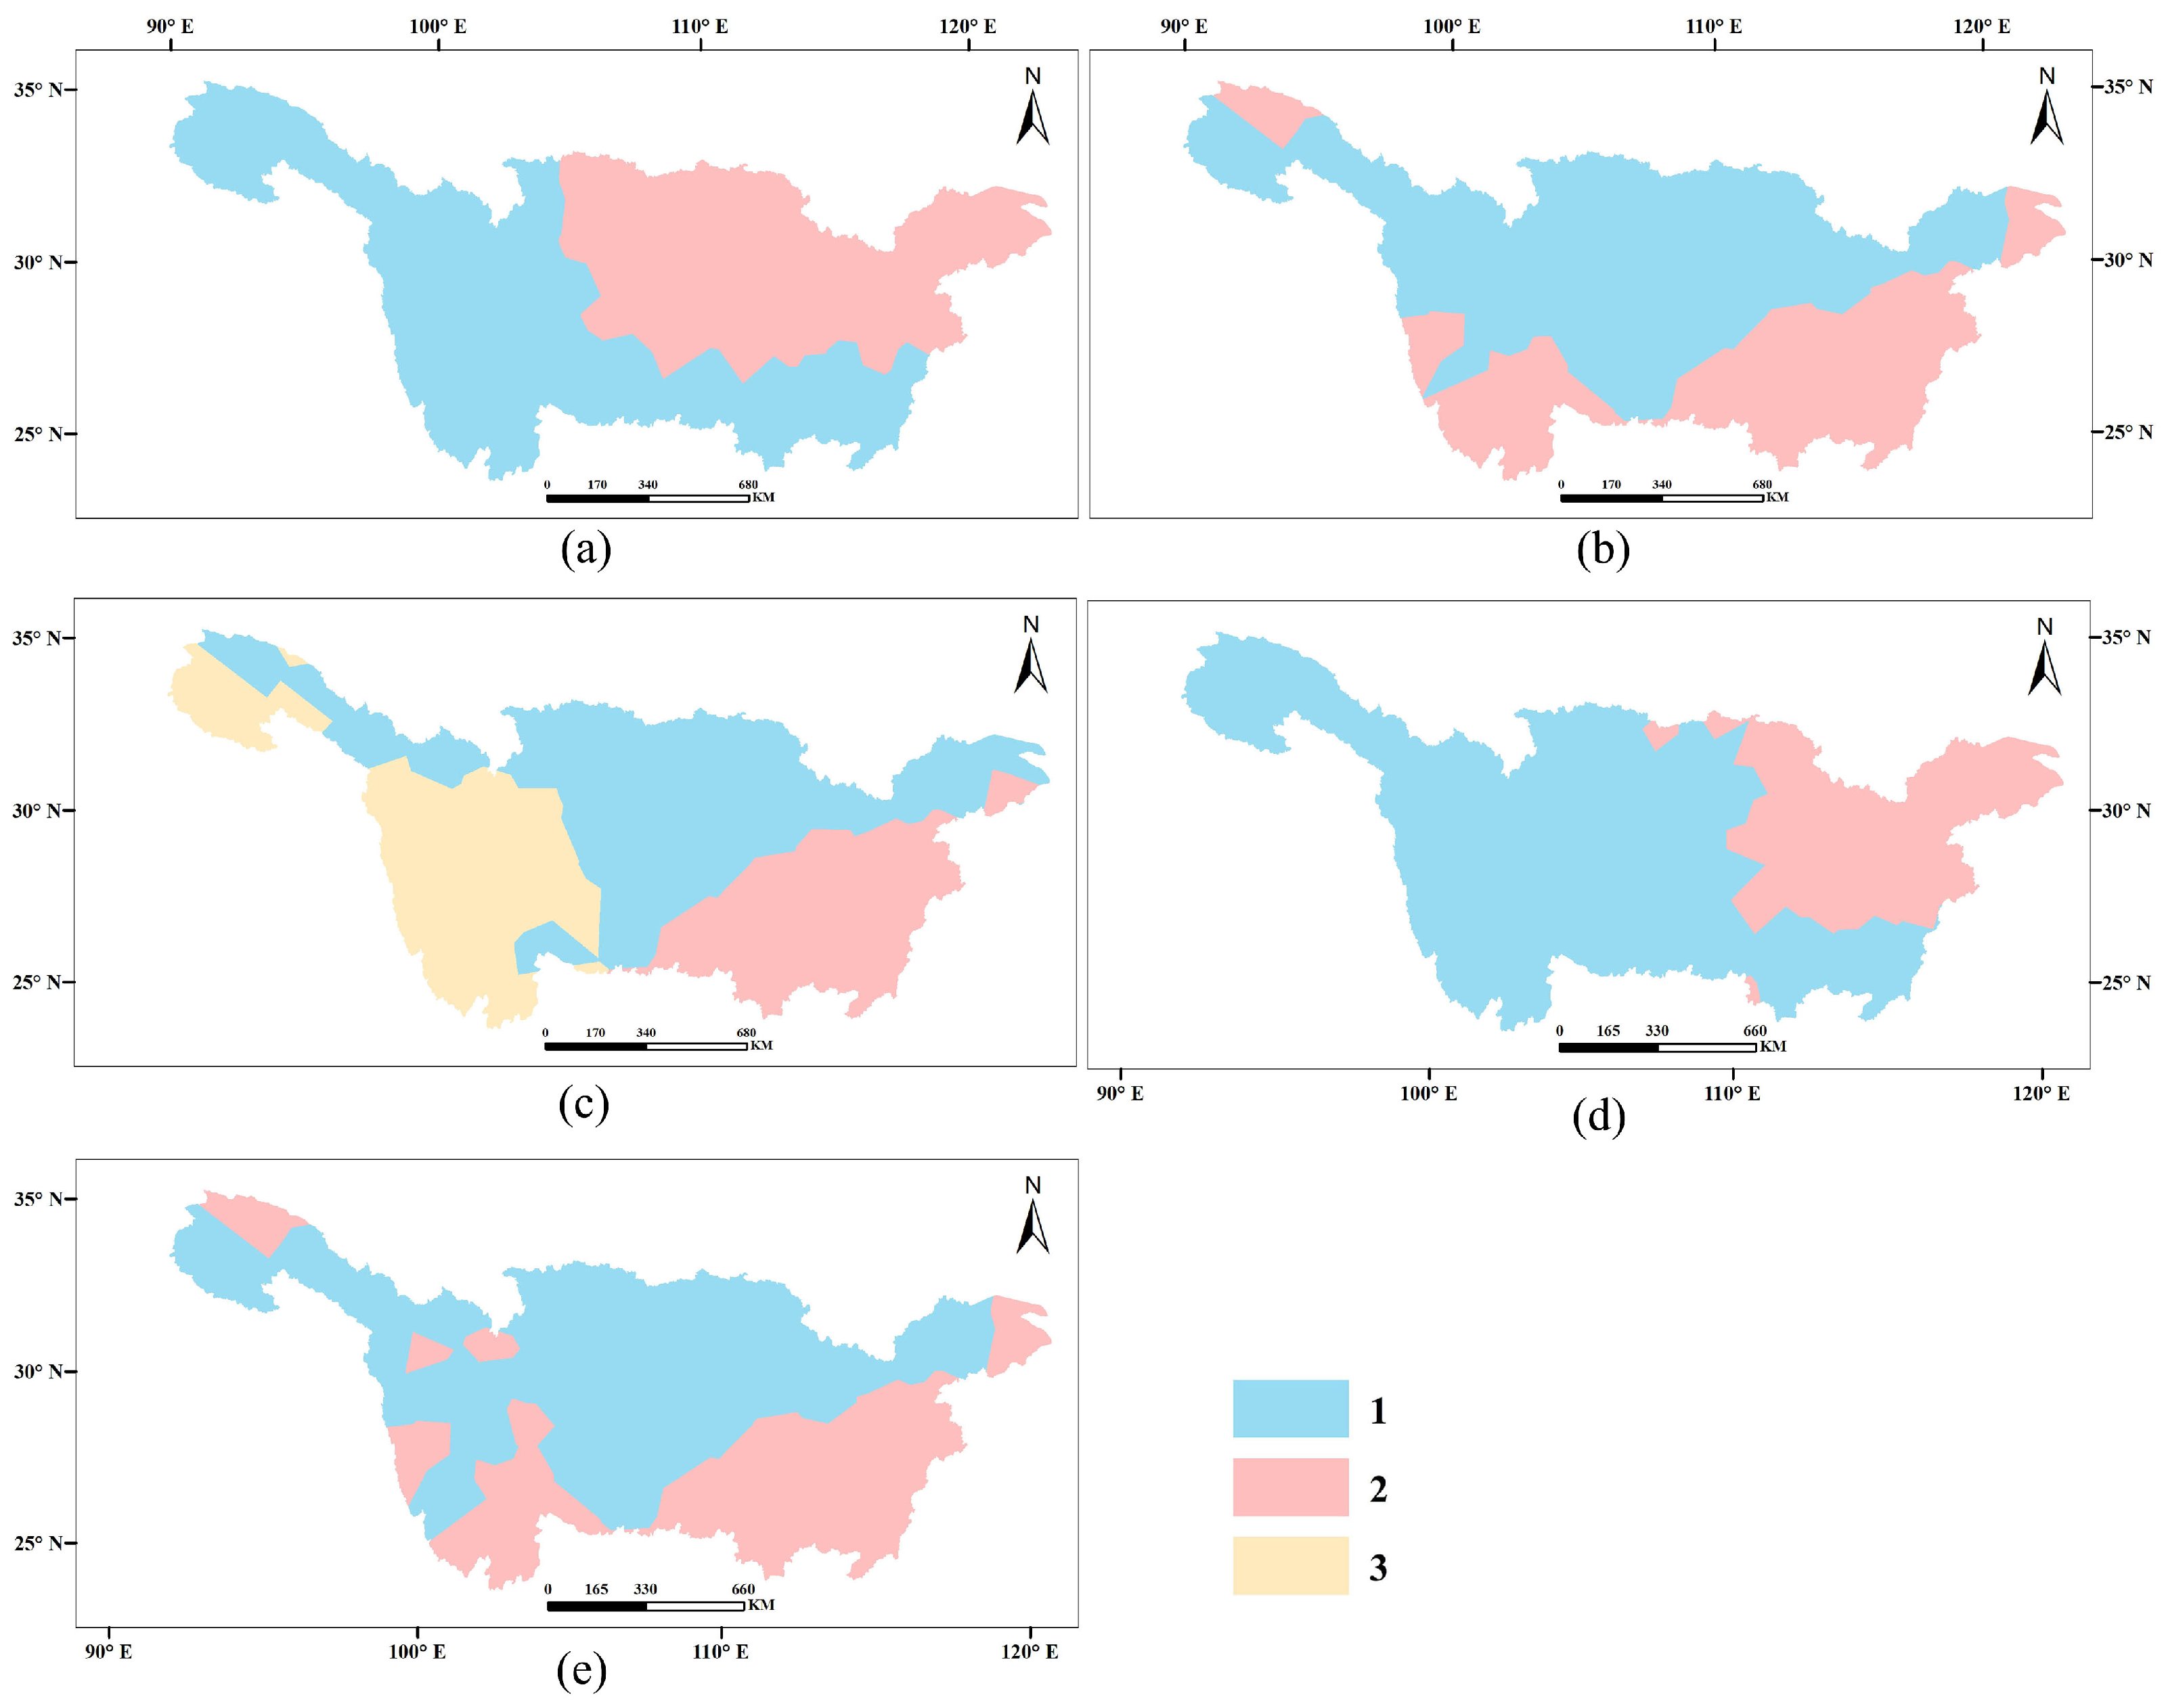
3.2.2. Result of Time Series Clustering Analysis

In this paper, the spatio-temporal distribution of the drought in the Yangtze River Basin in the past 40 years was clustered by the space-time cube results, and the results are shown in Figure 10. The time series clustering results with SPEI seasonal scale and SPEI annual scale are in Figure 10. The number of clusters in Figure 10 refers to the same color region as one class, for example, Figure 10a is two colors, so the number of clusters is 2. As shown in Figure 10, the number of SPEI seasonal-scale and annual-scale clusters is small, indicating that drought conditions do not significantly differ among regions in the Yangtze River Basin. Compared with spring, summer and winter, the number of clusters in autumn is higher and mainly concentrated in the western part of the Yangtze River Basin, because the Yangtze River Basin spans the eastern, central and western parts of China. There are significant differences in precipitation and temperature in autumn in the west compared with other regions, and therefore the differences in drought conditions become larger.

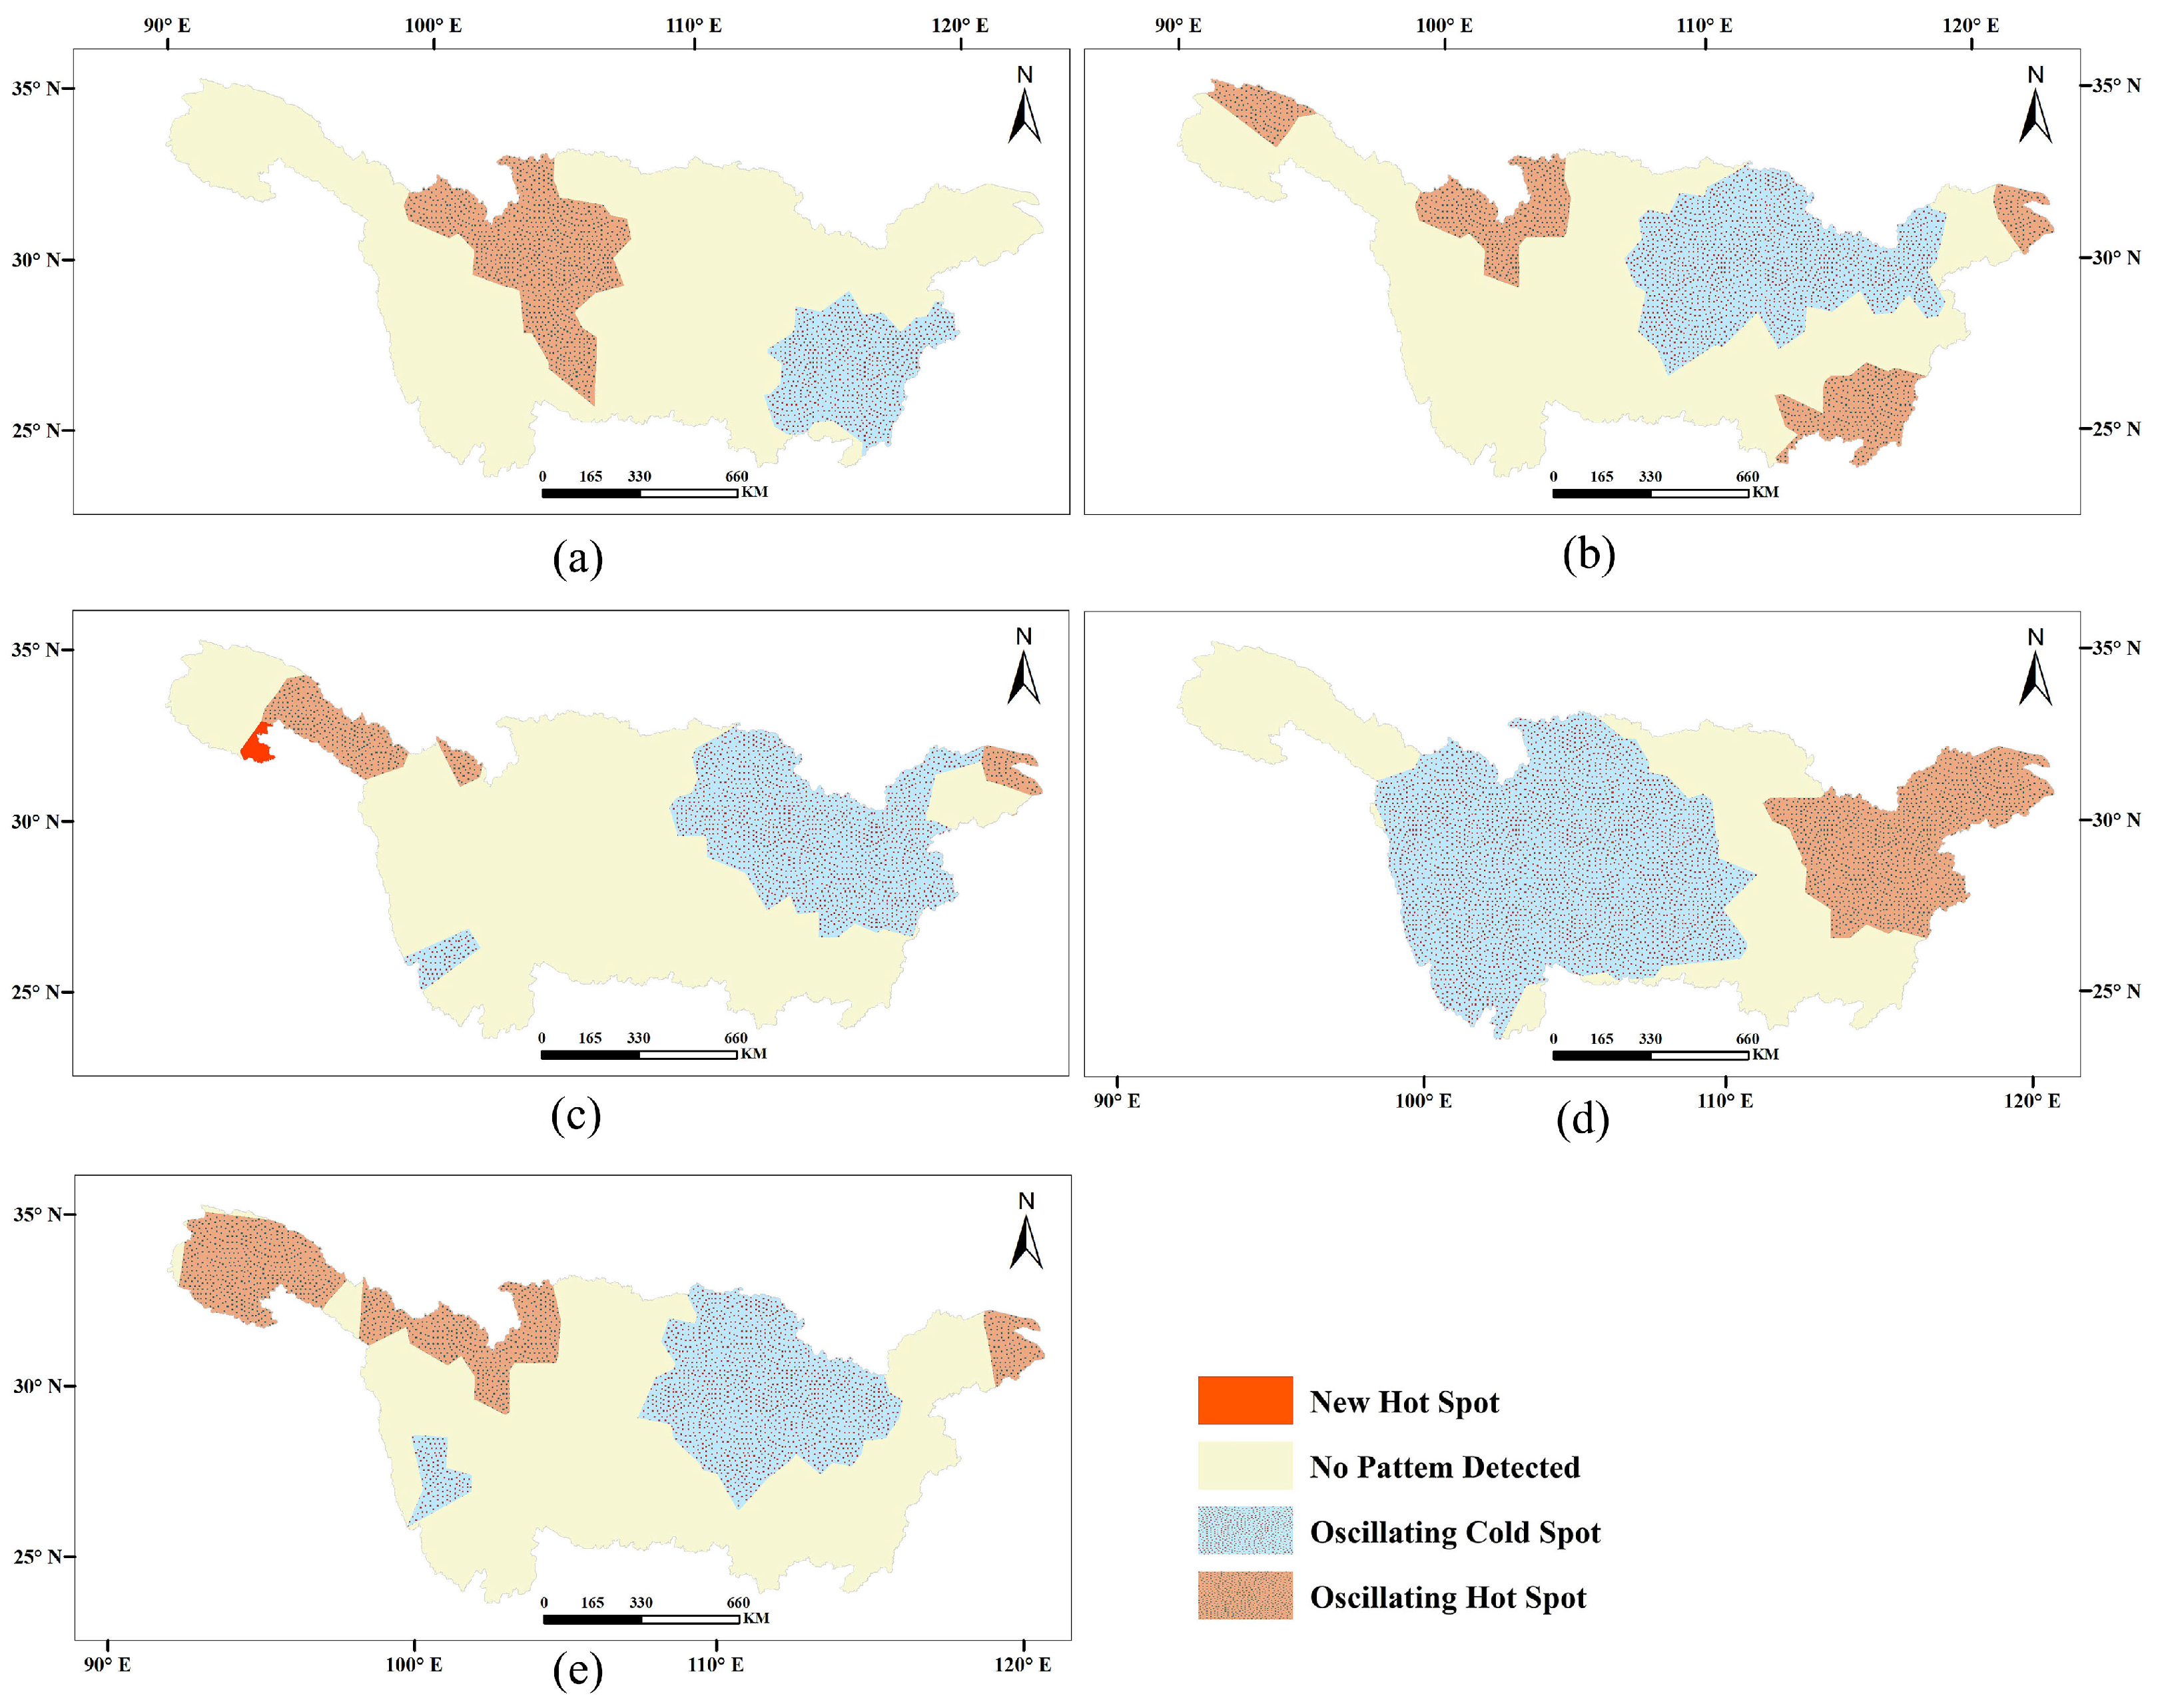
3.2.3. Result of Emerging Hot Spot Analysis

Combined with the space-time cube results, the emerging hot spots of multi-scale drought in the Yangtze River Basin in recent 40 years were analyzed (Figure 11). From the annual scale of SPEI (Figure 11e), there is an oscillating hot spot trend in the northwest and northeast of the Yangtze River Basin, indicating that severe drought years in these regions occur irregularly in historical years.
From the SPEI seasonal scale (Figure 11a–d), in spring, there is oscillating hot spot trend in the west of the Yangtze River Basin, indicating that the severe drought years in these areas occurred irregularly in historical years; in the southeast of the Yangtze River Basin, there is oscillating cold spot trend, indicating that the drought in these areas is not severe, but has historically occurred irregularly. In summer, there is an oscillating hot spot trend in the west, east and southeast of the Yangtze River Basin, indicating that the severe drought years in these areas occurred irregularly in historical years; in the central and east of the Yangtze River Basin, there is oscillating cold spot trend, indicating that the drought in these areas is not severe, but has historically occurred irregularly. In autumn, there is new hot spot trend in the northwest of Yangtze River Basin, the drought was not serious in the region previously, but in recent years, the drought is serious; there is oscillating hot spot trend in the east and northwest of Yangtze River Basin, indicating that the severe drought years in these areas occurred irregularly in historical years; in the west of Yangtze River Basin, there is oscillating cold spot trend, indicating that the drought in these areas is not severe, but has historically occurred irregularly. In winter, there is oscillating hot spot trend in the east of Yangtze River Basin, indicating that the severe drought years in these areas occurred irregularly in historical years; in the west of Yangtze River Basin, there is oscillating cold spot trend, indicating that the drought in these areas is not severe, but has historically occurred irregularly.

3.3. Analysis of Drought Drivers in the Yangtze River Basin

3.3.1. Factor Detector

In this paper, time cross-sectional data of 2000, 2005, 2010, and 2015 were selected for factor detection of each impact factor (the coding meanings are shown in Table 1), and the results are shown in Table 3. This paper selected 12 indicators that may affect drought differences in four dimensions. The average q values of each dimension of the indicators in each period were summed to obtain the effect intensity of different dimensions on drought differences in the Yangtze River Basin, while each effect intensity was divided into two equal effect levels, and it was defined as a strong effect dimension layer when q > 0.5, otherwise it was a weak effect intensity layer. The ranking of dimensional effect results is meteorology (0.59) > topography (0.55) > traffic location (0.19) > socio-economic (0.16). Meteorology and topography are the strong dimensional layers, while transportation location and socio-economics are the weak dimensional layers, which is consistent with the actual situation and confirms that meteorology and topography play a significant role in affecting drought differences in the Yangtze River Basin.
From the results of the q values of each influencing factor, the top three influencing factors with q values were considered as the dominant factors. The top 3 in 2000 are elevation (0.18), distance to railroad (0.18) and average annual temperature (0.16). The top 3 in 2005 are average annual temperature (0.32), soil type (0.30) and elevation (0.28). The top 3 in 2010 are average annual precipitation (0.43), elevation (0.19) and soil type (0.10). The top 3 in 2015 are average annual precipitation (0.70), soil type (0.44) and average annual temperature (0.42).
The results of the average q values of the influencing factors show that the average annual precipitation (0.34), elevation (0.27), average annual temperature (0.25) and soil type (0.24) are dominant, among which the factor with the strongest effect is the average annual precipitation.
From the changes in the q values of the selected influencing factors in each period, the more obvious change is the average annual precipitation, which is gradually dominating over time; the elevation, soil type and average annual temperature show an increasing trend and dominate in each period, which indicates that the influence of human behavioral activities on the environment is gradually increasing.

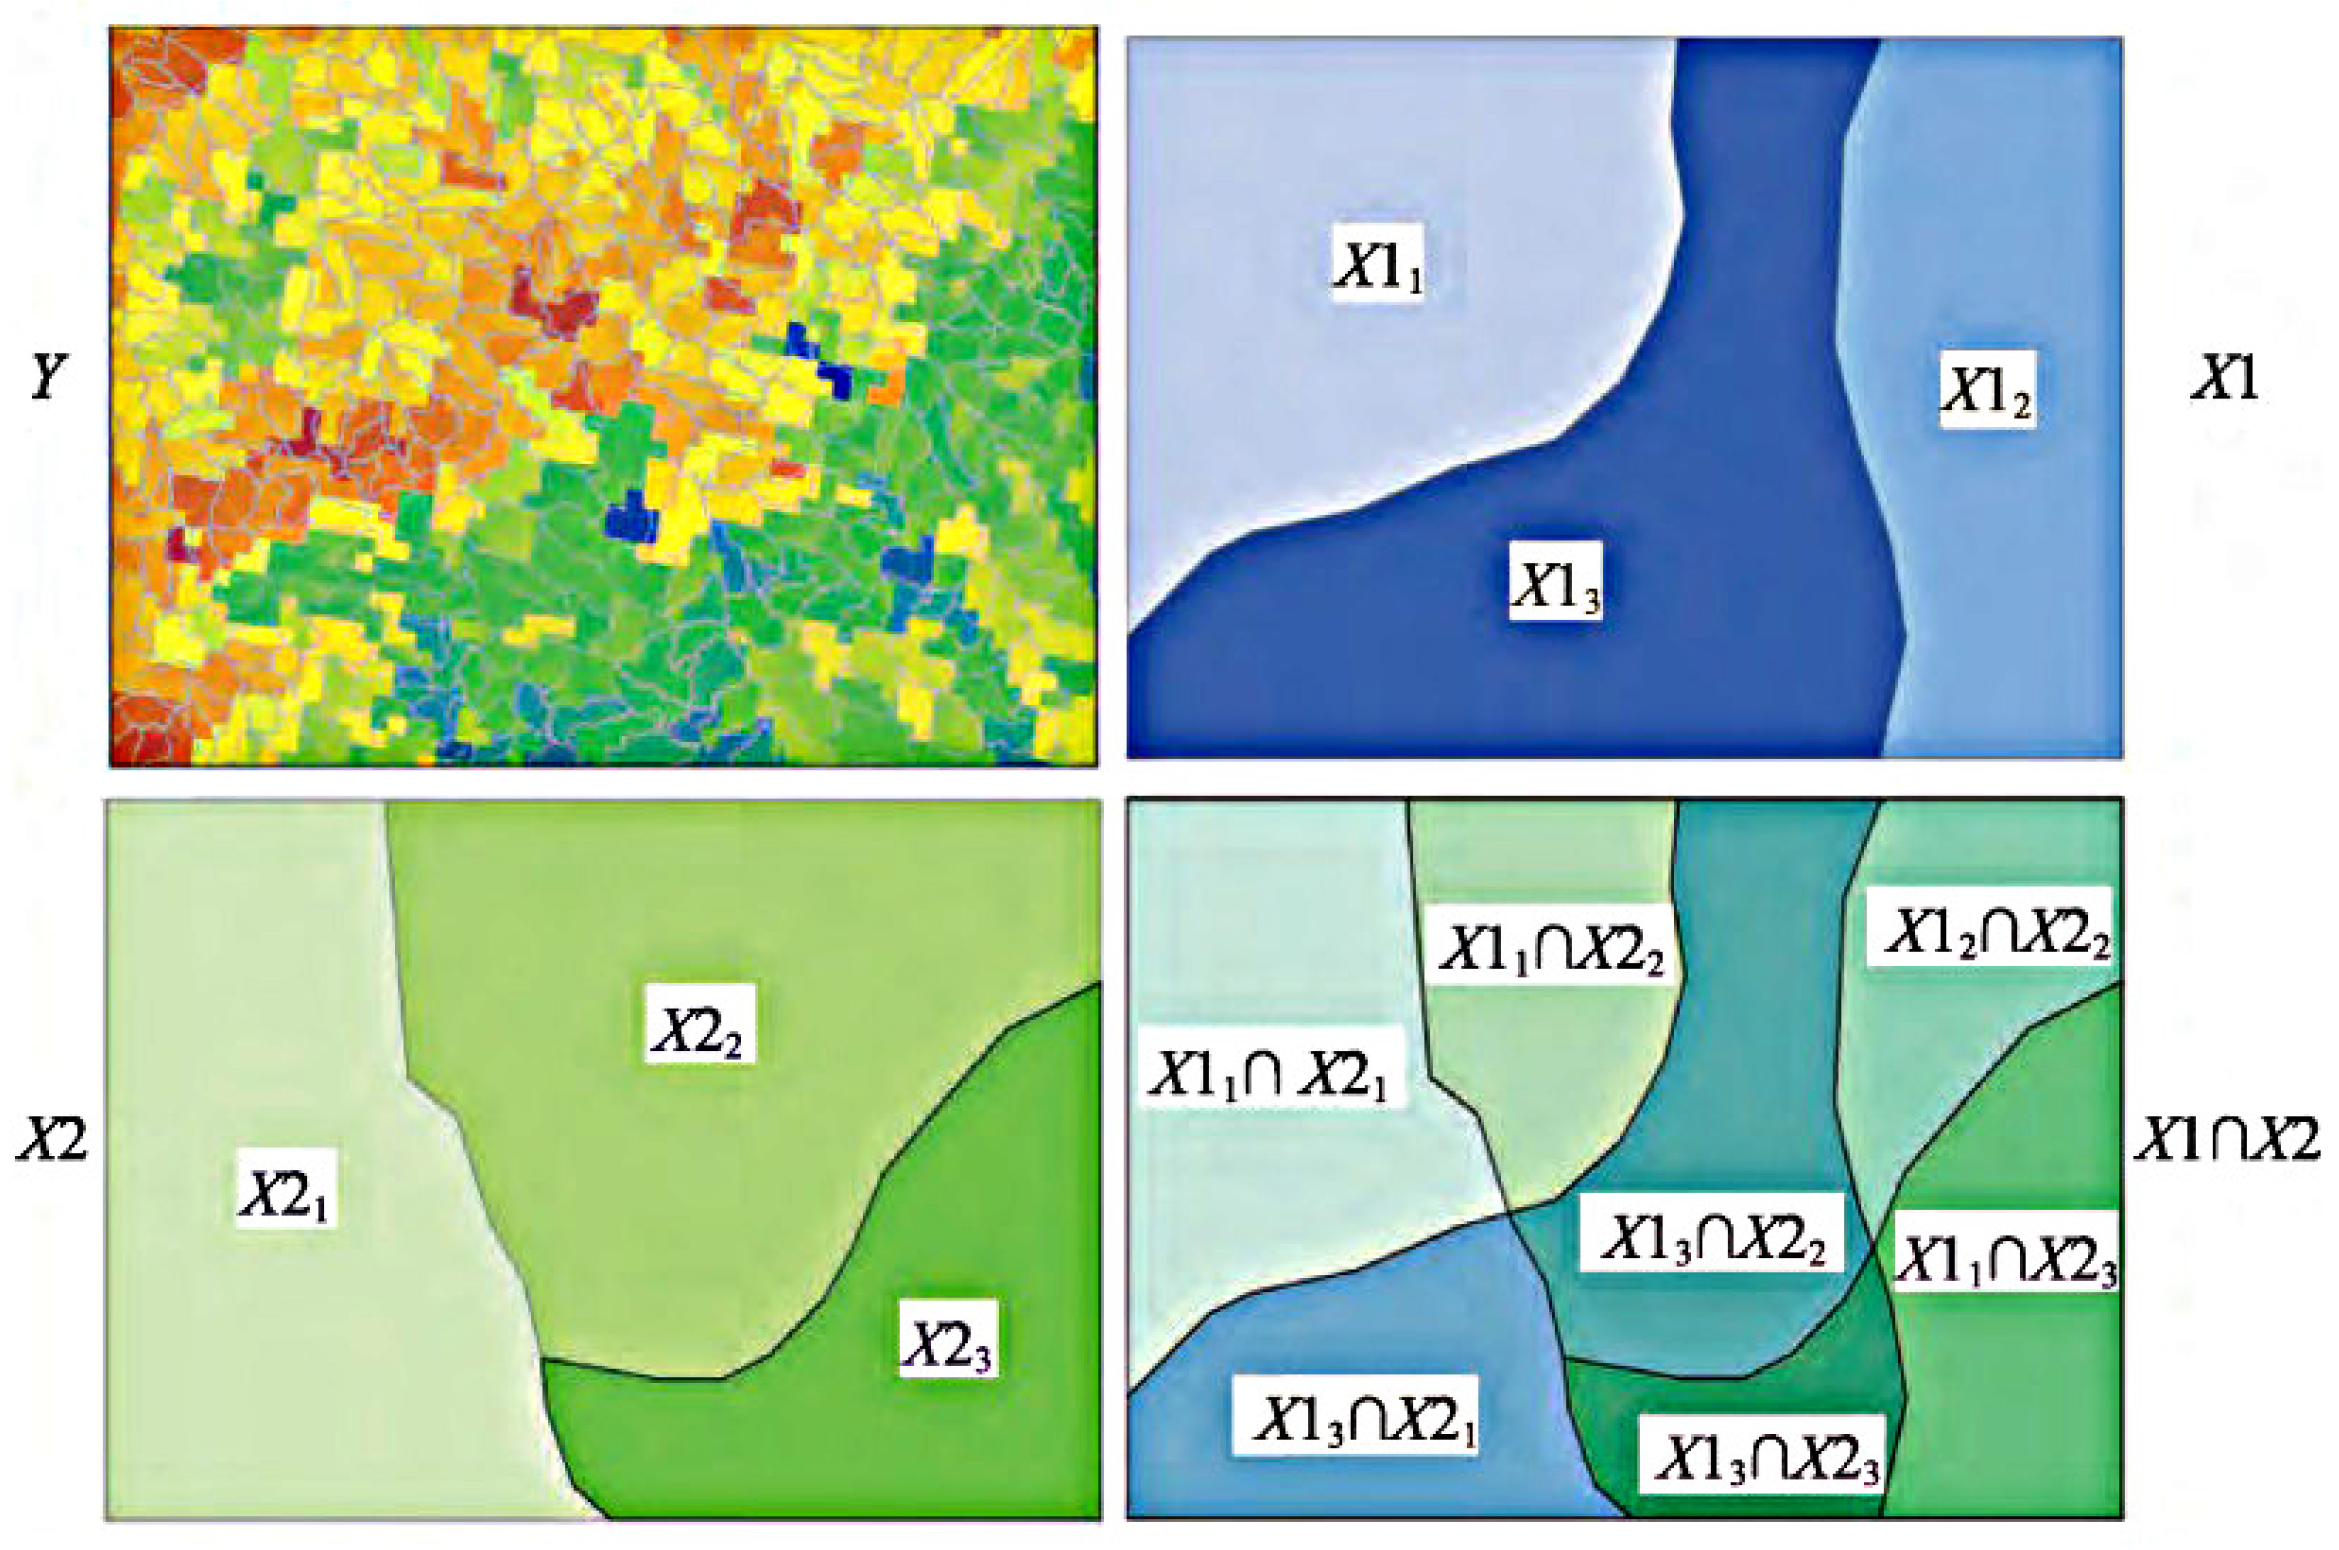
3.3.2. Interaction Detector

The interaction detector was used to detect the drought differential influencing factors (the coding meanings are shown in Table 2) in the Yangtze River Basin in 2000, 2005, 2010 and 2015, respectively, and the results are shown in Figure 12. According to the results of the interaction detector, the influence of double factor interaction on drought differences in the Yangtze River Basin is greater than that of single-factor interaction, and the types of effects include non-linear enhancement and double factor enhancement, that is, the drought differences in the Yangtze River Basin are the result of the combined effect of multiple factors. In 2000, the best double factor combination is elevation and average annual precipitation (0.32). In 2005, the best double factor combination is soil type and average annual precipitation (0.40). In 2010, the best double factor combination is soil type and average annual precipitation (0.52). In 2015, the six best combinations of double factor combination effects are the combinations of average annual precipitation with elevation, soil type, average annual temperature, population density, night light, and human footprint, respectively, and the detection values were 0.72. It can be found that the combination of annual average precipitation and other factors all dominate the influence of drought variation in the Yangtze River Basin from 2010 onwards. This indicates that the difference of drought in the Yangtze River Basin is not the result of a single factor or dimension, but the comprehensive effect of multiple factors and systems.

4. Discussion

This study was based on SPEI_PM, using space-time cube, time cluster analysis and emerging hot spot methods to analyze the spatial and temporal evolution characteristics of drought in the Yangtze River Basin over the past 40 years and to study the drivers of the Yangtze River Basin using geodetector.
Our analysis demonstrates that the climate of the Yangtze River Basin is an overall wet trend and most areas in the Yangtze River Basin showed mild drought or no drought. Similarly, Huang et al. [24] analyzed the drought characteristics of the Yangtze River Basin based on PDSI and found that there is an overall wet trend in the Yangtze River Basin. In addition, this paper finds the following results. (1) The areas with drought condition are mainly distributed in the southwest and east of the Yangtze River Basin. (2) There are significant seasonal differences in drought conditions in all regions, and the drought condition is more different in autumn compared to spring, summer and winter. (3) The difference of drought condition in the Yangtze River Basin is the result of the combination of multiple factors. Currently, many scholars have been studying the analysis of drought in the Yangtze River Basin. Li et al. [22] calculated SPI and SPEI based on month-by-month meteorological data, and then analyzed the annual variation characteristics of drought in the Yangtze River Basin using SPEI_PM, which did not analyze the drought characteristics of the Yangtze River Basin from multiple time scales and did not further analyze the factors affecting drought in the Yangtze River Basin. Tian et al. [23] studied the historical spatial and temporal evolution of agricultural drought in the Yangtze River Basin based on long time series CCI soil moisture data, and found that the area of agricultural drought in the Yangtze River Basin showed a trend of increasing and then decreasing, with spring and winter droughts dominating in the seasonal scale; however, this study was mainly limited to agricultural drought studies, and did not use SPEI to conduct a comprehensive study of drought in the Yangtze River Basin and did not investigate the mechanism of multiple factors affecting drought in the Yangtze River Basin. Huang et al. [24] explored the spatial and temporal characteristics of drought in the Yangtze River Basin and its evolutionary trends based on PDSI; however, the PDSI used in this study lacked multi-scale characteristics and did not effectively analyze the multi-scale drought characteristics of the Yangtze River Basin. Compared with the current studies on drought in the Yangtze River Basin by other scholars [53], this study not only provided a multi-scale analysis on drought characteristics, but also analyzed the main influencing factors and mechanisms that cause drought changes [54].
Drought is the most severe meteorological disasters to impact human society and occur widely and frequently in China causing considerable damage to the living environment of humans [52]. They have become stronger in frequency [55], severity and duration under the rapid development of the economy and society [56]. To explore the characteristics of drought and its drivers in the Yangtze River Basin, which plays a pivotal role in reducing natural disasters and production and livelihood stress in the study area [57], thus providing a theoretical and decision-making basis for early warning management of meteorological disasters in the Yangtze River Basin.
More detailed studies on drought in the Yangtze River Basin are limited by the difficulty of obtaining more accurate meteorological data. In the subsequent study, we not only want to improve the data accuracy, but also to make a long time series prediction of drought in the study area based on the deep learning model.

5. Conclusions

Based on the SPEI_PM drought index method, this paper analyzed the spatio-temporal drought evolution characteristics and the driving factors of the Yangtze River Basin at multiple time scales from 1980–2019 using space-time cube, time series clustering analysis, emerging hot spot analysis and geodetector. The main conclusions are as follows.
In terms of temporal variation, the annual-scale SPEI values in the Yangtze River Basin from 1980–2019 show obvious forms of positive and negative oscillations in the short term, with an overall upward trend and an increase rate of 0.01/10a, indicating the wet trend of the Yangtze River Basin climate. From 1980–2019, the overall trend of spring and summer SPEI values in the Yangtze River Basin show a non-significant upward trend; the overall trend of autumn and winter SPEI values show a non-significant downward trend. Compared with other seasons, droughts occurred more frequently in the Yangtze River Basin in winter from 1980–2019, and the trend of SPEI values in summer is more similar to the trend of annual scale changes.
In terms of spatial variation, according to the results of space-time cube, it can be seen that most areas of the Yangtze River Basin and most of the time show mild drought or no drought, and the areas with severe annual drought are mainly distributed in the southwest and east of the Yangtze River Basin. At the seasonal scale, summer is wetter than other seasons, and there are obvious seasonal differences in drought conditions among regions in the Yangtze River Basin. The time series clustering analysis results show that the number of SPEI seasonal-scale and annual-scale clusters is small, indicating that drought conditions do not significantly differ among regions in the Yangtze River Basin, and the drought situation in autumn is relatively different from that in spring, summer and winter. The method can cluster areas with similar drought conditions into one category, and the higher the density of stations, the better the results. The results of emerging hot spot analysis can visualize the overall spatial and temporal trends of the drought in the past 40 years, and the trend of drought increase and decrease in the Yangtze River Basin area can be obtained, providing a theoretical basis for drought prevention and relief in the Yangtze River Basin.
By analyzing the drivers of drought variation in the Yangtze River Basin, it can be obtained that topography and meteorology have the greatest influence on drought, among which the average annual precipitation and elevation factors are dominant. In the interaction detection, the influence of double factor interaction on drought change in the Yangtze River Basin is greater than that of single factor, which indicates that the differences of drought conditions in the Yangtze River Basin are the result of the combination of multiple factors.

Author Contributions

Conceptualization, J.W. and Z.W.; methodology, J.W., Z.W. and J.S.; software, J.W. and Z.W.; validation, J.W., Z.W. and L.H.; formal analysis, J.W.; investigation, J.W.; resources, Z.W. and B.Z.; data curation, J.W. and Z.W.; writing—original draft preparation, J.W. and Z.W.; writing—review and editing, J.W., Z.W., J.S. and L.H.; visualization, J.W., Z.W. and B.Z.; supervision, J.W.and Z.W.; project administration, J.W., J.S. and L.H.; funding acquisition, J.S. and L.H. All authors have read and agreed to the published version of the manuscript.

Funding

This research was funded by Major Science and Technology Project of Henan Province, China, grant number “221100210600”, “201400211300” and “201400210600”.

Institutional Review Board Statement

Not applicable.

Informed Consent Statement

Not applicable.

Data Availability Statement

The datasets from 1980 to 2019 were obtained from the National Meteorological Data Center (http://data.cma.cn/ accessed on 2 March 2020). The driving factors data provincial boundaries in the Yangtze River Basin and the boundary of the Yangtze River Basin were obtained from the Resource and Environmental Science and Data Center of Chinese Academy of Sciences (https://www.resdc.cn/ accessed on 26 March 2022) and Geospatial Data Cloud (https://www.gscloud.cn/ accessed on 26 March 2022).

Conflicts of Interest

The authors declare no conflict of interest.

References

  1. Haghighi, A.T.; Zaki, N.A.; Rossi, P.M.; Noori, R.; Hekmatzadeh, A.A.; Saremi, H.; Klove, B. Unsustainability Syndrome-From Meteorological to Agricultural Drought in Arid and Semi-Arid Regions. Water 2020, 12, 838. [Google Scholar] [CrossRef] [Green Version]
  2. Tng, D.; Apgaua, D.; Paz, C.P.; Dempsey, R.W.; Cernusak, L.A.; Liddell, M.J.; Laurance, S.G. Drought reduces the growth and health of tropical rainforest understory plants. For. Ecol. Manag. 2022, 511, 120128. [Google Scholar] [CrossRef]
  3. Atherwood, S. Does a prolonged hardship reduce life span? Examining the longevity of young men who lived through the 1930s Great Plains drought. Popul. Environ. 2022, 43, 530–552. [Google Scholar] [CrossRef]
  4. Wu, J.; Yao, H.; Yuan, X.; Lin, B. Dissolved organic carbon response to hydrological drought characteristics: Based on long-term measurements of headwater streams. Water Res. 2022, 215, 118252. [Google Scholar] [CrossRef] [PubMed]
  5. Wilhite, D.A. Drought and water crises: Science, technology, and management issues. Bull. Am. Meteorol. Soc. 2007, 88, 1444–1445. [Google Scholar]
  6. Li, Z.; Li, Y.; Li, H.; Liu, Y.; Wang, C. Analysis of Drought Change and Its Impact in Central Asia. Adv. Earth Sci. 2022, 37, 37–50. [Google Scholar]
  7. Chiang, F.; Mazdiyasni, O.; Aghakouchak, A. Evidence of anthropogenic impacts on global drought frequency, duration, and intensity. Nat. Commun. 2021, 12, 2754. [Google Scholar] [CrossRef] [PubMed]
  8. Alahacoon, N.; Edirisinghe, M. A comprehensive assessment of remote sensing and traditional based drought monitoring indices at global and regional scale. Geomat. Nat. Hazards Risk 2022, 13, 762–799. [Google Scholar] [CrossRef]
  9. Stagge, J.H.; Tallaksen, M.; Xu, C.Y.; Van Lanen, H.A. Standardized Precipitation-evapotranspiration Index (SPEI): Sensitivity to Potential Evapotranspiration Model and Parameters. In Hydrology in a Changing World—Copernicus GmbH (IAHS-AISH Proceedings and Reports); International Association of Hydrological Sciences: Wallingford, UK, 2014. [Google Scholar]
  10. Saeed, S.; Mohammadi, G.M.; Saviz, S. Spatial and temporal analysis of drought in various climates across Iran using the Standardized Precipitation Index (SPI). Arab. J. Geosci. 2022, 15, 1279. [Google Scholar]
  11. Sergio, M.V.; Santiago, B.; Ji, L.-M. A Multiscalar Drought Index Sensitive to Global Warming: The Standardized Precipitation Evapotranspiration Index. J. Clim. 2010, 23, 1696–1718. [Google Scholar]
  12. Palmer, W.C. Meteorological Drought; U.S. Department of Commerce Weather Bureau Research Paper: San Diego, CA, USA, 1965. [Google Scholar]
  13. Narasimhan, B.; Srinivasan, R. Development and evaluation of Soil Moisture Deficit Index (SMDI) and Evapotranspiration Deficit Index (ETDI) for agricultural drought monitoring. Agric. For. Meteorol. 2005, 133, 69–88. [Google Scholar] [CrossRef]
  14. Chen, H.; Sun, J. Changes in Drought Characteristics over China Using the Standardized Precipitation Evapotranspiration Index. J. Clim. 2015, 28, 5430–5447. [Google Scholar] [CrossRef]
  15. Ma, X.; Zhu, X.; Zhao, J.; Zhao, N.; Shi, Y. Analysis of Drought Characteristics and Driving Forces in the Urban Belt Along the Yellow River in Ningxia Based on SPEI. Res. Soil Water Conserv. 2022, 29, 1–10. [Google Scholar]
  16. Yang, R.; Geng, G.; Zhou, H.; Wang, T. Spatial-temporal Evolution of Meteorological Drought in the Wei River Basin Based on SPEI_PM. Chin. J. Agrometeorol. 2021, 42, 962–974. [Google Scholar]
  17. Mobilia, M.; Longobardi, A. Prediction of Potential and Actual Evapotranspiration Fluxes Using Six Meteorological Data-Based Approaches for a Range of Climate and Land Cover Types. Isprs Int. J. -Geo-Inf. 2021, 10, 192. [Google Scholar] [CrossRef]
  18. Liu, K.; Jang, D. Analysis of Dryness/Wetness over China Using Standardized Precipitation Evapotranspiration Index Based on Two Evapotranspiration Algorithms. Chin. J. Atmos. Sci. 2015, 39, 23–36. [Google Scholar]
  19. Ling, M.; Guo, X.; Shi, X.; Han, H. Temporal and spatial evolution of drought in Haihe River Basin from 1960 to 2020. Ecol. Indic. 2022, 138, 108809. [Google Scholar] [CrossRef]
  20. Men, B.; Cai, B.; Tian, W. SPEI-based Analysis of Temporal and Spatial Characteristics of Meteorological Drought in the Chaobai River Basin. J. North China Univ. Water Resour. Electr. Power (Nat. Sci. Ed.) 2022, 43, 10–20. [Google Scholar]
  21. Wang, S.; Li, R.; Wu, Y.; Zhao, S. Effects of multi-temporal scale drought on vegetation dynamics in Inner Mongolia from 1982 to 2015, China. Ecol. Indic. 2022, 136, 108666. [Google Scholar] [CrossRef]
  22. Li, X.; Sha, J.; Wang, Z.L. Comparison of drought indices in the analysis of spatial and temporal changes of climatic drought events in a basin. Environ. Sci. Pollut. Res. 2019, 26, 10695–10707. [Google Scholar] [CrossRef]
  23. Tian, Q.; Lu, J.; Chen, X. Spatio-temporal Evolution of Agricultural Drought in the Yangtze River Basin Based on Long-term CCI Soil Moisture Data. Resour. Environ. Yangtze Basin 2022, 31, 472–481. [Google Scholar]
  24. Huang, T.; Xu, L.; Fan, H.; Meng, Y. Temporal and Spatial Variation Characteristics and the Evolution Trends of Droughts in the Yangtze River Basin. Res. Environ. Sci. 2018, 31, 1677–1684. [Google Scholar]
  25. Jiang, W.; Niu, Z.; Wang, L.; Yao, R.; Gui, X.; Xiang, F.; Ji, Y. Impacts of Drought and Climatic Factors on Vegetation Dynamics in the Yellow River Basin and Yangtze River Basin, China. Remote Sens. 2022, 14, 930. [Google Scholar] [CrossRef]
  26. Huang, H.; Zhang, B.; Ma, S.; Ma, B.; Cu, Y.Q.; Wang, X.D.; Ma, C.R.; Chen, K.Q.; Zhang, T. Temporal and Spatial Variations of Meteorological Drought and Drought Risk Analysis in Hedong Area of Gansu Province. Chin. J. Agrometeorol. 2020, 41, 459–469. [Google Scholar]
  27. Santiago, B.; Sergio, M.V.; Fergus, R.; Borja, L. Standardized precipitation evapotranspiration index (SPEI) revisited: Parameter fitting, evapotranspiration models, tools, datasets and drought monitoring. Int. J. Climatol. 2014, 34, 3001–3023. [Google Scholar]
  28. Mitchell, A. The ESRI Guide to GIS Analysis; ESRI Press: Redlands, CA, USA, 2012; Volume 3. [Google Scholar]
  29. Chen, Y. An Analysis of Spatial-temporal Distribution Characteristics of Housing Prices in Nanchang Based on Space-time Cube. Jiangxi Sci. 2019, 37, 371–377. [Google Scholar]
  30. Zhang, Q.; Xu, D.; Ding, Y. Spatio-temporal pattern mining of the last 40 years of drought in China based on SPEI index and spatio-temporal cube. Agric. Res. Arid. Areas 2021, 39, 194–201. [Google Scholar]
  31. Mo, C.B.; Tan, D.C.; Mai, T.Y.; Bei, C.; Qin, J.; Pang, W.; Zhang, Z. An analysis of spatiotemporal pattern for COVID-19 in China based on space-time cube. J. Med. Virol. 2020, 92, 1587–1595. [Google Scholar] [CrossRef] [PubMed] [Green Version]
  32. Mcleod, G. Exploring spatial patterns of Virginia tornadoes using kernel density and space-time cube analysis (1960–2019). ISPRS Int. J. -Geo.-Inf. 2021, 10, 310. [Google Scholar]
  33. Ahmadi, H.; Argany, M.; Ghanbari, A.; Ahmadi, M. Visualized spatiotemporal data mining in investigation of Urmia Lake drought effects on increasing of PM10 in Tabriz using space-time cube (2004–2019). Sustain. Cities Soc. 2022, 76, 103399. [Google Scholar] [CrossRef]
  34. Chen, T.; Shi, X.; Wong, Y.D. A lane-changing risk profile analysis method based on time-series clustering. Phys. A Stat. Mech. Its Appl. 2021, 565, 125567. [Google Scholar] [CrossRef]
  35. Duan, L.Z.; Yu, F.S.; Pedrycz, W.; Wang, X.; Yang, X. Time-series clustering based on linear fuzzy information granules. Appl. Soft Comput. 2018, 73, 1053–1067. [Google Scholar] [CrossRef]
  36. Lahreche, A.; Boucheham, B. A fast and accurate similarity measure for long time series classification based on local extrema and dynamic time warping. Expert Syst. Appl. 2021, 168, 114374. [Google Scholar] [CrossRef]
  37. Delforge, D.; Watlet, A.; Kaufmann, O.; Van Camp, M. Time-series clustering approaches for subsurface zonation and hydro facies detection using a real time-lapse electrical resistivity dataset. J. Appl. Geophys. 2021, 184, 104203. [Google Scholar] [CrossRef]
  38. Xu, B.; Qi, B.; Ji, K.; Liu, Z.; Deng, L.; Jiang, L. Emerging hot spot analysis and the spatial–temporal trends of NDVI in the Jing River basin of China. Environ. Earth Sci. 2022, 81, 1–15. [Google Scholar] [CrossRef]
  39. Getis, A.; Ord, J.K. The Analysis of Spatial Association by Use of Distance Statistics. Geogr. Anal. 1992, 24, 189–206. [Google Scholar] [CrossRef]
  40. Purwanto, P.; Utaya, S.; Handoyo, B. Spatiotemporal analysis of Covid-19 spread with emerging hotspot analysis and space-time cube models in east java, Indonesia. Int. J. -Geo-Inf. 2021, 10, 133. [Google Scholar] [CrossRef]
  41. Shan, B.; Zhang, Z.; Chen, Y. Analysis Methods of Spatio-temporal Patterns and Its Empirical Applications-A Case Study of Manufacturing Industry of Shandong Province. J. Geomat. Sci. Technol. 2021, 38, 624–630+638. [Google Scholar]
  42. Betty, E.L.; Bollard, B.; Murphy, S.; Ogle, M.; Hendriks, H.; Orams, M.B.; Stockin, K.A. Using emerging hot spot analysis of stranding records to inform conservation management of a data-poor cetacean species. Biodivers. Conserv. 2019, 29, 643–665. [Google Scholar] [CrossRef]
  43. Chambers, S.N. The spatiotemporal forming of a state of exception: Repurposing hot-spot analysis to map bare-life in southern Arizona’s borderlands. Geo J. 2020, 85, 1373–1384. [Google Scholar] [CrossRef]
  44. Wang, J.; Xu, C. Geodetector: Principle and prospective. Acta Geogr. Sin. 2017, 72, 116–134. [Google Scholar]
  45. Wang, J.F.; Li, X.H.; Christakos, G.; Liao, Y.L.; Zhang, T.; Gu, X.; Zheng, X.Y. Geographical detectors-based health risk assessment and its application in the neural tube defects study of the heshun region, china. Int. J. Geogr. Inf. Sci. 2010, 24, 107–127. [Google Scholar] [CrossRef]
  46. Wang, J.F.; Hu, Y. Environmental health risk detection with Geogdetector. Environ. Model. Softw. 2012, 33, 114–115. [Google Scholar] [CrossRef]
  47. Cao, F.; Ge, Y.; Wang, J.F. Optimal discretization for geographical detectors-based risk assessment. Mapp. Sci. Remote Sens. 2013, 50, 78–92. [Google Scholar] [CrossRef]
  48. Li, C.; Wu, Y.; Gao, B.; Wu, Y.; Zheng, K.; Li, C. Spatial Differentiation and Driving Factors of Rural Settlement in Plateau Lake: A Case Study of the Area Around the Erhai. Econ. Geogr. 2022, 42, 220–229. [Google Scholar]
  49. Chen, W.; Li, J.; Zeng, J.; Ran, D.; Yang, B. Spatial heterogeneity and formation mechanism of eco-environmental effect of land use change in China. Geogr. Res. 2019, 38, 2173–2187. [Google Scholar]
  50. Tian, F.; Yang, J.; Liu, L.; Wu, J. Progress of research on the conception, characteristic, and influencing factors of drought propagation from the perspective of geographic sciences. Prog. Geogr. 2022, 548, 202–205. [Google Scholar] [CrossRef]
  51. Yang, Q.; Luo, G.; Gao, C. Research Progress of Agricultural Drought from the Perspective of Geography. J. North China Univ. Water Resour. Electr. Power (Nat. Sci. Ed.) 2020, 168, 27–34+64. [Google Scholar]
  52. Zhang, H.; Ding, J.; Wang, Y.; Zhou, D.; Zhu, Q. Investigation about the correlation and propagation among meteorological, agricultural and groundwater droughts over humid and arid/semi-arid basins in China. J. Hydrol. 2021, 603, 127007. [Google Scholar] [CrossRef]
  53. Schwalm, C.R.; Anderegg, W.R.; Michalak, A.M.; Fisher, J.B.; Biondi, F.; Koch, G.; Litvak, M.; Ogle, K.; Shaw, J.D.; Wolf, A.; et al. Global patterns of drought recovery. Nature 2017, 548, 202–205. [Google Scholar] [CrossRef]
  54. Xia, J.; Li, Z.; Zeng, S.; Zou, L.; She, D.; Cheng, D. Perspectives on eco-water security and sustainable development in the Yangtze River Basin. Geosci. Lett. 2021, 8, 1–9. [Google Scholar] [CrossRef]
  55. Ren, Y.; Liu, J.; Liu, S.; Wang, Z.; Liu, T.; Shalamzari, M.J. Effects of Climate Change on Vegetation Growth in the Yellow River Basin from 2000 to 2019. Remote Sens. 2022, 14, 687. [Google Scholar] [CrossRef]
  56. Ren, Y.; Liu, J.; Shalamzari, M.J.; Arshad, A.; Liu, S.; Liu, T.; Tao, H. Monitoring Recent Changes in Drought and Wetness in the Source Region of the Yellow River Basin, China. Water 2022, 14, 861. [Google Scholar] [CrossRef]
  57. Liu, J.; Ren, Y.; Tao, H.; Shalamzari, M.J. Spatial and Temporal Variation Characteristics of Heatwaves in Recent Decades over China. Remote Sens. 2021, 13, 3824. [Google Scholar] [CrossRef]
Figure 1. Study area.
Atmosphere 13 01986 g001
Figure 2. Schematic diagram of the space-time cube.
Atmosphere 13 01986 g002
Figure 3. Schematic diagram of time series clustering.
Atmosphere 13 01986 g003
Figure 4. Principle of geodetector.
Atmosphere 13 01986 g004
Figure 5. Interaction detector. Y is the dependent variable. X 1 and X 2 are evaluation factors. Overlay the two layers X 1 and X 2 to get the new layer X 1 X 2 .
Atmosphere 13 01986 g005
Figure 6. Changes in annual mean SPEI in the Yangtze River Basin from 1980 to 2019.
Atmosphere 13 01986 g006
Figure 7. Percentage of drought area.
Atmosphere 13 01986 g007
Figure 8. Variation of seasonal SPEI values in the Yangtze River Basin from 1980 to 2019. (a) Spring; (b) summer; (c) autumn; and (d) winter.
Atmosphere 13 01986 g008
Figure 9. Space-time cube results of multi-scale SPEI in Yangtze River Basin. (a) Spring; (b) summer; (c) autumn; and (d) winter; (e) Year.
Atmosphere 13 01986 g009
Figure 10. Result of time series clustering analysis. (a) Spring; (b) summer; (c) autumn; and (d) winter; (e) Year.
Atmosphere 13 01986 g010
Figure 11. Result of emerging hot spot analysis. (a) Spring; (b) summer; (c) autumn; and (d) winter; (e) Year.
Atmosphere 13 01986 g011
Figure 12. Interaction detector results of drought differences in the Yangtze River Basin. (a) 2000; (b) 2005; (c) 2010; and (d) 2015.
Atmosphere 13 01986 g012
Table 1. Yangtze River Basin SPEI driving factors.
CategoryFactor
TopographyElevation ( X 1 )
Slop ( X 2 )
Soil type ( X 3 )
MeteorologyAverage annual temperature ( X 4 )
Average annual precipitation ( X 5 )
Socio-economicpopulation density ( X 6 )
GDP ( X 7 )
Night light ( X 8 )
Human footprints ( X 9 )
Traffic locationDistance to water system ( X 10 )
Distance to provincial road ( X 11 )
Distance to railroad ( X 12 )
Table 2. Drought classification based on SPEI.
LevelTypeSPEI
1No drought S P E I 0.5
2Mild drought 1.0 S P E I < 0.5
3Moderate drought 1.5 S P E I < 1.0
4Severe drought 2.0 S P E I < 1.5
5Extreme drought S P E I 2.0
Table 3. Factor detection results of drought differences in the Yangtze River Basin.
Factor2000200520102015q (Average)q (Sum)
X 1 0.180.280.190.410.270.56
X 2 0.060.000.050.070.05
X 3 0.130.300.100.440.24
X 4 0.160.320.090.420.250.59
X 5 0.010.200.430.700.34
X 6 0.010.020.000.040.020.16
X 7 0.020.020.020.020.02
X 8 0.070.030.010.090.05
X 9 0.050.090.000.150.07
X 10 0.000.000.000.000.000.19
X 11 0.010.060.000.080.03
X 12 0.180.160.090.220.16
Publisher’s Note: MDPI stays neutral with regard to jurisdictional claims in published maps and institutional affiliations.

