1. Introduction
Motor vehicles have become one of the most important sources of air pollutants and greenhouse gas emissions; it is important to accurately estimate their emissions and quantitatively evaluate their environmental and climate impacts. An accurate estimation of the total emissions of vehicles mainly includes two key influencing factors: the real-world emission factors and the activity level. In recent years, with the increasing attention on real-world emissions and the development of real-world emission testing technology, the emission characteristics of motor vehicles have become relatively comprehensively understood [
1,
2,
3,
4,
5]. However, there remains uncertainty in the estimation of vehicle activity levels [
6,
7,
8].
Among all the categories of on-road fleets, light-duty passenger vehicles occupy the largest share (about 90% of all vehicles in China), and the large number and diversity of travel behavior make it difficult to accurately grasp the characteristics of the activity level. Several studies have carried out various investigations of the vehicle kilometers traveled (VKT) by light-duty passenger vehicles (LDPV) [
9,
10]. However, due to the limitations of labor costs and the difficulty of data acquisition, surveys usually obtain a relatively limited number of samples (<1% of the entire group). It is difficult to analyze the trends and distribution characteristics of the changes without large sample data.
Meanwhile, during the rapid growth of China’s motor vehicle fleet, the contradiction between huge motor vehicle travel demand and limited urban road supply has exacerbated traffic congestion and air pollution. In recent years, local governments, especially in the megacities, have issued a variety of policies to control the intensity of vehicle usage, including limiting the number of new license plates, driving restrictions for high-emission vehicles, and developing public transportation. Under the guidance of these policies, the activity level of vehicles is gradually changing as the stock grows and the public transportation system develops. Several studies have indicated that the VKT is now lower than previously. For example, Huo estimated that the VKT of Beijing’s passenger cars in 2008 was 17,500 km [
10], and the annual mileage dropped to about 11,000 km in the 2016 study based on GPS travel data [
11]. The annual trend of VKT also needs to be updated regularly. This requires the support of more easily available data sources and a larger sample size of survey subjects.
In recent years, to strengthen the supervision of motor vehicle emissions, the Ministry of Ecology and Environment of China (MEE) has established a national-provincial-city networked platform (named the National Vehicle Environmental Supervision Platform) to gradually build up a supervision system for the entire process of motor vehicle emissions and build environmental protection profiles for each vehicle. The platform plans to access the entire chain of motor vehicle management data, including in-use vehicle annual inspection and maintenance (I/M) data, remote sensing test data, on-board diagnostic (OBD) online supervision data, etc. As the first step, the vehicle I/M data have been gradually connected to the online platform. At this stage, the platform has received nearly 500 million I/M records from more than 10,000 inspection institutions in 31 provinces of China. As odometer readings should be recorded during the I/M test, powerful data support could be provided for an in-depth understanding of the activity level of the in-use vehicle. This is currently the largest sample of the in-use vehicle mileage database.
This paper carried out a detailed analysis of mileage characteristics based on the vehicle odometer data recorded in the annual inspection database and revealed the variation in the VKT characteristics of passenger cars in China by vehicle age, driving year, and region. On this basis, this study obtained the latest real-world road emission characteristic results to update China’s gasoline consumption, as well as the CO2 and pollutant emissions from light-duty passenger vehicles.
2. Data and Method
2.1. Data Description and Pre-Processing
The raw data used in this study came from the odometer reading records by car owners during their annual I/M program. The value represents the cumulative mileage of the vehicle from the registration date to the inspection date. Considering that the data from the I/M platform are still continuously being accessed, this study focused on 10 cities with relatively high upload rates and good data quality control. The data volume of these 10 cities is shown in
Table 1. The sample size accounted for about 20–40% of the city’s total vehicle ownership, which will significantly improve the accuracy of the estimation for the entire fleet.
The dataset included vehicle information (brand, vehicle model, engine displacement, vehicle type, and registration date) and I/M profiles (I/M date, odometer, and test results). Usually, data analysis requires the data to be pre-processed first. As the vehicle environmental protection platform has not yet established a standardized data quality control system, the current data included incomplete vehicle information, misfiled annual inspection information, etc., resulting in errors and deficiencies in the existing data. Therefore, we first performed pre-processing on the data before the analysis of VKT characteristics, including preliminary cleaning, vehicle information correction and fulfillment, vehicle type reclassification, and removal of outliers and unreasonable values. See
Table 2 for the description of each step and the amount of data processed.
In addition, the I/M program in China requires mandatory annual inspections for light-duty vehicles older than 6 years. Private cars younger than 6 years can apply for an inspection exemption. This has resulted in a relatively small number of samples for vehicles less than 6 years old in this database, which may lead to poor estimates of the VKT characteristics for these types of cars. Therefore, the vehicle maintenance records from sales, services, spare parts, and survey stores (short for 4S stores) were introduced to supply the analysis of these vehicles. Typically, car owners perform vehicle maintenance once a year after purchase, so the odometer readings recorded in the maintenance file were also a useful source of data for analyzing vehicle activity levels. Contrary to the mandatory annual I/M test, regular vehicle maintenance in the 4S stores is recommended but voluntary, so the proportion of newer cars (less than 6 years old) in the database from 4S stores will be higher, which happens to complement the lacking data in the I/M database. About 120,000 points of vehicle maintenance data from 4S stores in 31 provinces were collected in this study, covering mainstream brands such as Toyota, Honda, Volkswagen, and Chery. The data survey was conducted in 2019; 60% of the data were from vehicles younger than 6 years old, and 30% of the data were from vehicles that were 6–10 years old.
2.2. Vehicle Use Intensity Analysis
Vehicle use intensity is an important parameter for calculating energy consumption and emissions from on-road vehicles. In the processing of emissions estimation, the annual VKT per vehicle is usually used as an indicator to quantify the vehicle use intensity.
The odometer readings in the I/M database record the accumulated mileage of a vehicle, which is the distance a vehicle has traveled from the date of registration to the I/M date, as shown in the following formula:
where
Odometer denotes the reading records from the odometer, i.e., the accumulated VKT;
i denotes vehicle age;
y denotes I/M year; and
y −
i + 1 denotes the driving year. In
Figure 1, the odometer reading accumulation of a car is described by taking a vehicle inspected annually in 2020 as an example. However, in previous studies [
10,
12,
13,
14,
15,
16], annual VKT was found to be mainly affected by vehicle age, yet the influence of driving years is rarely discussed. In recent years, the number of vehicles in China has increased rapidly, and the growth rate has been higher than the scale of urban road construction. At the same time, the Chinese government is also implementing a series of measures to optimize traffic efficiency and reduce the use-intensity of private cars. Under this premise, the fleet-averaged annual mileage may vary depending on the driving year. This study explored the impact of vehicle age and driving year on the annual VKT.
As detailed vehicle information can be obtained from this database, we were able to further carry out subdivided vehicle driving characteristics analysis. For example, we divided the samples into three segments according to engine displacement to compare the differences in driving characteristics of vehicles with different engine sizes. In addition, driving characteristics were split according to vehicle use (private and commercial).
2.3. Real-World Fuel Consumption and Emission Calculation
Fuel consumption and CO
2 emissions of the LDPV fleet were calculated to validate the VKT results. The fuel consumption was calculated as follows:
where
P is the population of vehicles;
VKT is the annual mileage, km;
BFC is the baseline fuel consumption under the NEDC, L/100 mL;
Gap is the difference coefficient between real-world fuel consumption and fuel consumption under the NEDC;
i is the vehicle age,
y is the simulation year. The CO
2 emissions of the fleet can be further calculated according to the carbon balance principle:
where
P is the population of vehicles;
VKT is the annual mileage, km;
EF is the emission factor of pollutants, g/km;
es is the emission standard; and
y is the simulation year.
Regarding the sources of the data, the vehicle population and fleet composition data were from China Automotive Technology & Research Center (CATARC); the baseline fuel consumption was from the official announcement of the Ministry of Industry and Information Technology (MIIT); and the gap coefficient between real-world and regulated fuel consumption was from Xiaoxiongyouhao, an app that records fuel consumption data from millions of users [
17,
18]. The emission factors of pollutants were derived from the EMBEV model (i.e., the archetype model for China’s National Emission Inventory Guidebook) integrated with the multi-source real-world test database in China [
1,
19,
20,
21].
3. Results and Discussion
3.1. VKT Characteristics
3.1.1. Mileage Characteristics
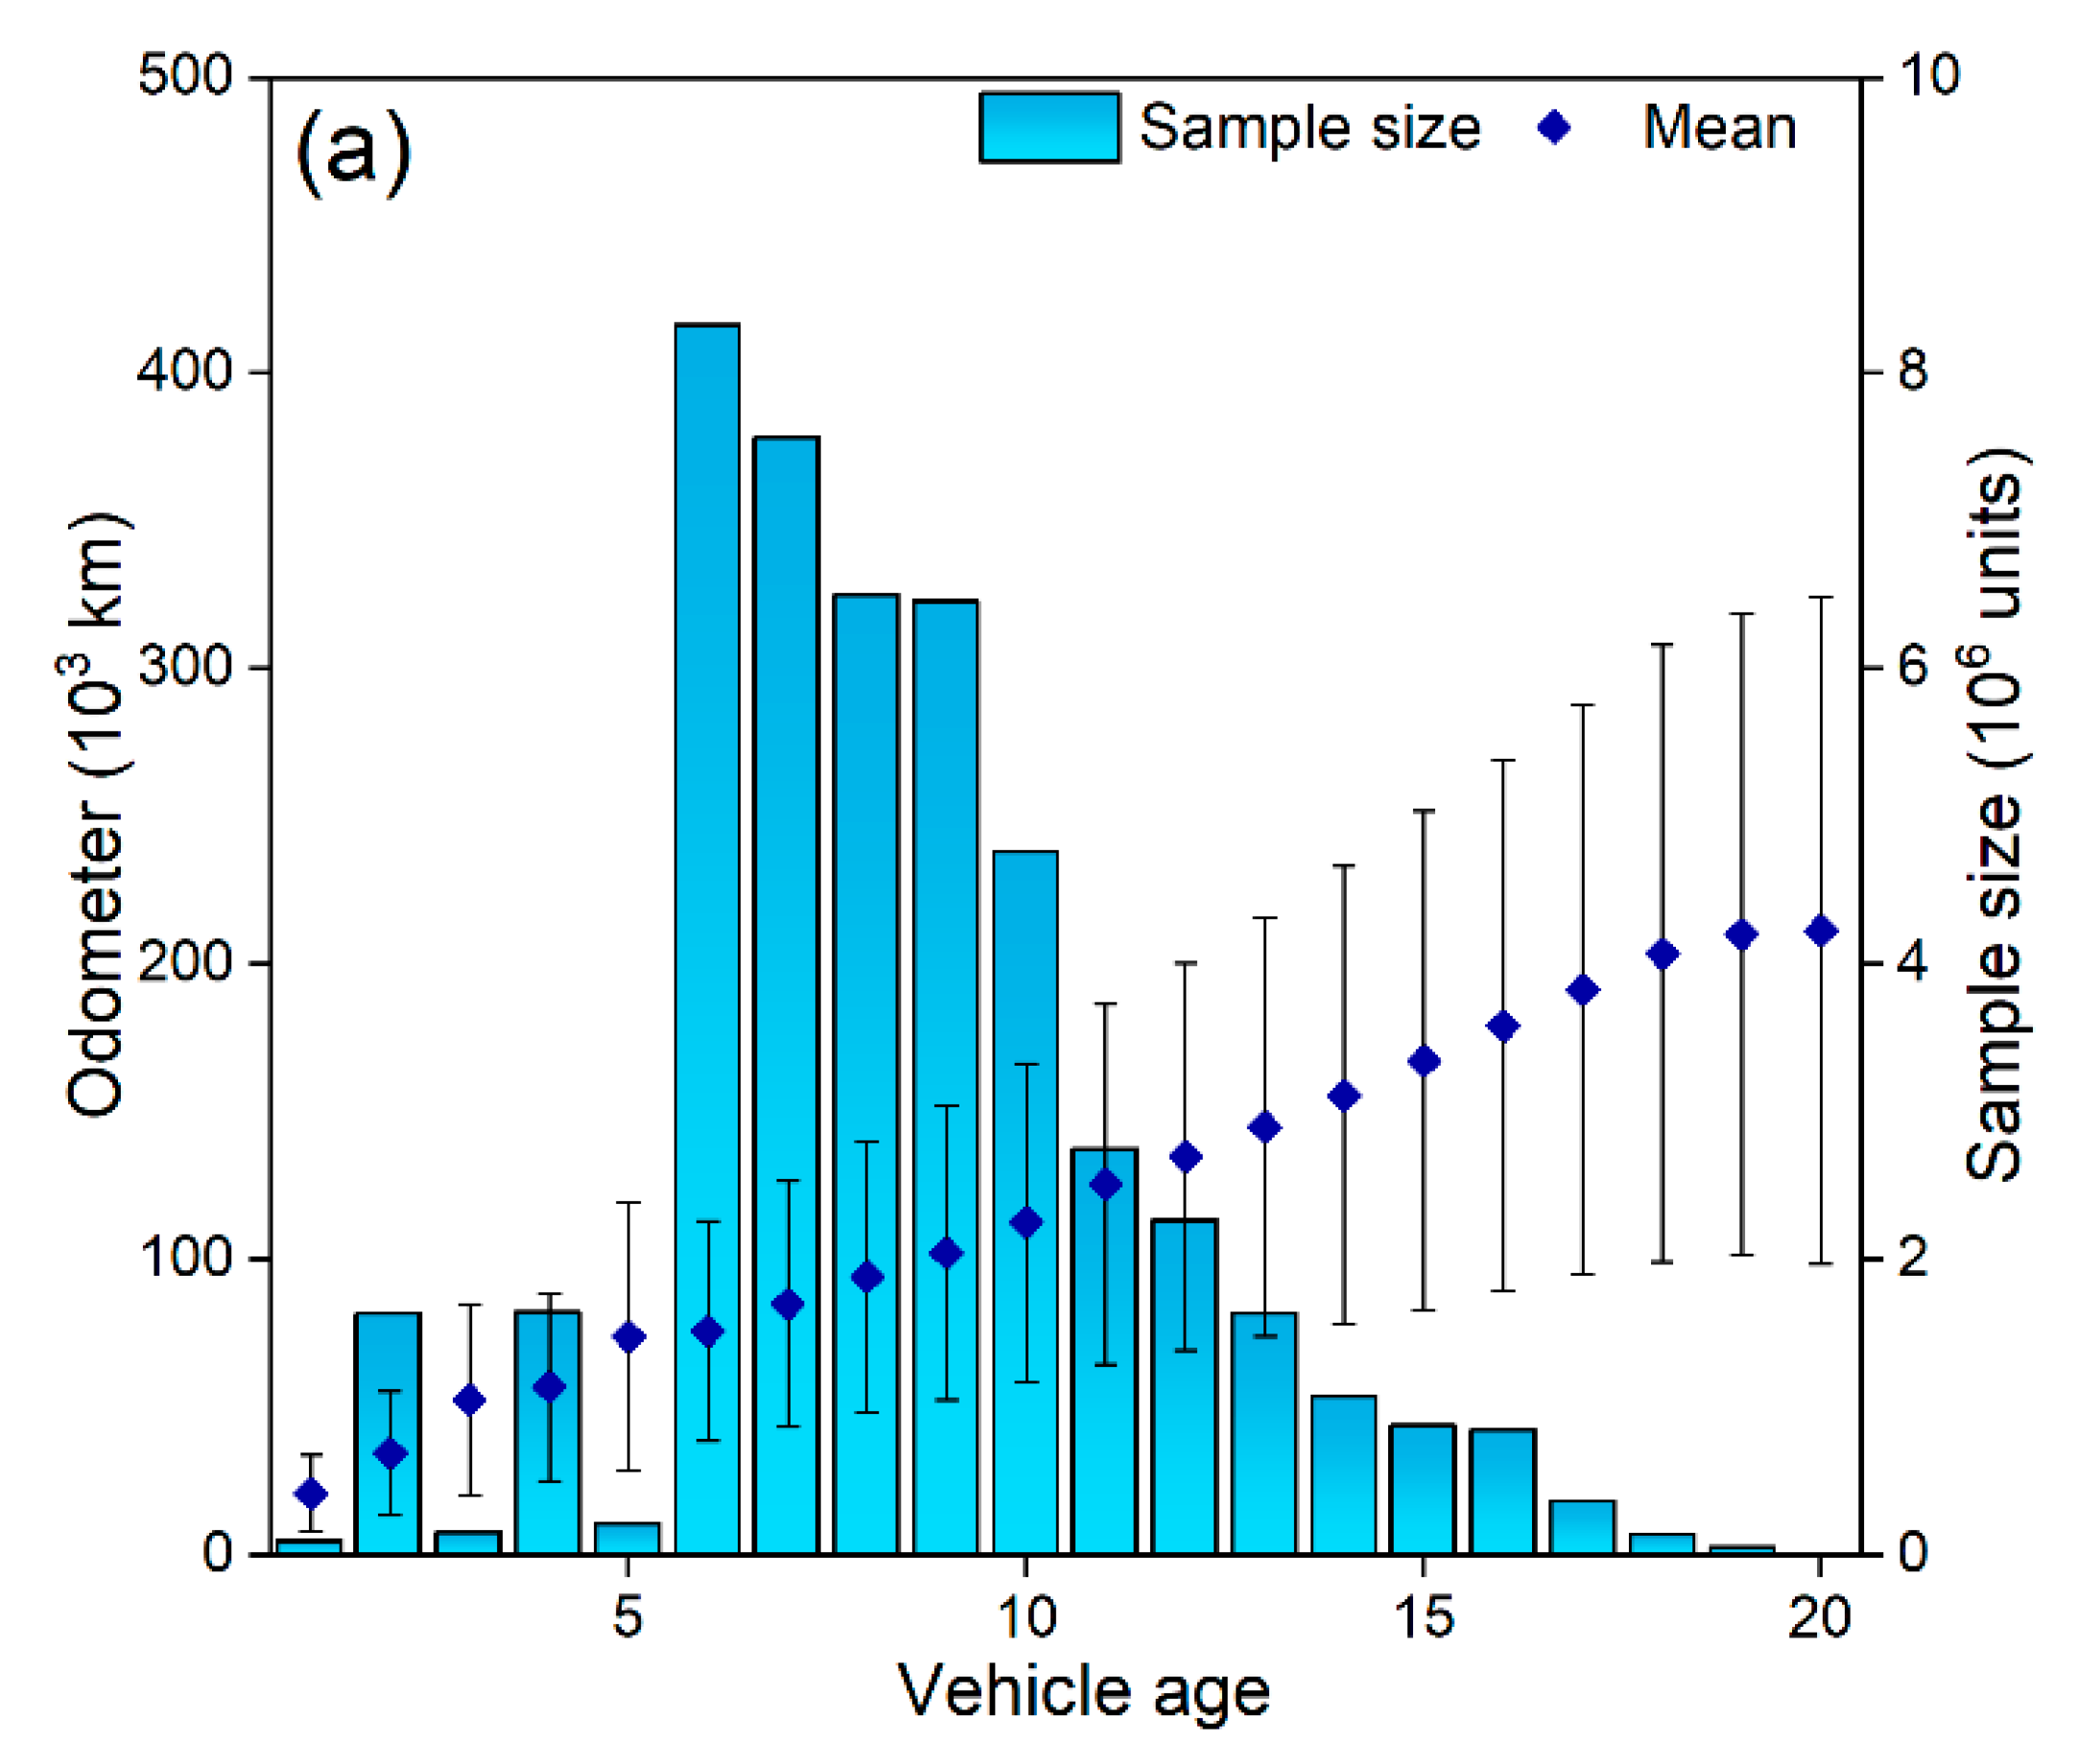
With the help of the big data I/M platform, the distribution of accumulated mileage based on odometer readings could be visually illustrated. As the results of 2020 were affected by the pandemic and may not be representative, the following discussion is based on 2019. As shown in
Figure 2, the accumulated mileage was significantly positively correlated with the age of the vehicle. In the I/M database, LDPV were registered and divided into private cars and taxis, and there were significant differences in the mileage between them.
For private cars (
Figure 2a), due to China’s inspection exemption rules for private vehicles, the mileage data for the first 6 years were relatively inadequate, and 70% of the samples were concentrated between 6 and 10 years old. As most of the vehicles older than 15 years were eliminated, there were also very few samples in this range. Therefore, the analysis of the annual I/M data focused on vehicles aged 6–15 years. A good linear correlation (R
2 = 0.998) was found in the fitting analysis between accumulated mileage and vehicle age for vehicles 6–15 years, which indicated that the average annual mileage of vehicles has remained at a relatively stable level.
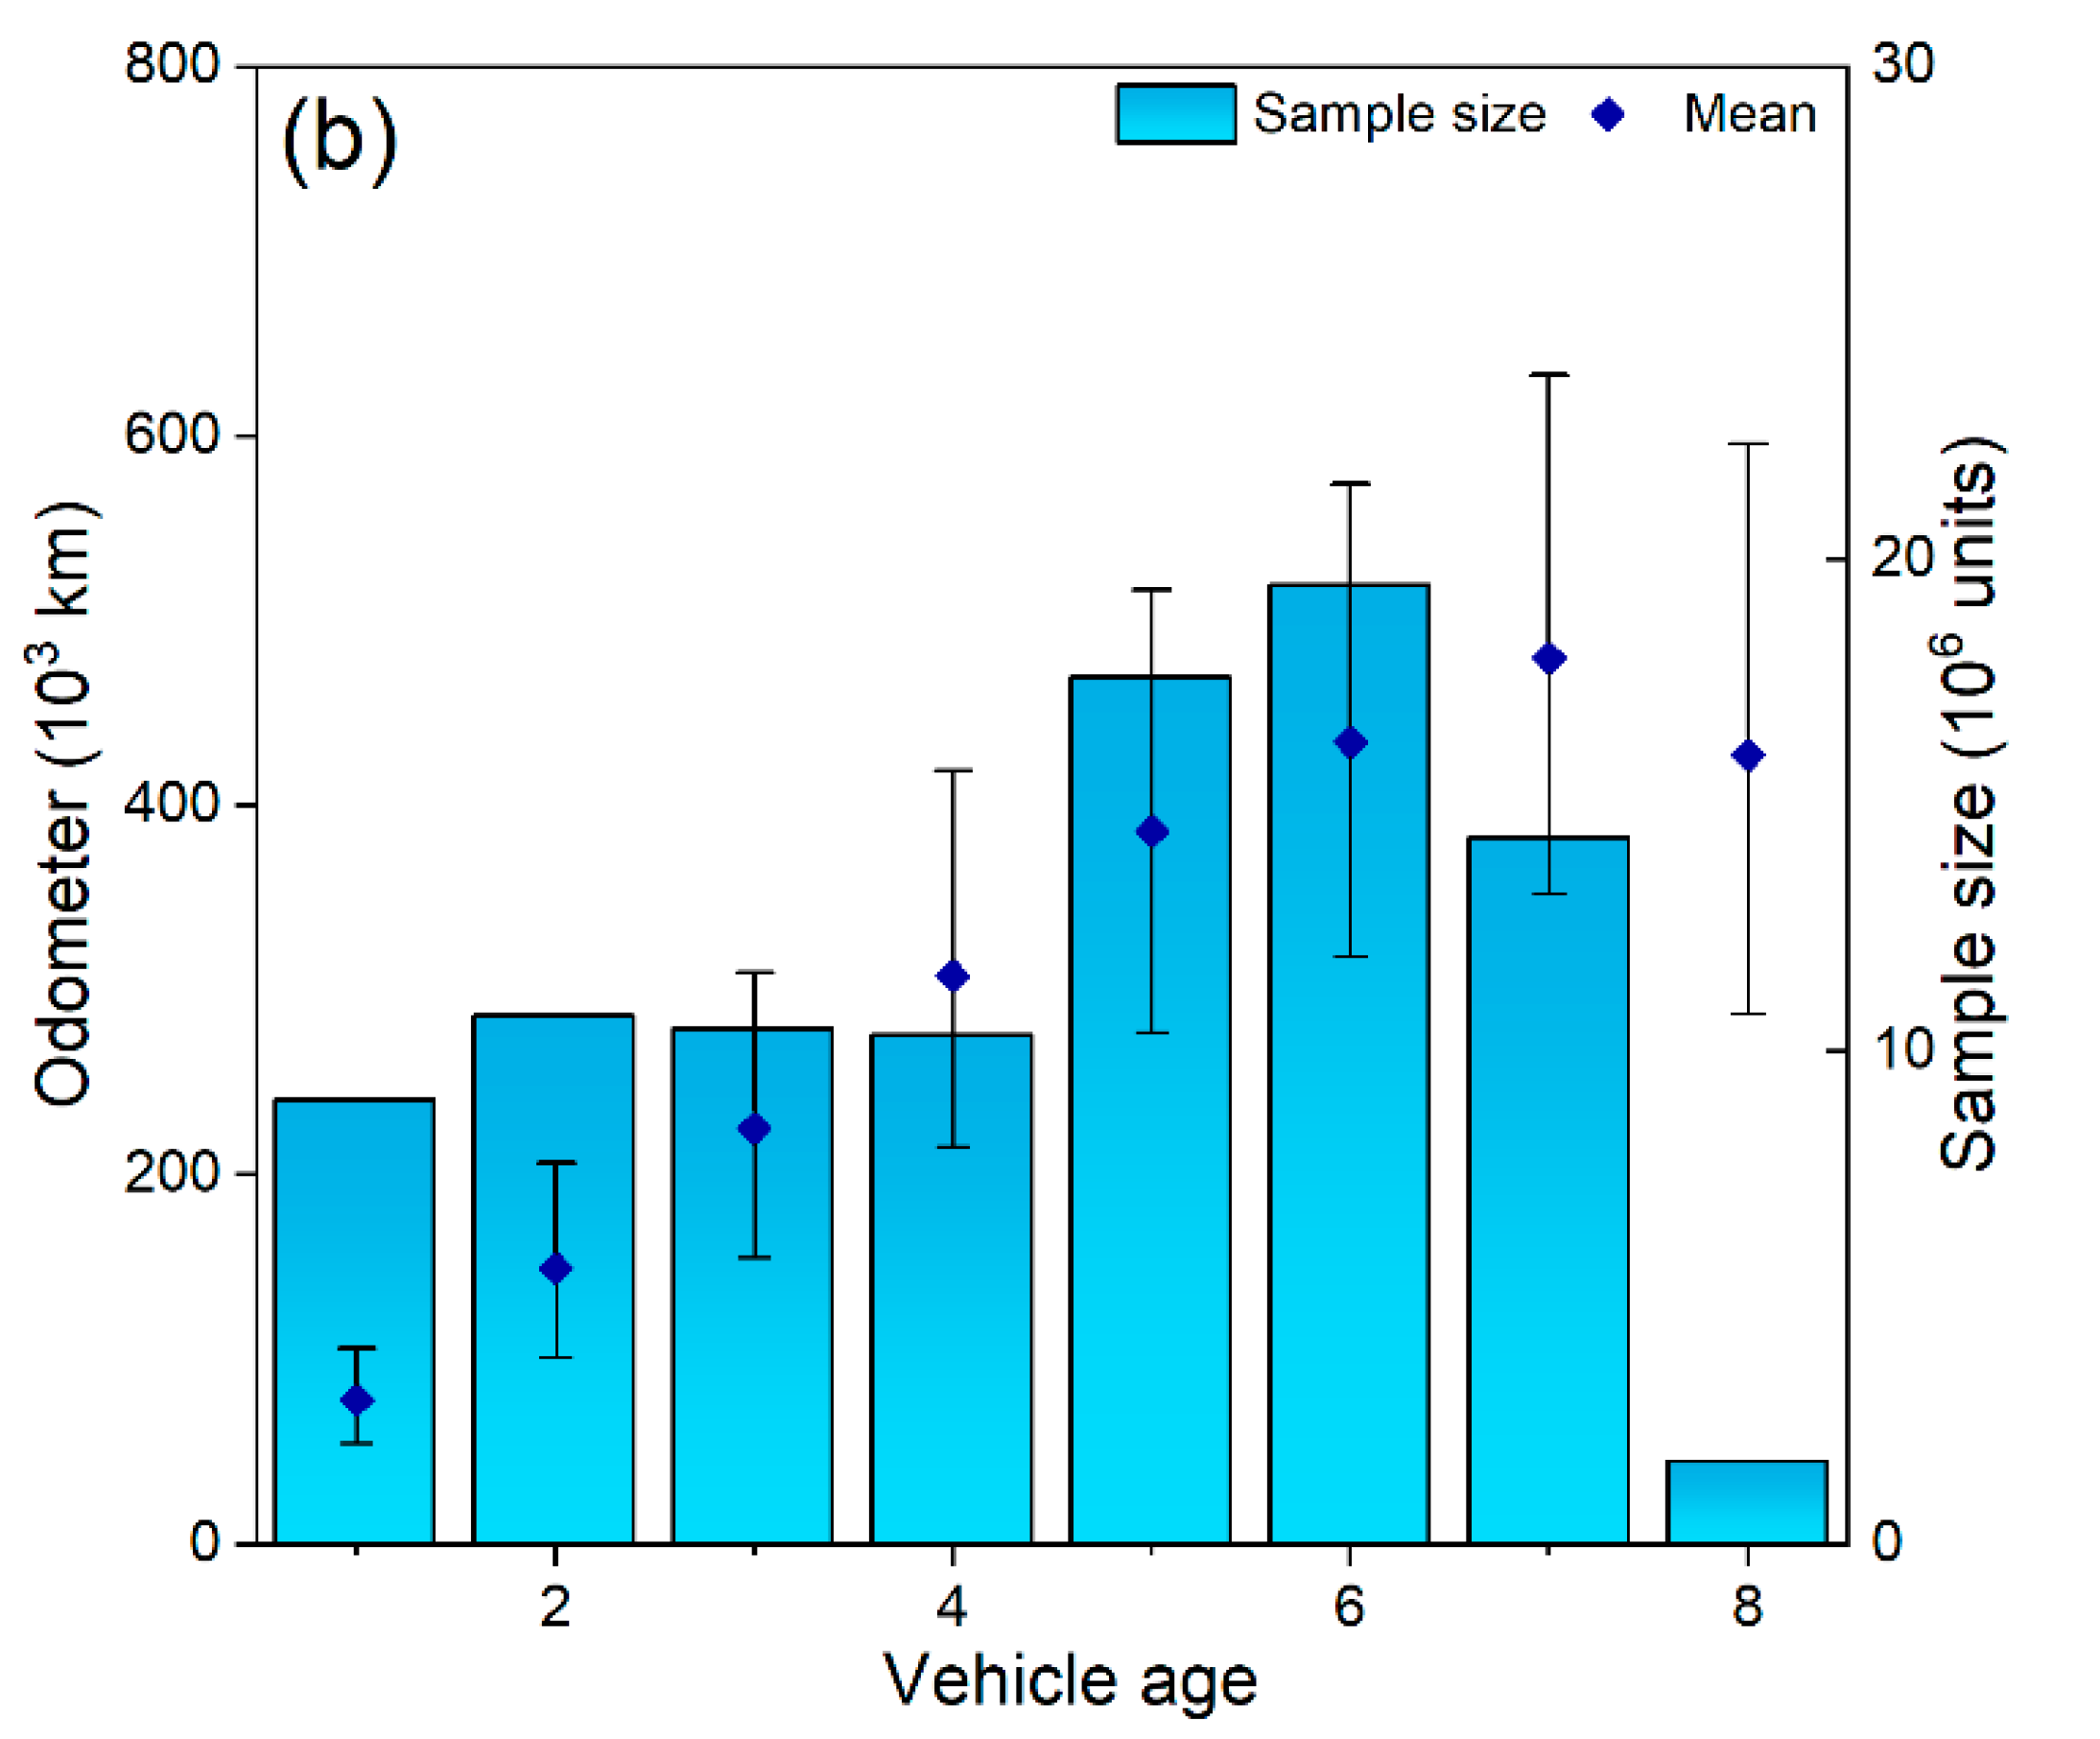
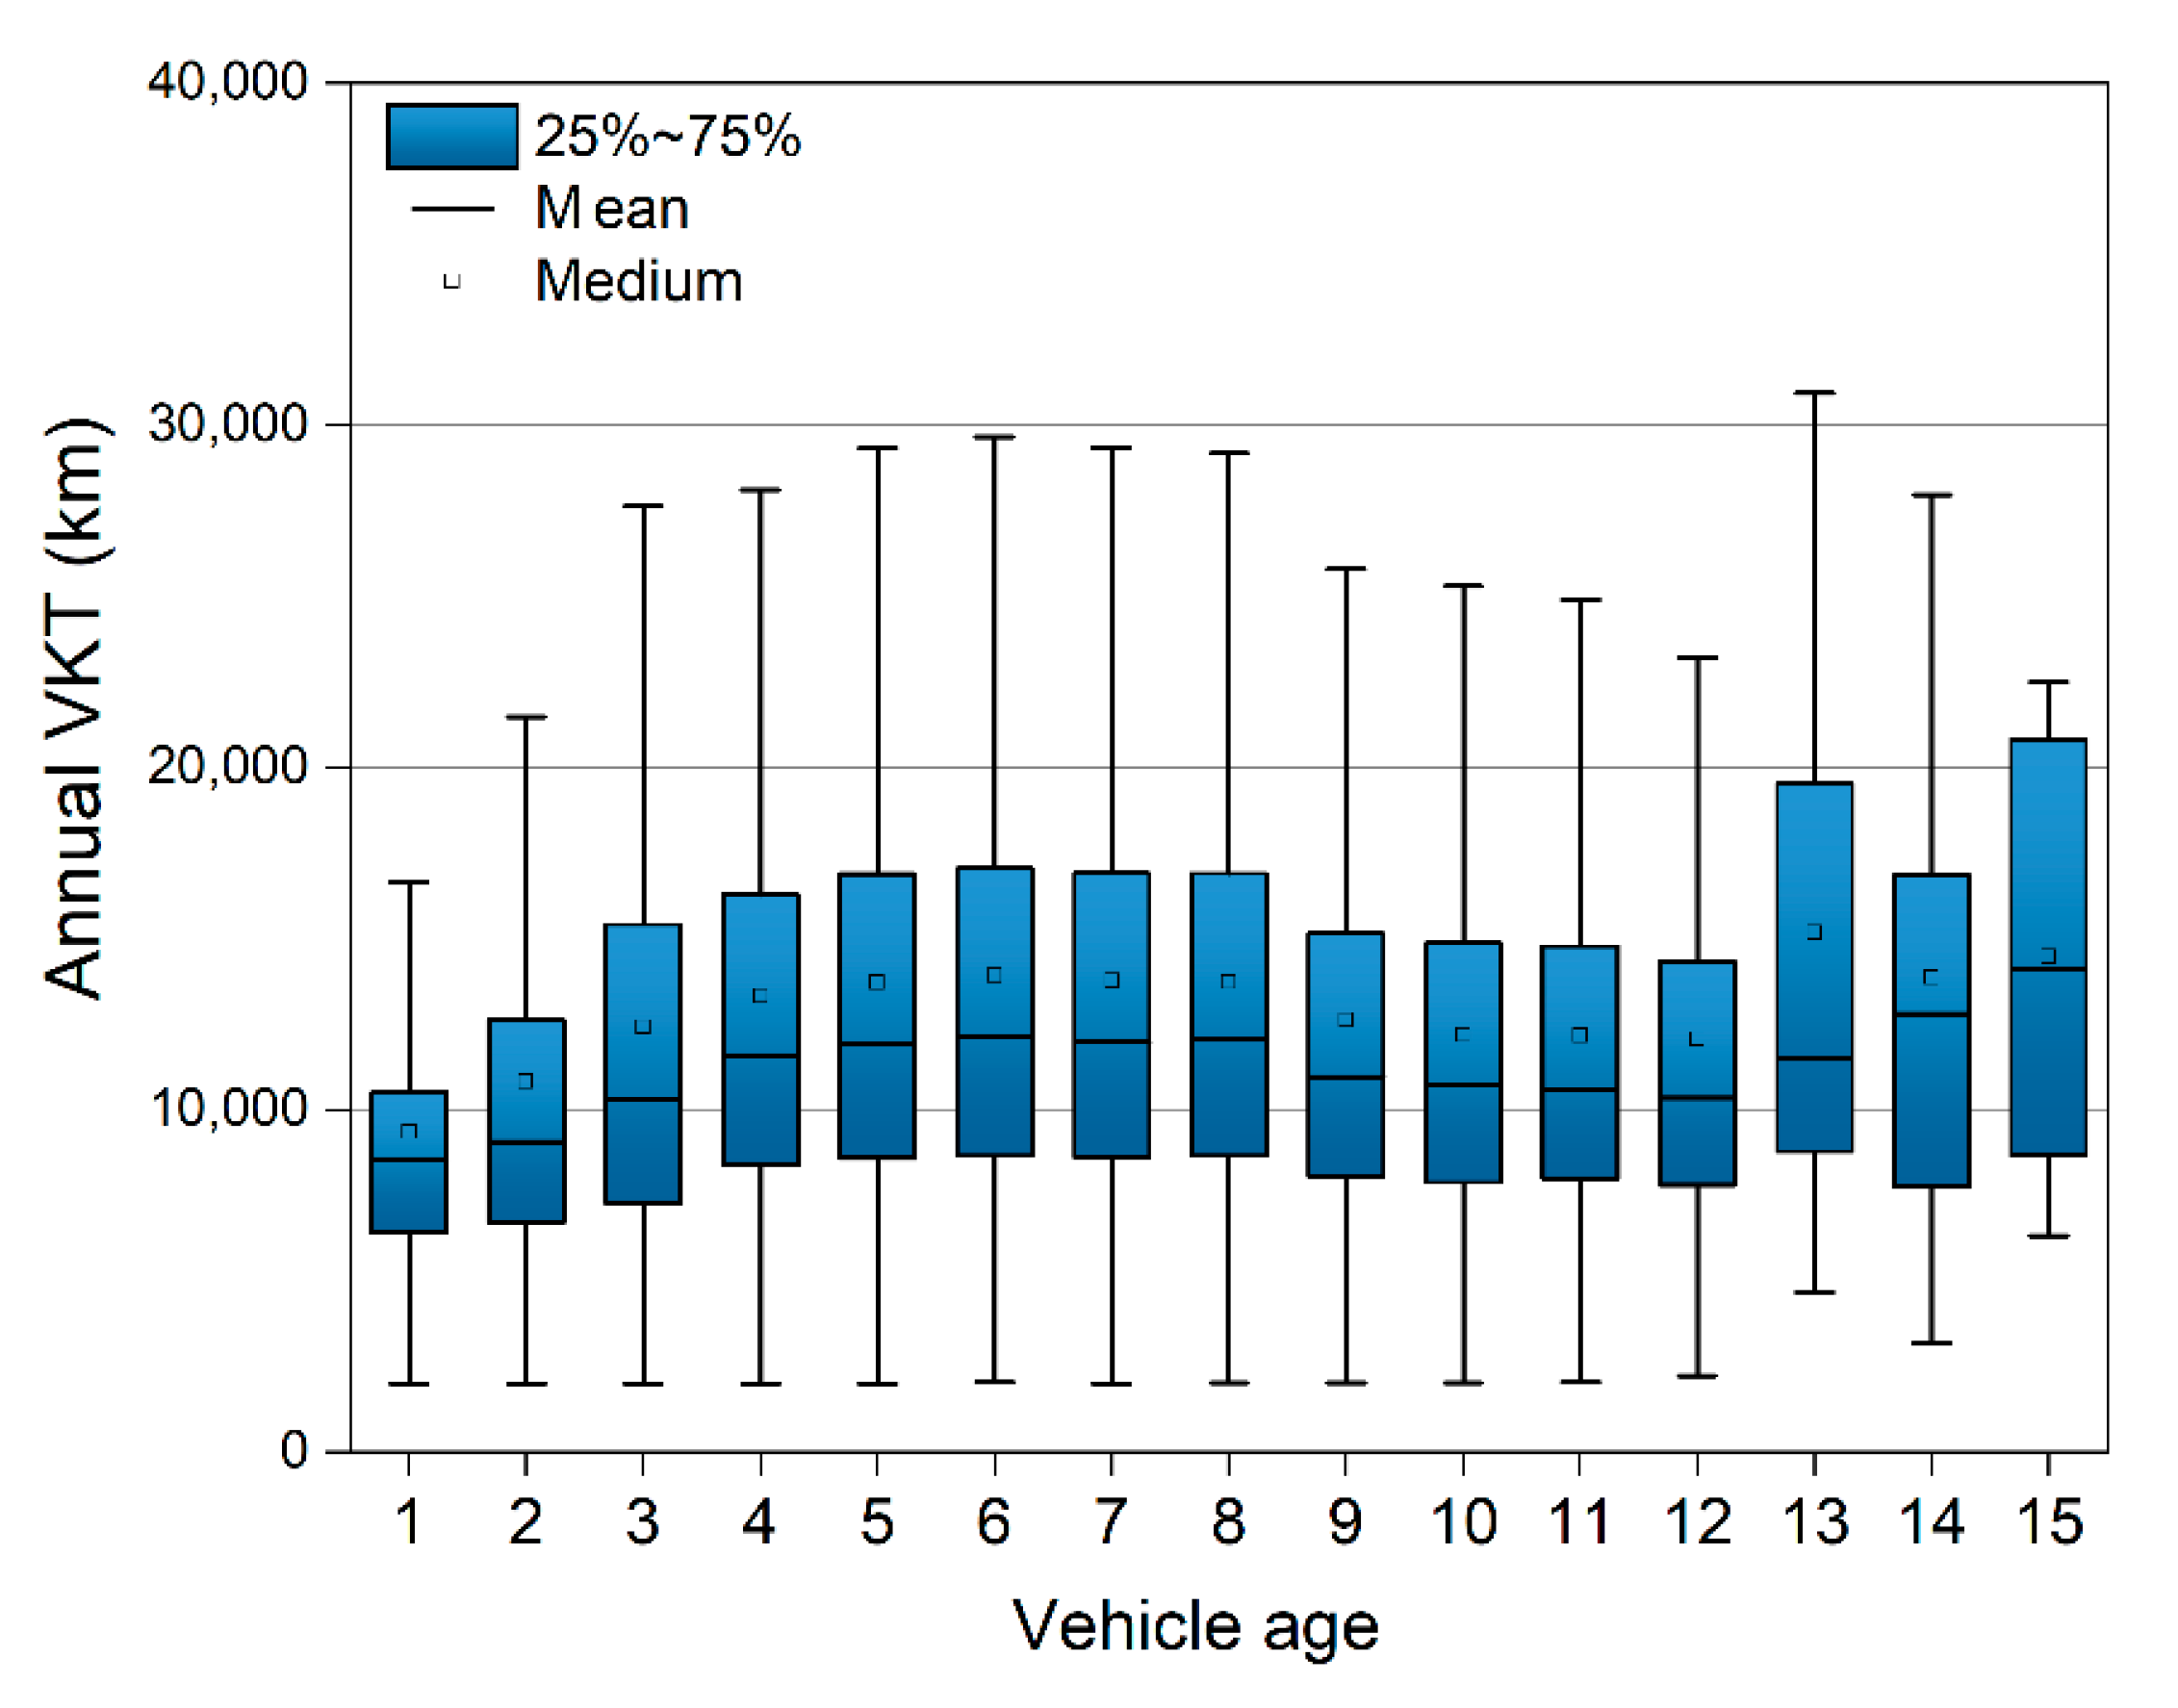
Based on the survey data of 4S stores, we further analyzed the annual mileage differences by vehicle age in 2019. The results indicate no significant difference in the annual mileage between other ages, except in the first few years (see
Figure 3). Mileage in the first year was about 70% of that in a stable period. This result was consistent with the above results based on the I/M data but is a deviation from previous results, which have generally shown that the mileage of vehicles gradually decreases with the increase in vehicle age [
8,
10,
12,
22].
As public service vehicles, taxis show more stable driving characteristics, and the odometer readings showed a complete linear correlation with the vehicle age, with the fitted slope around 80,000 km in 2019 (
Figure 2b). It should be noted, with the development of online car-hailing, private car owners can register and apply to be car-hailing drivers on online car-hailing platforms, which will lead to a significant increase in the mileage of these non-operational vehicles. With the gradual standardization of online car-hailing management, these vehicles will also be identified so that their driving characteristics can be further analyzed.
3.1.2. The Diversity of Mileage Characteristics
As detailed vehicle model information, such as engine displacement, is also provided in the I/M database, the correlation between mileage and engine size could be further discussed, as shown in
Figure 4. The distribution characteristics of the engine displacement of LDPV showed that LDPV in China can be divided into three groups according to engine size: <1.6 L, 1.6–2.0 L, and >2.0 L. The average annual mileage of vehicles larger than 2.0 L was significantly higher than the other two engine groups, which may be due to the large interior space of these vehicles, and the owners of these vehicles may engage in more family trips or long-distance travel. In addition, the average mileage of the newer vehicles (≤6 years) was lower than the older vehicles (>6 years), which may be due to the fact that the owners of newer vehicles need an adaptation period, whereas the owners of vehicles over 6 years have usually formed relatively stable travel habits.
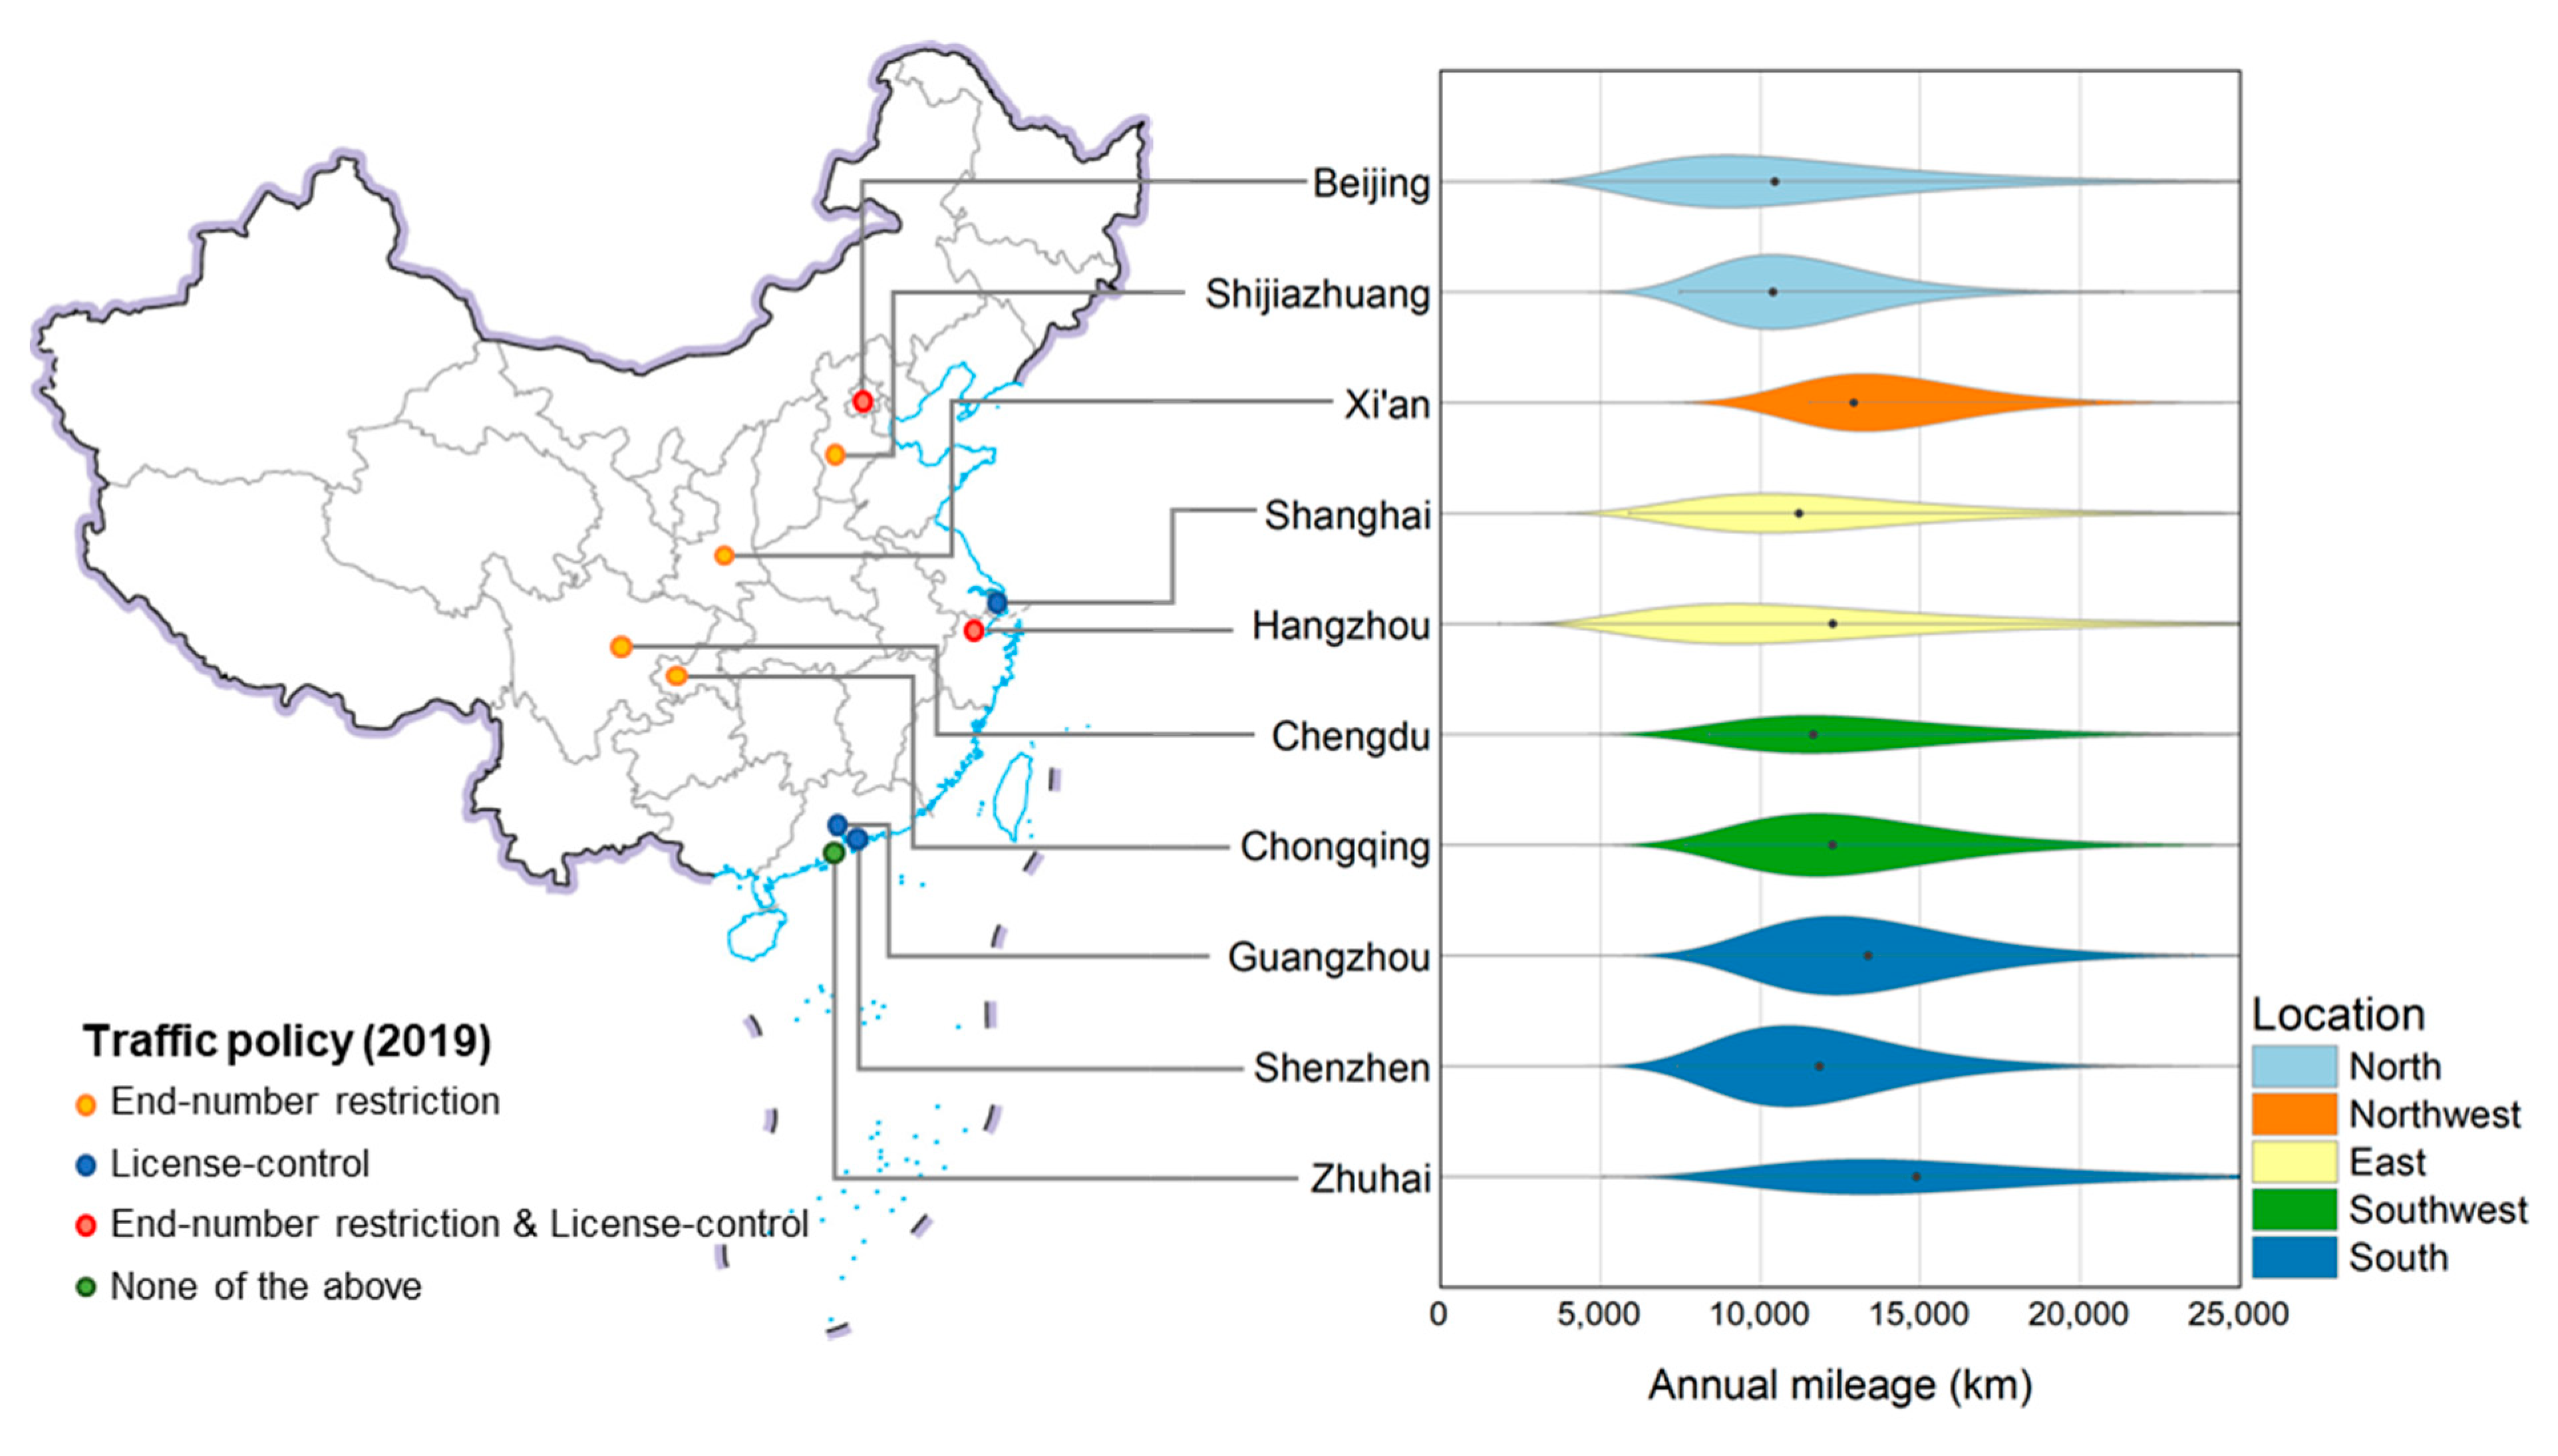
We also analyzed the characteristics of the annual mileage of the ten selected cities, as shown in
Figure 5. In order to explore the factors influencing the mileage differences, we categorized these cities in two ways. The first was by region (see
Table 1), and the second was by the intensity of traffic management (i.e., regular driving restrictions and license control). From the perspective of region and location, cities in the southern region had relatively high driving mileage, especially in the Pearl River Delta region, Zhuhai, and Guangzhou, with an annual driving mileage of more than 13,500 km. Beijing and Shijiazhuang in Northern China had the lowest mileage, at about 10,500 km. From the perspective of traffic management, Zhuhai, which has not implemented traffic restrictions, had the highest mileage, with an average annual mileage of nearly 15,000 km, and the mileage distribution data were more discrete (i.e., the distribution curve was flat and long). Interestingly, Beijing and Hangzhou, which have implemented both license control and driving restriction policies, also showed distribution curves of a similar shape, but the main body of the distribution showed a more significant shift to the left. The above results may indicate that the implementation of traffic policies will have an impact on residents’ travel habits, but some high-intensity travel will still be needed. However, due to the limitations in the upload rate and data quality, the cities selected for this study are relatively developed in China. It is recommended that subsequent studies continue to explore the travel characteristics of more cities in China.
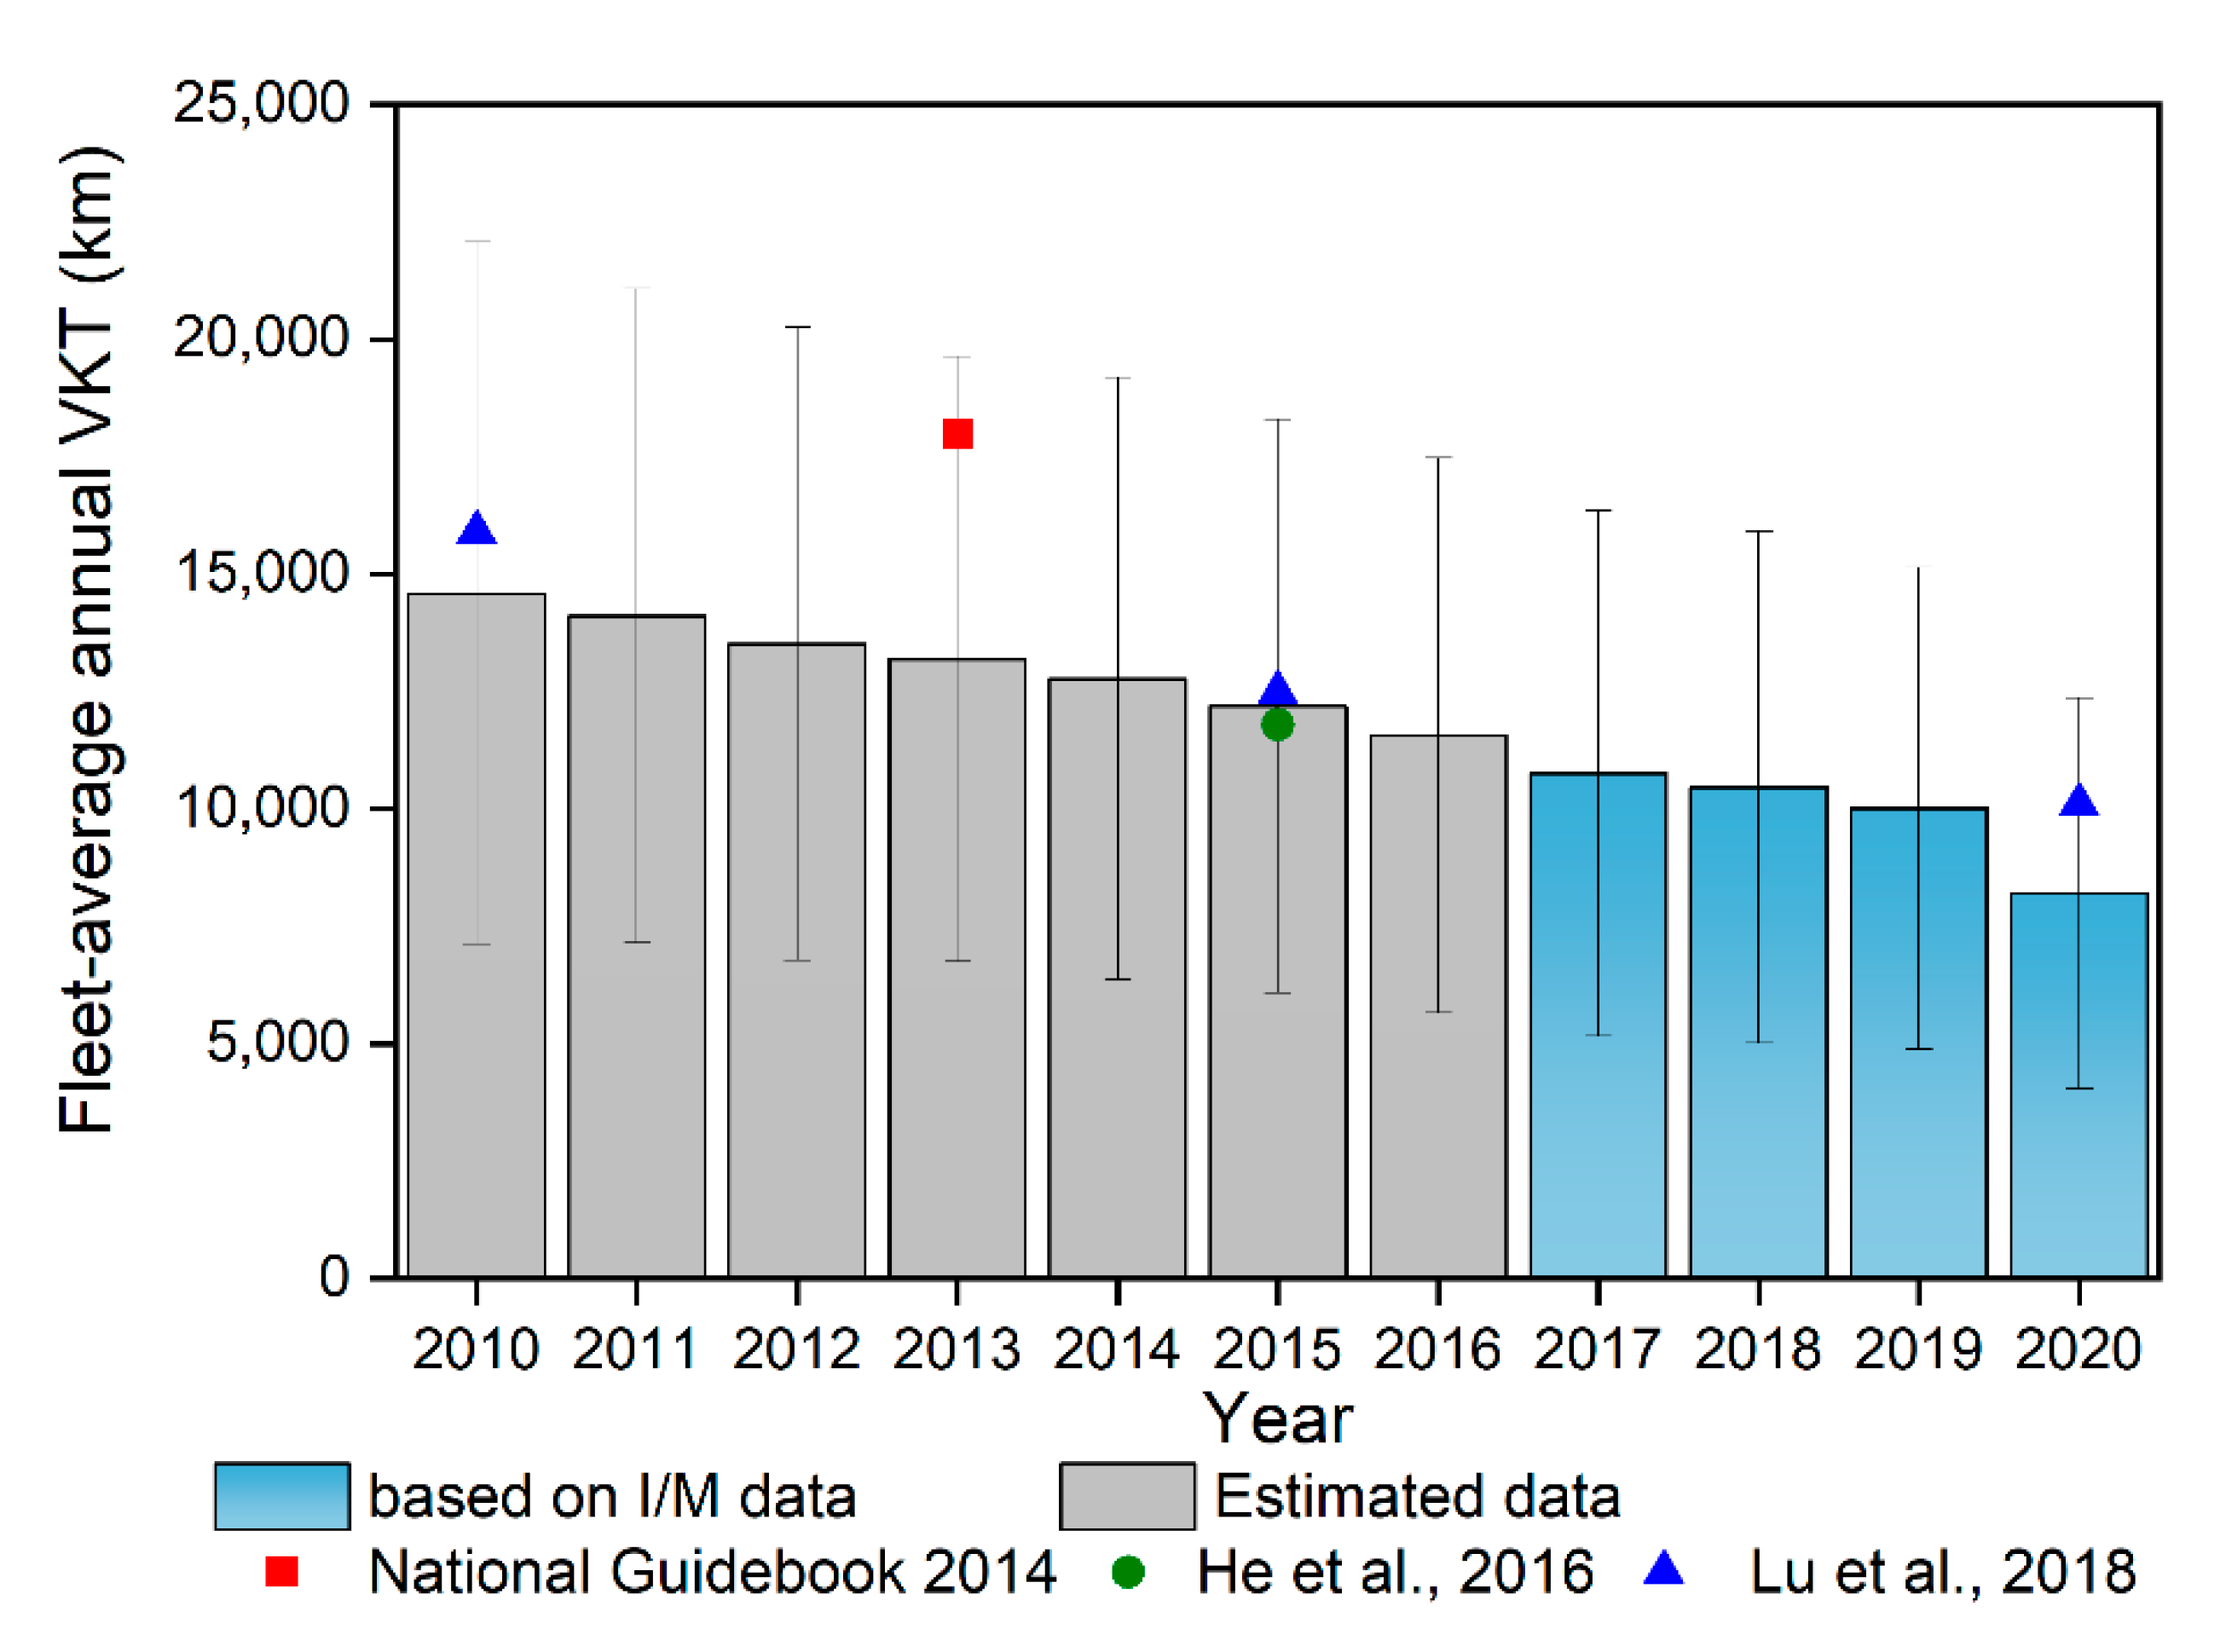
3.2. Fleet-Averaged VKT and Validation
We simulated that the fleet-averaged annual VKT of LDPV in 2017, 2018, and 2019 was 11,500, 10,700, and 10,300 km, respectively. This indicated that the average activity level of the overall fleet decreased slightly with the driving year, with an average annual decline of 5.4%. In 2020, the sudden outbreak of COVID-19 had a dramatic impact on people’s activities, leading to a significant decline in the activity levels of LDPV. Based on the I/M data, the annual average mileage of LDPV in 2020 was 8209 km, which decreased by ~22% compared with 2019. Overall, the results were far lower than the recommended mileage of LDPV (18,000 km/yr) in the national vehicle emission inventory guidelines issued by the former Ministry of Environmental Protection in 2014 (short for National Guidelines 2014) but similar to the results of related studies in recent years [
11,
16].
To validate the mileage results, we estimated the gasoline consumption of the fleet of LDPV and compared it with the fuel consumption data from the statistical yearbook. In 2019, we calculated that the China’s fleet of LDPV consumed 120 million tons of gasoline and emitted 350 million tons of CO2, which was 40% lower than the results based on the recommended VKT in the National Guidelines 2014. The gasoline consumption calculated based on this study was closer to the actual gasoline consumption reported by the Bureau of National Statistics (accounting for 95% of total gasoline consumption, with the rest contributed by a small amount of gasoline light-duty trucks and motorcycles).
Furthermore, we combined the mileage characteristics and trends from 2017 to 2020 with the gasoline consumption statistics from the past 10 years to extrapolate the fleet-averaged mileage from 2010 to 2016 and support the update of the multi-year emission inventory. As
Figure 6 shows, the annual mileage of China’s fleet of LDPV is gradually declining, with a decrease of 31.4% in 2019 compared with 2010 (due to the impact of the epidemic in 2020, 2019 was taken as a reference), which also reflects the gradual optimization of residents’ travel structure in China. This has been evidenced by the rapid development of public transport in China over the past decade; the number of buses has increased by 57%, and the operating mileage of subways is five times that of 2010.
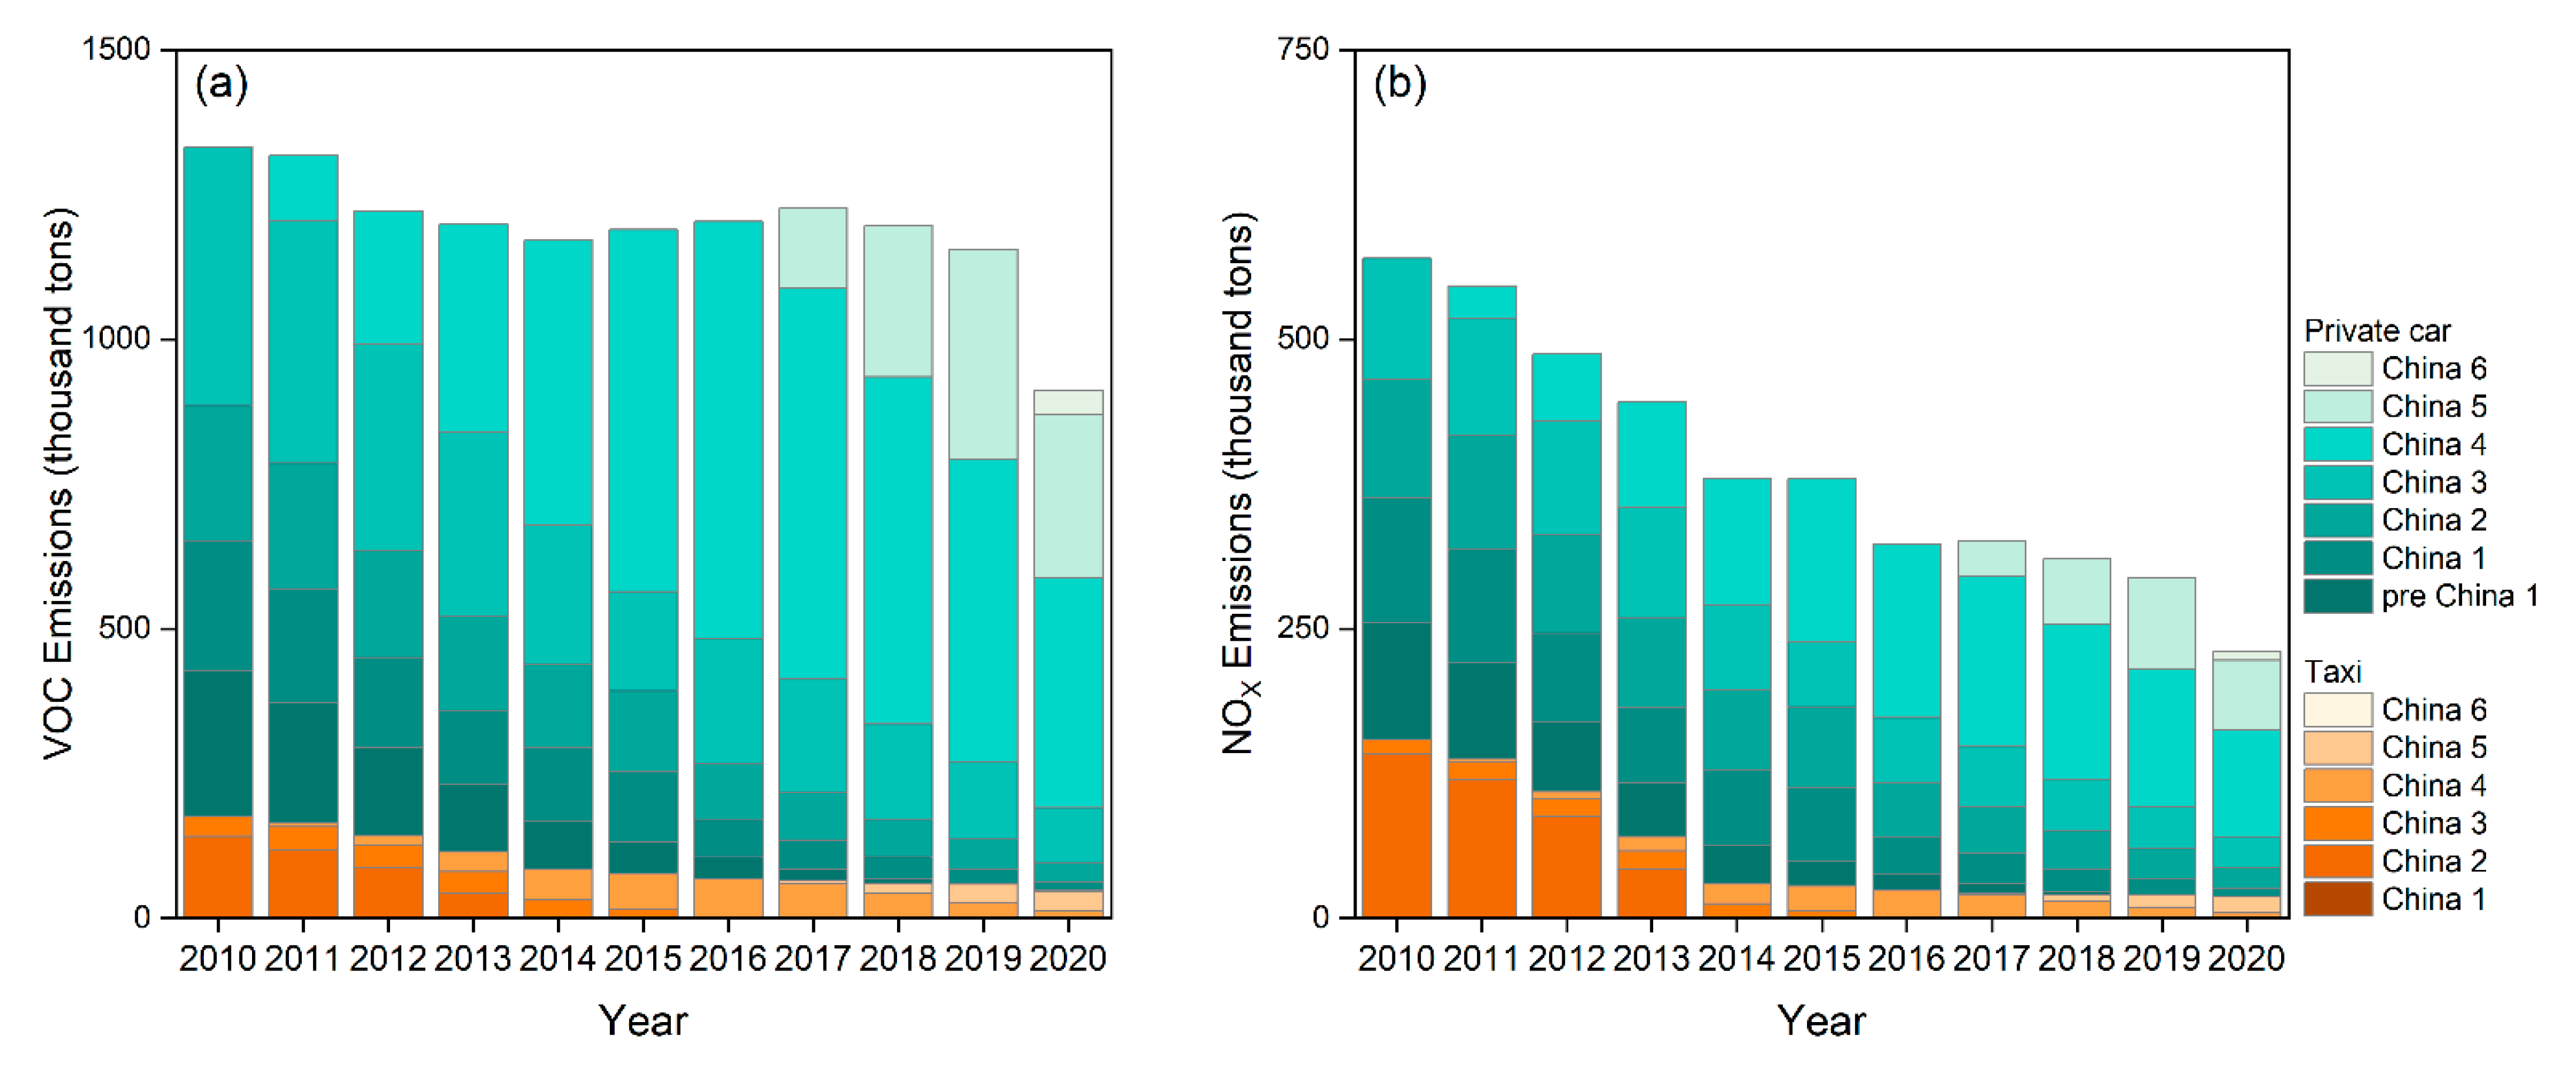
3.3. Optimized Emission Inventory of Light-Duty Vehicles
Based on the above results, we optimized the pollutant emission inventory of China’s fleet of LDPV from 2010 to 2020. First, the detailed mileage differences of vehicle use type, engine size, vehicle age, and driving years were obtained. Second, the validated overall VKT for the LDPV fleet further ensured the accuracy of the emissions calculations. In addition, the specific factors, such as the impact of the pandemic on traffic and emissions, were factually reflected. The emission trends of volatile organic compounds (VOC) and NO
X are shown in
Figure 7. The VOC emissions of the fleet of LDPV in the past 10 years showed no significant downward trend, which was mainly because the evaporative emissions of gasoline vehicles in the China 5 and previous stages have not been effectively controlled, whereas the NO
X emissions of LDPV have been reduced with the gradual tightening of emission standards and the continuous updating of the fleet composition. VOC and NO
X emissions decreased by about 25% in 2020 compared to 2019, mainly due to the reduction in residents’ travel and the initial implementation of the China 6 standard.
Vehicular emissions account for a major part of anthropogenic VOC and NO
X emissions [
24], which are important precursors for secondary organic aerosols (SOA), inorganic aerosols (SNA), and O
3 [
25]. Therefore, our optimized vehicular emission inventory could help to diminish the bias for PM
2.5 and O
3 prediction in chemical transport simulations.
4. Conclusions
This paper made a preliminary attempt to explore the data value of the current vehicle in-use supervision platform and carried out an in-depth analysis of the mileage characteristics of China’s passenger vehicles from the perspective of big data analysis. A series of results were obtained, including the variation trend of mileage with vehicle age, and driving year, and the correlation between mileage and vehicle size and region. Verification with energy consumption data showed that the results of this study were close to the actual situation, which ensures the accurate subsequent assessment of the emissions and energy consumption of LDPV. Finally, the pollutant emission inventory of LDPV from 2010 to 2020 was updated to provide a more refined data basis for subsequent further research on emission reduction decision-making and air quality simulation.
It is worth pointing out that, as the platform construction is still at the initial stage, there are still some defects in data-uploading integrity and quality control. In the future, specific rules could be formulated to restrict the recording of annual inspection information, and the algorithm of this study could be implanted into the system to dynamically update and calculate the activity characteristics of various vehicles. As the coverage of uploaded data increases, more region-level differences in activity levels could be further explored. The potential of big data supervision will be fully realized in the future to provide technical support for the supervision of vehicles.
Author Contributions
Conceptualization, D.M.; methodology, X.W. and S.Z.; writing—original draft preparation and visualization, H.Y., D.M., and X.W.; writing—review and editing, Y.D., X.S., and S.Z; supervision, Y.W. All authors have read and agreed to the published version of the manuscript.
Funding
This research has been financed by The Ministry of Science and Technology (MOST) of China within the framework of the International Science and Technology Cooperation program (grant no. 2018YFE0106800, MOST–EU Horizon 45 2020 collaborative project).
Institutional Review Board Statement
Not applicable.
Informed Consent Statement
Informed consent was obtained from all subjects involved in the study.
Data Availability Statement
Not applicable.
Conflicts of Interest
The authors declare that they have no known competing financial interest or personal relationships that could have appeared to influence the work reported in this paper.
References
- Wen, Y.; Zhang, S.; He, L.; Yang, S.; Wu, X.; Wu, Y. Characterizing start emissions of gasoline vehicles and the seasonal, diurnal and spatial variabilities in China. Atmos. Environ. 2021, 245, 118040. [Google Scholar] [CrossRef]
- Zheng, X.; Lu, S.; Yang, L.; Yan, M.; Xu, G.; Wu, X.; Fu, L.; Wu, Y. Real-world fuel consumption of light-duty passenger vehicles using on-board diagnostic (OBD) systems. Front. Environ. Sci. Eng. 2020, 14, 33. [Google Scholar] [CrossRef]
- Wang, H.; Wu, Y.; Zhang, K.M.; Zhang, S.; Baldauf, R.W.; Snow, R.; Deshmukh, P.; Zheng, X.; He, L.; Hao, J. Evaluating mobile monitoring of on-road emission factors by comparing concurrent PEMS measurements. Sci. Total Environ. 2020, 736, 139507. [Google Scholar] [CrossRef]
- Saliba, G.; Saleh, R.; Zhao, Y.; Presto, A.A.; Lambe, A.T.; Frodin, B.; Sardar, S.; Maldonado, H.; Maddox, C.; May, A.A.; et al. Comparison of gasoline direct-injection (GDI) and port fuel injection (PFI) vehicle emissions: Emission certification standards, cold-start, secondary organic aerosol formation potential, and potential climate impacts. Environ. Sci. Technol. 2017, 51, 6542–6552. [Google Scholar] [CrossRef]
- Demuynck, J.; Favre, C.; Bosteels, D.; Hamje, H.; Andersson, J. Real-World Emissions Measurements of a Gasoline Direct Injection Vehicle without and with a Gasoline Particulate Filter; Search Technical Papers; SAE: Warrendale, PA, USA, 2017. [Google Scholar] [CrossRef]
- Wang, H.; Chen, C.; Huang, C.; Fu, L. On-road vehicle emission inventory and its uncertainty analysis for Shanghai, China. Sci. Total Environ. 2008, 398, 60–67. [Google Scholar] [CrossRef]
- Zheng, J.; Zhou, Y.; Yu, R.; Zhao, D.; Lu, Z.; Zhang, P. Survival rate of china passenger vehicles: A data-driven approach. Energy Policy 2019, 129, 587–597. [Google Scholar] [CrossRef]
- Hossain, A.; Gargett, D. Road vehicle-kilometres travelled estimated from state/territory fuel sales. In Proceedings of the ATRF 2011—34th Australasian Transport Research Forum, Adelaide, Australia, 28–30 September 2011; pp. 1–15. [Google Scholar]
- Bäumer, M.; Hautzinger, H.; Kuhnimhof, T.; Pfeiffer, M. The German vehicle mileage survey 2014: Striking the balance between methodological innovation and continuity. Transp. Res. Procedia 2018, 32, 329–338. [Google Scholar] [CrossRef]
- Huo, H.; Zhang, Q.; He, K.; Yao, Z.; Wang, M. Vehicle-use intensity in China: Current status and future trend. Energy Policy 2012, 43, 6–16. [Google Scholar] [CrossRef]
- He, X.; Wu, Y.; Zhang, S.; Tamor, M.A.; Wallington, T.J.; Shen, W.; Han, W.; Fu, L.; Hao, J. Individual trip chain distributions for passenger cars: Implications for market acceptance of battery electric vehicles and energy consumption by plug-in hybrid electric vehicles. Appl. Energy 2016, 180, 650–660. [Google Scholar] [CrossRef]
- Caserini, S.; Pastorello, C.; Gaifami, P.; Ntziachristos, L. Impact of the dropping activity with vehicle age on air pollutant emissions. Atmos. Pollut. Res. 2013, 4, 282–289. [Google Scholar] [CrossRef]
- Kalinowska, D.; Kuhfeld, H.W. Motor Vehicle Use and Travel Behaviour in Germany: Determinants of Car Mileage; German Institute for Economic Research: Berlin, Germany, 2006. [Google Scholar]
- National Highway Traffic Safety Administration. Vehicle Survivability and Travel Mileage Schedules; NHTSA’s National Center for Statistics and Analysis: Washington, DC, USA, 2006; p. 22.
- Mulley, C.; Tanner, M. The vehicle kilometres travelled (VKT) by private car: A spatial analysis using geographically weighted regression. In Proceedings of the 32nd Australasian Transport Research Forum ATRF, Auckland, New Zealand, 29 September–1 October 2009; pp. 1–10. [Google Scholar]
- Lu, Z.; Zhou, Y.; Cai, H.; Wang, M.; He, X.; Przesmitzki, S. China Vehicle Fleet Model: Estimation of Vehicle Stock, Usage, Emissions, and Energy Use; Argonne National Lab. (ANL): Argonne, IL, USA, 2018. [Google Scholar]
- Ben Dror, M.; Qin, L.; An, F. The gap between certified and real-world passenger vehicle fuel consumption in China measured using a mobile phone application data. Energy Policy 2019, 128, 8–16. [Google Scholar] [CrossRef]
- Yang, Z.; Yang, L. Evaluation of Real-World Fuel Consumption of Light-Duty Vehicles in China; International Council on Clean Transportation (ICCT): Beijing, China, 2018. [Google Scholar]
- Zhang, S.; Wu, Y.; Wu, X.; Li, M.; Ge, Y.; Liang, B.; Xu, Y.; Zhou, Y.; Liu, H.; Fu, L.; et al. Historic and future trends of vehicle emissions in Beijing, 1998–2020: A policy assessment for the most stringent vehicle emission control program in China. Atmos. Environ. 2014, 89, 216–229. [Google Scholar] [CrossRef]
- Wu, X.; Wu, Y.; Zhang, S.; Liu, H.; Fu, L.; Hao, J. Assessment of vehicle emission programs in China during 1998–2013: Achievement, challenges and implications. Environ. Pollut. 2016, 214, 556–567. [Google Scholar] [CrossRef]
- Wu, Y.; Zhang, S.; Hao, J.; Liu, H.; Wu, X.; Hu, J.; Walsh, M.P.; Wallington, T.J.; Zhang, K.M.; Stevanovic, S. On-road vehicle emissions and their control in China: A review and outlook. Sci. Total Environ. 2017, 574, 332–349. [Google Scholar] [CrossRef]
- Liu, H.; Man, H.; Tschantz, M.; Wu, Y.; He, K.; Hao, J. VOC from vehicular evaporation emissions: Status and control strategy. Environ. Sci. Technol. 2015, 49, 14424–14431. [Google Scholar] [CrossRef]
- Ministry of Environmental Protection. The National Vehicle Emission Inventory Guidelines; Ministry of Environmental Protection: Beijing, China, 2014.
- Li, Q.; Su, G.; Li, C.; Liu, P.; Zhao, X.; Zhang, C.; Sun, X.; Mu, Y.; Wu, M.; Wang, Q.; et al. An investigation into the role of VOCs in SOA and ozone production in Beijing, China. Sci. Total Environ. 2020, 720, 137536. [Google Scholar] [CrossRef]
- Zheng, H.; Zhao, B.; Wang, S.; Wang, T.; Ding, D.; Chang, X.; Liu, K.; Xing, J.; Dong, Z.; Aunan, K.; et al. Transition in source contributions of PM2.5 exposure and associated premature mortality in China during 2005–2015. Environ. Int. 2019, 132, 105111. [Google Scholar] [CrossRef]
| Publisher’s Note: MDPI stays neutral with regard to jurisdictional claims in published maps and institutional affiliations. |
© 2022 by the authors. Licensee MDPI, Basel, Switzerland. This article is an open access article distributed under the terms and conditions of the Creative Commons Attribution (CC BY) license (https://creativecommons.org/licenses/by/4.0/).


