Article

Prioritization of VOCs Emitted from Co-Processing Cement Kiln Using a Fuzzy Analytic Hierarchy Process Method

Laboratory of Urban Atmospheric Volatile Organic Compounds Pollution Control and Application, Beijing Municipal Research Institute of Eco-Environmental Protection, Beijing 100037, China
*
Author to whom correspondence should be addressed.
Atmosphere 2022, 13(12), 1952; https://doi.org/10.3390/atmos13121952
Submission received: 25 October 2022 / Revised: 15 November 2022 / Accepted: 18 November 2022 / Published: 23 November 2022
(This article belongs to the Special Issue Industrial Air Pollution: Emission, Management and Policy)

Abstract

:
The violate organic compounds (VOCs) emission from co-processing cement kiln has not been comprehensively investigated and evaluated. In this study, we sampled and determined the VOCs emitted from a typical co-processing cement kiln in Beijing, China. VOCs characteristics, ozone formation potential (OFP), and main odor components for the emitted gas were analyzed. Additionally, a Fuzzy Analytic Hierarchy Process (F-AHP) was innovatively applied to estimate the priority VOCs. The study shows that aromatic (36.6%) and oxygen contained VOCs (O-VOCs) (30.3%) were the most abundant VOCs, with a high average concentration of benzene (1622.0 μg/m3) and acrolein (1105.5 μg/m3). Acrolein, propene, benzene, 1-butane, and 1,3-butadiene were the dominate OFP compounds, with the corresponding average OFP concentration of 8325.6, 3768.2, 1167.9, 1065.9, and 1027.2 μg/m3, respectively. Acrolein was also found to be the dominate main odor component. Eleven VOCs, including one O-VOC, one halohydrocarbon, and nine alkenes, were screened out by F-AHP. Alkene was the priority VOCs category and acrolein was the most important VOC in the stack gas. The results of this study are helpful to systematically understand the VOCs’ characteristics, OFP, main odor components, and priority compounds of VOCs in the stack gas of co-processing cement kiln, and provide a new method for the screening of priority VOCs compounds.

1. Introduction

China is the largest producer of concrete, with a total production of 2.36 billion tonnes in 2021, and cement production consumes plenty of non-renewable resources [1,2] (Ahmed). Co-processing cement kiln technology using alternative fuels and raw materials, such as sludge [3,4,5], waste plastic [6], bottom ash from municipal solid waste incineration [7,8], and polluted soil [9] to produce green cement, is gradually replacing the conventional cement production technology. Two co-processing cement plants in Beijing utilized approximately 73,570 tonnes of hazard waste, 104,629 tonnes of construction waste, 71,748 tonnes of flay ash, and 31,540 tonnes of sludge during 2021.
Air pollutants released from stationary and mobile sources in cement plants can have a negative impact on the environment and health [10]. According to the official Spanish registry of emissions, 136 tonnes of NOx, 4833 tonnes of SO2, 183 tonnes of VOCs, including toxic dioxins, furans, Polychlorinated Biphenyl (PCBs), and 0.32 tonnes of mercury were released from the Spanish cement industry in 2010 (http://www.prtr-es.es (accessed on 1 May 2022)). García-Gusano et al. [11] collected volatile organic chemicals (VOCs) emissions from the cement industry of Spain in 2010, and the total non-methane organic volatile compounds emission was 1.05 kt [11]. The air emission limit value for the co-processing cement kilns (Directive 2010/75/EU, EU) [12] for VOCs is 10 mg/m3, while VOCs were not constrained in the emission standard of air pollutants from the cement industry (GB 4915-2013, China) [13]. The impact of VOCs pollution emitted from the cement industry in China has been overlooked.
Volatile organic pollutants are amenable to treatments by thermal desorption, owing to their volatility. When a cement kiln is used to co-process contaminated soils, the temperature in the kiln room is usually 1450 °C, which can ensure the decomposition of organic pollutants [14]. However, 23 kinds of VOCs from pollutant soil, which can be disposed by cement kiln co-processing, were reported in a review article [9]. VOCs and odorous compounds in the exhaust gas were still released in the air, which may cause air pollution and harm human health [5]. While utilizing the co-processing to decompose sludge, it is worth noting that the total PAHs concentration increased with the increase in the amount of sewage sludge being co-processed [4]. However, the reported studies are more inclined to use total VOCs (TVOCs) to evaluate the emission characteristics of the cement industry by comparing with NOx, SO2, and particulate matter. The VOCs components were found to be rare, especially within the application of co-processing. Thus, the characteristics of VOCs emitted from a co-processing cement kiln are not well studied.
VOCs impact many aspects, such as odor pollution, ozone pollution, formation of secondary organic aerosol, and health risk [5,15]. However, it is hard to conclude which aspect should be addressed first and which compounds should be given more attention. Thus, a more convenient method which can select the priority target components in a series of VOCs is necessary. In 1965, Lotfi A., Zadeh invented fuzzy mathematics, a useful tool to evaluate the abstract conceptions. In 1980, Thomas L. Saaty invented the analytical hierarchical process (AHP), a multi-criteria decision-making method [16]. The fuzzy method was used to evaluate the primary odor compounds in the waste gas via comprehensive scores, which were estimated through the weighted sum of the score of several factors, such as chemical concentration, threshold value, detection frequency, toxicity, and saturated vapor pressure [17,18]. AHP has been used for water quality evaluation, considering dissolved oxygen, chlorides, chemical oxygen demand, turbidity, pH, total dissolved solids, and total hardness as the parameters [19], as well as site selection [20,21,22], industry performance [23], health assessment [24], water quality [19], air quality [25], and sustainability assessment [26]. A Fuzzy Analytic Hierarchy Process (F-AHP) method can help in the analysis of the prior compounds and prior VOCs categories in the VOCs pollutants.
In the present research, we collected VOCs samples from a co-processing cement plant in Beijing and give a detailed discussion on the VOCs’ characterization. Assessment of the VOCs included emission concentration, ozone formation potential (OFP), and main odor components. An F-AHP approach to identify the priority compounds among 102 VOCs was applied and the top two tiers of VOCs were discussed.

2. Material and Methods

2.1. Sampling Site

We considered two co-processing cement kilns located in the north suburb of Beijing, China with the clinker capacities of 2000 and 3000 t/d in the present study. During the investigation period, only one co-processing cement kiln with the clinker capacities of 2000 t/d was on stream. The activity level of the co-processing cement kiln is listed in the Table 1.
The kiln system has four main parts, namely the preheater system, a pre-calciner, a rotary kiln, and a purification system. The purification system consists of a bag filter, a selective non-catalytic reduction system, and a desulfurization tower. The components of co-incinerated waste are complex, which contains wastewater treatment sludge, painting slag, waste metal oxide, waste alkali, waste rubber, resin, and waste organic reagent. Most of the solid waste was fed through the bottom of the pre-calciner. The waste organic reagent was fed in the kiln head through a manual platform.

2.2. Sampling and Analysis

The stack gas samples were collected from the 2000 t/d capacity cement kiln during four days in October 2021. For each day, three samples were collected at 10:00 a.m., 1:00 p.m., and 4:00 p.m., and an extra sample was collected at 9:00 a.m. on the first day. All samples were collected using emission from stationary sources-sampling of volatile organic compounds-bags method (HJ 732-2014). Samples were analyzed using gas chromatography–mass spectrometry (GC-MS) (7890A-5975C, Agilent) according to the TO-15 method within 48 h from the sampling time.

2.3. Statistical Methods

In this study, OFP, health risk, and olfactory impacts were considered and the associated statistical methods are listed below.

2.3.1. Ozone Formation Potential

NOx, CO, and VOCs are important precursors of ozone [27]. In the regions that have high NOx concentrations, ozone production is VOC-limited because ozone production is reduced when the VOCs emission decreases [27]. During our sampling period, the average NOx concentration was 151 mg/m3. Thus, the maximum reactivity coefficient (MIR) method was suitable for the OFP evaluation of the stack gas.
O F P i = C i × M I R i
where, OFPi is defined as the ozone formation potential for the individual VOCi (μg/m3), C i is the concentration of ith VOC (μg/m3), and MIRi is the maximum reactivity coefficient of compound i (g O3 per g VOC). The detailed data for MIR was obtained from [28].

2.3.2. Main Odor Components Evaluation

The odor activity value (OAV) was used to evaluate main odor components (Equation (2)), which can quantitatively compare the odor strength of VOCs. The OAV was the ratio of compound’s concentration to the odor detection threshold.
O A V i = C i / O T i
where, Ci is the concentration of a specific compound (mg/m3), OTi is the detected odor threshold for each compound (mg/m3), and TOAV is the total OAV of the mixture odorants. The detected odor threshold used in this study was inferred from [29].
T O A V = O A V i
where TOAV is the total OAV of the mixture odorants. The detected odor threshold used in this study was inferred from [29].

2.4. Analysis of Priority Components

In this study, we introduce a priority components analysis assessment method based on F-AHP. AHP is a theory that deals with non-physical quantitative criterions with suitable alternatives. It is a method which structures the complexity in decision-making with ratio scale analysis. It works in three segments: decomposing the criterions and alternatives, followed by comparative judgments, and lastly prioritization of the criteria. Comparison matrices are formed for priority calculation, which makes decision-making more accurate [19].
The priority components analysis aimed to identify the most important components among the VOCs and list them in the “watch list”, followed by the analysis of characteristics of each component. The main tier analysis focused on the main category of VOCs that need further management in the watch list. The assessment of the compounds is the core step of the F-AHP and the detailed procedure is given in Section 2.4.1, Section 2.4.2 and Section 2.4.3.

2.4.1. Assumption Principles of Estimation

Unfortunately, not all the parameters were available in the existing dataset. Hence, we made some assumptions to give an approximate value for such parameters. The detailed approximate value and the reasons for the assumptions are given in Supplementary Materials.

2.4.2. Fuzzy Analysis

Fuzzy synthetic evaluation requires information on the relative importance of the parameters. The dataset for health risk and cancer risk was obtained from the Environmental Protection Agency (EPA) Integrated Risk Information System (IRIS), while the LC50mice was obtained from the ECOlogical Structure Activity Relationship (ECOSAR). Unfortunately, the available dataset cannot cover most of the VOCs in this study, and it is impractical to assume the rest. Thus, ECOSAR data on LC50fish was applied to conduct the health assessment. To evaluate the influence of VOCs towards the residues, the priority of the dataset choice was as follows: reference concentrations (RfC) > LC50mice > LC50fish, which means that if the data of higher priority was available, the given data set was chosen to evaluate the fuzzy score. From this point of view, the priority of the setting was in the consideration of mice, as mammals are more similar to humans than fish.
RfC setting: In general, when the RfC is larger than one, it could be seen as an existing cancer risk. In our research, the score of RfC was set at five different levels corresponding to the IUR equal to one of the target components within series of concentrations of 0.1, 1, 10, 100, and 1000 mg/m3.
LC50fish setting: In our research, the score of LC50fish was set at five different levels corresponding to five orders of magnitude.
MIR setting: The ozone restraints in the ambient air quality standard (GB3095-2012) were classified in two levels. The first level corresponds to an ozone concentration lower than 100 mg/m3 and the second level corresponds to an ozone concentration lower than 160 mg/m3. Considering the need for a five-score category for assessing the OFP of VOCs, the limitations of ozone concentration in the standard are not suitable for our fuzzy. Thus, we classified the MIR value in five categories corresponding to the score one to five.
The settings for odor threshold, VOCs concentration, detection frequency, saturated vapor pressure, LC50mice, and MIR were based on technical guidance (Federation, 2021) (in China) [30] and are listed in Table 2.

2.4.3. Analytic Hierarchy Process Analysis

(1)
Priority matrix
The relative importance is established by a set of preference weights, which can be normalized to a sum of one. This technique has been used for calculating the weights for different attributes in decision-making systems, such as water quality evaluation and building assessment [19,20]. The relative importance of different factors was assigned using the intensity of importance as given in Table 3. In our study, we used the quotient of the score of different parameters to distinguish the intensity of importance. Notably, when the quotient is less than 1, the intensity of importance changes to the reciprocal of the intensity of importance of Sj/Si.
(2)
Importance matrix J
An importance matrix J was established, where each element Jmn in the upper triangular matrix expresses the importance intensity of an attribute m with respect to another attribute n, in which we used the quotient of the intensity of importance of each pair of parameters to evaluate (Equation (4)). Each element in the lower triangle of the matrix is the reciprocal of the upper triangle, i.e., Jnm = 1/Jmn. AHP was a method influenced by the experts’ opinions because the weight for indicators was determined based on the experts’ scoring [24]. The consistency ratio (CR) was applied to test whether the experts’ scores were reliable or not. Usually, when the CR is larger than 0.1, the scores need to be re-evaluated [31]. In the present study, we tried to eliminate the subjective bias by comparing the quotients of each parameter as shown in Table 3.
J n × n = C 11 C 1 n C n 1 C n n
(3)
Weigh
The geometric means of each row were calculated and then the weighted vector W = [w1, w2, w3,…, wn] was derived by normalization of the result.
(4)
Scoring
The total score of each VOC was calculated using Equation (5):
S i = w 1 r 1 j + w 2 r 2 j + + w n r i j
r i j was the score of parameter i of VOCj.

2.4.4. Evaluation

In the aim of estimating the character VOCs in the stack gas, the scoring results are listed in descending order. The top 10 VOCs were chosen to give detailed discussion.

3. Results and Discussion

3.1. VOCs Characteristics

In this study, we measured 102 VOCs species in total, including 23 alkane, 10 alkene, 4 cycloalkane, 22 aromatic, 29 halohydrocarbon, 13 O-VOCs, and one sulfur-contained VOC (S-VOC). The average, standard deviation, median, and max total VOCs concentration of stack gas was 5331.2, 4947.1, 3686.4, and 18,752.6 μg/m3, respectively. The total VOCs concentration of the thermal sludge drying process of the two co-processing cement plants ranged from 3.04 to 2.77 × 10³ μg/m3, which was one order smaller than our result [5]. The cement industry is a typical fossil fuel combustion industry, and comparing the total VOCs from the coking industry (63.8 to 9563.9 μg/m3) [32] and a coal-fired power plant (13,456 ± 47 μg/m3) [33], the VOCs emission intensity of the co-processing cement kiln was relatively lower than the coking industry and the coal-fired power plant. China’s industrial VOCs emissions were 15.72 Tg in 2019, of which the chemical industry, industrial painting, the petroleum industry, the coal-coking industry, and other industries accounted for 31.0%, 23.9%, 15.6%, 13.0%, and 16.3%, respectively [34]. Based on the average total VOCs concentration in our research and annual cement production of 2019, once the co-processing cement kilns reach 100% in China, the total VOCs emission will be 0.0032 Tg, which makes up 0.02% of the total industry VOCs emission.
As shown in Figure 1, aromatic VOCs had the highest concentration, which was 36.6% of the total VOCs, following O-VOCs, halohydrocarbon, alkene, alkane, cycloalkanes, and S-VOCs, which were 30.3%, 12.0%, 11.9%, 7.1%, 1.2%, and 0.8%, respectively. Aromatics were dominated by a strong presence of benzene and naphthalene, which contributed 73.0% and 11.4%to the aromatics with an average concentration of 1622.0 ± 1354.1 μg/m3 and 235.4 ± 504.4 μg/m3, respectively. Acrolein and acetone contributed 60.1% and 31.8 to the O-VOCs with an average concentration of 1105.5 ± 1143.6 μg/m3, and 584.2 ± 720.1 μg/m3, respectively. Chloromethane and methyl bromide contributed 68.2% and 15.7% to the halohydrocarbon with an average concentration of 483.5 ± 348.2 μg/m3 and 114.9 ± 119.62 μg/m3, respectively. Propene and 1-butene contributed 44.9% and 15.2%to the alkene with an average concentration of 323.2 ± 323.5 μg/m3 and 109.5 ± 121.8 μg/m3, respectively. The concentrations of alkane, cycloalkane, and S-VOCs were lower than other VOCs.
Industry has been an important aromatics emission source. Aromatics (39.7%) and O-VOCs (29.9%) accounted for a relatively high proportion in the synthetic resin industry [35]. Toluene, m/p-xylene, and ethylbenzene are the most abundant compounds in coating processes [36]. In the coal-fired power plant, the VOCs are mainly aliphatic hydrocarbons (57.9%), aromatics (26.8%), and halohydrocarbon (14.5%) [33]. García-Gusano calculated the emission factors of benzene from different fossil fuels, with 6.50 × 10⁻⁷ kg/kg Petcoke, 6.50 × 10⁻⁷ kg/kg hard coal, and 2.670 × 10⁻⁸ kg/kg heavy fuel oil [11]. Considering the fuel consumption rate of the cement plant in our study, with annual 18,913 t hard coal consumption, 5322.2 h running time, and 254,805 m3/h gas flow rate, the average benzene concentration based on García-Gusano’s emission factor was 9.06 μg/m3, which was smaller than our observation. Thus, the fossil fuel was not the only source of benzene generation in the co-processing cement kiln and the fossil fuel combustion was not the only VOCs source in the co-processing cement kiln.
VOCs emission was influenced by various aspects, such as combustion, moisture, ash, fuel, and raw materials. Combustion in a cement kiln is a highly complex transient, multi-dimensional, and multiphase reacting flow phenomenon with significant velocity, temperature, and concentration inhomogeneity. According to Asamany et al. (2017) [6], increased moisture content generally results in more residual VOC emission. The presence of moisture reduces the combustion efficiency of the fuel by the loss of heat to vaporization. The higher the ash content, the lower the energy content of a given mass, and this will result in reduction of the energy available for thermal degradation. VOCs are related to both the fuel and quality of the combustion process. Different types of fuel will generate different VOCs and incomplete combustion of organic materials will lead to more VOCs emission in the cement kiln [37,38]. Meanwhile, the complex components of raw materials may further affect the VOCs in the stack gas of the co-processing cement kiln [6]. This may explain the high standard deviation in our result. Also, evidence shows that the ratio of VOCs categories varies from different cement plants. Xue et al. [5] investigated two co-processing cement kilns and the main VOCs of one cement kiln were O-VOCs (36.40%), S-VOCs (20.37%), N-VOCs (14.88%), and aromatic (14.37%), while the main VOCs of the other cement kiln were aromatic (68.06%) and halohydrocarbon (15.80%) [5]. The fuel and raw materials of the two co-processing cement kilns were different, and their character of VOCs emission had great discrepancy. Also, in Xue et al.’s research [5], they were focusing on the odor components and added S-VOCs and N-VOCs in their analysis method.
Although the total VOCs contribution of the co-processing cement kiln was negligible, its impact towards ambient air quality still requires consideration because the concentration of aromatics and O-VOCs are still high in the co-processing cement kiln emission. Contributions of aromatics and O-VOCs from the co-processing cement kiln towards ambient air quality should not be neglected, because they frequently appear as the most abundant VOC group in recent investigations in China [39]. Moreover, the high emission concentrations of benzene and acrolein still have a negative impact on many aspects, as discussed in Section 3.2, Section 3.3 and Section 3.4.

3.2. Ozone Formation Potential of the Stack Gas

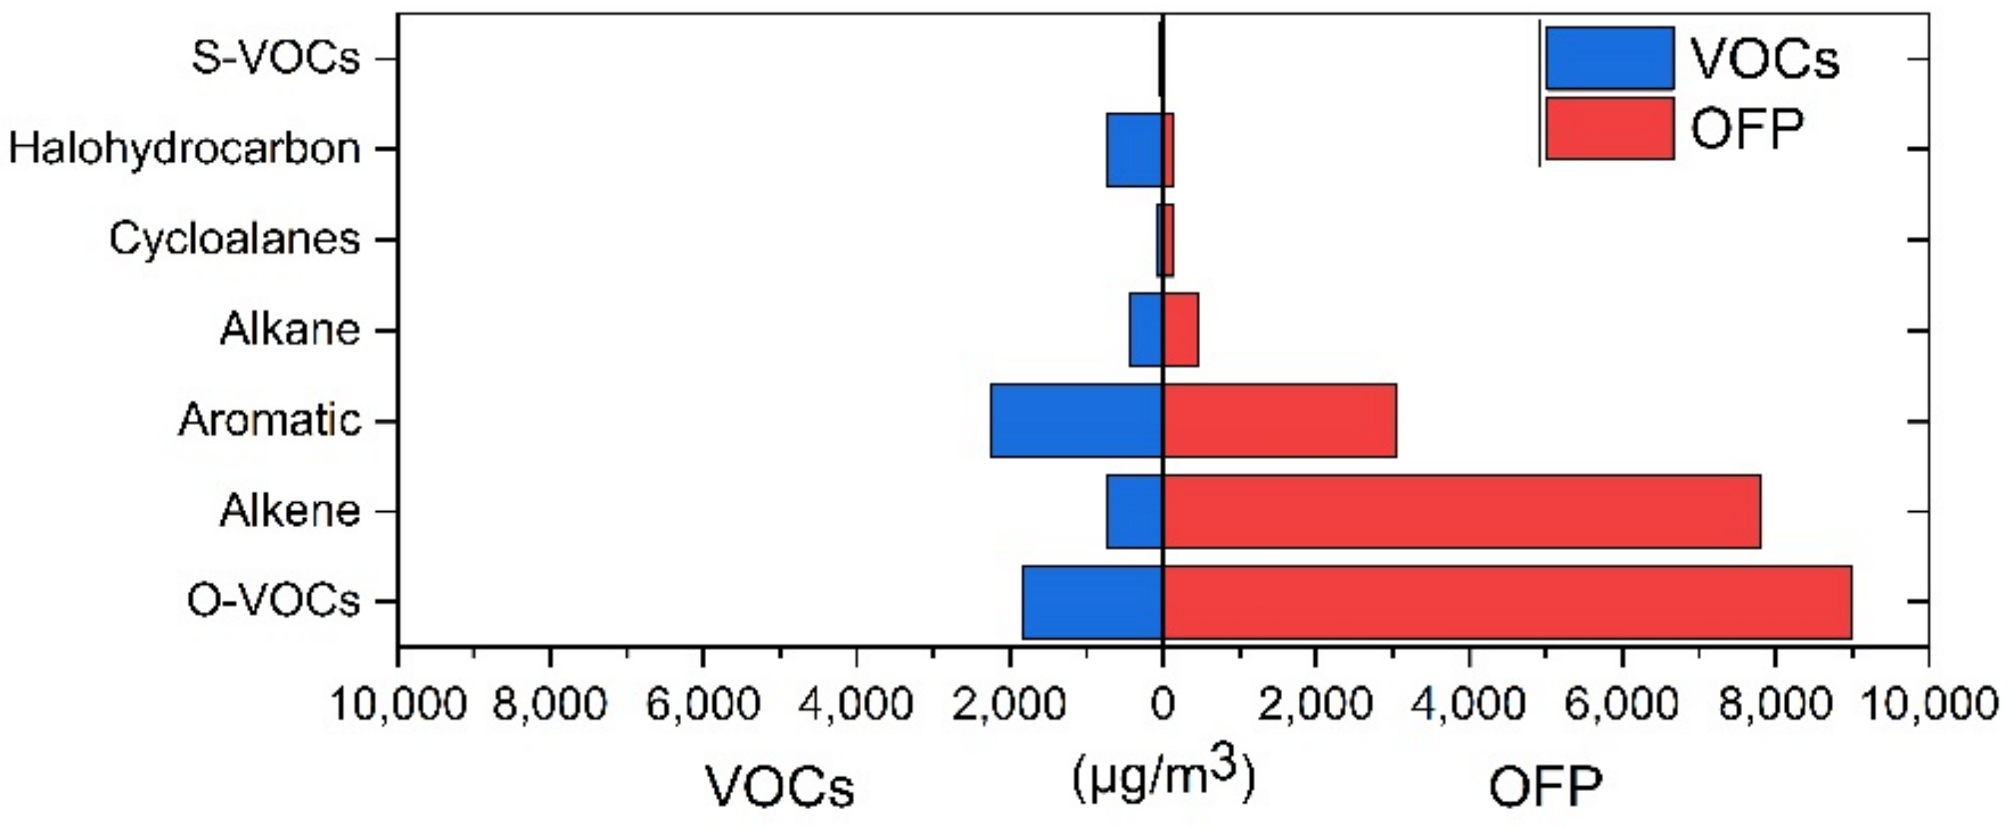
OFP contributions of different VOCs categories of the stack gas of co-processing cement kiln were different than their concentrations. As shown in Figure 2, the OFP of different categories of VOCs were as follows: O-VOCs (43.7%) > Alkene (38.0%) > Aromatic (14.8%) > Alkane (2.2%) > Cycloalkanes (<1%) > Halohydrocarbon (<1%) > Sulfur contained VOCs (S-VOCs) (<1%), due to the difference in the MIR of different categories. The total OFP was 20,540.4 ± 22,904.9 μg/m3, which was much higher than the first and second levels of eight hours average ozone concentration limitations in the Ambient Air Quality Standard (GB 3095-2012) [40], which were 100 and 160 μg/m3. To transform the stationary emission to ambient concentration, diffusion models could be applied in future studies.
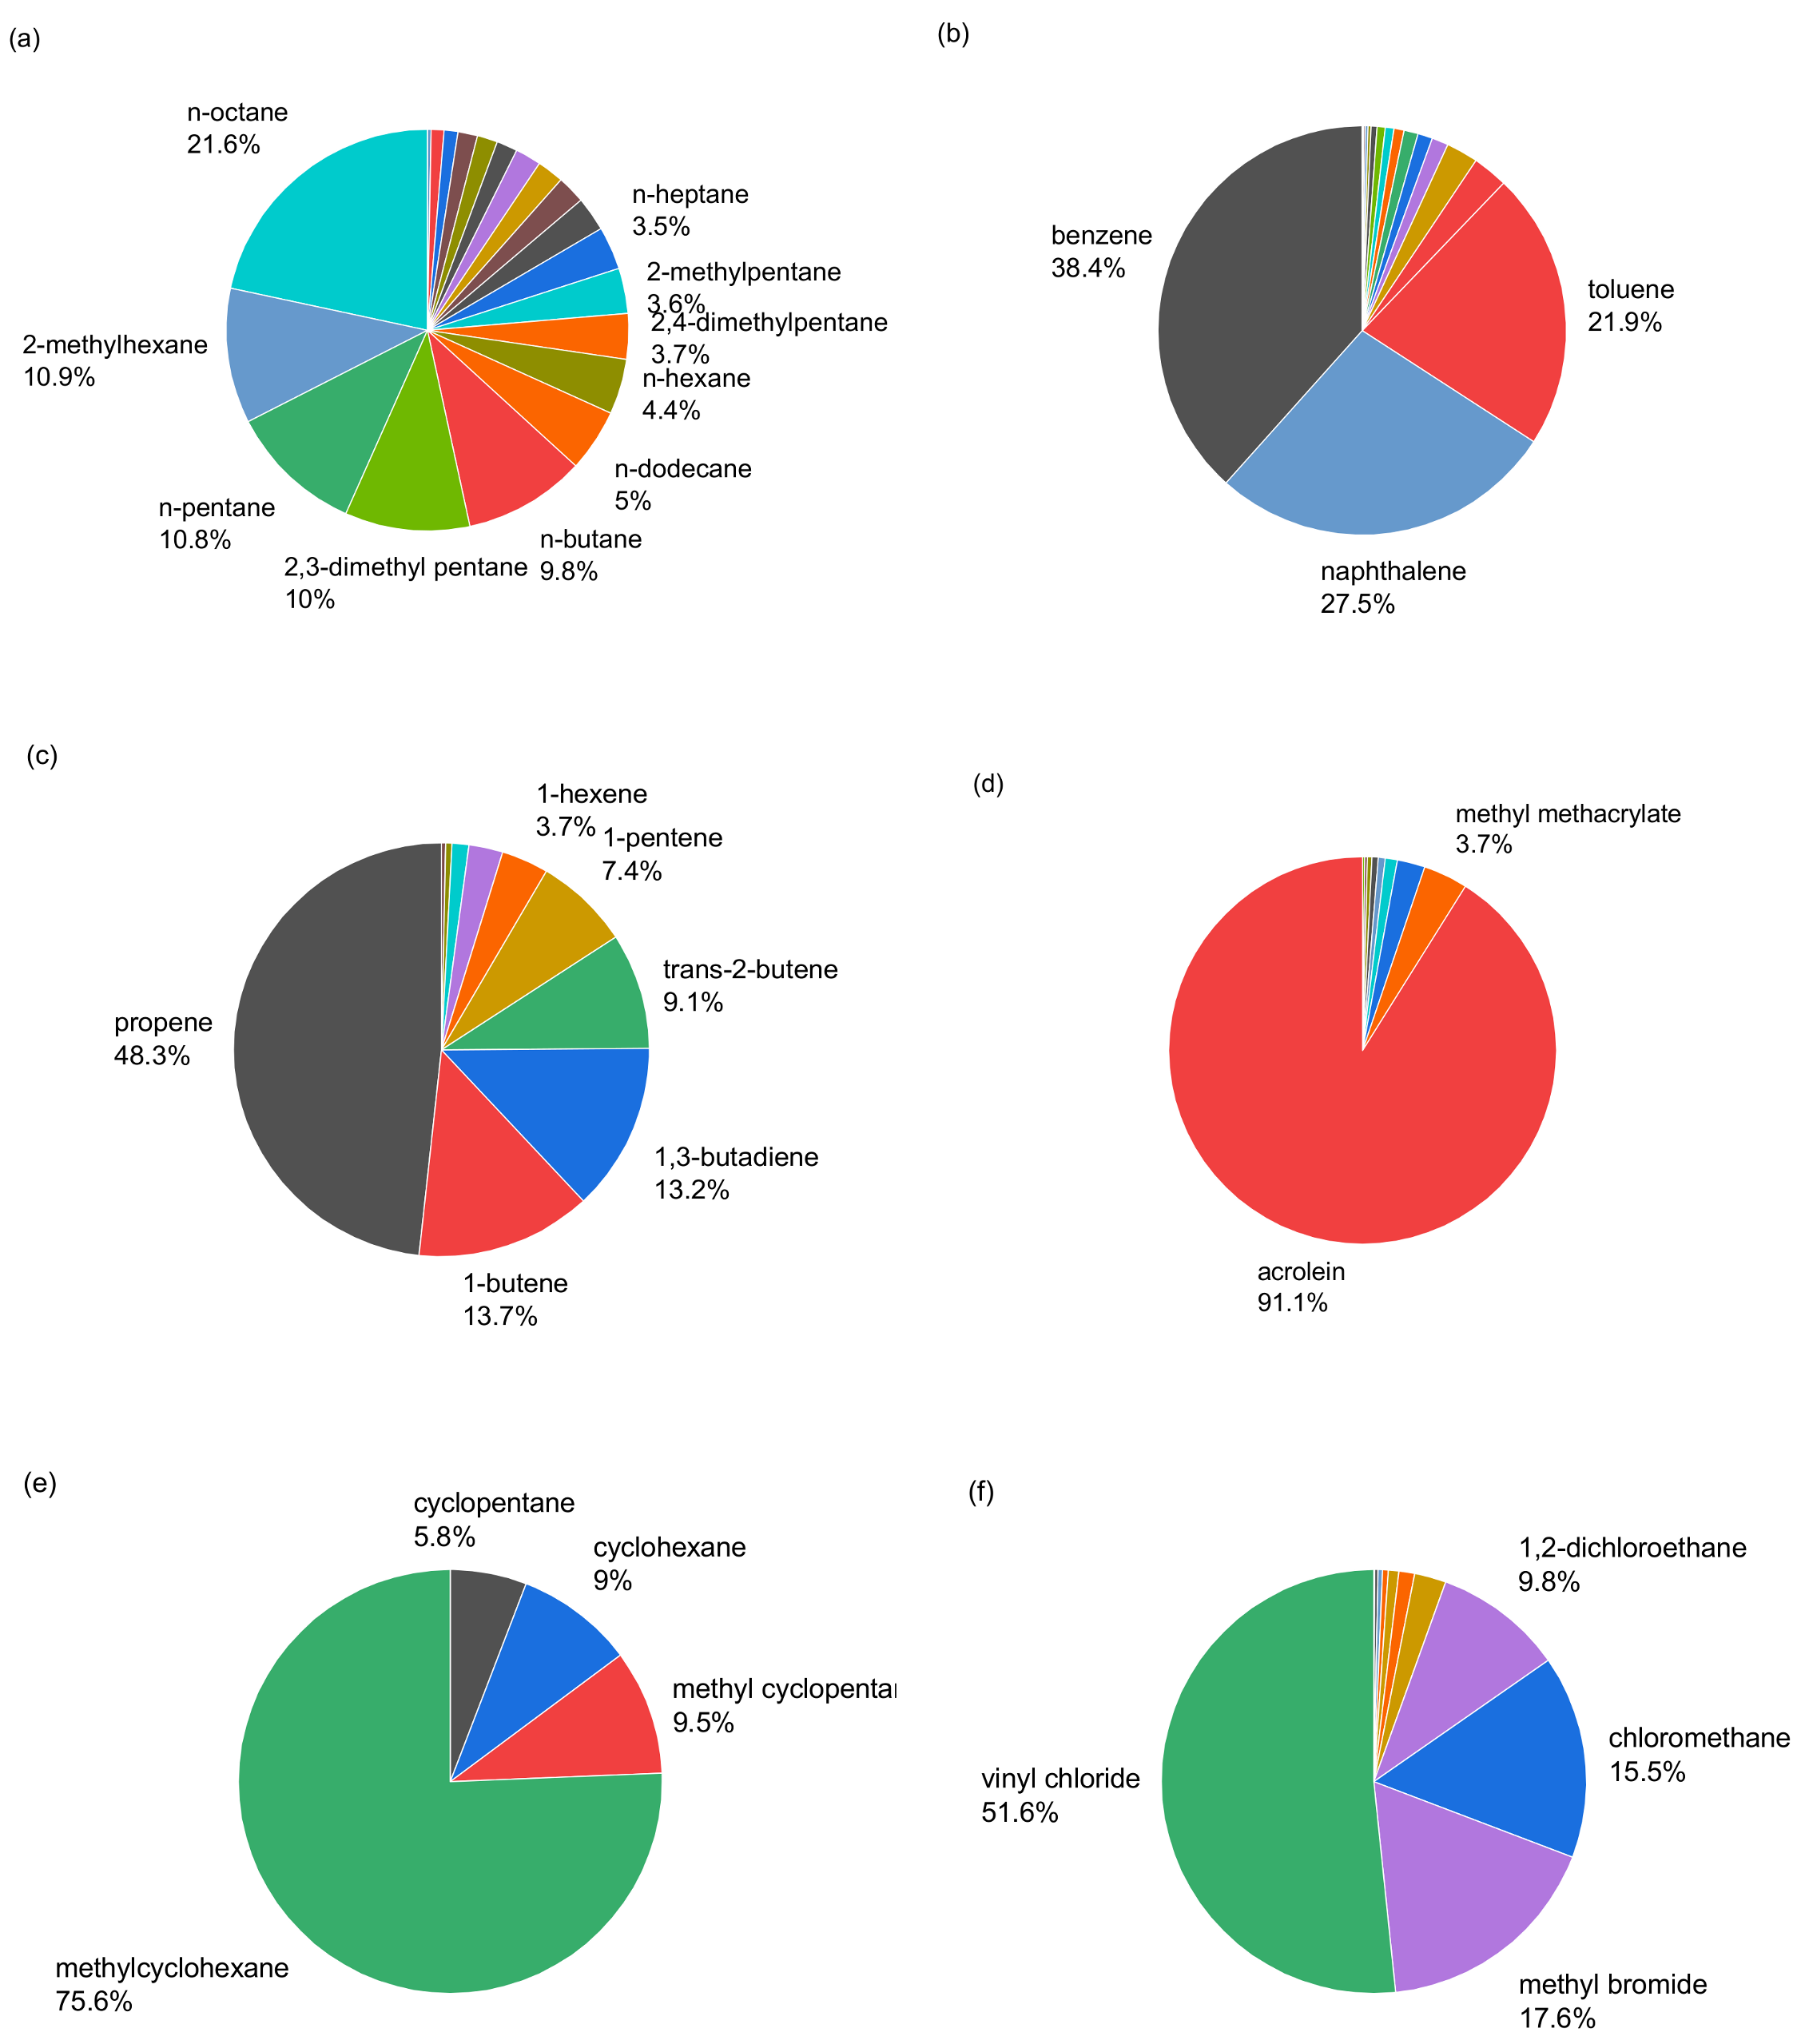
As shown in Figure 3, for O-VOCs, acrolein took 91.1% of the OFP from O-VOCs, whose OFP was 8325.63 ± 10,009.75 μg/m3. Isobutane was the main component of alkene, which took 48.3% of it. For aromatic, the distribution of its OFP was even greater, with benzene, naphthalene, and toluene taking 38.4%, 27.5%, and 21.9%, respectively. The total OFP of alkane, cycloalkane, halohydrocarbon, and S-VOCs were relatively small and these categories of VOCs shared low contribution to the total OFP.
Toluene, methanol, ethanol, and m/p-xylene were the dominant VOCs which had high OFPs in the stack gas of the chemical synthesis pharmaceutical industry [41]. Toluene, benzene, styrene, propylene, ethylene, and O-VOCs (including 1,4-dioxane, methyl isobutyl ketone, and aldehyde) were the main VOCs of OFP from the synthetic resin industry stack gas [35]. Aromatic contributed the highest ozone formation (46.4%) in the stack gas of a coal-fired power plant [33]. The OFP of the co-processing cement kiln, whose main contributors were O-VOCs and alkene, was much different compared to other industries. Liu et al. [42] investigated the ambient VOCs concentrations for four seasons in 2016 in Beijing and found that O-VOCs contributed 31.0% of the total OFP, following alkene (30.4%) and aromatic (28.0%) [42]. The top three VOCs categories of our result are similar to Liu’s research. Thus, the co-processing cement kiln might be a potential source of ozone pollution in Beijing.
Generally, the co-processing cement kiln was a potential source of ozone pollution toward ambient air. Considering the average NOx concentration of stack gas was relatively high, which can exacerbate the generation of ozone, in order to decrease the ozone pollution from cement production, the emission of O-VOCs, alkene, and NOx needs be reduced.

3.3. Main Odor Components

The odor components from raw materials cannot be totally consumed by the cement kiln and will remain in the stack gas. Therefore, we evaluated the OAV of the 102 VOCs in our research with the aim of identifying whether there are still residual odor components in the stack gas or not. Our results show that the TOAV of 102 VOCs in our research was 125.39 ± 151.48. Acrolein was the main odor pollutant whose OAV was 122.69 ± 149.12, which contributed 97% of the TOAV.
In the waste transfer station, the key odorants included propionaldehyde, hexanaldehyde, propionic acid, acetaldehyde, and diisopropyl ether [43]. For a waste landfilling and composting site, the priority odor pollutants were alkanes, O-VOCs, S-VOCs, aromatics, and halogenated compounds [44]. According to the results of Xue et al. [5], methyl sulfide and H2S were the dominant compounds causing odor from another co-processing cement kiln, with odor contributions of 18.30% and 17.70%, respectively. The odor emission of a sludge treatment using anaerobic digestion with thermal hydrolysis pre-treatment was mainly contributed by NH3 and volatile sulfur compounds [45]. The stack gas may share the same odor components of sludge since the co-processing cement plant used sludge as an alternative fuel.
Generally, acrolein was the main odor contributor in the stack gas of the co-processing cement kiln. The effects of NH3 and volatile sulfur compounds cannot be ignored. O-VOCs, S-VOCs, and nitrogen-contained VOCs (N-VOCs) are considered as the odor pollutants in the waste gas in other researches.

3.4. Priority Components of VOCs in a Co-Processing Cement Kiln

The F-AHP method was used to try to identify the priority VOCs among the investigated compounds. With the help of F-AHP, we could determine which compound need to be managed first and which parameter is the essential parameter that should be considered. The scores of VOCs in our test were evaluated and the significance of different parameters could be visualized via score weight (Figure 4). In our calculation method, the theoretic highest score is five. Thus, tier one to five was identified by the final score as lower than five, lower than four, lower than three, lower than two, and lower than one. VOCs whose score is in tiers one and two are worth watching. There were two VOCs in tier one, nine VOCs in tier two, 44 VOCs in tier three, 47 VOCs in tier four, and zero VOCs in tier five. The top two tiers were highlighted in the “watch list”.
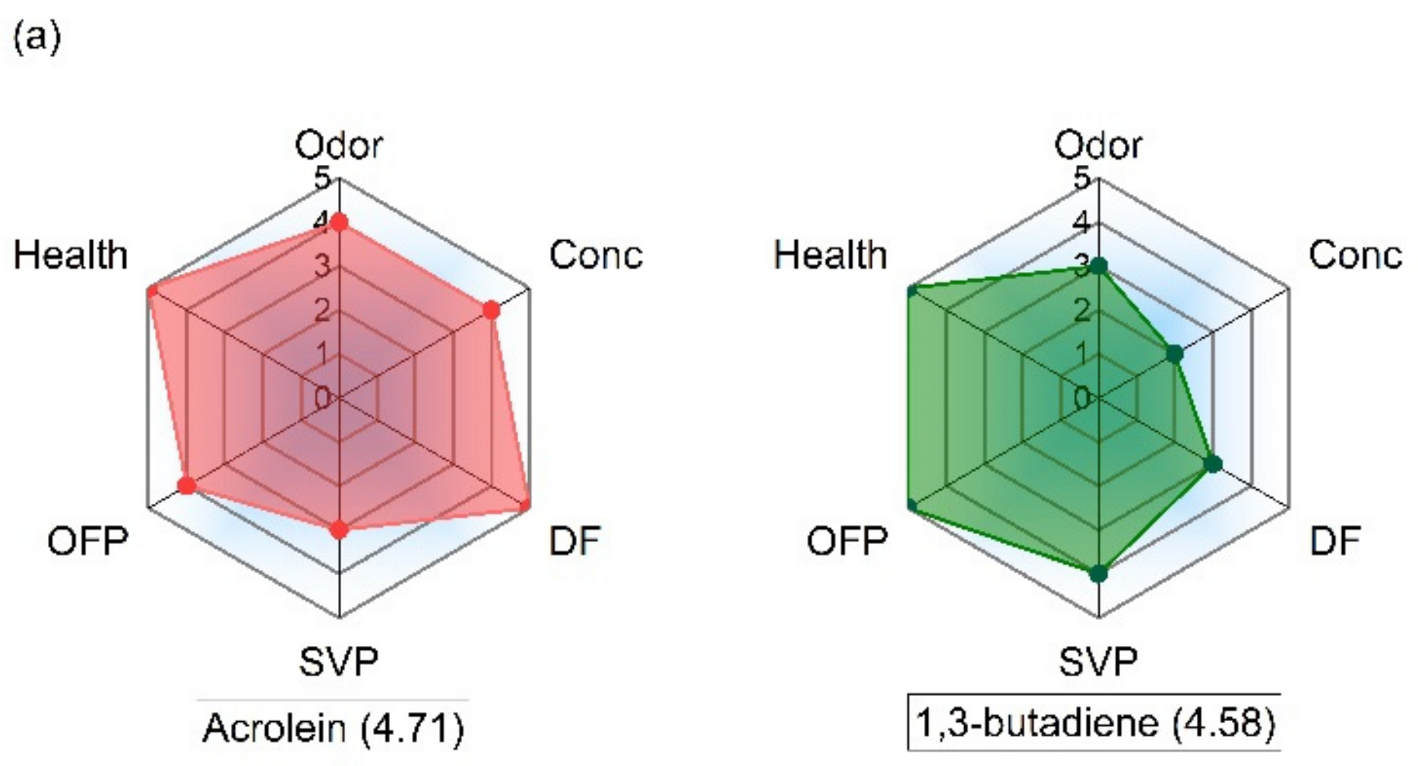
We defined tier one as the worthiest watching category. Acrolein, with the score of 4.71, was the most hazardous VOC in the cement kiln stack gas (Figure 4a). Acrolein was outstanding due to its high health, odor, concentration, detection frequency, and OFP performance. The detailed information of these parameters was given in the previous sections. However, 1,3-butadiene seems to be a new star according to our evaluation, with a score of 4.58 (Figure 4a). The importance of 1,3-butadiene was veiled by the relatively low concentration and detection frequency. Thus, due to the negative impact of 1,3-butadiene on health, the OFP should not be neglected.
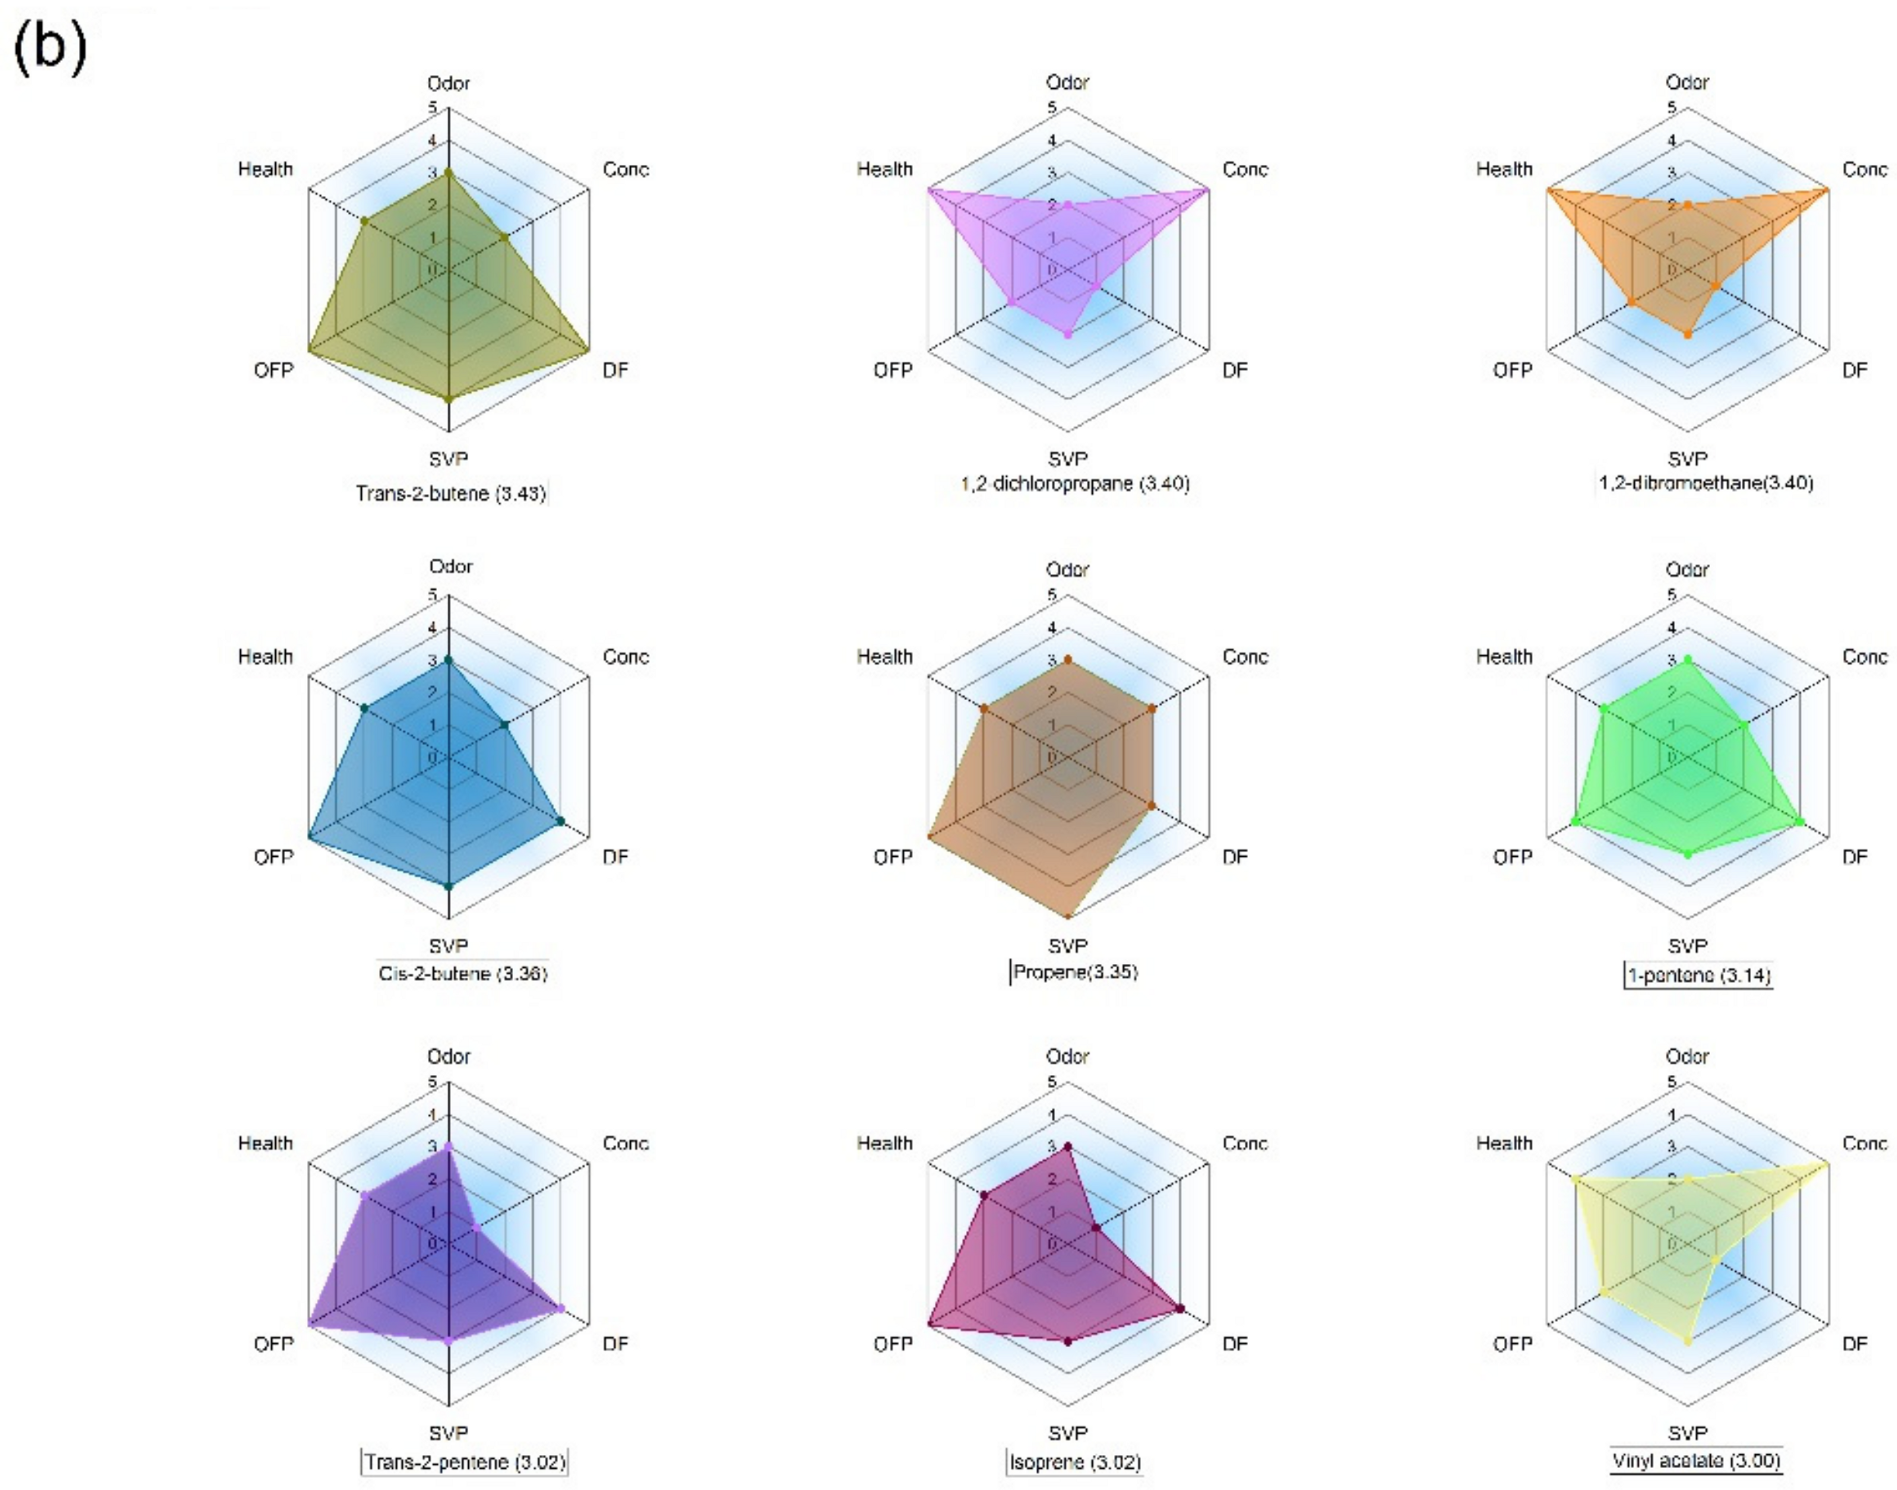
Nine VOCs were in tier two, namely trans-2-butane (3.43), 1,2-dichloropropane (3.40), 1,2-dibromoethane (3.40), cis-2-butene (3.36), propene (3.35), 1-pentene (3.14), trans-2-pentene (3.02), isoprene (3.02), and vinyl acetate (3.00) (Figure 4b). The reason for the same scores may be due to their similar characteristics. The difference of 2-dichloropropane and 1,2-dibromoethane is their substituent, and the characteristics of chloride and bromide are very similar. Trans-2-pentene and isoprene are isomerides. The generation process of these compounds in the cement kiln stack gas may be similar, therefore they had similar detection frequency and concentrations. Detailed evaluation on the effect of compounds toward different parameters were given in the previous sections.
F-AHP analysis may miss part of the raw information due to the characteristics of F-AHP analysis. Comprehensive scores, which were estimated through the weighted sum of the score of several factors, such as chemical concentration, threshold value, detection frequency, toxicity, and saturated vapor pressure, evaluate the primary odor compounds in the waste gas from the municipal solid waste transfer station [18], waste landfilling and composting [44], and sewers [17]. In the case of water quality evaluation, Sarkar et al. chose the standard or permissible values of the selected parameters, such as dissolved oxygen, concentration chlorides, chemical oxygen demand, turbidity, pH, total dissolved solids, and total hardness to form their AHP matrix [19]. Although the score based on standard or permissible values was more accurate, we must classify all the parameters in our own way, because there were no constraints for most of the VOCs. Thus, the emission limitations of VOCs should be considered by the administrative department for the delicate management of air quality.
Except vinyl acetate, the other eight VOCs in tier two were all alkene. 2-dichloropropane and 1,2-dibromoethane shared the same score, while trans-2-pentene and isoprene had the same score. Among tier one, nine of eleven compounds in our watch list were alkene, while the remaining two VOCs were O-VOCs. Alkene was the priority VOCs category because the comprehensive score of alkenes were higher. Thus, alkene was the priority category of VOCs in cement kiln stack gas and acrolein was the most significant compound.
In tier three, the scores of naphthalene, trans-1,2-michloroethylene, and benzene were 2.93, 2.84, and 2.83, respectively. Although these compounds were not listed in tier one and tier two, they still have the potential to jump into a higher tier once other characteristics of VOCs are taken into consideration. We excluded secondary aerosol formation potential (SOAp) in our research because the dataset of the SOAp was narrow and only a few VOCs were listed in it, which does not allow us to make valid assumptions to evaluate the gap. The SOAp of aromatics is much higher than other VOCs. The score of benzene and naphthalene may jump into tier 2 after including the SOAp in AHP analysis.
In some studies, F-AHP could evaluate the ambient air quality of surrounding emission sources by taking five air pollutant parameters (SO2, NO2, O3, CO, and PM10) and three subjective parameters (population sensitivity, population density, and location sensitivity) into consideration [25]. The pollutant index and exposure index were determined, and the results were multiplied using an aggregation model to evaluate the risk. In an earlier study, the environment risk around a refinery was present with AERMOD [46]. With the help of GIS–AHP, Sahin et al. [47] used the data obtained from Iğdır Weather Monitoring Stations to investigate possible places of air pollution [47]. A combination of F-AHP and AERMOD or GIS may give a unique perspective of VOCs pollution towards ambient air quality.
Generally, acrolein and 1,3-butadiene were the priority VOCs which require more attention. Alkene took more than 80% among tier one and tier two and requires management. The priority component analysis method has potential in the VOCs management decision-making. Once the method is combined with AERMOD or GIS, a visualized ambient air VOCs pollution situation could be presented.

4. Conclusions

In this study, 13 VOCs samples of a co-processing cement kiln stack in Beijing, China, were analyzed. The results of this study can help in understanding the VOCs’ impacts on the ambient air quality. The total VOCs in the co-processing cement kiln gas were relatively less than other industry VOCs emissions. The study shows that aromatic (36.6%) and O-VOCs (30.3%) are the most abundant VOCs, with the high average concentration of benzene (1622.0 μg/m3) and acrolein (1105.5 μg/m3). Acrolein, propene, benzene, 1-butane, and 1,3-butadiene are the dominate OFP compounds, with the corresponding average OFP concentration of 8325.6, 3768.2, 1167.9, 1065.9, and 1027.2 μg/m3, respectively. F-AHP is a useful method to screen the principal compounds among a group of VOCs. From our observation, alkene is the most significant pollutant in the watch list due to its high performance among all the parameters. Other parameters can be added in the dataset to give a more comprehensive evaluation of the VOCs pollutants. Also, a combination of other useful tools in future research may result in a better understanding of the VOCs pollution from co-processing cement kilns.

Supplementary Materials

The following supporting information can be downloaded at: https://www.mdpi.com/article/10.3390/atmos13121952/s1, Table S1: Database and assumptions; Method: Assumption Principles of Estimation.

Author Contributions

Conceptualization, C.S. and G.L. (Guoao Li); methodology, Y.Y.; validation, B.J., Y.W. and H.B.; formal analysis, G.L. (Guohao Li); investigation, X.J. and Z.W.; resources, L.N.; data curation, X.J.; writing—original draft preparation, Y.Y.; writing—review and editing, C.S.; visualization, X.C.; supervision, L.N.; funding acquisition, G.L. (Guoao Li) All authors have read and agreed to the published version of the manuscript.

Funding

This research was funded by [National Key Research and Development Program of China] grant number [2019YFC1806105] and The APC was funded by [National Key Research and Development Program of China].

Institutional Review Board Statement

Not applicable.

Informed Consent Statement

Not applicable.

Data Availability Statement

Not applicable.

Conflicts of Interest

The authors declare no conflict of interest.

References

  1. Ahmed, M.; Bashar, I.; Alam, S.T.; Wasi, A.I.; Jerin, I.; Khatun, S.; Rahman, M. An overview of Asian cement industry: Environmental impacts, research methodologies and mitigation measures. Sustain. Prod. Consum. 2021, 28, 1018–1039. [Google Scholar] [CrossRef]
  2. Mohamad, N.; Muthusamy, K.; Embong, R.; Kusbiantoro, A.; Hashim, M.H. Environmental impact of cement production and Solutions: A review. Mater. Today Proc. 2021, 48, 741–746. [Google Scholar] [CrossRef]
  3. Rodríguez, N.H.; Martínez-Ramírez, S.; Blanco-Varela, M.T.; Donatello, S.; Guillem, M.; Puig, J.; Fos, C.; Larrotcha, E.; Flores, J. The effect of using thermally dried sewage sludge as an alternative fuel on Portland cement clinker production. J. Clean. Prod. 2013, 52, 94–102. [Google Scholar] [CrossRef]
  4. Lv, D.; Zhu, T.; Liu, R.; Lv, Q.; Sun, Y.; Wang, H.; Liu, Y.; Zhang, F. Effects of co-processing sewage sludge in cement kiln on NOx, NH3 and PAHs emissions. Chemosphere 2016, 159, 595–601. [Google Scholar] [CrossRef]
  5. Xue, S.; Ding, W.; Li, L.; Ma, J.; Chai, F.; Liu, J. Emission, dispersion, and potential risk of volatile organic and odorous compounds in the exhaust gas from two sludge thermal drying processes. Waste Manag. 2021, 138, 116–124. [Google Scholar] [CrossRef]
  6. Asamany, E.A.; Gibson, M.D.; Pegg, M.J. Evaluating the potential of waste plastics as fuel in cement kilns using bench-scale emissions analysis. Fuel 2017, 193, 178–186. [Google Scholar] [CrossRef]
  7. Ghouleh, Z.; Shao, Y. Turning municipal solid waste incineration into a cleaner cement production. J. Clean. Prod. 2018, 195, 268–279. [Google Scholar] [CrossRef]
  8. Zhang, S.; Ghouleh, Z.; Shao, Y. Green concrete made from MSWI residues derived eco-cement and bottom ash aggregates. Constr. Build. Mater. 2021, 297, 123818. [Google Scholar] [CrossRef]
  9. Liang, T.; Yang, F.; Ding, A.; Li, F. Cement kiln co-processing promotes the redevelopment of industrially contaminated land in China: Spatio-temporal features and efficiency analysis. Sci. Total Environ. 2022, 817, 152788. [Google Scholar] [CrossRef]
  10. Beketie, K.T.; Angessa, A.T.; Zeleke, T.T.; Ayal, D.Y. Impact of cement factory emission on air quality and human health around Mugher and the surrounding villages, Central Ethiopia. Air Qual. Atmos. Health 2021, 15, 347–361. [Google Scholar] [CrossRef]
  11. García-Gusano, D.; Herrera, I.; Garraín, D.; Lechón, Y.; Cabal, H. Life cycle assessment of the Spanish cement industry: Implementation of environmental-friendly solutions. Clean Technol. Environ. Policy 2014, 17, 59–73. [Google Scholar] [CrossRef]
  12. Directive 2010/75/EU of the European Parliament and the Council on Industrial Emissions. Available online: https://www.legislation.gov.uk/eudr/2010/75/contents (accessed on 1 November 2022).
  13. MEE, China. Emission Standard of Air Pollutants for Cement Industry (GB 4915-2013). Available online: https://www.mee.gov.cn/ywgz/fgbz/bz/bzwb/dqhjbh/dqgdwrywrwpfbz/201312/t20131227_265765.shtml (accessed on 1 November 2022).
  14. Li, Y.; Zhang, J.; Miao, W.; Wang, H.; Wei, M. Disposal of historically contaminated soil in the cement industry and the evaluation of environmental performance. Chemosphere 2015, 134, 279–285. [Google Scholar] [CrossRef] [PubMed]
  15. Zhao, X.; Ma, H.; Lu, J.; Yin, T.; Zhang, S.; Zhang, Q.; Dong, X.; Shuai, Q.; Wei, T.; Gong, X. Characteristics and source apportionment of volatile organic compounds during the remediation of contaminated sites in Zhenjiang, China. Int. J. Environ. Sci. Technol. 2020, 18, 2271–2282. [Google Scholar] [CrossRef]
  16. Saaty, T.L. The Analytic Hierarchy Process; McGraw-Hill: New York, NY, USA, 1980. [Google Scholar]
  17. Sivret, E.C.; Wang, B.; Parcsi, G.; Stuetz, R.M. Prioritisation of odorants emitted from sewers using odour activity values. Water Res. 2016, 88, 308–321. [Google Scholar] [CrossRef] [PubMed]
  18. Sun, Z.; Cheng, Z.; Wang, L.; Lou, Z.; Zhu, N.; Zhou, X.; Feng, L. The typical MSW odorants identification and the spatial odorants distribution in a large-scale transfer station. Environ. Sci. Pollut. Res. 2017, 24, 7705–7713. [Google Scholar] [CrossRef] [PubMed]
  19. Sarkar, K.; Majumder, M. Application of AHP-based water quality index for quality monitoring of peri-urban watershed. Environ. Dev. Sustain. 2020, 23, 1780–1798. [Google Scholar] [CrossRef]
  20. Chabok, M.; Asakereh, A.; Bahrami, H.; Jaafarzadeh, N.O. Selection of MSW landfill site by fuzzy-AHP approach combined with GIS: Case study in Ahvaz, Iran. Environ. Monit. Assess. 2020, 192, 433. [Google Scholar] [CrossRef]
  21. Ramya, S.; Devadas, V. Integration of GIS, AHP and TOPSIS in evaluating suitable locations for industrial development: A case of Tehri Garhwal district, Uttarakhand, India. J. Clean. Prod. 2019, 238, 117872.1–117872.14. [Google Scholar] [CrossRef]
  22. Şener, E.; Karagüzel, R. Solid waste disposal site selection with GIS and AHP methodology: A case study in Senirkent–Uluborlu (Isparta) Basin, Turkey. Environ. Monit. Assess. 2010, 173, 533–554. [Google Scholar] [CrossRef]
  23. Putra, M.A.; Teh, K.C.; Tan, J.; Choong, T.S.Y. Sustainability assessment of Indonesian cement manufacturing via integrated life cycle assessment and analytical hierarchy process method. Environ. Sci. Pollut. Res. 2020, 27, 29352–29360. [Google Scholar] [CrossRef]
  24. Xue, R.; Wang, C.; Liu, M.; Zhang, D.; Li, K.; Li, N. A new method for soil health assessment based on Analytic Hierarchy Process and meta-analysis. Sci. Total Environ. 2018, 650, 2771–2777. [Google Scholar] [CrossRef] [PubMed]
  25. Gorai, A.K.; Kanchan, U.A.; Tuluri, F.; Goyal, P.; Tchounwou, P.B. An innovative approach for determination of air quality health index. Sci. Total Environ. 2015, 533, 495–505. [Google Scholar] [CrossRef] [PubMed] [Green Version]
  26. Bui, N.T.; Kawamura, A.; Du Bui, D.; Amaguchi, H.; Bui, D.D.; Truong, N.T.; Do, H.H.T.; Nguyen, C.T. Groundwater sustainability assessment framework: A demonstration of environmental sustainability index for Hanoi, Vietnam. J. Environ. Manag. 2019, 241, 479–487. [Google Scholar] [CrossRef] [PubMed]
  27. Carter, W.P.L. Updated Maximum Incremental Reactivity Scale and Hydrocarbon Bin Reactivities for Regulatory Applications. 2010. Available online: https://ww2.arb.ca.gov/sites/default/files/barcu/regact/2009/mir2009/mir10.pdf (accessed on 1 November 2022).
  28. Carter, W.P. Development of the SAPRC-07 chemical mechanism. Atmos. Environ. 2010, 44, 5324–5335. [Google Scholar] [CrossRef]
  29. Nagata, Y. Measurement of Odor Threshold by Triangle Odor Bag Method. Odor Meas. Rev. 2003, 118, 118–127. [Google Scholar]
  30. Federation A-CE. Technical Specification for Identification of Odorous Substances on Pesticide Contaminated Land. T/ACEF. 2021. Available online: http://www.ttbz.org.cn/StandardManage/Detail/54772 (accessed on 1 November 2022).
  31. Pipatprapa, A.; Huang, H.-H.; Huang, C.-H. Enhancing the effectiveness of AHP for environmental performance assessment of Thailand and Taiwan’s food industry. Environ. Monit. Assess. 2018, 190, 748. [Google Scholar] [CrossRef]
  32. Cheng, L.; Wei, W.; Zhang, C.; Xu, X.; Sha, K.; Meng, Q.; Jiang, Y.; Cheng, S. Quantitation study on VOC emissions and their reduction potential for coking industry in China: Based on in-situ measurements on treated and untreated plants. Sci. Total Environ. 2022, 836, 155466. [Google Scholar] [CrossRef]
  33. Xu, J.; Lyu, Y.; Zhuo, J.; Xu, Y.; Zhou, Z.; Yao, Q. Formation and emission characteristics of VOCs from a coal-fired power plant. Chin. J. Chem. Eng. 2021, 35, 256–264. [Google Scholar] [CrossRef]
  34. Simayi, M.; Shi, Y.; Xi, Z.; Ren, J.; Hini, G.; Xie, S. Emission trends of industrial VOCs in China since the clean air action and future reduction perspectives. Sci. Total Environ. 2022, 826, 153994. [Google Scholar] [CrossRef]
  35. Ma, Y.; Fu, S.; Gao, S.; Zhang, S.; Che, X.; Wang, Q.; Jiao, Z. Update on volatile organic compound (VOC) source profiles and ozone formation potential in synthetic resins industry in China. Environ. Pollut. 2021, 291, 118253. [Google Scholar] [CrossRef]
  36. Mo, Z.; Lu, S.; Shao, M. Volatile organic compound (VOC) emissions and health risk assessment in paint and coatings industry in the Yangtze River Delta, China. Environ. Pollut. 2020, 269, 115740. [Google Scholar] [CrossRef] [PubMed]
  37. Ariyaratne, W.; Melaaen, M.; Tokheim, L. The effect of alternative fuel combustion in the cement kiln main burner on production capacity and improvement with oxygen enrichment. World Acad. Sci. Eng. Technol. 2013, 76, 557–563. [Google Scholar]
  38. Giannopoulos, D.; Kolaitis, D.I.; Togkalidou, A.; Skevis, G.; Founti, M.A. Quantification of emissions from the co-incineration of cutting oil emulsions in cement plants—Part I: NOx, CO and VOC. Fuel 2006, 86, 1144–1152. [Google Scholar] [CrossRef]
  39. Mozaffar, A.; Zhang, Y.-L. Atmospheric Volatile Organic Compounds (VOCs) in China: A Review. Curr. Pollut. Rep. 2020, 6, 250–263. [Google Scholar] [CrossRef]
  40. MEE, China. Ambient Air Quality Standards (GB 3095-2012). Available online: https://www.mee.gov.cn/ywgz/fgbz/bz/bzwb/dqhjbh/dqhjzlbz/201203/t20120302_224165.shtml (accessed on 1 November 2022).
  41. Cheng, N.; Jing, D.; Zhang, C.; Chen, Z.; Li, W.; Li, S.; Wang, Q. Process-based VOCs source profiles and contributions to ozone formation and carcinogenic risk in a typical chemical synthesis pharmaceutical industry in China. Sci. Total. Environ. 2020, 752, 141899. [Google Scholar] [CrossRef] [PubMed]
  42. Liu, Y.; Kong, L.; Liu, X.; Zhang, Y.; Li, C.; Zhang, Y.; Zhang, C.; Qu, Y.; An, J.; Ma, D.; et al. Characteristics, secondary transformation, and health risk assessment of ambient volatile organic compounds (VOCs) in urban Beijing, China. Atmos. Pollut. Res. 2021, 12, 33–46. [Google Scholar] [CrossRef]
  43. Chai, F.; Li, P.; Li, L.; Qiu, Z.; Han, Y.; Yang, K. Dispersion, olfactory effect, and health risks of VOCs and odors in a rural domestic waste transfer station. Environ. Res. 2022, 209, 112879. [Google Scholar] [CrossRef]
  44. Cheng, Z.; Sun, Z.; Zhu, S.; Lou, Z.; Zhu, N.; Feng, L. The identification and health risk assessment of odor emissions from waste landfilling and composting. Sci. Total Environ. 2018, 649, 1038–1044. [Google Scholar] [CrossRef]
  45. Han, Z.; Li, R.; Shen, H.; Qi, F.; Liu, B.; Shen, X.; Zhang, L.; Wang, X.; Sun, D. Emission characteristics and assessment of odors from sludge anaerobic digestion with thermal hydrolysis pretreatment in a wastewater treatment plant. Environ. Pollut. 2021, 274, 116516. [Google Scholar] [CrossRef]
  46. Khan, F.I.; Sadiq, R. Risk-Based Prioritization of Air Pollution Monitoring Using Fuzzy Synthetic Evaluation Technique. Environ. Monit. Assess. 2005, 105, 261–283. [Google Scholar] [CrossRef] [Green Version]
  47. Sahin, F.; Kara, M.K.; Koc, A.; Sahin, G. Multi-criteria decision-making using GIS-AHP for air pollution problem in Igdir Province/Turkey. Environ. Sci. Pollut. Res. 2020, 27, 36215–36230. [Google Scholar] [CrossRef] [PubMed]
Figure 1. VOCs concentration distribution.
Atmosphere 13 01952 g001
Figure 2. Comparison of VOCs concentration and OFP concentration.
Atmosphere 13 01952 g002
Figure 3. OFP of the cement kiln stack gas (a) Alkane; (b) Aromatic; (c) Alkene; (d) O-VOCs; (e) Cycloalkane; (f) Halohydrocarbon.
Atmosphere 13 01952 g003
Figure 4. Comprehensive scores of VOCs (a) Tier 1 (b) Tier 2. (SVP, Conc and DF were the abbreviation of saturated vapor pressure, VOCs concentration, and detection frequency, respectively).
Atmosphere 13 01952 g004aAtmosphere 13 01952 g004b
Table 1. Activity level of the co-processing cement plant.
CalcareousSilica MaterialsIron MaterialsAdmixtureHazard WasteSludgeSoft CoalDiesel
1203.7495.122.5151.373.631.51700.344
The mass unit was kt.
Table 2. Fuzzy scoring.
Score12345
Odor threshold
(mg/m3)
>1001–1000.01–10.0001–0.01<0.0001
VOCs concentration (mg/m3)0–0.010.01–0.10.1–11–10>10
Detection frequency
(%)
0–2020–4040–6060–8080–100
Saturated vapor pressure
(kPa, 25 °C)
0–11–1010–100100–500>500
Health assessmentLC50fish (mg/L)>1000100–100010–1001–100–1
LC50mice (ppm)>10,0005000–10,0001000–5000100–10000–100
RfC (mg/m3)<0.010.01–0.10.1–11–10>10
MIR (g O3/g VOCs)<0.10.1–22–66–10>10
Table 3. Fundamental scale used to develop the priority matrix for AHP.
Intensity of Importance123456789
ExplanationSi/Sj = 11 < Si/Sj < 2Si/Sj = 22 < Si/Sj < 3Si/Sj = 33 < Si/Sj < 4Si/Sj = 44 < Si/Sj < 5Si/Sj = 5
Publisher’s Note: MDPI stays neutral with regard to jurisdictional claims in published maps and institutional affiliations.