1. Introduction
For living things to survive, the air must have a certain quality. For many reasons, air quality deterioration can create air pollution. Air pollution emerged as a result of modern life. The concept of pollution, which is often mentioned in discussions concerning air-related issues, is one that emerged mainly after the industrial revolution and entered our lives with the rapid increases in population, the use of natural resources and urbanization. Air pollution is defined as pollutants that originate from natural or human sources spreading in the atmosphere in the form of dust, gas, odor, smoke and water vapor and thus causing air quality to deteriorate to a degree that harms living organisms [
1,
2,
3].
Air pollutants that threaten human health to a great extent are particulate matter and ozone. Some particulate matter is tiny and has dimensions that enable it to penetrate deep into the lungs and bloodstream [
4]. In the literature, particles with a diameter of less than 2.5 micron are called fine particles and have the possibility of accumulating in the respiratory system [
5]. They can also cause cardiovascular diseases [
6]. Particles with a diameter of less than 10 micron, called PM
10, can cause premature deaths, lung infections, cardiovascular diseases and Alzheimer’s, and concerns about this have increased gradually. Pollutants, such as dust or particulate matter, making up part of the gaseous environment surrounding solids and liquids, are essential because they provide benefits to hygiene and the general climate, regardless of whether their source is natural or artificial [
7]. In order to prevent related diseases, regulations regarding the concentrations of outdoor air pollutants (PM, ozone, sulfur dioxide, nitrogen dioxide) have been implemented in some countries. Particulate matter is the most damaging air pollutant in terms of human health in European countries because it is light enough to float in the air. Particulate matter is classified as PM
2.5 and PM
10 in EU legislation and international legislation [
8].
In recent years, although there have been important developments in air pollution control and measures taken, the PM
10 standard is still exceeded in many places, especially in big cities. PM
10 originates from natural phenomena such as volcanoes, dust and sand storms and forest fires and also from human activities. Particulate matter contains a complex mixture of organic and inorganic carbon, metals (lead, arsenic, mercury, cadmium, chromium, nickel and vanadium), nitrates, sulfates and phosphates [
9].
Due to the harms caused by PM10 in terms of environment and human health, it is necessary to measure the presence of particles in the air continuously and to implement reduction measures when it is above the limit. The purpose of this study is to measure PM10 concentration to evaluate the air quality of the Organized Industrial Zone (OIZ) in Konya, one of the important cities in Turkey, and to make suggestions for increasing the air quality with the results obtained. Konya has the largest surface area of any city in Turkey. The Organized Industrial Zone in Konya is the region where all of Konya’s large-scale factories and business centers are located. So far, no study has recorded the changes in PM10 pollution during the day and investigated the causes of pollution in this region. For this reason, this study will contribute to the literature in terms of understanding the level and causes of air pollution in Konya city and the Konya OIZ.
2. Materials and Methods
PM10 measurements were taken in the Konya OIZ. KOIZ was established on an area of 2300 hectares and approximately 20 km away from the city center. There are manufacturers and retailers of automotive spare parts, casting, agricultural machinery and equipment, machinery, plastic, construction, packaging, food, metal, trailer and tipper, furniture, wood products, hydraulics, milling machines, chemistry, textiles, recycling, heating and cooling systems in the region. There are 613 industrial companies belonging to approximately 25 different sectors.
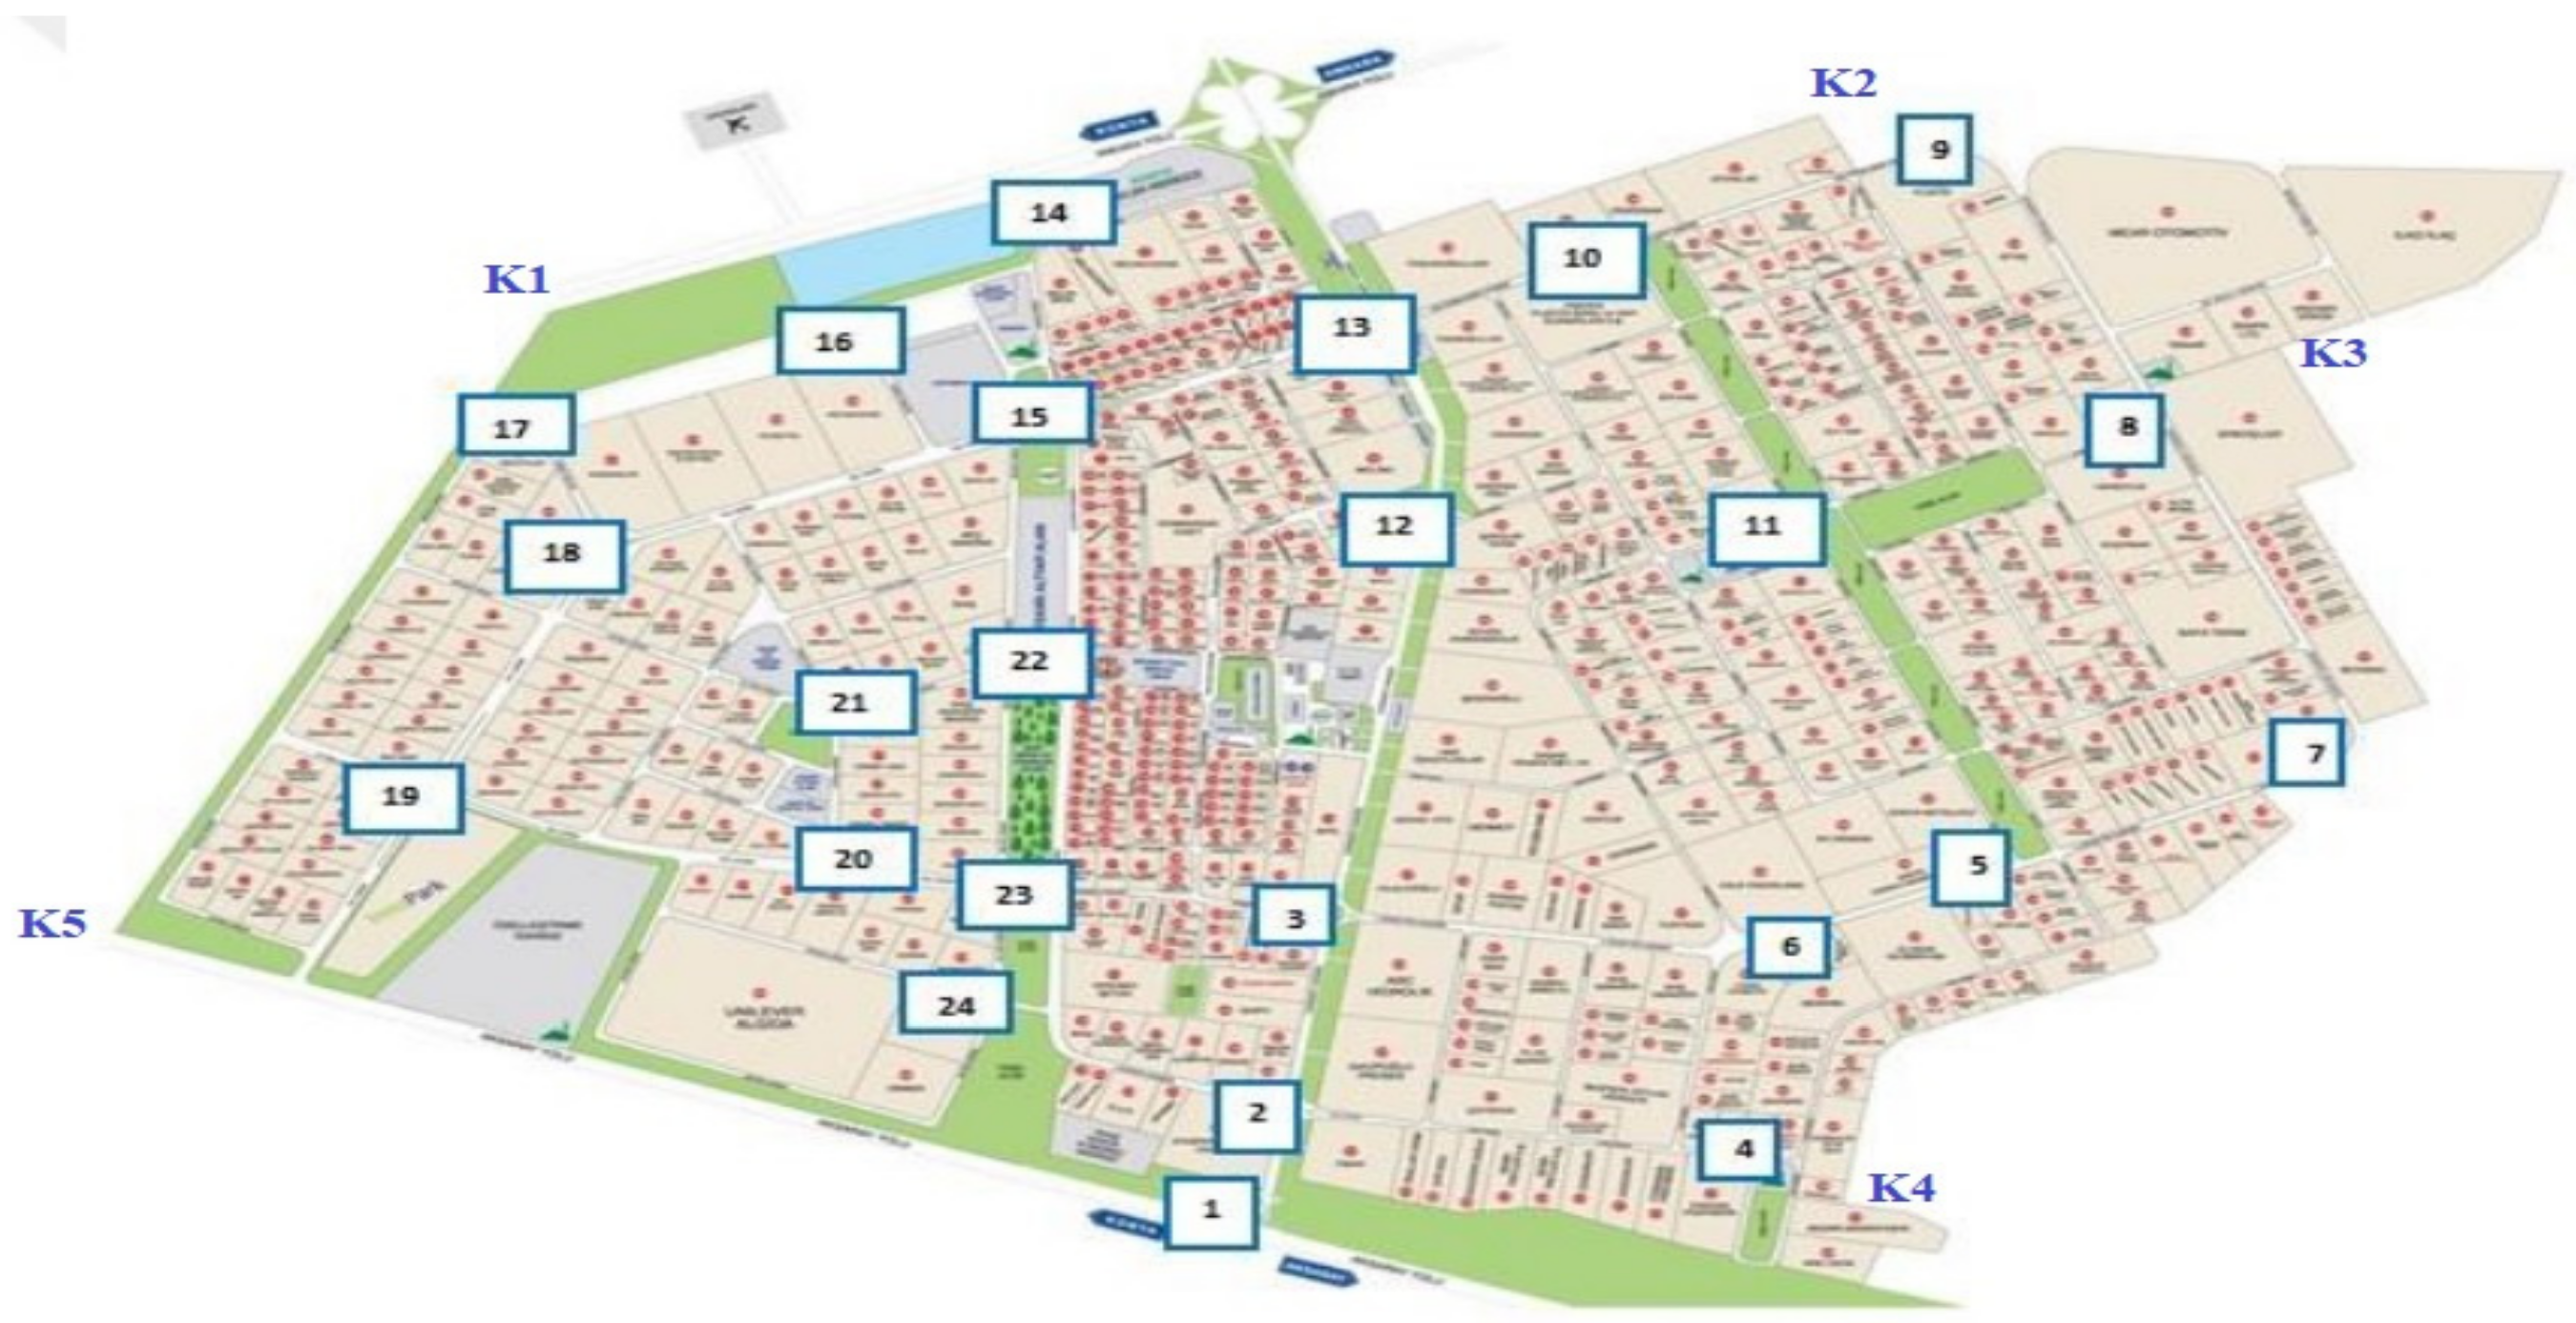
In the study, 24 different locations in the OIZ were determined as measurement points according to the locations of different sector types and traffic routes. PM
10 measurements were taken using a passive, real-time personal aerosol monitor/data recorder Thermo Scientific Personal Data RAM PDR1000AN [
10]. This device can continuously measure and record solid and liquid substances in the atmosphere. It can save 13,000 data in its memory. Measurements were taken with the continuous sampling method. Before using the device, firstly, the calibration process was performed.
PM
10 measurements were taken in the morning, noon and evening hours. After the measurements were taken, a visual evaluation was carried out using Surfer, a modeling and graphics program, and ArcGIS software [
11]. These programs were used to compare pollutant concentrations at each location and to create pollution maps. The map of the 24 sampling points is given below (
Figure 1).
After the measurements were taken, in order to determine the relationship between pollution and vehicle traffic, the traffic routes and the average number of vehicles in the region were determined, and the measurement results were correlated with the number of vehicles. In addition, in order to compare the general air pollution in Konya with the air pollution in the region, the results of the Clean Air Center (CAC) located in the city center of Konya and the results obtained from this study were also compared.
3. Results
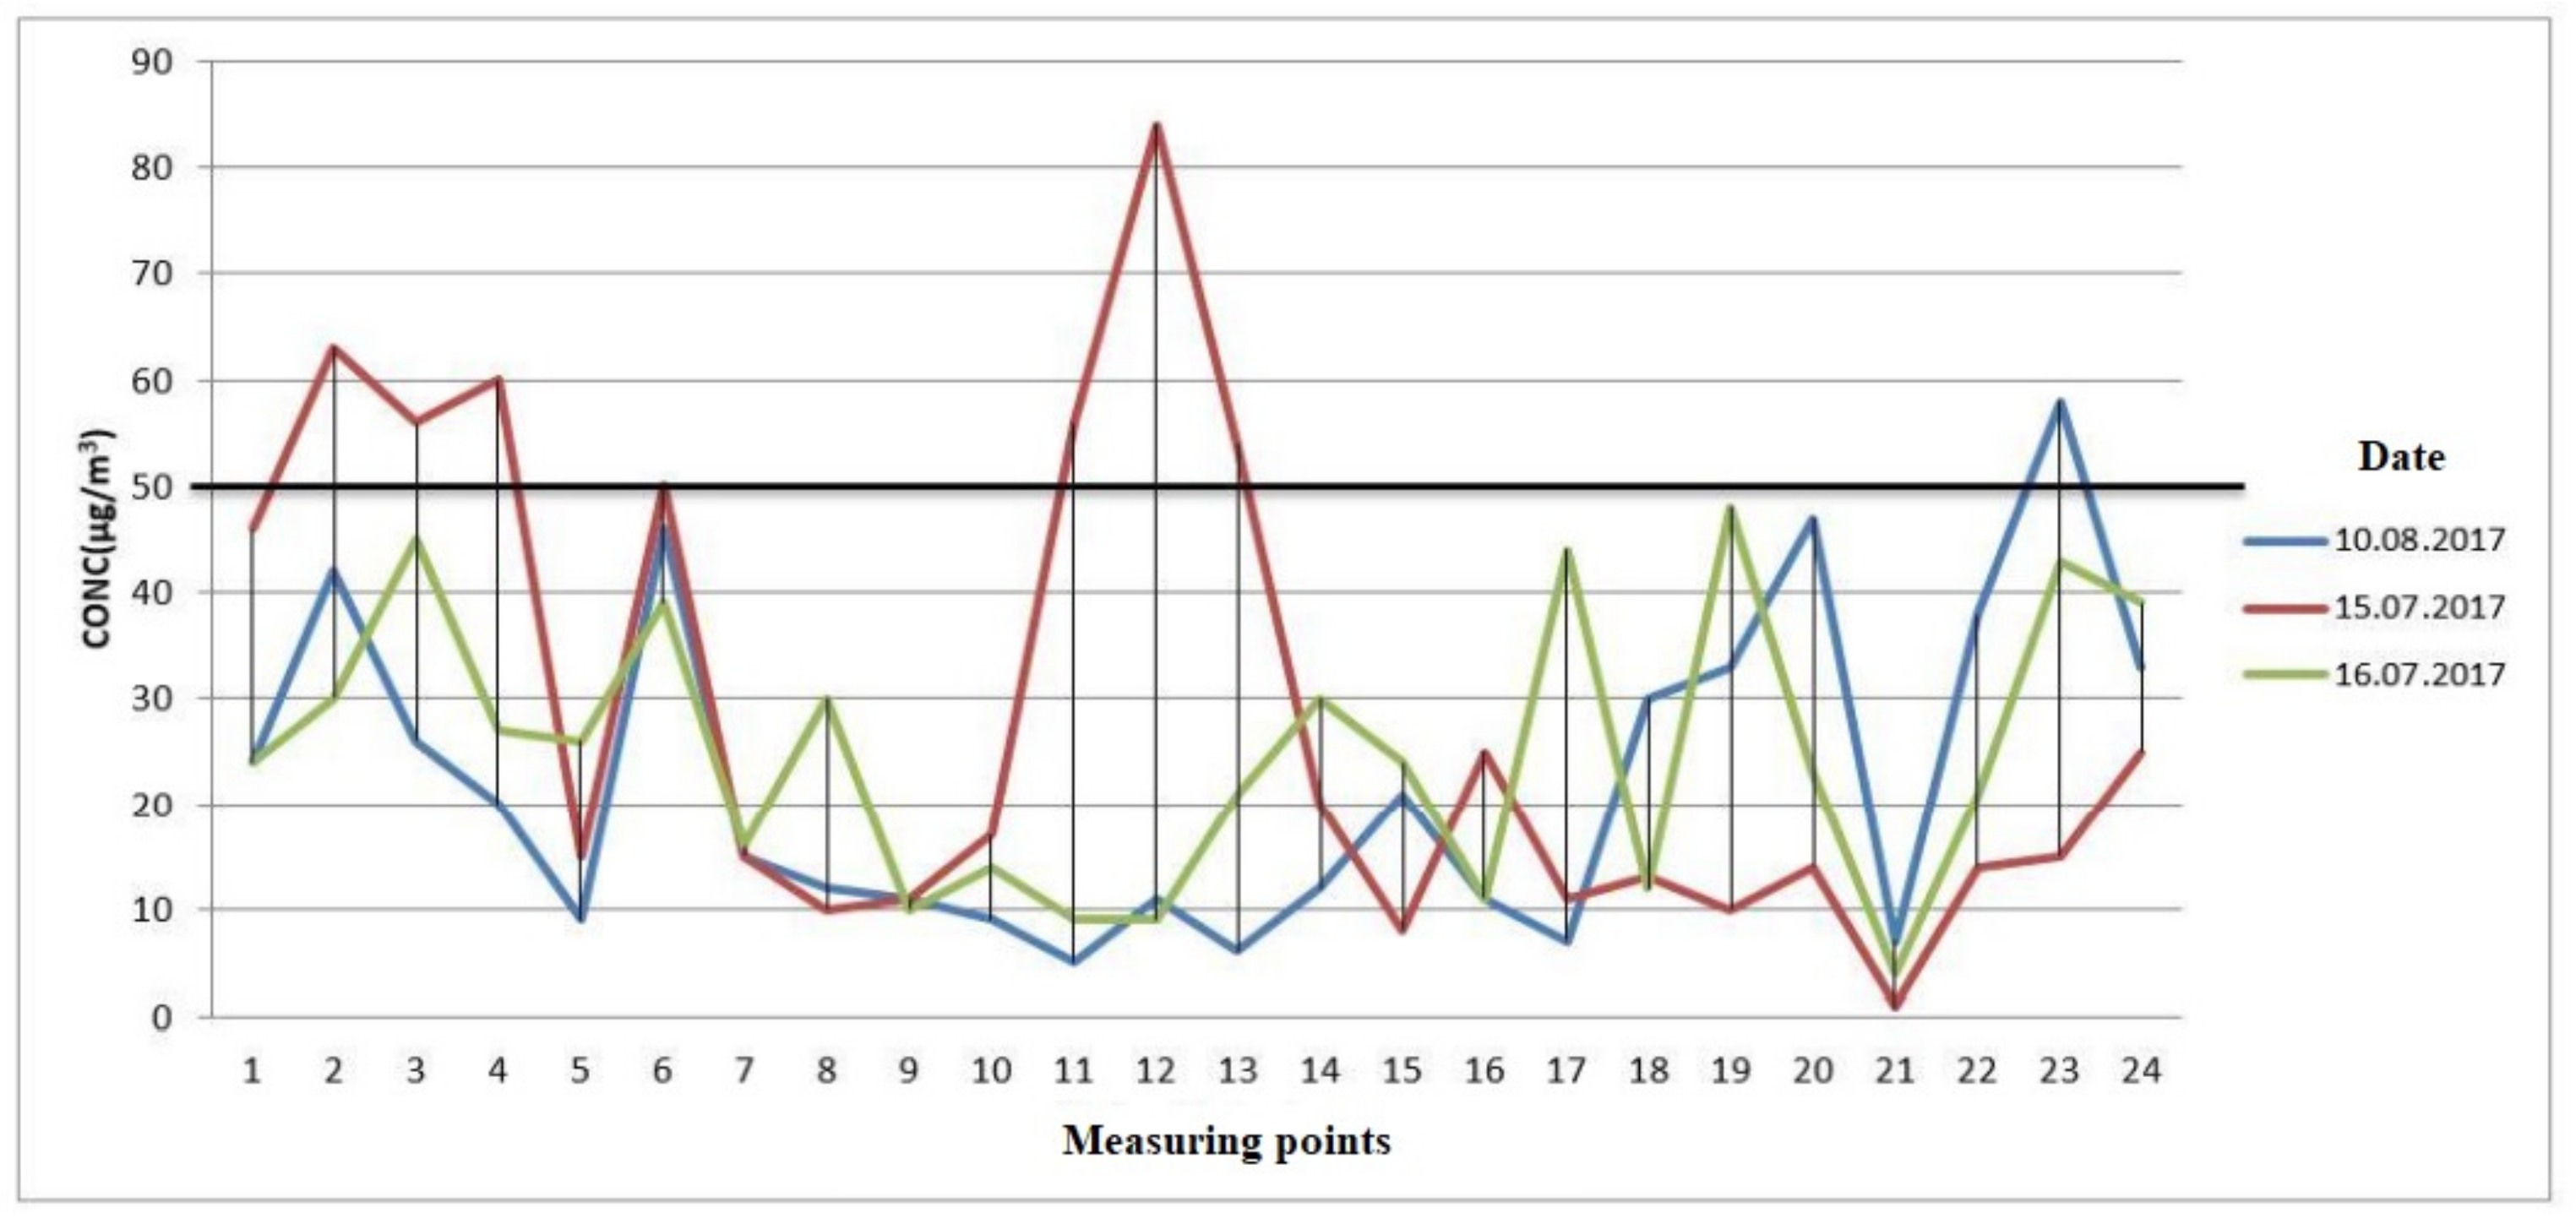
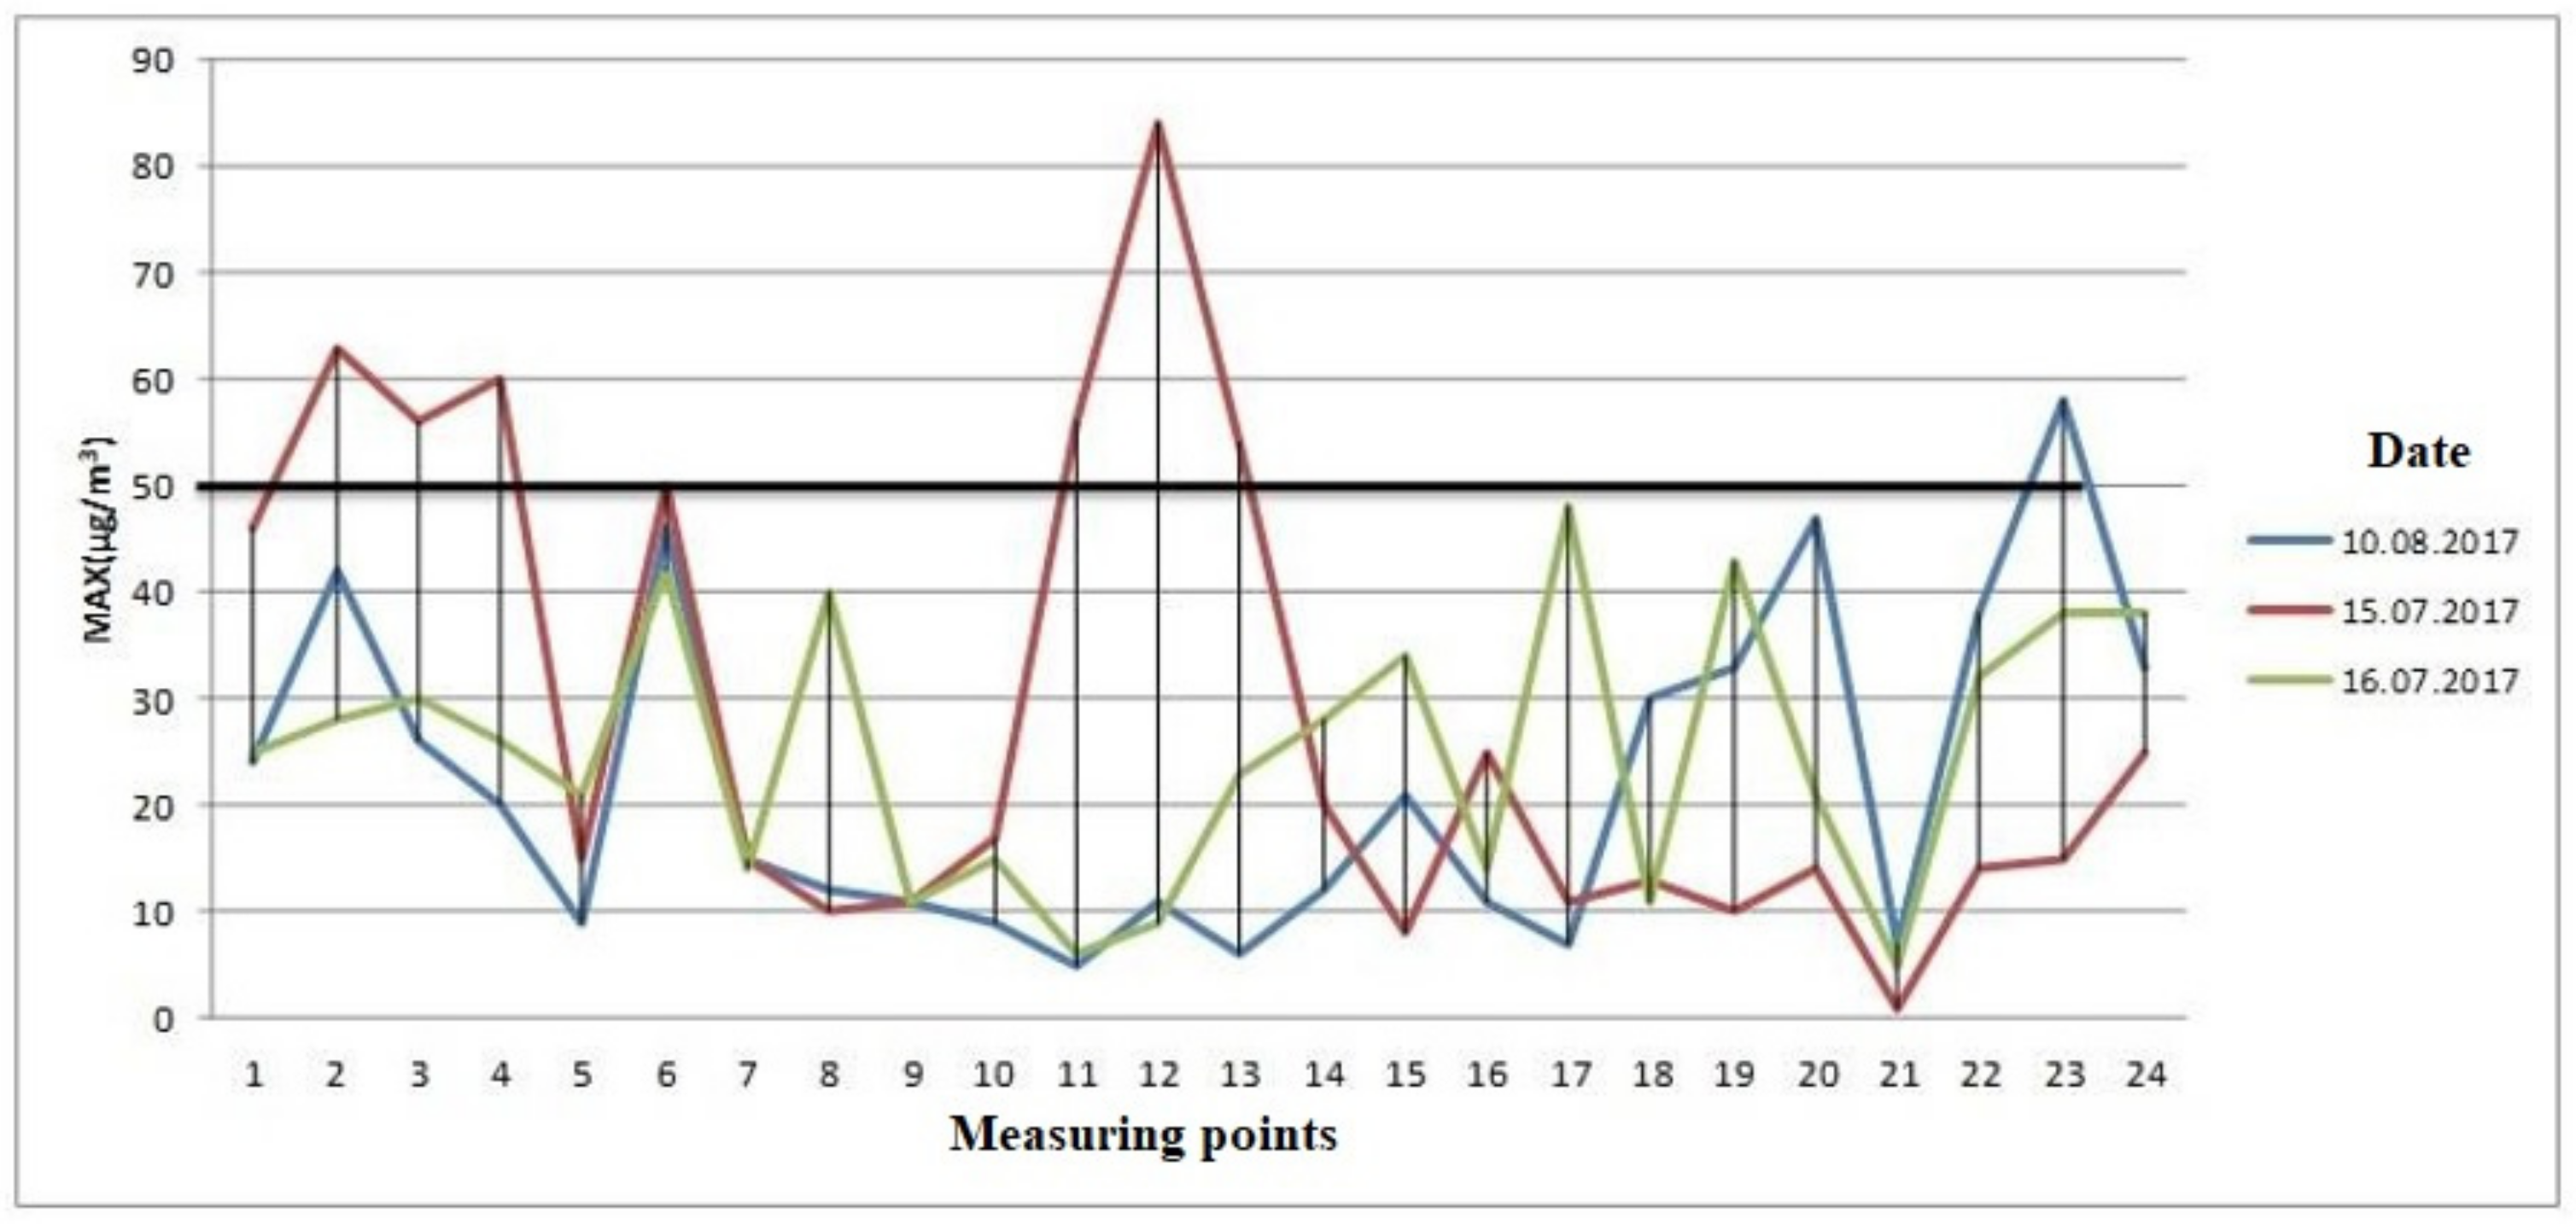
PM10 measurements were taken outdoors at 24 locations within the boundaries of the Konya OIZ at different times on three different days. The first sampling was carried out on 10 August 2017 at noon, the second sampling was carried out on 15 August 2017 in the evening and the third sampling was carried out on 16 August 2017 in the morning.
The unit of measurement was originally mg/m
3. This was converted into μg/m
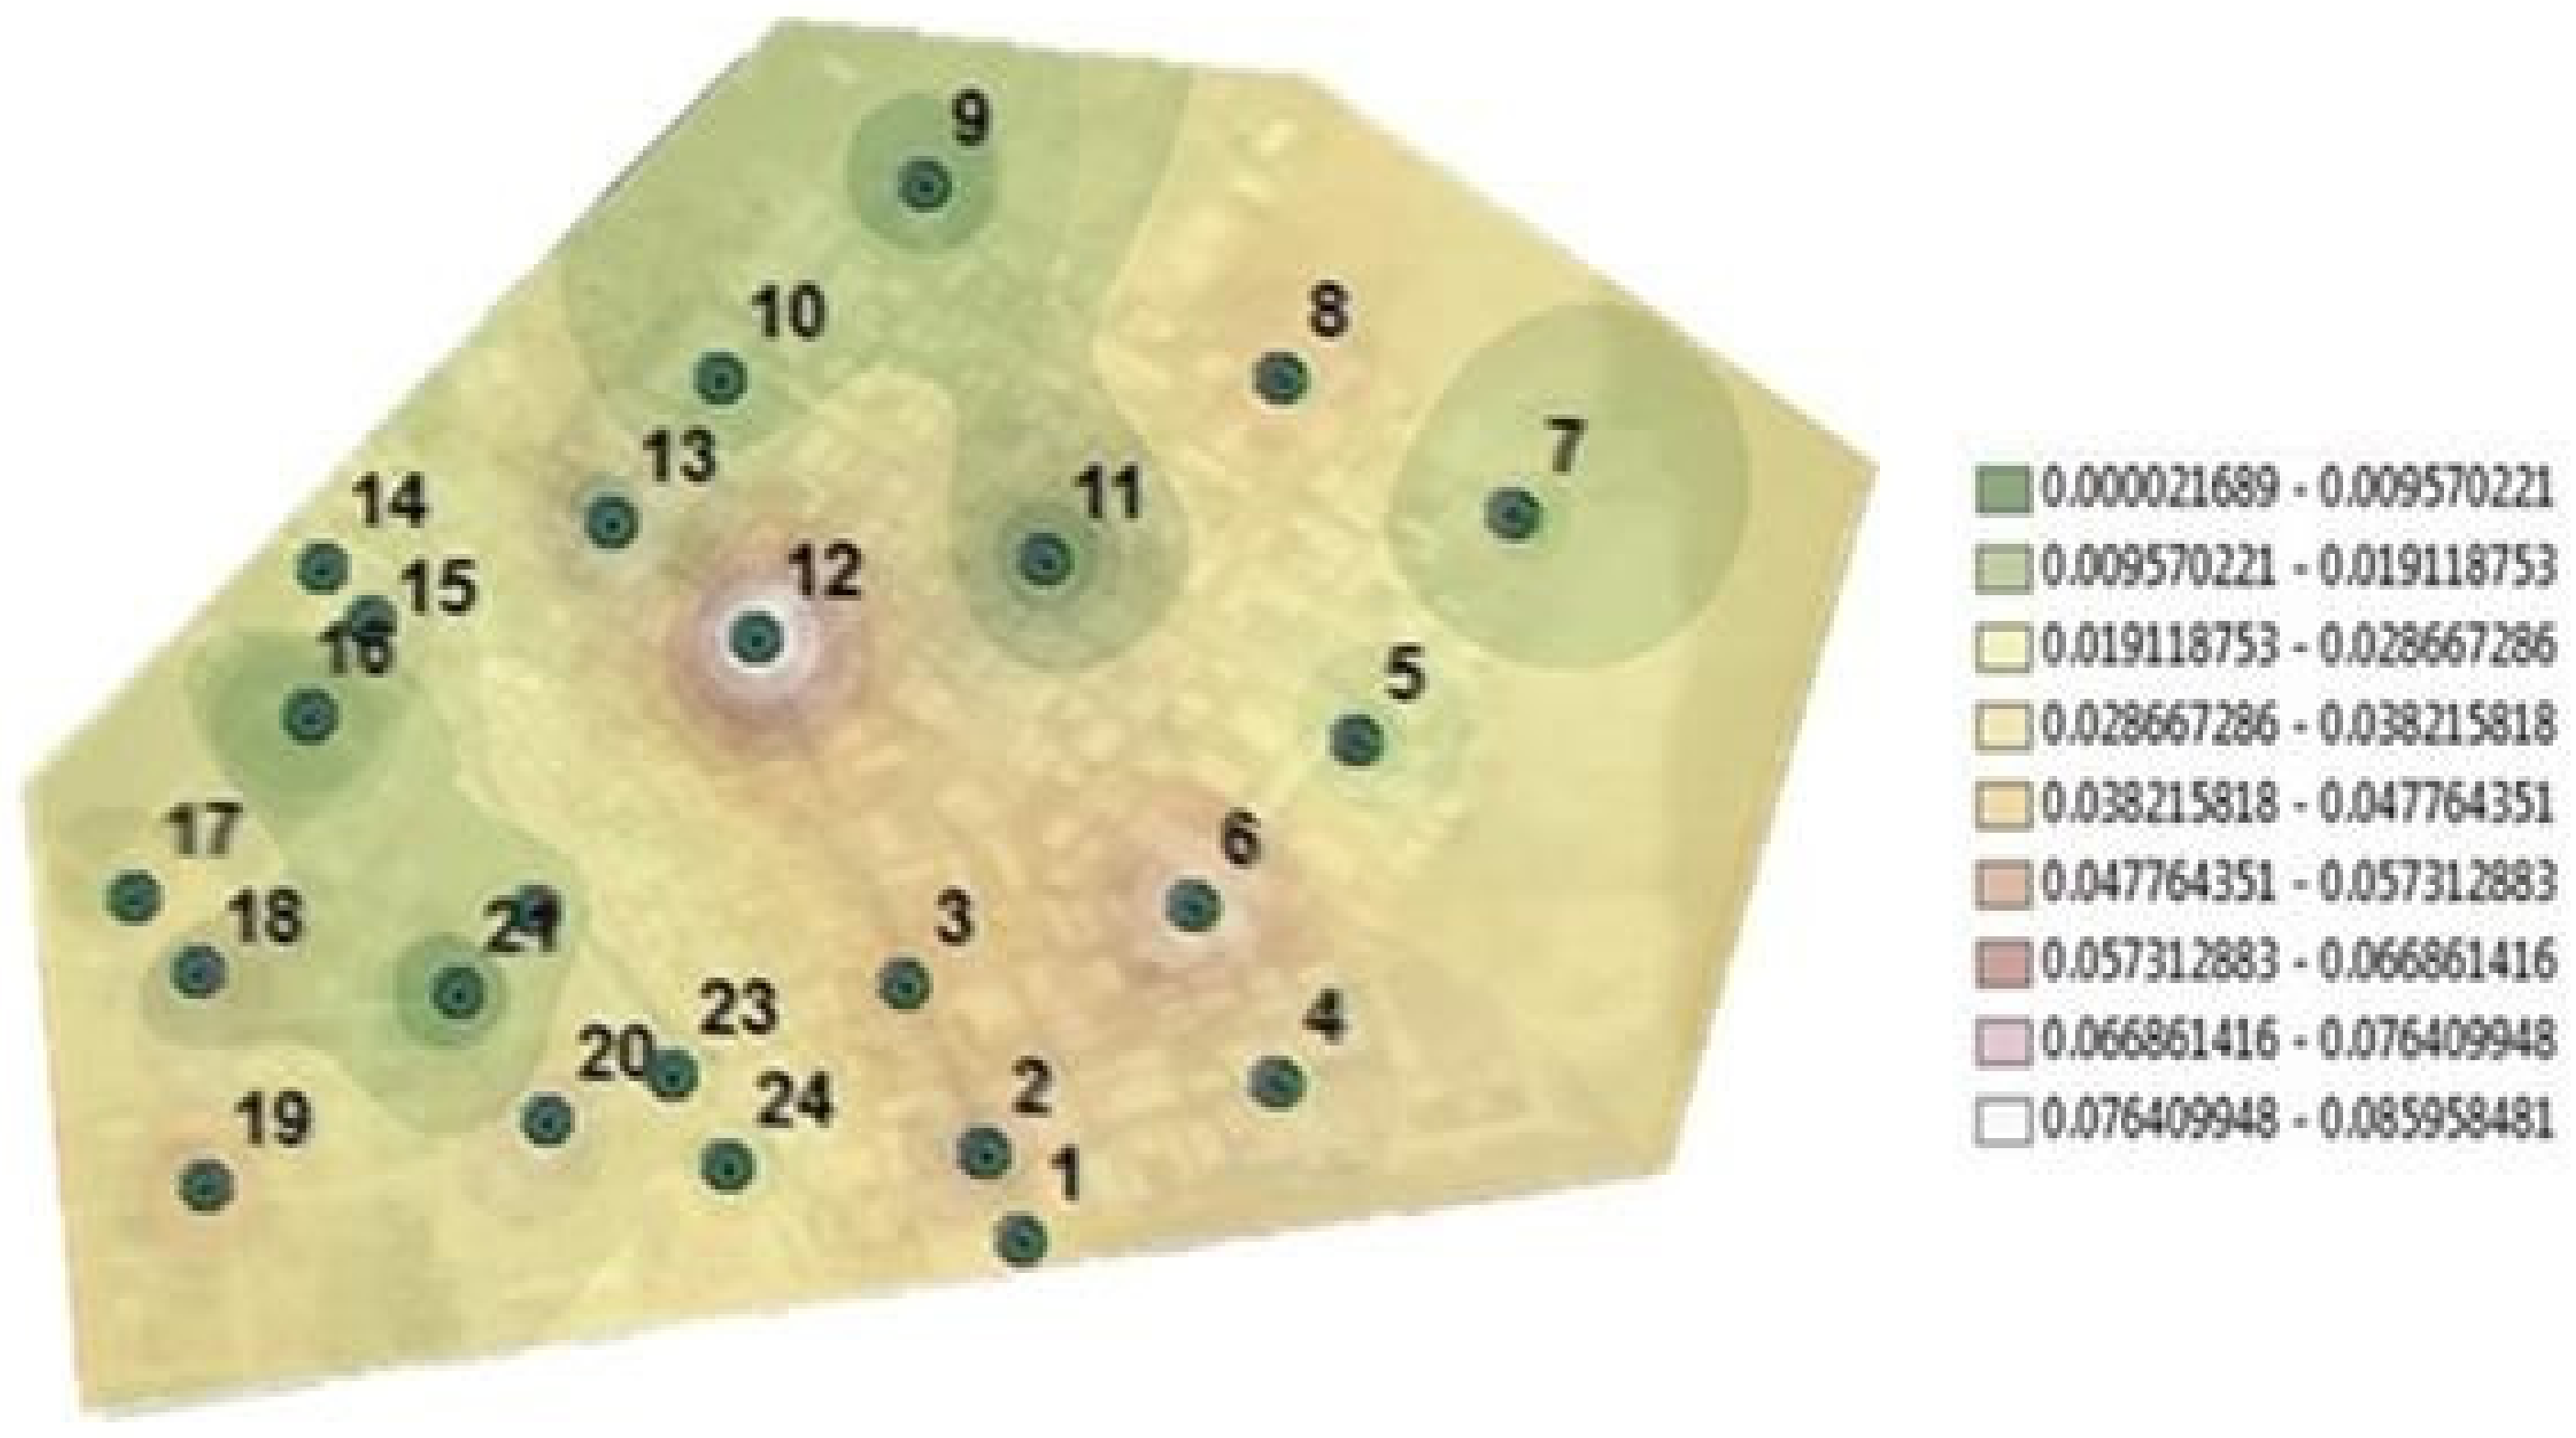
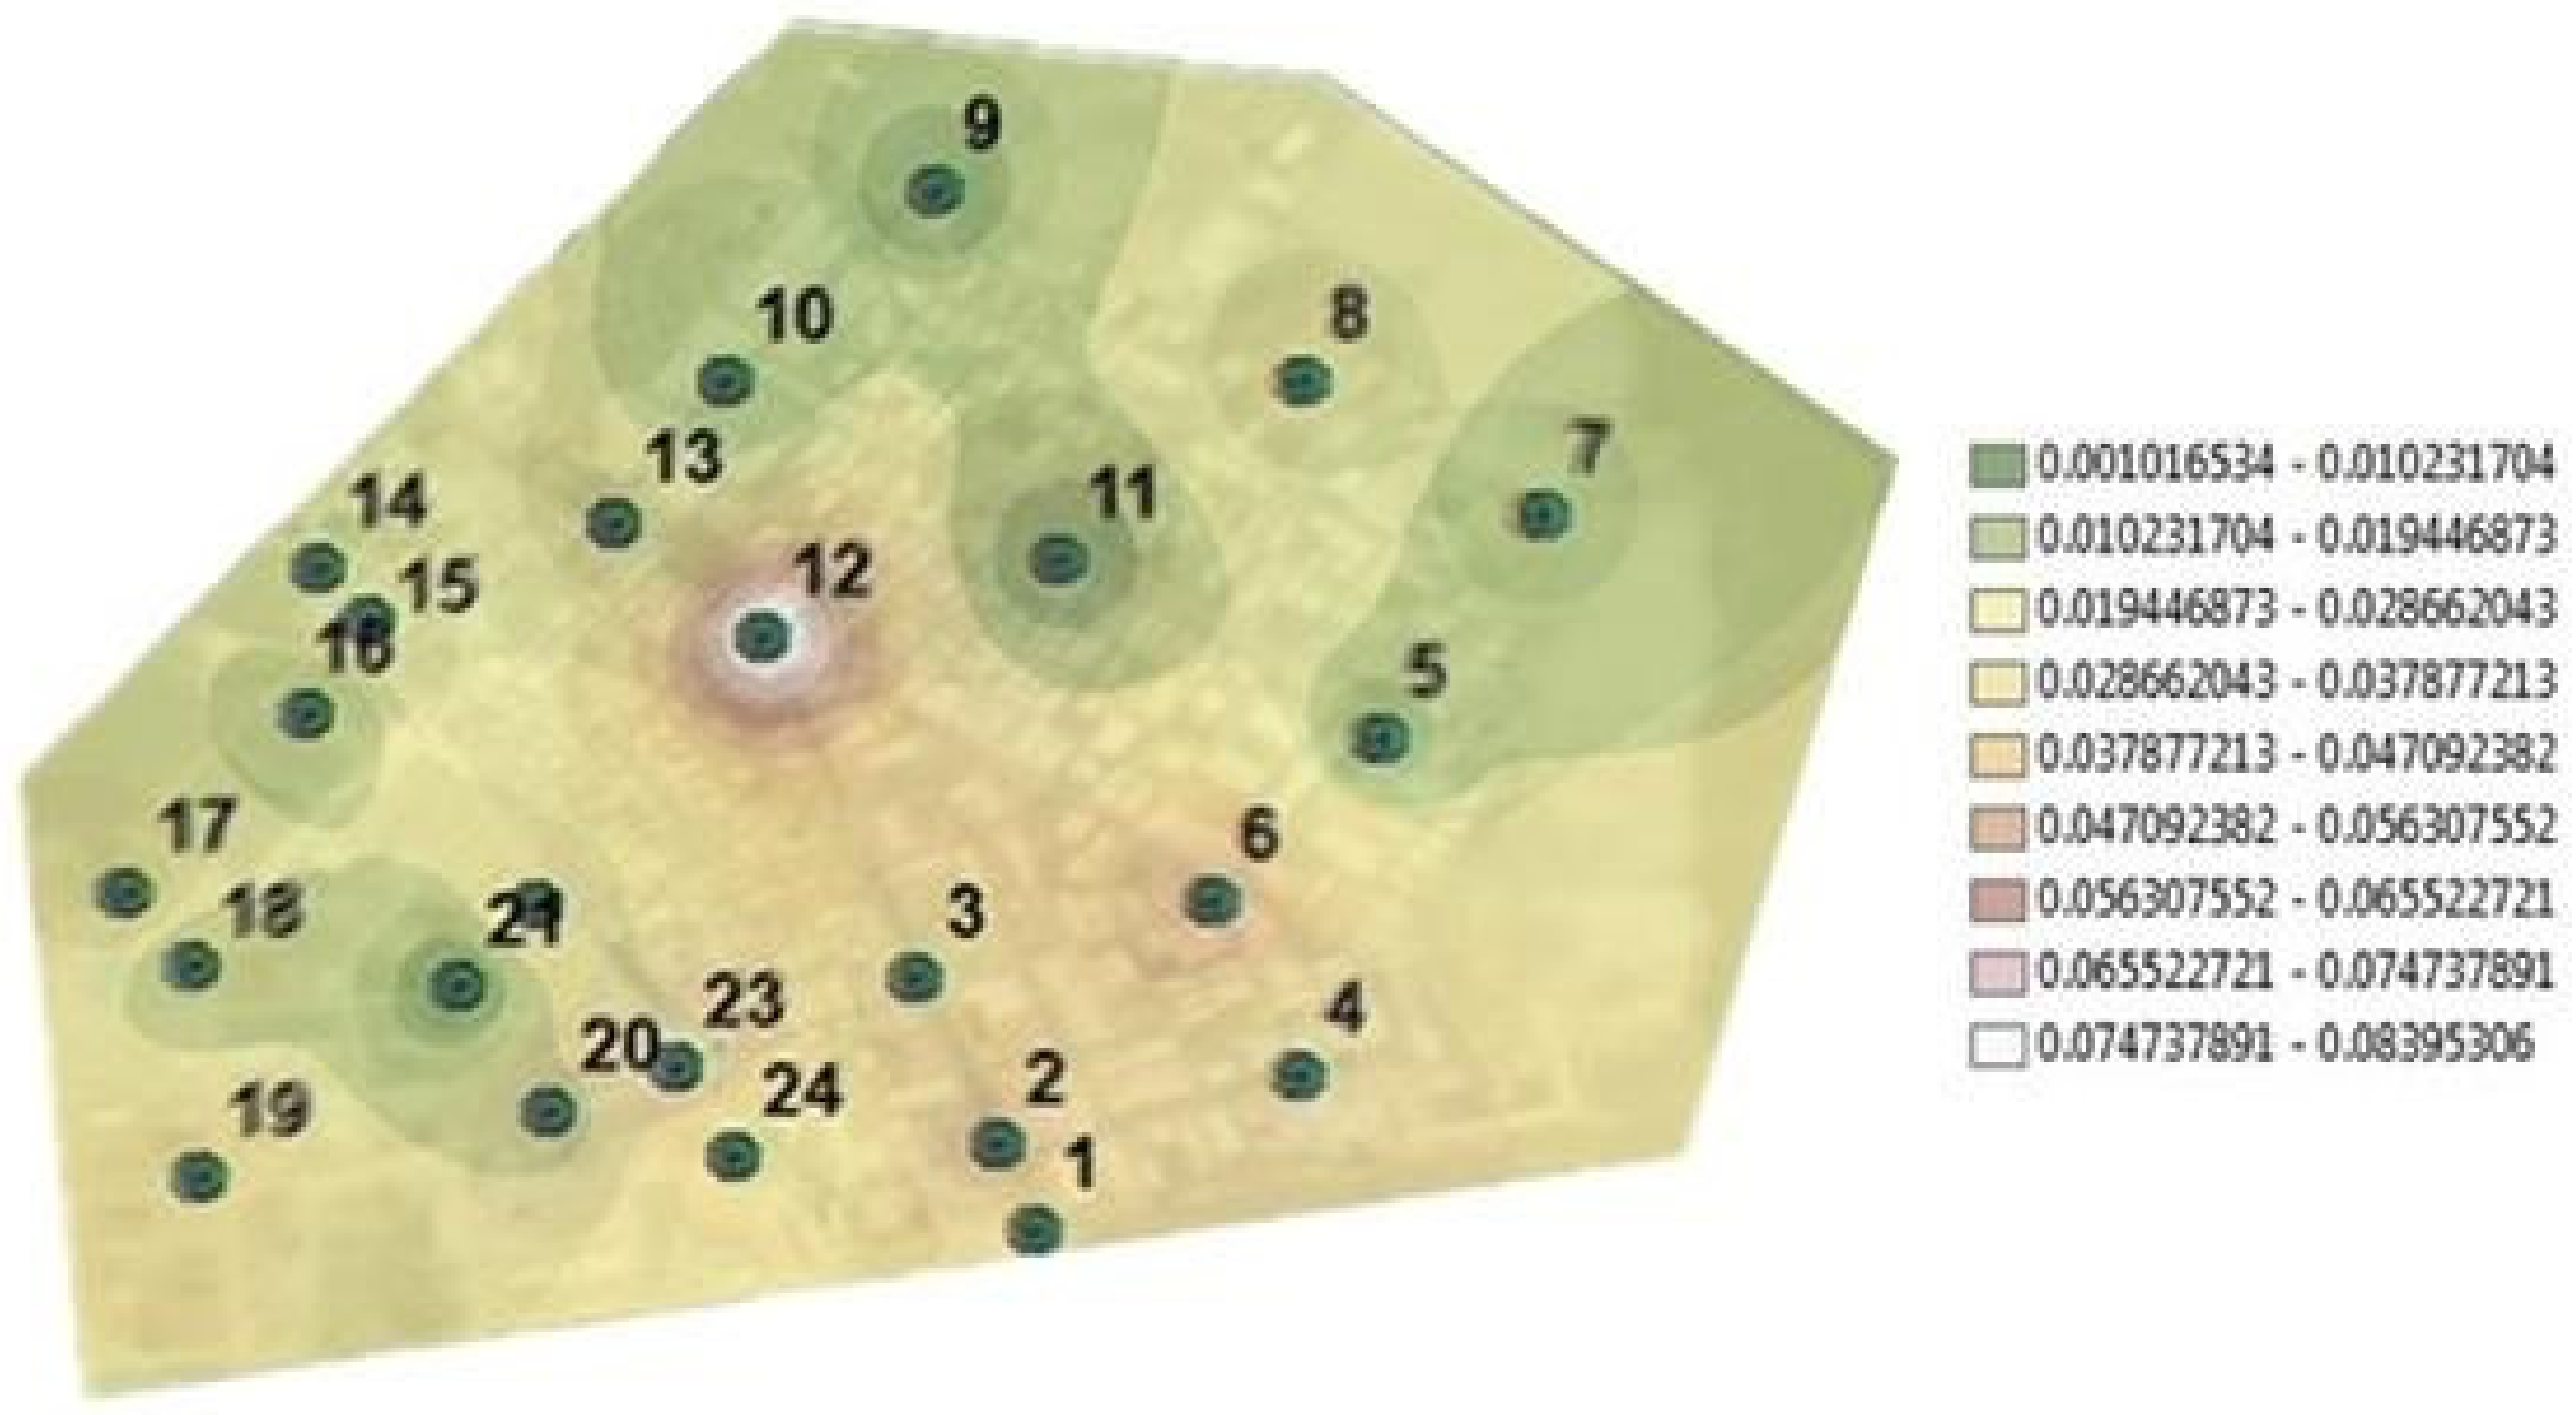
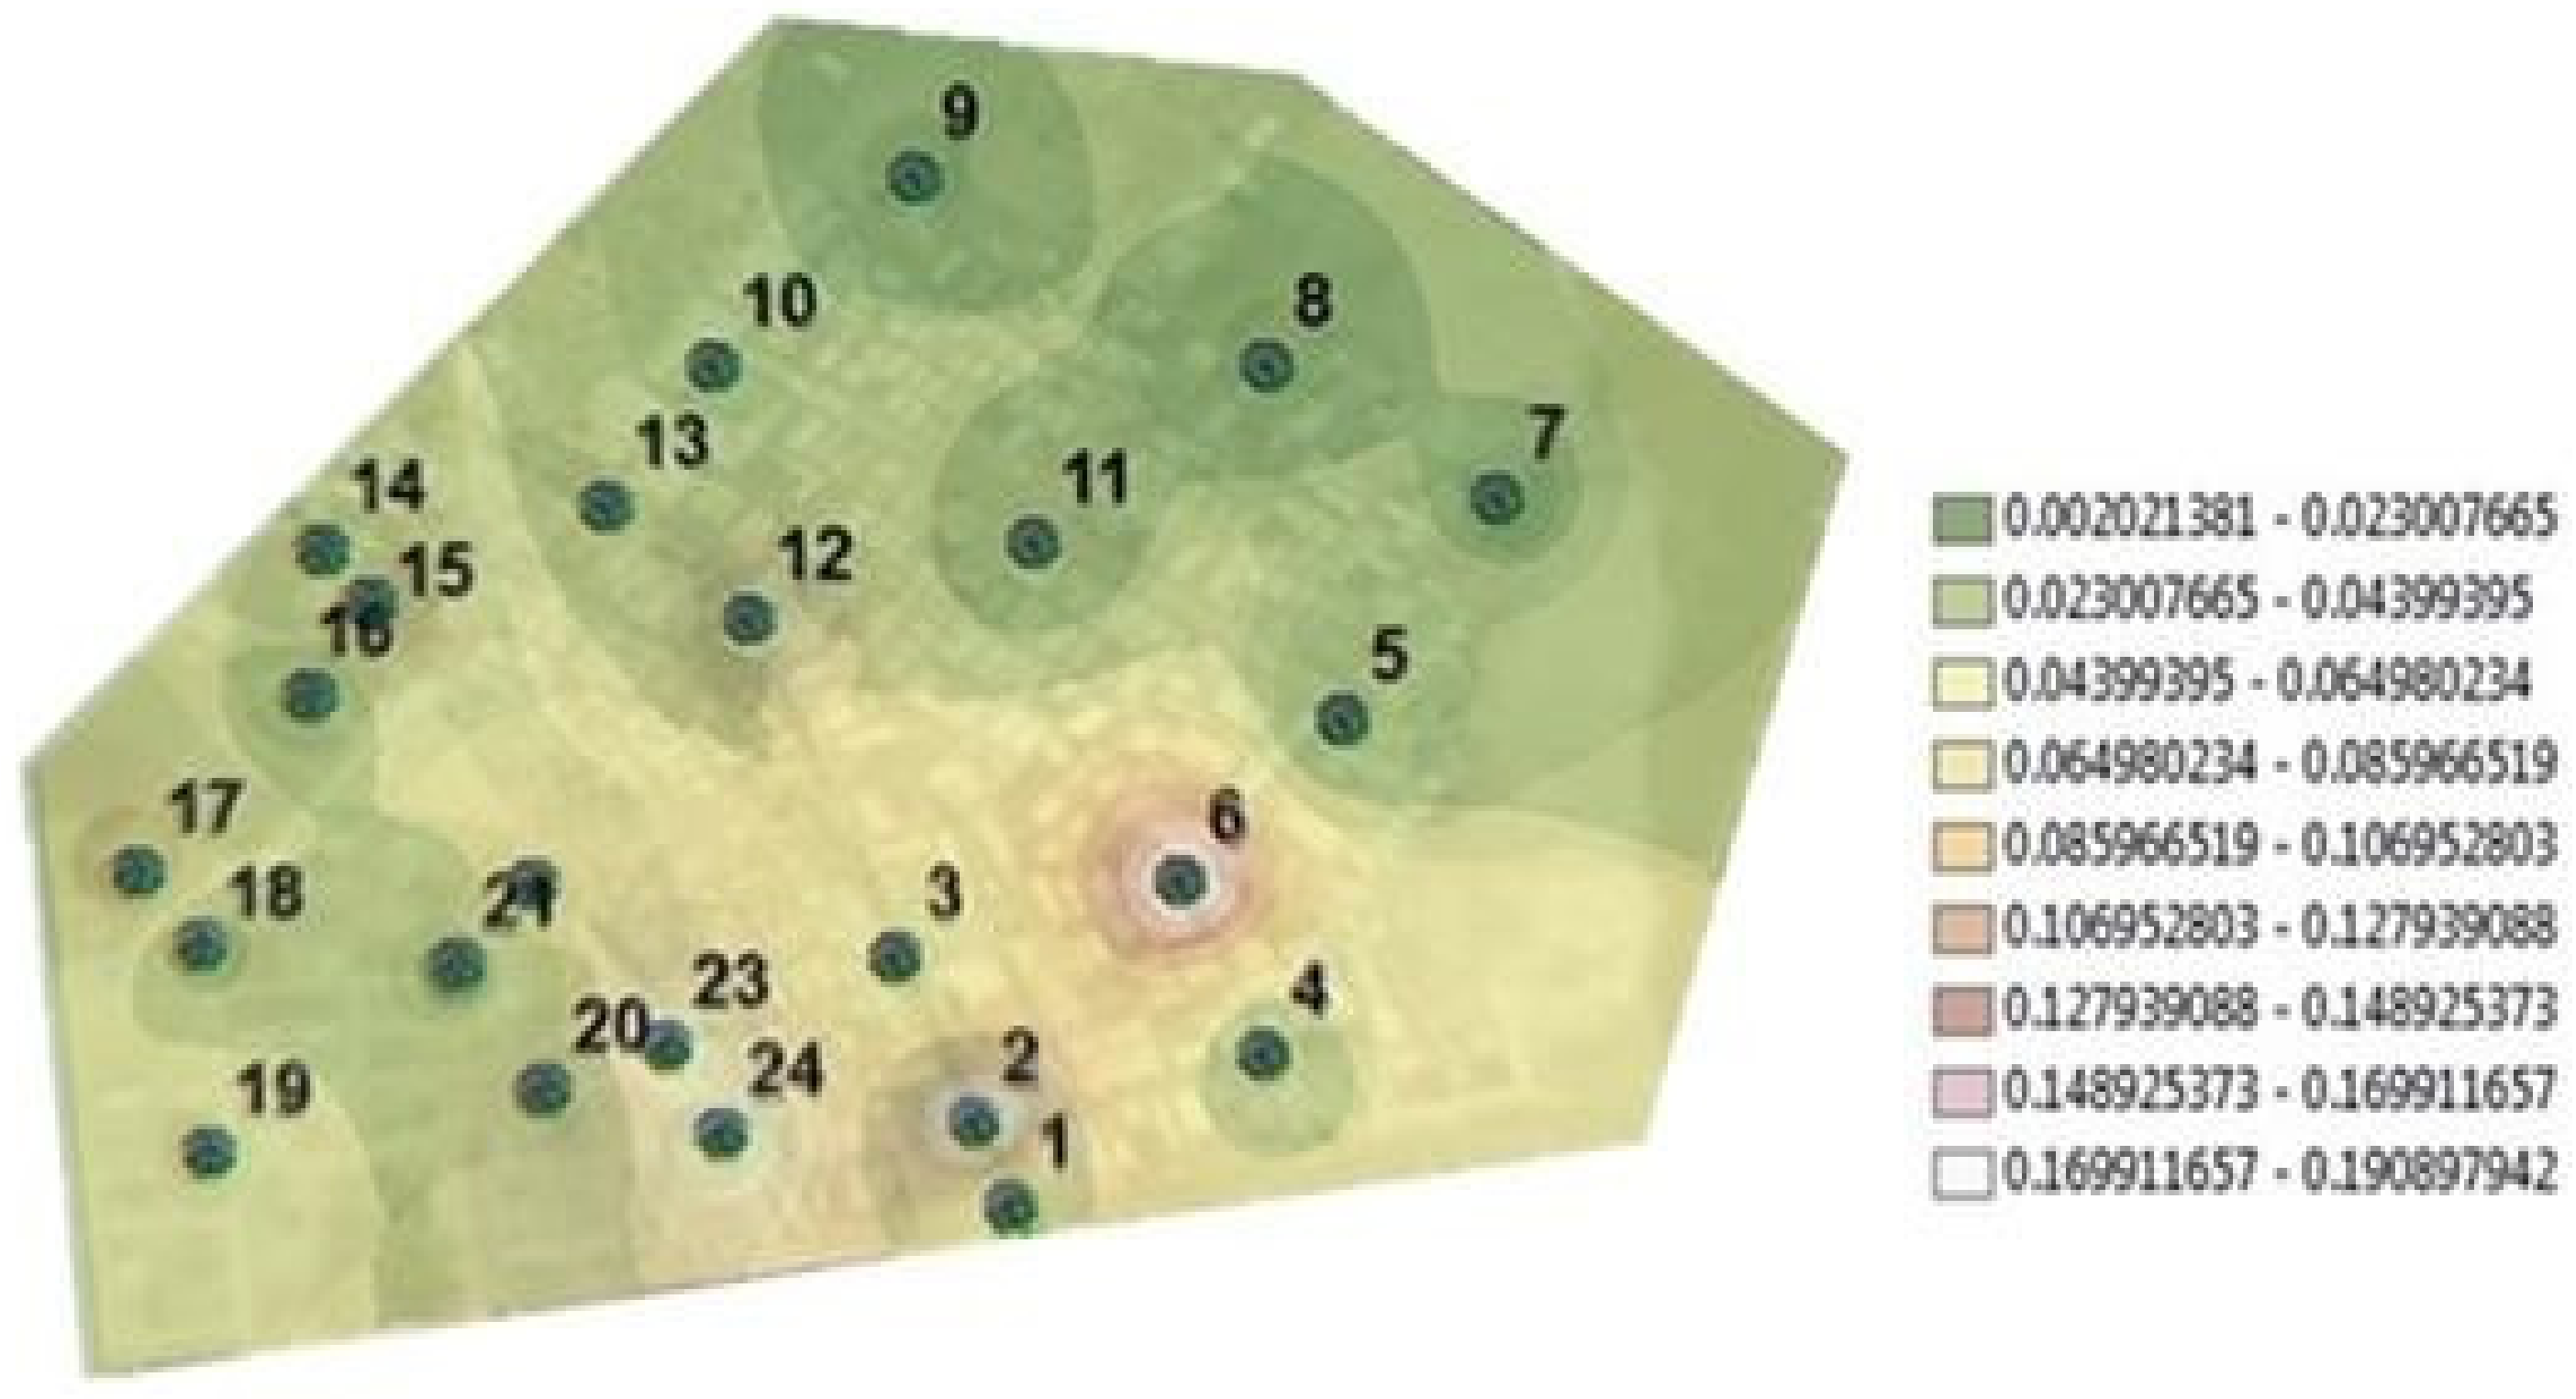
3 in order to be able to compare the results with the maximum limits according to regulations. The coordinates of the measurement points and the measurement results were compared with the maximum limit values of the Air Quality Assessment and Management Regulation (HKDY). Weights higher than the values given in the table with the comparison are shown in red. Coloring work was done in 2D in the Surfer program and in 3D in the ArcGIS program. The boundary coordinates of the map are given in
Table 1.
Surfer is a program used to obtain images by creating maps and was developed by Golden Software. This software consists of two and three-dimensional graphics systems. The program has been widely used in the literature since 1984. The main reason for the widespread use of this program is its excellent guiding and shaping capabilities [
12].
While creating the Surfer maps of OIZ, the bottom side was based on the five border points of the OIZ (K1-K2-K3-K4-K5). The maps were created separately according to morning, noon and evening values. Legend ranges were determined according to dates, and measurement results are different. The reason for this is the differences in the results of the measurements. The created legend ranges were changed based on dates and values of the results.
Using the PM
10 measurement results, the ArcGIS program version 10.1 was employed to create the maps. Concentration, average concentration and maximum values based on daily maps are shown separately in
Figure 5,
Figure 6,
Figure 7 by combining the shapes of the morning, noon and evening results.
Points 2, 3, 12 and 13 are on Evrenkoy Street, the busiest street in the OIZ. It can be seen that the hours at which the measurement values are high are towards the end of working hours. When comparing values of evening hours with morning and noon, it is concluded that the pollution at the measurement points is caused by traffic.
In addition to analyzing the ArcGIS and Surfer maps, correlation analysis was carried out in order to understand the effects of traffic on pollution. Correlation analysis is a statistical method used to test the linear relationship between two or more variables and to measure the degree of this relationship [
13]. In the correlation analysis, one of the variables was the average number of vehicles as an indicator of traffic density, and the other was the PM
10 values obtained.
Table 2 was used to interpret the coefficients obtained in the correlation analysis.
The number of vehicles passing through the gates in the morning, noon and evening was determined by using the camera and plate recognition systems at the entrance gates. The average number of vehicles passing by, the average PM
10 values at the measurement points and the results of the correlation analysis are shown in
Table 3.
As can be seen in
Table 3, there is a high correlation between pollution and traffic at points 2, 3, 12 and 13, which produced high measurement values.
Within the scope of the research, the data of Selçuklu Municipality (SM) were compared with those of the Clean Air Center (CAC) in order to comment on the migration of air pollution from OIZ to the city center. Due to the analysis, the average PM
10 concentration (CONC) values of OIZ, CAC and SM were found to be correlated. The values regarding this correlation are given in
Table 4. The results were interpreted as in
Table 2.
As can be seen in
Table 4, while a very high correlation was found mainly between OIZ and THM, a high correlation was also found between OIZ and SB.
It was found that traffic-induced PM10 pollution in the OIZ also affects the air quality in the city center due to migration of the pollution.
When the results and maps were examined, it was seen that hourly changes occurred in measurements. These changes varied depending on the pollution occurring in the region, as well as meteorological and physical effects. During the changes, it was observed that PM10 was high at the measurement points, especially on busy streets, during rush hour. Although there are factories in areas with little traffic, the measurement values were far below the limit value. This is due to what we can call dead points. In general, it was concluded that the pollution caused by PM10 in the OIZ is caused by traffic.
4. Discussion
As the starting point for research on air pollution, Lipfert [
14] used atmospheric inversion of very high PM emissions with respect to cases that resulted in thousands of deaths in less than a month in the Meuse Valley of Belgium in 1934, Donora in the USA in 1947 and London in 1952. He mentions that significant events and topographic structure cause air pollution episodes.
Air composition is constantly changing in the troposphere. Some substances in the air are reactive; in other words, they tend to interact with other substances to create new ones. Due to reacting with another substance, some of these substances form “secondary” pollutants that can harm the environment. The mentioned heat, including the heat emitted by the sun, is often a catalyst that facilitates or triggers the chemical reaction process [
4].
Grains in dust vary in size from 300 μ to 0.1 μ. Dust grains below 60 μ in size are respirable. Dust can be divided into three categories according to the size of the particles. These are regular dust, fine dust and excellent dust. Regular dust grains have a diameter larger than 10 μ and move towards the ground with a velocity that increases as they progress in still air. Fine dust grains are in the range of 0.1–10 μ. They can move steadily toward the ground when the air is stagnant. The diameters of excellent dust grains are smaller than 0.1 μ. Dust of this size exhibits a continuous state of motion. Therefore, it does not accumulate on the ground [
15].
In the literature, Erdogan mentions dust arising from anthropogenic (artificial) sources; humans create these sources, and anthropogenic source types are divided into two categories—“moving sources” and “fixed sources”—according to the authorities [
16].
Cicek et al. [
17] studied air pollution in Ankara; they stated that the most critical pollutant in the air is sulfur dioxide. Sulfur dioxide gas quickly enters the bloodstream because it is highly soluble in water. Many studies on this subject reveal that sulfur dioxide affects human health. Due to the acid effect in this gas, it irritates the upper respiratory tract and causes respiratory tract infections. At the same time, it has been observed that if this pollutant is combined with particulate matter, its effects reach severe dimensions. It has been found that the balance of the natural environment is disturbed by the acid rains they cause, and they cause significant damage to the soil and vegetation.
Among the gaseous pollutants, sulfur oxides, a non-flammable colorless gas, are the most well-known primary air pollutants. Its persistence in the atmosphere reaches 40 days. They are mainly formed because of the combustion of fossil fuels. It is estimated that more than 80% of anthropogenic sulfur oxides originate from industrial sources [
18].
SO
2, an acidic, suffocating and colorless gas, is found in the natural structure of coal and fuel oil and is released because of the combustion of its compounds. Industrial activities, fuels used in homes for heating, thermal power plants and diesel-fueled vehicles are the SO
2-producing activities that authorities say produce the most SO
2. It has been observed that the increase in sulfur oxide concentrations has been high in the central areas of cities and around industrial areas due to fossil fuels used for heating homes [
19].
Pekavcılar et al. [
20] separated the sources of air pollution into two categories: fixed and mobile sources. The authors stated that pollution is created in a process involving burning solid, liquid and gaseous fuels. Fixed sources are petroleum refineries, petrochemical integrated facilities, chemical industry and agricultural pesticides, energy production (thermal power plant), the cellulose and paper industry, the iron and steel industry, the cement industry, the fertilizer industry, the sugar industry, the stone and soil industry and the textile industry. Examples such as the tire industry, the fuels used for heating in workplaces and homes, neglected roads and open lands with destroyed vegetation can be given.
Regarding mobile source types, Erdogan stated that the products that are produced during the combustion of diesel, gasoline and jet fuel are similar since they are composed of pollutants originating from land, sea and air transportation [
16]. Okutan et al. [
21] mentioned other contaminants apart from those categorized as having either fixed and mobile sources. However, air pollution originating from the combustion process, vehicle exhausts and industrial facilities are significant; there are also a wide variety of air pollutants, which are called “other sources” and are generally ignored. These other pollution types include pollutants caused by the burning of garbage, polluted water bodies and pollution from construction. Water bodies containing high levels of organic pollutants release H
2S and other gases into the air during anaerobic decomposition. In construction sites, it has been observed that particulate matter causes some contaminants in the air. In outdoor environments, PM explosives are released during mining activities such as excavation, machinery and vehicle movements, iron processing, metal plating and transportation; this affects the entire ecosystem because pollution is carried to other places by air [
7].
Air pollution sources for Turkey are primarily industry (thermal power plants, cement, iron–steel sector, etc.), followed by fossil fuels used in residences (coal, heating oil, etc., responsible for 80% of winter air pollution) and traffic-related exhaust emissions [
22].
5. Conclusions
In the modeling study based on the results obtained, the Surfer Software program was used in its two-dimensional form, and successful results were obtained from the maps created from the results.
In addition to Surfer, ArcGIS was used to determine the accuracy of the modeling, and it added extra value to the maps in terms of combining the morning, noon and evening distributions of the pollutant values recorded at the measurement points determined according to the coordinates during the day.
Although the province of Konya does not show much change in topography, pollution is removed due to meteorological factors. Measures should be taken to minimize the air pollution that may occur in industrial areas and the city center due to industry. We can list some of them as follows:
The number of entrance doors to the OIZ area should be increased;
Studies should be carried out to prevent the formation of pollution by mechanical processes in the OIZ;
Concerning the heights of the measured values in THM, OIZ areas should be established opposite to the wind direction, and the chimneys in industrial facilities should be controlled more frequently, lengthening the chimneys and using new technology filter systems;
Industry and business centers should be established in non-residential areas;
In order to prevent pollution caused by traffic, exhaust controls of motor vehicles should be tightened, the spread and use of public transportation and electric cars should be increased, industrial facilities with a large number of employees should provide services to their employees;
Studies should be carried out to increase afforestation and green areas in locations where pollution is high.
For this study to be more helpful, it is necessary to study other pollutants that may spread in the industry, and to monitor PM10 regularly for a more extended period of time. It is necessary to carry out studies in order to find out the levels of pollution that cannot be seen in the studies carried out in the OIZ due to blind spot events as a result of the studies carried out at the central stations.


