Article

Historical and Projected Variations of Precipitation and Temperature and Their Extremes in Relation to Climatic Indices over the Gandaki River Basin, Central Himalaya

by
Krishna Prasad Sigdel
1,
Narayan Prasad Ghimire
1,
Bhopal Pandeya
2 and
Binod Dawadi
3,4,*
1
Central Department of Botany, Tribhuvan University, Kathmandu 44613, Nepal
2
Centre for Environmental Policy, Imperial College London, London SW7 1NE, UK
3
Central Department of Hydrology and Meteorology, Tribhuvan University, Kathmandu 44613, Nepal
4
Kathmandu Center for Research and Education, Chinese Academy of Sciences-Tribhuvan University, Kathmandu 44613, Nepal
*
Author to whom correspondence should be addressed.
Atmosphere 2022, 13(11), 1866; https://doi.org/10.3390/atmos13111866
Submission received: 15 October 2022 / Revised: 26 October 2022 / Accepted: 27 October 2022 / Published: 9 November 2022
(This article belongs to the Special Issue Coupled Climate System Modeling)

Abstract

:
Changes in precipitation and temperature, especially in the Himalayan region, will have repercussions for socio-economic conditions in the future. Thus, this study aimed to understand the climatic trend and changes in one of the Himalayan River basins, i.e., Gandaki River Basin (GRB), Nepal. In particular, we analysed the historical (1985–2014) and projected (2015–2100) precipitation and temperature trend and their extremes using observation and 13 bias-corrected Coupled Model Intercomparison Project phase 6 (CMIP6) datasets. Additionally, the relationship between extreme precipitation/temperature indices and ocean-atmospheric circulation patterns were also analysed. The results showed an increasing trend of precipitation amount and temperature at annual and seasonal scales with the highest upward trend for precipitation in monsoon season and temperature in winter season. Among nine precipitation indices analysed, the wet extremes are projected to increase in all Shared Socioeconomic Pathways (SSP) scenarios; with the highest increment of high-intensity related extremes (R10 mm and R20 mm). In contrast, dry spells will decline in the distant-future (2075–2100) as compared to near (2015–2044) and mid-future (2045–2074). Further, increment in temperature trend resulted in a decrease in cold related temperature extremes and an increase in warm related extremes. Furthermore, it was observed that the changes in precipitation and temperature extremes over GRB were influenced by large-scale ocean-atmospheric circulation patterns. The Atlantic Multidecadal Oscillation (AMO), Sea Surface Temperature (SST) and Southern Oscillation Index (SOI) were found to have a major role in driving precipitation extremes while AMO, SST and Pacific Decadal Oscillation (PDO) have strong influence on temperature extremes. The results of this study will be useful for better understanding the implications of historical and future changes in precipitation and temperature and their extremes over the GRB.

1. Introduction

Ongoing global warming has impacted the climate system globally, accelerating the occurrence of extreme disasters, which are impeding socio-economic development [1]. For instance, the global temperature has increased by 0.85 °C during 1880–2012, where the decade 2000s was the warmest [2], leading to temperature-induced disasters such as droughts and heatwaves [3,4,5]. Moreover, the precipitation has shown frequent and intense variability and its extremes (e.g., drought, floods and landslides) have been more pronounced in recent years in many regions of the world [6,7,8,9]. These extremes are expected to increase more vigorously and intensely in the future [10,11]. Such climatic events significantly impact the ecosystem, biodiversity and socio-economic conditions, especially in the Himalayan regions [12].
Nepal is one of the Himalayan countries which have already witnessed the impacts of climate change, where the impacts are higher over the basin scale, worsening water resource, agriculture and socioeconomics issues [4,13]. It is reported that the air temperature has increased by 0.056 °C/year. during 1971–2014 [14], whereas the precipitation has shown strong spatio-temporal and non-uniform variations in Nepal. The summer monsoon contributes to ~80% of the total annual precipitation in Nepal, with the highest precipitation (>3500 mm/year) in central Nepal [6]. A recent study has shown that the annual precipitation will increase by 3.6–19.5%, whereas the monsoonal precipitation will increase by 27.8% over Nepal under the high emission scenario [15]. Similarly, the annual mean temperature in Nepal is projected to increase by 1.3–4.5 °C from 2080 to 2099 [15]. Further, between June to October 2021, 673 people have lost their lives, 69 people were missing and 181 people were injured due to climate-induced disasters across the country (http://drrportal.gov.np/; accessed on 15 October 2022). Therefore, to address such climate induced consequences, better understanding of the long-term spatial and temporal distribution of precipitation and temperature and their extremes at a basin scale with future projection using climatic models is a current need.
Gandaki River Basin (GRB) is one of the three major river basins of Nepal, which includes all the agro-ecological zones ranging from lower plains in the south to higher trans-Himalayan areas (Mustang and Manang) in the north. The highest (Lumle) and the lowest (Mustang: trans-Himalayan district) precipitation zones of Nepal lie in the GRB [13,16]. GRB is highly vulnerable to climate change and future changes in precipitation and temperature will have consequences to the physical and biological environment. Over GRB, a decreasing trend of pre-monsoon, post-monsoon and winter precipitation has been reported from 1981 to 2012, whereas monsoon precipitation followed the reverse trend [13]. Further, the precipitation has considerable interannual variation; therefore, most of the climatological stations over this basin were characterized by increased severity and frequency of drought [17]. These climatic events have affected crop production, yet the effect on wheat is more obvious than on maize yields [4]. The high-intensity precipitation extremes have increased in the mid-hills of Nepal [18], indicating the high possibility of floods and landslides. These areas are highly prone to climatic hazards such as storms, landslides, floods and droughts impacting agriculture, water resources and socio-economic conditions [19]. For instance, the 2020 monsoonal flood in the Myagdi district, central Nepal, was unpredicted, resulting in several casualties and infrastructure damage (http://drrportal.gov.np/; accessed on 15 October 2022). Similarly, a recent massive, terrifying and unexpected unseasonal snow avalanche was reported in the Mustang area of GRB in November 2021 due to climate change, which killed 121 livestock [20]. In the adjacent basin of GRB (i.e., Koshi Basin), frequency and intensity of precipitation extremes such as the number of dry days, consecutive dry days and very wet days are projected to increase more over the southern plains than in the mountainous area [21]. The study of historical and projected temperature and precipitation and their extremes in GRB is an urgent need for initiating proper water resources and hazard planning management.
The few previous studies [13,22,23] in the GRB only focused on hydro-climatic variability in different periods. Nevertheless, none of the studies addressed future changes of precipitation and temperature and the resulting hydro-climatic extremes. Further, it is known that the spatio-temporal variation of regional precipitation and temperature characteristics are affected by several factors, such as ocean-atmospheric circulation patterns and geographical factors [24,25]. The present study firstly aims to unfold the historical pattern and trends of precipitation amount and temperature and their extreme values from 1985 to 2014 using records from climatological stations in the GRB. Secondly, the study will use the six-phase Coupled Model Intercomparison Project (CMIP6) that considers socio-economic pathways (SSPs) to understand the future changes in precipitation and temperature patterns and extremes over GRB. Additionally, this study explores the linkage between precipitation/temperature extremes and eight different climatic indices. In recent years, anthropogenic forcings such as aerosols and greenhouse gases have influenced the warming of air temperature and precipitation variability, leading to intensified precipitation and temperature extremes [26,27]. The CMIP6 has multiple models built on substantially improved emissions, land use scenarios, improved model parameterization and physical processes [28,29]. Therefore, we used multi-ensemble models derived from CMIP6 to project the precipitation amount and temperature and their extremes over GRB based on the three SSP scenarios (SSP1-2.6, SSP2-4.5 and SSP5-8.5). The results of this study will be helpful not only in understanding the future projections of precipitation and temperature but also to reveal the possible consequences from their variation with extreme values and further developing climate adaptation strategies and a hazard mitigation plan for the basin.

2. Materials and Methods

2.1. Study Area

GRB is one of the three major river basins (Karnali, Gandaki and Koshi) in Nepal, with an area of 32,057 km2, where the topography ranges from the plains (~70 m) in the south to the snow-capped high Himalaya (and trans-Himalayan areas) in the north. GRB is a transboundary basin that originates from the southern edge of the Tibetan Plateau and drains through Nepal into the Ganges river [13]. This basin has great religious, agricultural, touristic and socio-economic importance, where 4.5 million people inhabit the downstream areas [19].
The south Asian monsoon and western disturbances determine the climatology of the basin [16,30]. Spatial distribution of precipitation varies significantly, ranging between <500 and >2500 mm/year (Figure 1a). Further, the topography plays a significant role in the precipitation distribution as the windward side of the basin gets high precipitation, whereas the leeward side, i.e., the trans-Himalayan region, remains dry [18]. For example, high precipitation (>2500 mm/year) areas are observed in those stations located at the windward (Lumle areas) side of the basin and vice-versa. The monthly cycle of average precipitation and temperature of GRB during 1985–2014 reveals that June to September (summer season) are the hottest and wettest months (Figure 1b,c). Moreover, the observed mean temperature and precipitation in the basin were ~18 °C/month and ~182 mm/month, respectively, during 1985–2014 (Figure 1b,c).

2.2. Data and Methodology

We obtained the daily maximum, minimum air temperature and precipitation records from the Department of Hydrology and Meteorology (DHM), Government of Nepal (www.dhm.gov.np, accessed on 14 October 2022). The DHM collects and maintains the meteorological observation over Nepal. Initially, 39 meteorological stations with precipitation and temperature records over GRB were selected; however, some of these stations do not feature regular observation; thus, we performed quality control to discard those stations with more than 10% missing data. Additionally, we ran a homogeneity test to find the fluctuations in the data series using the RH test software package [31]. After the quality control, only 28 stations were found to be suitable for the current study (Figure 1a), which featured continuous temperature and precipitation data from 1985 to 2014.
13-biased corrected CMIP6 models with 0.25° × 0.25° spatial resolution over the GRB were used for the projection of precipitation and temperature. The ensemble of 13 bias-corrected CMIP6 models is listed in Table 1. All these biased corrected models were developed for the South Asian countries by Mishra et al. [28]. For the bias correction, gridded datasets from the Indian Meteorological Department (IMD) were used for the Indian region and data generated by Sheffield et al. [32] outside India. Each model consists of climatic projections under four Shared Socioeconomic Pathways scenarios (SSPs) (i.e., SSP1-2.6, SSP2-4.5, SSP3-7.0 and SSP5-8.5) for south Asia (India, Pakistan, Bangladesh, Sri Lanka, Bhutan and Nepal). This 13 bias-corrected model ensemble consists of daily precipitation (mm), maximum temperature (Tmax) and minimum temperature (Tmin) data from historical (1951–2014) to projected (2015–2100) periods; we have used these data under three scenarios. Following previous studies [33,34], we have selected three scenarios, i.e., SSP1-2.6, SSP2-4.5 and SSP5-8.5, representing the low, intermediate and high challenges for mitigation and adaptation, respectively [35]. All these datasets were downloaded from https://zenodo.org/record/3873998#.YKOjiqgzY2w, accessed on 12 March 2022. More details of the CMIP6 bias-correction procedures can be accessed from https://arxiv.org/abs/2006.12976, accessed on 12 March 2022.
Further, eight different ocean-atmospheric circulation indices were chosen by analyzing the relationship of ocean-atmospheric circulation and precipitation/temperature extremes in GRB. The eight large-scale oceanic and atmospheric circulation patterns used in current study, i.e., Atlantic Multidecadal Oscillation (AMO), North Atlantic Oscillation (NAO), Southern Oscillation Index (SOI), Pacific Decadal Oscillation (PDO), Arctic Oscillation (AO), Indian Ocean Dipole (IOD), Sea Surface Temperature (SST) and Nino3.4 sea surface temperature, were downloaded from the web portal of the Earth System Research Laboratory of the Physical Sciences Division of the United States National Oceanic and atmospheric administration (https://www.esrl.noaa.gov/psd/data/climateindices/list/, accessed on 16 August 2022).
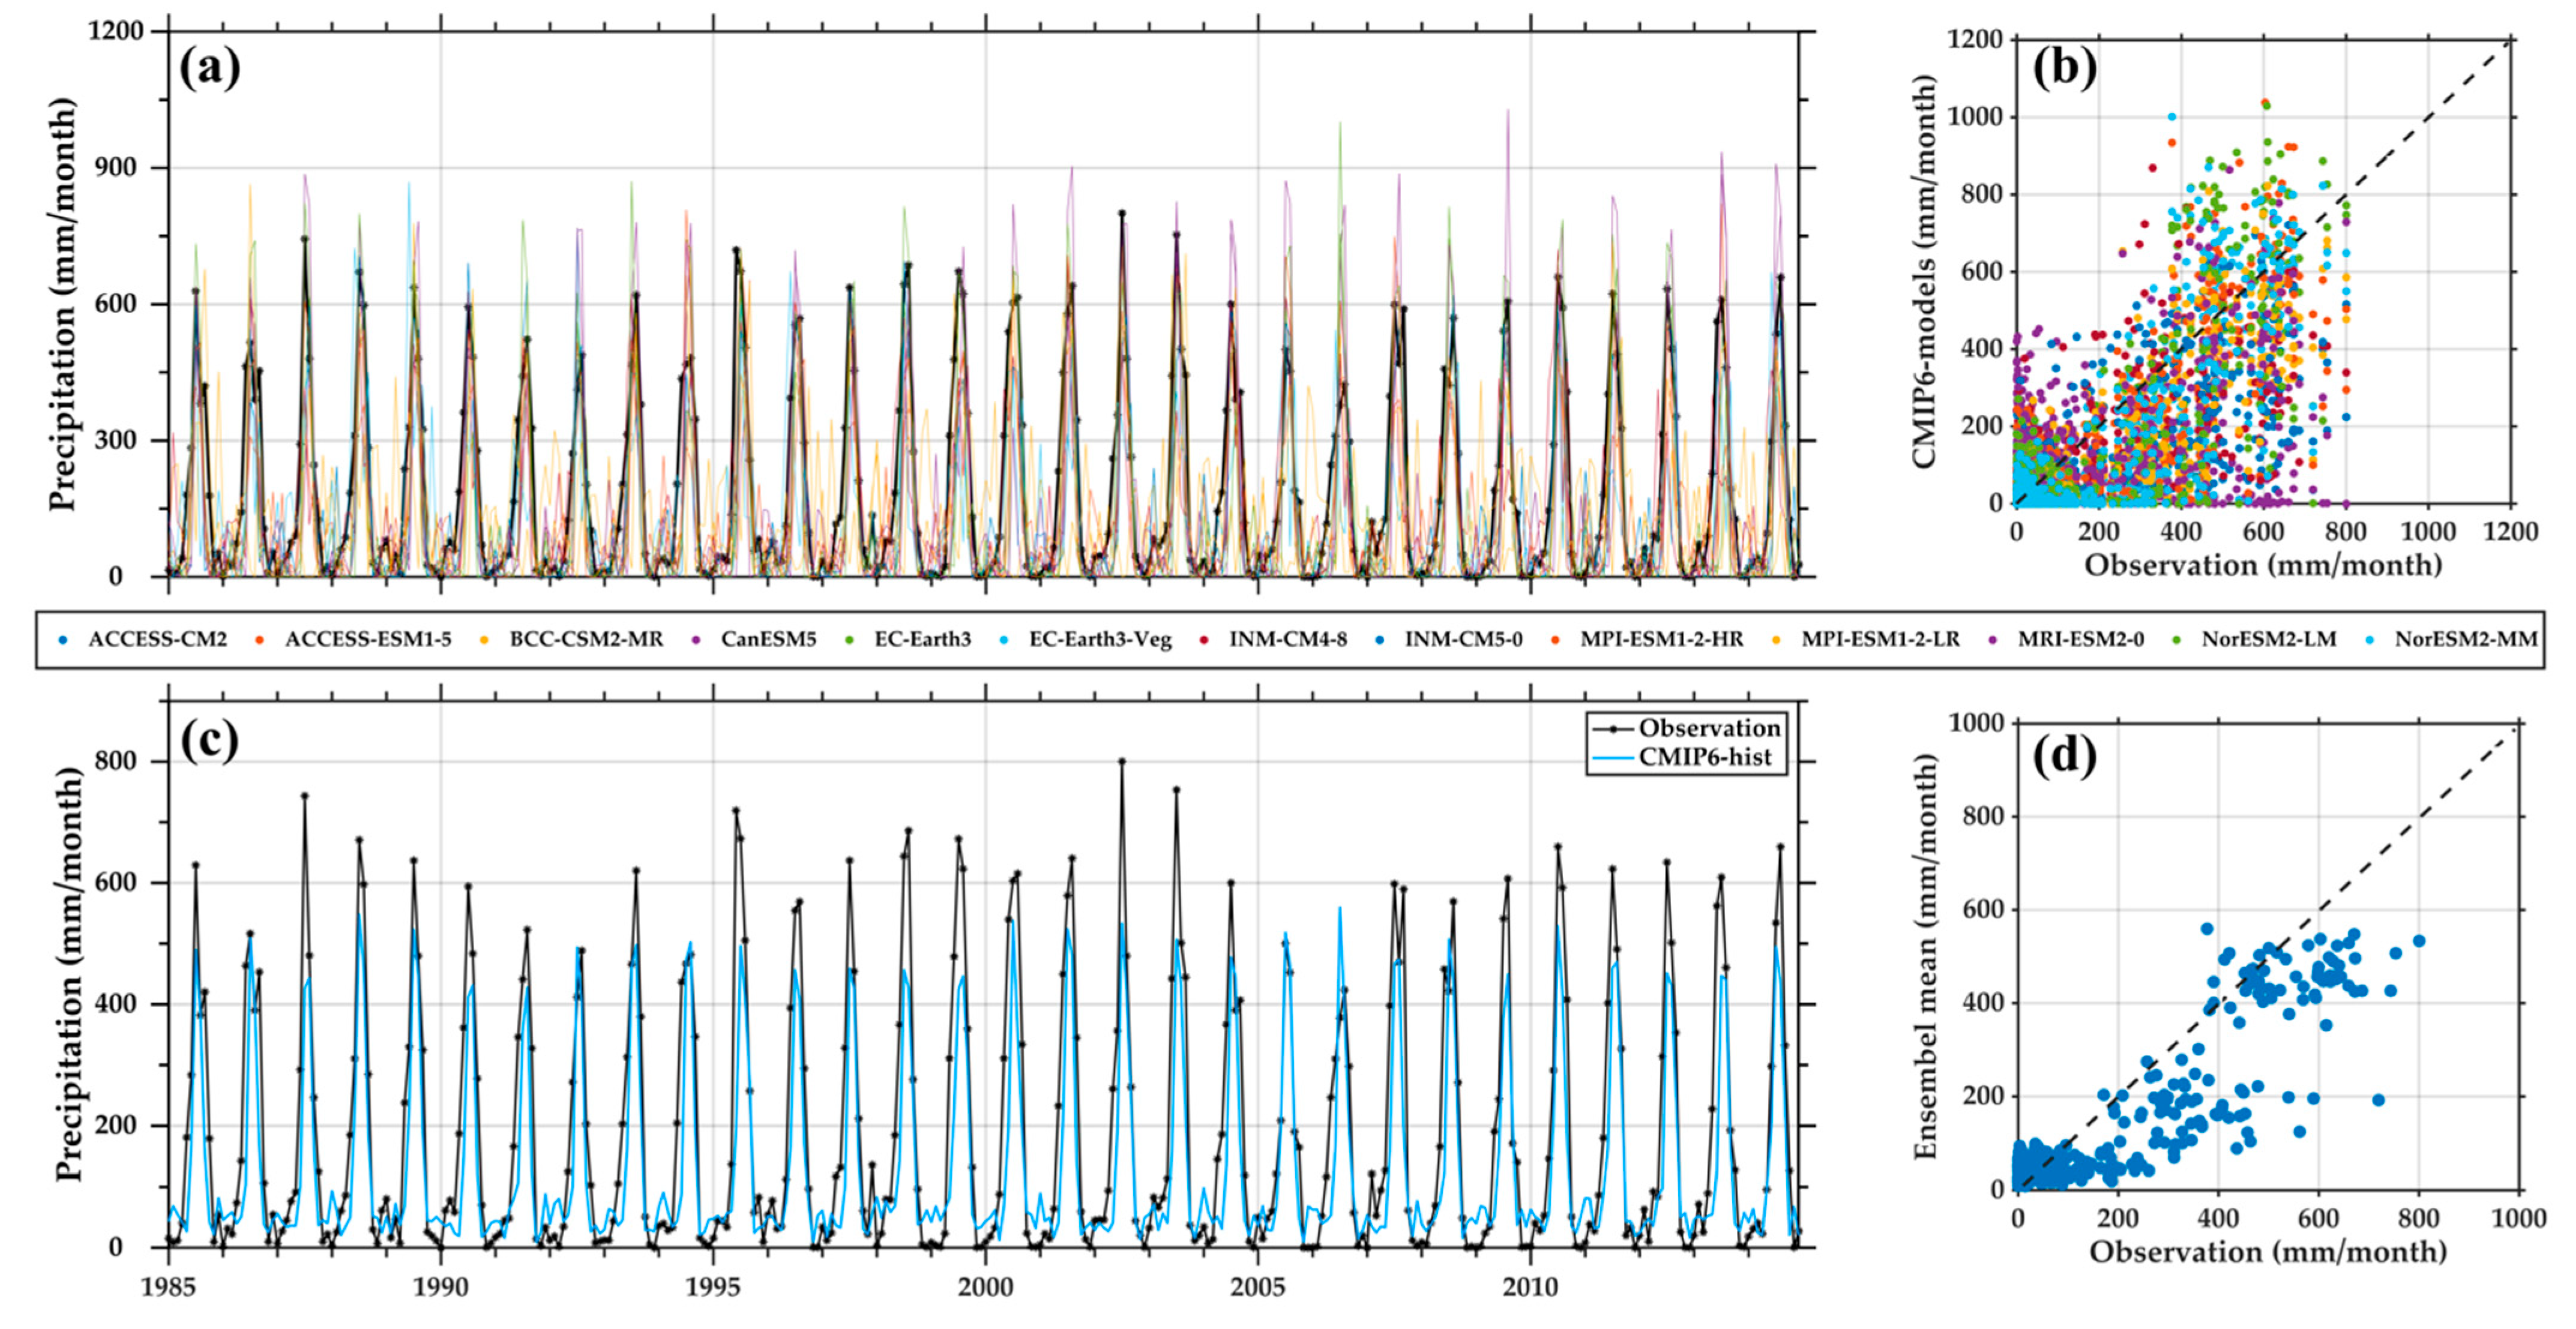
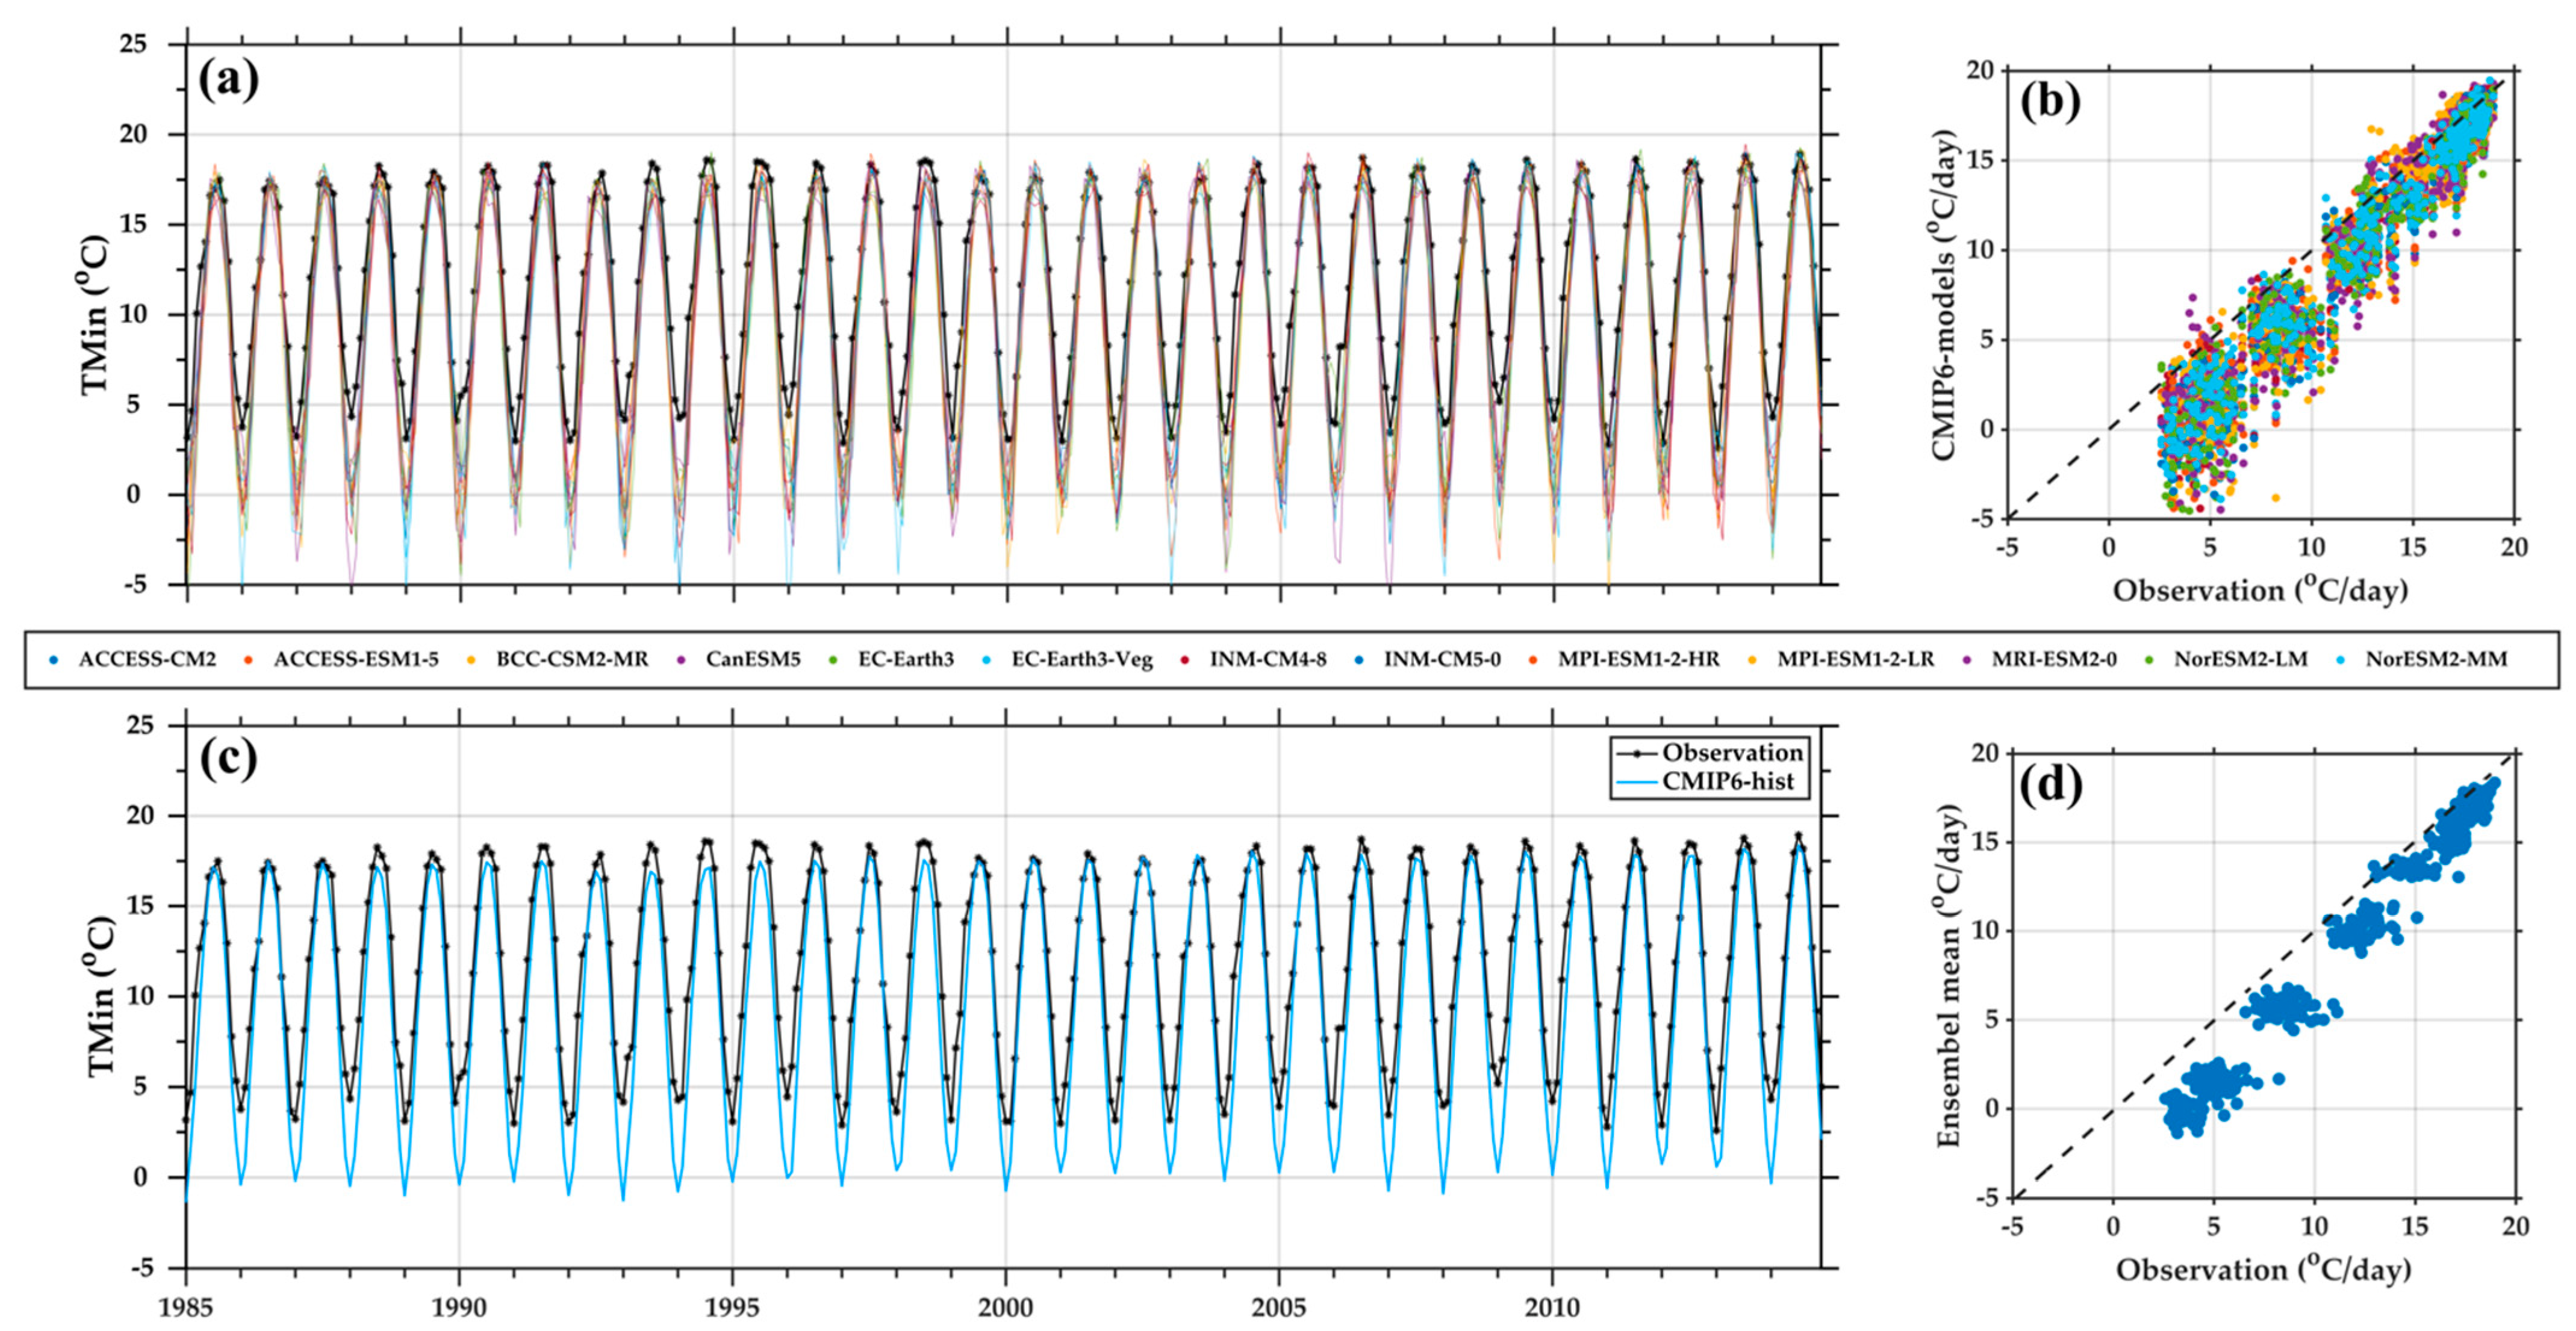
Firstly, the country scale CMIP6 models are extracted to station location over GRB using a point-to-pixel method and validated using observation datasets. Previously, Hamal et al. [33] and Sharma et al. [34] also validated each model (Table 1) using the observation data (precipitation and temperature) and found very consistent seasonal and annual variation and trends with an overall high correlation over Nepal. Further, we have analysed the performance of each model (Table 1) using precipitation, Tmax and Tmean over GRB (Figure A1, Figure A2 and Figure A3). Several statistics metrices (percentage bias, bias, correlation coefficient and root mean square error) are used to analyze the performance of each CMIP6 model (Table 1 and Table A1) using observed datasets over GRB during 1985–2014. The results indicate that each model performs differently in representing the observed precipitation, Tmax and Tmin. All models underestimated the observed precipitation (negative bias values in Table A1); however, they all represent the precipitation pattern over the study area (R > 0.8) (Table A1). Likewise, both Tmax and Tmin (Table A1) also showed similar performance. Comparison of temporal distribution of precipitation, Tmax and Tmin from observed and CMIP6 models are provided in Figure A1, Figure A2 and Figure A3, respectively. Additionally, the seasonal cycle of area-averaged mean temperature (Tmean), Tmax, Tmin and precipitation using CMIP6 historical and observation over GRB between 1985 and 2014 is shown in Figure 1b,c. CMIP6 slightly underestimated the monthly variation of the observed temperature and precipitation; however, the correlation of precipitation, Tmax, Tmin and Tmean during 1985–2014 is 0.94 (p < 0.01), 0.97 (p < 0.01), 0.96 (p < 0.01) and 0.96 (p < 0.01), respectively, indicating that CMIP6 can represent the precipitation and temperature variation over GRB (Figure 1b,c).
The linear trends for observed and projected Tmean, Tmin, Tmax and precipitation and their extreme indices were calculated to determine the magnitude variability for different seasons: pre-monsoon (March–May), summer (June–September), post-monsoon (October–November), winter (December–February) and annual timescales. The magnitude of these trends was calculated using Sen’s slope estimator [36], whereas the statistical significance of trends was established using Man Kendall’s tau test [37] at a confidence level of 90% and 95%.
Further, to analyze the future changes in response to past climatology, we have divided CMIP6 datasets into three different periods: near future (2015–2044), mid future (2045–2074) and distant future (2075–2100) compared with the historical means (1985–2014) as a reference period. For the extreme events, we have selected 23 ETCCDI (Experts Team on Climate Change Detection and Indices) indices (9 precipitation indices and 14 temperature indices) in the current study. Table 2 represents the selected indices and their definitions. More detail on these extremes can be found in references [16,18,38,39,40]. Additionally, to understand the influencing factor of extremes, precipitation/temperature extremes were correlated with the eight climatic indices mentioned above.

3. Results

3.1. Spatial Distribution of Precipitation, Temperature and their Trends

The spatial distribution of precipitation amount and temperature and their trends using the ensemble means of the 13 bias-corrected CMIP6 models during 1985–2014 generally shows a south-north variation (Figure 2). The highest precipitation (>2000 mm/year.) is measured in the foothills of the Himalayas, whereas the lowest precipitation (<1000 mm/year.) is in the trans-Himalayan range. Many of the stations received precipitation between 1000 to 2000 mm/year. (Figure 2a). The distribution is identical to observed precipitation (Figure 1a) with slight underestimation. Further, spatial distribution of Tmax reveals that most of the stations recorded temperature > 20 °C (Figure 2b) at lowlands and mid-hills whereas Tmax is below 10 °C in the high Himalayas. Tmin also shows similar distribution, below −5 °C in the high Himalayas and above 5 °C in lowlands and mid-hills (Figure 2c).
The Mann-Kendall (MK) statistical test and Sen’s Slope estimator were used to identify the historical trends (1985–2014) at each station. The spatial distribution of annual precipitation in Figure 2d shows an upward trend in all stations. The two stations with highest precipitation show the significant highest upward trend at a rate of >6 mm/year. Five stations in the eastern side show a non-significant increasing trend. The remaining stations in high Himalayas also show a significant increasing trend at a rate of 2–4 mm/year. The spatial distribution of Tmax (Figure 2e) and Tmin (Figure 2f) trends are significantly upward in all stations over GRB. Maximum upward trends are observed in the high Himalayan stations. Comparing the trends of Tmax and Tmin, the increment in Tmin is higher than Tmax, with highest increment rate in high Himalayan areas (>0.035 °C/year), indicating that these areas are at a higher risk of glacier melt and snow avalanches. Recently, at the end of September 2022, Manaslu avalanches in GRB took three lives with several injuries (https://english.onlinekhabar.com/manaslu-avalanche-3rd-death-2022.html, accessed on 7 October 2022). Similarly, a previous national-scale study [33] also reported the higher increment trend of Tmin rather than Tmax, validating the current results.
The seasonal and annual trend of precipitation and temperature over GRB for historical (1985 to 2014) and projected periods (2015–2100) are calculated in Table 3. In the reference period, the pre-monsoon (0.003 mm/year), monsoon (4.03 mm/year) and post-monsoon period (0.564 mm/year) showed an increasing precipitation trend, whereas significance was only observed for monsoon at a 95% confidence level. However, the winter precipitation showed an insignificant decreasing trend at a rate of −0.246 mm/year (Table 3). Since monsoon contributes ~80% of the annual precipitation [6], the annual precipitation was found to be significantly increasing at a rate of 4.98 mm/year (Table 3). Both Tmax and Tmin were also found to be significantly increasing for the reference period; however, the increment is higher for Tmin.
For the future period, annual and seasonal precipitation is increasing in all SSPs except for winter precipitation under SSP2-4.5 which is insignificantly decreasing. Similarly, Tmax and Tmin are likely to significantly increase in future under all three SSPs. Comparing all seasons, Tmin increment is higher for winter season under all SSPs. Likewise, Tmax increment is higher for winter season under all SSPs except for SSP2-4.5 in post-monsoon season. At an annual scale, results show that both Tmax and Tmin are increasing significantly; however, Tmin increment is higher than Tmax under all SSPs. The maximum increment of Tmin will expedite snow and glacier melt in future.
It is evident that precipitation amount and temperature were projected to be increasing under all SSP scenarios; therefore, their changes were studied in three future periods, i.e., near-future (2015–2044), mid-future (2045–2074), distant-future (2075–2100), compared with the reference period (1985–2014) (Figure 3). Under SSP1-2.6, the precipitation amount is likely to increase from 6% (near-future) to 13% (distant-future). As increment of Tmin is higher than Tmax (Figure 2e,f), the changes in Tmin are three times higher than Tmax (Figure 3a). However, the changes in mid-future and distant-future are almost similar. Since, Tmin and Tmax are increasing, simultaneously, Tmean was observed to be increasing at a rate of 6.9%, 10.9% and 10.9% in near-, mid- and distant-future periods, respectively. Under SSP2-4.5, precipitation will increase by 4.20, 12.35 and 15.94% in near-future, mid-future and distant- future, respectively (Figure 3b). Meanwhile, changes in Tmax are just under 10% in all three periods, whereas changes in Tmin are very high, i.e., ~11%, ~22% and 28% for near-, mid- and distant-future, respectively. The positive changes in Tmean are observed for all three periods from 7% in near-future to ~19% in the distant-future. The highest changes are observed under SSP5-8.5, with ~5%, ~20% and ~40% increment in precipitation for near-future, mid-future and distant-future, respectively than the reference period. Similarly, Tmax increased by 3.35% in the near-future, which will be likely to increase by 10% in mid-future and 17.15% in distant-future (Figure 3b). Among the three SSPs the highest changes are observed under SSP5-8.5 with more than 11, 30 and 50% in near-future, mid-future and distant-future in comparison to the historical period. Similar to Tmax and Tmin, the changes in Tmean are also highest under SSP5-8.5 with ~8% in near future, ~21% in mid-future and ~34% in distant-future (Figure 3c).
To sum up, under SSP1-2.6 and SSP2-4.5, the precipitation and temperature drastically changes from near-future to mid-future as compared to changes from mid-future to distant-future (Figure 3a,b). In contrast, under SSP5-8.5 the changes are higher from mid-future to distant-future (Figure 3c).

3.2. Precipitation and Temperature Extremes

Climate extremes can significantly impact different aspects of society. The extreme indices with unit as days generally represent the length of extremes whereas ones with mm (°C) represent the amount of extreme precipitation (temperature) (Table 2; last column). Thus, the present study aims to capture both duration and the amount of precipitation/temperature extremes over GRB. As precipitation and temperature show significant increment in future periods, we only calculated changes in precipitation/temperature extremes for near-future, mid-future and distant-future with reference to the historical period under SSP1-2.6, SSP4-4.5 and SSP5-8.5 scenarios (Figure 4 and Figure 5).
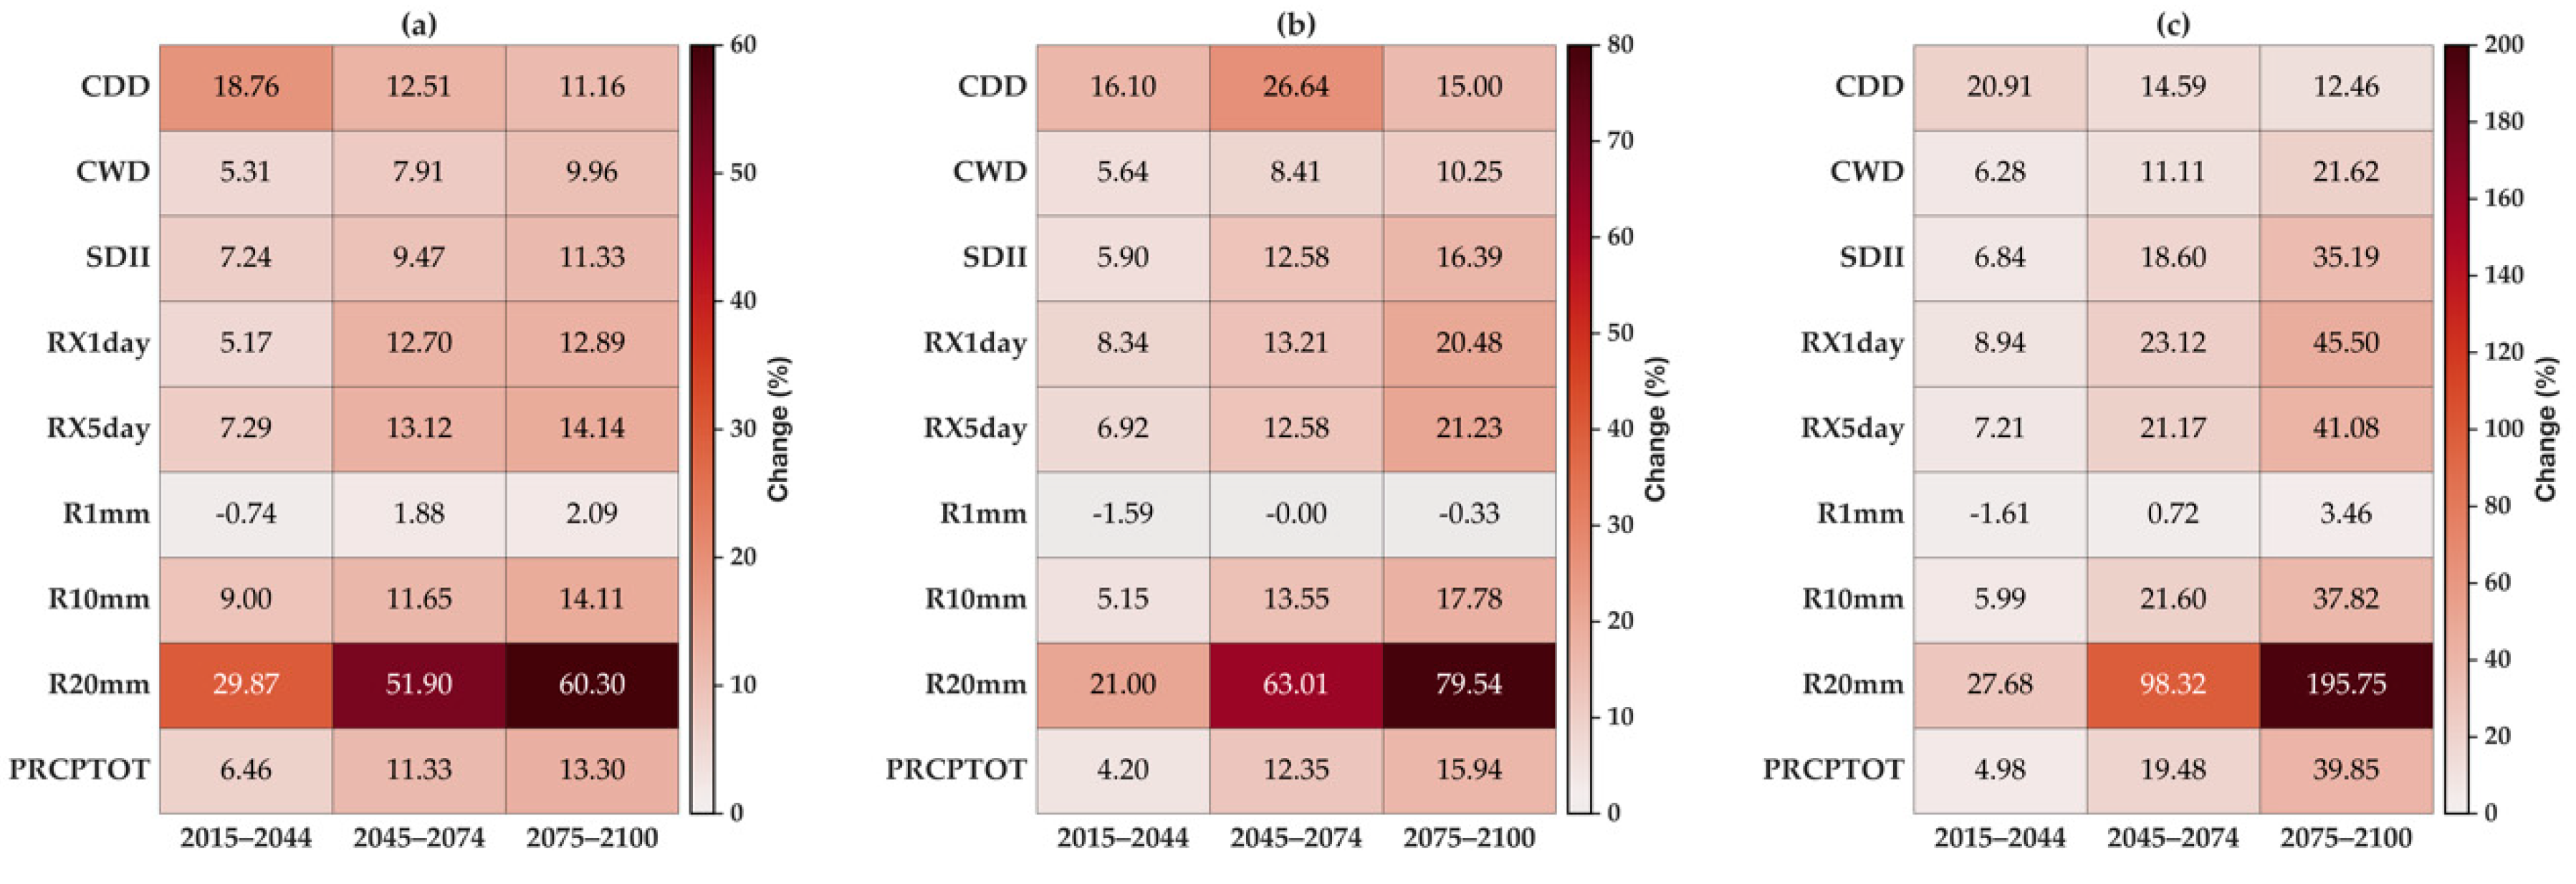
The results show that all precipitation indices show positive changes in near-, mid- and distant-future periods under all SSP scenarios except for R1 mm. R1 mm decreases nominally in near-future under all SSPs. Similarly, R1 mm slightly decreases in mid-and distant-future periods under SSP2-4.5 (Figure 4b) while it increases in other SSP scenarios (Figure 4a,c). Generally, the CDD increment is higher than CWD in all near- and mid-future periods in all scenarios indicating the possibilities of drought events in future. Moreover, a recent study has reported that drought events will increase till 2060s [34]. Among nine indicators, R20 mm displayed the highest ascending increment in all future periods under all SPPs with reference to the historical period. Similarly, precipitation total (PRCPTOT), RX1day, RX5day, SDII, R10 mm shows also an increasing trend from near- to distant-future under all SSPs (Figure 4). This indicates the high chances of flooding and precipitation induced hazards especially in mid- and distant-future.
Projected changes in temperature extremes were studied using 14 indices (Figure 5). Among them, DTR and cold related extremes i.e., FD, TMlt5 and TMlt10, displayed decrement while other indices displayed increment in future periods under all SSPs. The negative changes in DTR indicate that increase in Tmin is higher than Tmax. The negative changes in cold related extremes indicate that warming is increasing and simultaneously other warm-related extremes are observed to be increasing over GRB in all periods under all SSPs. The highest positive changes are observed for TMge30 followed by TR, TNm and TXn. In mid- and distant-future periods, TMge30 will increase by more than 100% in all SSPs. The decrement in cold extreme indices and increment in warm extreme indices indicate that it will affect agriculture, health and inducing extreme events such as heatwaves and snow avalanches in the GRB.

3.3. Correlation between Extreme Precipitation, Temperature Indices and Ocean-Atmospheric Circulation Patterns

Figure 6 shows the relationship between extreme precipitation indices and ocean-atmospheric circulation patterns on the annual scale over GRB from 1985 to 2014. In Figure 6, CWD and R1 mm has a weak negative correlation (nominal effect) with AMO while other extreme precipitation indices showed positive correlation. SDII, R10 mm and R20 mm and PRCPTOT have a strong positive relation with AMO, indicating that these extremes would increase with increasing AMO. It is interesting to note that CDD have no linear relation with AMO. NAO showed inverse relation with all indices expect RX5day and R1 mm. However, NAO has a weak effect on RX5day, R1 mm and CWD. The results show that impact of SOI and AO has limited effect on precipitation extremes. Further, PDO and NINO3.4 have strong negative effect on CWD, SDII, R1 mm, R10 mm and PRCPTOT indicating that increasing POD and NINO3.4 (regional temperature) is likely to decrease these extremes in GRB. IOD inversely influence CWD and R1 mm while directly influencing other extremes. The relationship between precipitation extremes and SST reveals that the SDII, R10 mm, R20 mm and PRCPTOT increased with increase in SST over GRB.
Figure 7 shows the relationship between 14 extreme temperature indices and eight ocean-atmospheric circulation patterns on the annual scale over GRB from 1985 to 2014. From Figure 7, it can be revealed that AMO, IOD and SST have inverse influence on DTR, FD, TMlt5 and TMlt10, while having a direct influence on remaining extreme temperature indices. Notably, AMO and SST have strong correlation with all extreme indices while other climatic indices have relatively limited correlation with extreme indices signifying that AMO and SST mostly modulates the temperature extremes in GRB. Similarly, NAO, SOI and AO display quite similar effects on temperature extremes showing positive relation with FD, TMlt5, TMlt10 and DTR and negative relation with other extreme indices. It can also be seen that relationship of AMO, IOD and SST with all extreme indices are opposite to those of the remaining climate indices and vice-versa. For example, relationship of DTR, FD, TNlt5 and TMlt10 with AMO, IOD and SST is negative while their relationship is positive with NAO, SOI, PDO, AO and NINO3.4. It is also observed that influence of PDO and NINO3.4 is very nominal on the temperature extremes over GRB.

4. Discussion

Precipitation and temperature are the two main variables in the climate system and their changes in mean conditions lead to climate change. This study analyzed the historical (1985–2014) and projected (2015–2100) changes in precipitation and temperature and their extremes under three SSP scenarios: SSP1-2.6, SSP2-4.5 and SSP5-8.5. The observed precipitation and temperature were computed from 28 climatic stations in GRB, Nepal and projected data from an ensemble means of 13 bias-corrected CMIP6 models. Historical CMIP6 overestimated the seasonal precipitation (except for monsoon) and temperature over the study area; however, the variation between CMIP6 and observation are almost identical, with an overall high correlation (Figure 1b,c). The altitudinal variation in the study region with orographical and local wind systems can significantly influence the precipitation distribution [24,41], which may create uncertainty in the performance of the CMIP6 models. Further, the biases from the variability of the model, different emission scenarios and climate systems contribute to the uncertainties in future climate projections [15]. For instance, the tropical Indian Ocean biases in climate models, e.g., the Indian Ocean Dipole (IOD)-like bias [42,43], are important for the historical and projected climates over the Indian monsoon region, which are not incorporated in the current climate models. Moreover, it is also reported that the estimation of temperature and precipitation from CMIP6 has improved over Nepal [33,34] and South Asia [15], leading to satisfactory performances in displaying climatology.
The changes in precipitation amount and frequency lead to regional and global impacts as they are an essential element of the climate system [44,45]. Several past studies have reported an increase in annual precipitation with changing climate in the Himalayan region [46,47]; similarly, our results also show a significant increase in annual and seasonal precipitation (1985–2014) in the GRB of central Himalaya. Our results of decreasing historical winter precipitation corroborate other studies displaying a decreasing trend of winter precipitation over most parts of Nepal; however, such a trend is significant only over the western middle mountains and hills [18]. At the seasonal and annual timescales, the minimum and maximum temperatures showed an increasing trend over the GRB from 1985 to 2014. Similarly, both the maximum and minimum temperatures have increased at the rate of 0.045 °C and 0.009 °C, respectively, between 1976 and 2015 in Nepal [48], which has also been reported in the recent study of Hamal et al. [33]. Further, the increase in Tmin than Tmax results in a decrease in DTR, with a significantly higher decrement in the monsoon (−0.020 °C/year) and post-monsoon (−0.012 °C/year) compared to winter (−0.003 °C/year) and pre-monsoon (−0.008 °C/year) over GRB. The result is in line with the previous study reporting that the pre-monsoon has a declining trend at a rate of 0.009 °C/year (p ≤ 0.01) during 1950–2020 over Nepal [33]. The results show that precipitation and temperature show in increasing trend in future scenarios; however, the increment is higher in the mid- and distant-future as compared to the near-future period. Thus, precipitation and temperature related hazards (such as floods, landslides, heatwaves, snow avalanches) are likely to be more pronounced after the 2040s.
The future projection of increasing monsoon precipitation, RX5day, PRCPTOT, R10 mm and R20 mm events and CWD spells in the GRB indicates that the basin will be affected by flash floods, floods and landslides that eventually will have a higher impact on downstream areas [16]. The future projection shows the decline in winter precipitation and thus the increment in CDD spells might impact water availability, prolonged drought conditions and favorable conditions for forest-fire incidents [49]. However, the length of the wet spell is expected to increase, whereas the dry spell is expected to decrease in future periods, similar to the results reported in the nearby Koshi basin [50]. The decrease in DTR might be related to changes in precipitation, solar radiation, soil moisture, snow cover and cloud cover [33,51,52]. For instance, the high cloud cover reduces DTR by dampening the diurnal cycle of radiation balance [53,54]. Further, a higher increment in Tmin than that in Tmax is projected, resulting in a decrease in DTR. This decreased DTR can affect human health, causing cardiovascular diseases that can increase the mortality rate [55,56]. Furthermore, it can also impact the growth and development of crops and overall yield [57]. This study also showed that warm summer days and tropical nights are projected to increase, whereas frosty days are projected to decrease. Such conditions might lead to extremely hot conditions by the end of this century, and similar conditions have also been reported over the South Asian region [58]. The increment in warm summer days and nights along with TMge30 will increase the feeling of discomfort in citizens and may increase energy demand and consumption, especially for cooling [59].
Ocean-atmospheric circulation patterns affect the spatial and temporal variations of temperature and precipitation in the GRB. The increment in these atmospheric circulation patterns in future might exaggerate the temperature and precipitation related extremes. Over the study area, AMO, SST and PDO are the dominant circulation patterns for extreme temperature whereas AMO, SST and SOI were dominant for extreme precipitation events during 1985–2014. For instance, the increase in SST would lead to higher increase in high-intensity related precipitation extremes (R10 mm, R20 mm, PRCPTOT and SDII) and warming related temperature extremes. The regional climate could be indirectly affected by PDO due to its influence on ENSO in Nepal [6].
The present study performed spatial and temporal analysis of the mean value of the climate extremes in the GRB and their relationship with climatic indices. Future studies should focus on the changes in precipitation and temperature extremities along with their detailed driving forces using high resolution climatic models.

5. Summary and Conclusions

Gandaki River Basin (GRB), a mountainous river basin, is highly vulnerable to climate change, impacting socio-economic, agriculture and water resources. Therefore, this study investigated the historical (1985–2014) and projected (2015–2100) precipitation and temperature and their extremes over the GRB using observation and 13 bias-corrected CMIP6 models. The MK statistical test and Sen’s Slope estimator were performed to present the existing trend and magnitudes of precipitation, temperature and their extremes. Further, extreme precipitation and temperature events were studied in relationship to large-scale ocean-atmospheric circulation patterns.
The historical period shows a significant increasing trend in monsoon precipitation at 4.03 mm/year. The future projection shows an increasing precipitation trend for all seasons under SSP1-2.6, SSP2-4.5 and SSP5-8.5 scenarios. Similarly, Tmin and Tmax were found to be increasing at annual and seasonal scale with higher increments of Tmin than Tmax in future periods. The results show that the positive changes in precipitation and temperature will be higher after 2045. Further, all the precipitation extremes indices were projected to increase in future periods under all SSPs. Among nine precipitation extreme indices, the changes in CDD spells are higher in near- (2015–2044) and mid-future (2045–2074) compared to distant-future period (2075–2100), while other indices show ascending increment from near- to distant-future period. This indicates that the increase in monsoon precipitation and precipitation extremes will increase the discharge in rivers which might cause summer flash floods over GRB in the future. Furthermore, increment in CDD spells in near- and mid-future might exacerbate prolonged drought conditions leading to water stress and crop failure.
Along with the increment of temperature, cold related temperature extremes (FD, DTR, TMlt5, TMlt10) were projected to decrease while warm related extremes are likely to increase under all SSPs. In future periods, the changes in days with Tmax ≥ 30 °C (TMge30) and Tmin ≥ 20 °C (TR) will be higher. Enhanced future warming is likely to further accelerate the melting of glaciers and snow, severely impacting mountain ecosystem, irrigation and water resource management over the GRB. Moreover, cases of snow avalanche might increase in the high-altitude areas of GRB, threatening settlements and livestock. Further, the result also shows that the changes in precipitation and temperature extremes are affected by large-scale ocean-atmospheric circulation patterns in GRB during 1985–2014. Among nine climatic indices studied, AMO, SST and PDO are dominant in driving extreme temperature whereas AMO, SST and SOI are dominant driving factors for extreme precipitation in the GRB. Thus, it can be concluded that the increment in these circulation patterns in future would exaggerate the spatio-temporal climatic extremes in the basin.
The results presented in this study will help to better understand the projected precipitation and temperature patterns, trends and their extremes, eventually helping climate impact studies and adaptation strategies for the study region. Further, future climatic extremes can be predicted based on changes in the large-scale ocean-atmospheric circulation patterns.

Author Contributions

Conceptualization, methodology, software, validation, formal analysis, writing—original draft preparation, K.P.S.; writing—review and editing, N.P.G., B.P. and B.D.; supervision, B.D.; project administration, K.P.S.; funding acquisition and resources, B.P. All authors have read and agreed to the published version of the manuscript.

Funding

This research was partly funded by the research grants from the Nepal Academy of Science and Technology (NAST). We also acknowledge funding support from an Imperial College Research Fellowship (ICRF).

Institutional Review Board Statement

Not applicable.

Informed Consent Statement

Not applicable.

Data Availability Statement

The observed datasets (precipitation and temperature) used in this study can be purchased from the Department of Hydrology and Meteorology, Government of Nepal (www.dhm.gov.np, accessed on 14 October 2022). The bias-corrected CMIP6 data for South Asian countries can be freely obtained from https://zenodo.org/record/3873998#.YIujNGYzYTs, accessed on 12 March 2022.

Acknowledgments

Mishra et al. (2020) and the Department of Hydrology and Meteorology, Government of Nepal, are greatly acknowledged for providing bias-corrected CMIP6 and observed data for Nepal. Rocky Talchabhadel is also acknowledged for providing an idea of the extreme indices. We would also like to thank several anonymous reviewers for their constructive comments on an earlier version of the paper.

Conflicts of Interest

The authors declare no conflict of interest.

Appendix A

Table A1. Statistical metrics to quantify the performance of 13 bias corrected CMIP6 models.
CMIP6-ModelsStatistical MetricsBIASRRMSEPbias (%)
ACCESS-CM2Precipitation (mm)−10.670.90173.386.07
Tmax (°C)−2.850.923.3312.85
Tmin (°C)−2.000.972.5920.50
ACCESS-ESM1-5Precp (mm)−42.110.85129.7429.14
Tmax (°C)−2.800.933.2812.59
Tmin (°C)−2.200.982.8023.03
BCC-CSM2-MRPrecp (mm)−50.070.89138.6236.66
Tmax (°C)−2.890.923.4013.04
Tmin (°C)−2.350.963.0825.12
CanESM5Precp (mm)−55.630.81261.0842.46
Tmax (°C)−2.530.873.4511.25
Tmin (°C)−1.940.962.6419.87
EC-Earth3Precp (mm)−47.730.82138.6434.36
Tmax (°C)−2.730.913.3612.24
Tmin (°C)−2.140.972.8522.26
EC-Earth3-VegPrecp (mm)−50.670.83134.7737.26
Tmax (°C)−2.850.923.4212.82
Tmin (°C)−2.180.972.8222.84
INM-CM4-8Precp (mm)−53.820.80160.8140.51
Tmax (°C)−2.720.913.3312.20
Tmin (°C)−2.170.982.8222.75
INM-CM5-0Precp (mm)−50.470.85148.3037.06
Tmax (°C)−2.770.923.3412.43
Tmin (°C)−2.240.982.8323.63
MPI-ESM1-2-HRPrecp (mm)−55.320.80138.8742.12
Tmax (°C)−2.780.923.2912.51
Tmin (°C)−2.180.972.8322.77
MPI-ESM1-2-LRPrecp (mm)−54.760.83129.6041.52
Tmax (°C)−2.720.903.3812.18
Tmin (°C)−2.090.962.8621.72
MRI-ESM2-0Precp (mm)−51.510.84150.4338.12
Tmax (°C)−2.960.913.5813.41
Tmin (°C)−2.310.963.0524.46
NorESM2-LMPrecp (mm)−39.730.94167.4327.04
Tmax (°C)−3.020.893.6713.72
Tmin (°C)−2.320.973.0324.67
NorESM2-MMPrecp (mm)−48.940.86139.9235.54
Tmax (°C)−2.830.903.4012.74
Tmin (°C)−2.140.982.7322.28
Ensemble meanPrecp (mm)−47.040.85154.7434.45
Tmax (°C)−2.800.913.4012.61
Tmin (°C)−2.170.972.8422.76
Figure A1. Performance comparison of monthly precipitation from (a,b) observation and 13 CMIP6 models and (c,d) observation and mean ensemble of 13 CMIP6 models. Black dash line in panel b and d represents the 1:1 line. Note: Ensemble members in panel a and b are represented by same color.
Atmosphere 13 01866 g0a1
Figure A2. Performance comparison of maximum temperature from (a,b) observation and 13 CMIP6 models and (c,d) observation and mean ensemble of 13 CMIP6 models. Black dash line in panel b and d represents the 1:1 line. Note: Ensemble members in panel a and b are represented by same color.
Atmosphere 13 01866 g0a2
Figure A3. Performance comparison of minimum temperature from (a,b) observation and 13 CMIP6 models and (c,d) observation and mean ensemble of 13 CMIP6 models. Black dash line in panel b and d represents the 1:1 line. Note: Ensemble members in panel a and b are represented by same color.
Atmosphere 13 01866 g0a3

References

  1. Hay, J.; Mimura, N. The changing nature of extreme weather and climate events: Risks to sustainable development. Geomat. Nat. Hazards Risk 2010, 1, 3–18. [Google Scholar] [CrossRef]
  2. Stocker, T. Climate Change 2013: The Physical Science Basis: Working Group I contribution to the Fifth Assessment Report of the InterGovernmental Panel on Climate Change; Cambridge University Press: Cambridge, UK, 2014. [Google Scholar]
  3. Sharma, S.; Hamal, K.; Khadka, N.; Shrestha, D.; Aryal, D.; Thakuri, S. Drought characteristics over Nepal Himalaya and their relationship with climatic indices. Meteorol. Appl. 2021, 28, e1988. [Google Scholar] [CrossRef]
  4. Hamal, K.; Sharma, S.; Khadka, N.; Haile, G.G.; Joshi, B.B.; Xu, T.; Dawadi, B. Assessment of drought impacts on crop yields across Nepal during 1987–2017. Meteorol. Appl. 2020, 27, e1950. [Google Scholar] [CrossRef]
  5. Azhar, G.S.; Mavalankar, D.; Nori-Sarma, A.; Rajiva, A.; Dutta, P.; Jaiswal, A.; Sheffield, P.; Knowlton, K.; Hess, J.J. Heat-related mortality in India: Excess all-cause mortality associated with the 2010 Ahmedabad heat wave. PLoS ONE 2014, 9, e91831. [Google Scholar] [CrossRef] [PubMed]
  6. Sharma, S.; Hamal, K.; Khadka, N.; Joshi, B.B.J.T.; Climatology, A. Dominant pattern of year-to-year variability of summer precipitation in Nepal during 1987–2015. Meteorol. Appl. 2020, 142, 1071–1084. [Google Scholar] [CrossRef]
  7. Naveendrakumar, G.; Vithanage, M.; Kwon, H.-H.; Chandrasekara, S.; Iqbal, M.; Pathmarajah, S.; Fernando, W.; Obeysekera, J. South Asian perspective on temperature and rainfall extremes: A review. Atmos. Res. 2019, 225, 110–120. [Google Scholar] [CrossRef]
  8. Maharana, P.; Agnihotri, R.; Dimri, A.P. Changing Indian monsoon rainfall patterns under the recent warming period 2001–2018. Clim. Dyn. 2021, 57, 2581–2593. [Google Scholar] [CrossRef]
  9. Talchabhadel, R.; Karki, R.; Thapa, B.R.; Maharjan, M.; Parajuli, B. Spatio-temporal variability of extreme precipitation in Nepal. Int. J. Climatol. 2018, 38, 4296–4313. [Google Scholar] [CrossRef]
  10. Xu, Y.; Wu, X.; Kumar, R.; Barth, M.; Diao, C.; Gao, M.; Lin, L.; Jones, B.; Meehl, G.A. Substantial Increase in the Joint Occurrence and Human Exposure of Heatwave and High-PM Hazards Over South Asia in the Mid-21st Century. AGU Adv. 2020, 1, e2019AV000103. [Google Scholar] [CrossRef] [Green Version]
  11. Huo-Po, C.; Jian-Qi, S.; Xiao-Li, C.J.A.; Letters, O.S. Future changes of drought and flood events in China under a global warming scenario. Atmos. Ocean. Sci. Lett. 2013, 6, 8–13. [Google Scholar] [CrossRef]
  12. Nandargi, S.; Dhar, O. Extreme rainfall events over the Himalayas between 1871 and 2007. Hydrol. Sci. J. 2011, 56, 930–945. [Google Scholar] [CrossRef] [Green Version]
  13. Panthi, J.; Dahal, P.; Shrestha, M.L.; Aryal, S.; Krakauer, N.Y.; Pradhanang, S.M.; Lakhankar, T.; Jha, A.K.; Sharma, M.; Karki, R. Spatial and temporal variability of rainfall in the Gandaki River Basin of Nepal Himalaya. Climate 2015, 3, 210–226. [Google Scholar] [CrossRef] [Green Version]
  14. DHM. Observed Climate Trend Analysis in the Districts and Physiographic Regions of Nepal (1971–2014). Dep. Hydrol. Meteorol. Kathmandu 2017, 1, 74. [Google Scholar]
  15. Almazroui, M.; Saeed, S.; Saeed, F.; Islam, M.N.; Ismail, M. Projections of precipitation and temperature over the South Asian countries in CMIP6. Earth Syst. Environ. 2020, 4, 297–320. [Google Scholar] [CrossRef]
  16. Sharma, S.; Khadka, N.; Hamal, K.; Baniya, B.; Luintel, N.; Joshi, B.B. Spatial and Temporal Analysis of Precipitation and Its Extremities in Seven Provinces of Nepal (2001–2016). Appl. Ecol. Environ. Sci. 2020, 8, 64–73. [Google Scholar]
  17. Dahal, P.; Shrestha, N.S.; Shrestha, M.L.; Krakauer, N.Y.; Panthi, J.; Pradhanang, S.M.; Jha, A.; Lakhankar, T.J.N.H. Drought risk assessment in central Nepal: Temporal and spatial analysis. Nat. Hazards 2016, 80, 1913–1932. [Google Scholar] [CrossRef] [Green Version]
  18. Karki, R.; Schickhoff, U.; Scholten, T.; Böhner, J. Rising precipitation extremes across Nepal. Climate 2017, 5, 4. [Google Scholar] [CrossRef] [Green Version]
  19. Oglethorpe, J.; Regmi, S.; Bartlett, R.; Dongol, B.S.; Wikramanayake, E.; Freeman, S. The value of a river basin approach in climate adaptation. Organizers 2015, 57. [Google Scholar]
  20. (RSS), R.S.S. Over 120 Yaks Missing in Mustang Avalanche. Onlinekhaber 2021. Available online: https://english.onlinekhabar.com/yaks-mustang-avalanche.html#:~:text=Out%20of%20a%20total%20of,however%2C%20have%20come%20to%20contact (accessed on 17 January 2022).
  21. Rajbhandari, R.; Shrestha, A.B.; Nepal, S.; Wahid, S.; Ren, G.-Y. Extreme climate projections over the transboundary Koshi River Basin using a high resolution regional climate model. Adv. Clim. Chang. Res. 2017, 8, 199–211. [Google Scholar] [CrossRef]
  22. Parajuli, A.; Devkota, L.P.; Adhikari, T.R.; Dhakal, S.; Kayastha, R.B. Impact of Climate change on river discharge and rainfall pattern: A case study from Marshyangdi River basin, Nepal. J. Hydrol. Meteorol. 2015, 9, 60–73. [Google Scholar] [CrossRef] [Green Version]
  23. Manandhar, S.; Pandey, V.P.; Kazama, F. Hydro-climatic trends and people’s perceptions: Case of Kali Gandaki River Basin, Nepal. Clim. Res. 2012, 54, 167–179. [Google Scholar] [CrossRef]
  24. Sharma, S.; Khadka, N.; Nepal, B.; Ghimire, S.K.; Luintel, N.; Hamal, K. Elevation Dependency of Precipitation over Southern Slope of Central Himalaya. Jalawaayu 2021, 1, 1–14. [Google Scholar] [CrossRef]
  25. Hamal, K.; Sharma, S.; Baniya, B.; Khadka, N.; Zhou, X. Inter-Annual Variability of Winter Precipitation Over Nepal Coupled With Ocean-Atmospheric Patterns during 1987–2015. Front. Earth Sci. 2020, 8, 161. [Google Scholar] [CrossRef]
  26. Madakumbura, G.D.; Thackeray, C.W.; Norris, J.; Goldenson, N.; Hall, A. Anthropogenic influence on extreme precipitation over global land areas seen in multiple observational datasets. Nat. Commun. 2021, 12, 3944. [Google Scholar] [CrossRef] [PubMed]
  27. Paik, S.; Min, S.K.; Zhang, X.; Donat, M.G.; King, A.D.; Sun, Q. Determining the anthropogenic greenhouse gas contribution to the observed intensification of extreme precipitation. Geophys. Res. Lett. 2020, 47, e2019GL086875. [Google Scholar] [CrossRef]
  28. Mishra, V.; Bhatia, U.; Tiwari, A.D. Bias-corrected climate projections for South Asia from coupled model intercomparison project-6. Sci. Data 2020, 7, 1–13. [Google Scholar] [CrossRef]
  29. Riahi, K.; Van Vuuren, D.P.; Kriegler, E.; Edmonds, J.; O’neill, B.C.; Fujimori, S.; Bauer, N.; Calvin, K.; Dellink, R.; Fricko, O. The shared socioeconomic pathways and their energy, land use, and greenhouse gas emissions implications: An overview. Glob. Environ. Chang. 2017, 42, 153–168. [Google Scholar] [CrossRef] [Green Version]
  30. Hamal, K.; Sharma, S.; Khadka, N.; Baniya, B.; Ali, M.; Shrestha, M.S.; Xu, T.; Shrestha, D.; Dawadi, B. Evaluation of MERRA-2 precipitation products using gauge observation in Nepal. Hydrology 2020, 7, 40. [Google Scholar] [CrossRef]
  31. Core Team, R. R: A Language and Environment for Statistical Computing; R Foundation for Statistical Computing: Vienna, Austria, 2013. [Google Scholar]
  32. Sheffield, J.; Goteti, G.; Wood, E.F. Development of a 50-year high-resolution global dataset of meteorological forcings for land surface modeling. J. Clim. 2006, 19, 3088–3111. [Google Scholar] [CrossRef] [Green Version]
  33. Hamal, K.; Sharma, S.; Talchabhadel, R.; Ali, M.; Dhital, Y.P.; Xu, T.; Dawadi, B. Trends in the Diurnal Temperature Range over the Southern Slope of Central Himalaya: Retrospective and Prospective Evaluation. Atmosphere 2021, 12, 1683. [Google Scholar] [CrossRef]
  34. Sharma, S.; Hamal, K.; Khadka, N.; Ali, M.; Subedi, M.; Hussain, G.; Ehsan, M.A.; Saeed, S.; Dawadi, B. Projected Drought Conditions over Southern Slope of the Central Himalaya Using CMIP6 Models. Earth Syst. Environ. 2021, 5, 849–859. [Google Scholar] [CrossRef]
  35. Li, S.-Y.; Miao, L.-J.; Jiang, Z.-H.; Wang, G.-J.; Gnyawali, K.R.; Zhang, J.; Zhang, H.; Fang, K.; He, Y.; Li, C. Projected drought conditions in Northwest China with CMIP6 models under combined SSPs and RCPs for 2015–2099. Adv. Clim. Chang. Res. 2020, 11, 210–217. [Google Scholar] [CrossRef]
  36. Sen, P.K. Estimates of the regression coefficient based on Kendall’s tau. J. Am. Stat. Assoc. 1968, 63, 1379–1389. [Google Scholar] [CrossRef]
  37. Kendall, M.G. A new measure of rank correlation. Biometrika 1938, 30, 81–93. [Google Scholar] [CrossRef]
  38. Sharma, S.; Khadka, N.; Hamal, K.; Shrestha, D.; Talchabhadel, R.; Chen, Y. How Accurately Can Satellite Products (TMPA and IMERG) Detect Precipitation Patterns, Extremities, and Drought across the Nepalese Himalaya? Earth Space Sci. 2020, 7, e2020EA001315. [Google Scholar] [CrossRef]
  39. Talchabhadel, R.; Aryal, A.; Kawaike, K.; Yamanoi, K.; Nakagawa, H. A comprehensive analysis of projected changes of extreme precipitation indices in West Rapti River basin, Nepal under changing climate. Int. J. Climatol. 2020, 41, E2581–E2599. [Google Scholar] [CrossRef]
  40. Talchabhadel, R.; Sharma, S.; Khadka, N.; Hamal, K.; Karki, S.; Thapa, B.R. An outlook on the applicability of satellite precipitation products for monitoring extreme precipitation events in Nepal Himalaya. Weather 2022, 41, E2581–E2599. [Google Scholar] [CrossRef]
  41. Chen, Y.; Sharma, S.; Zhou, X.; Yang, K.; Li, X.; Niu, X.; Hu, X.; Khadka, N. Spatial performance of multiple reanalysis precipitation datasets on the southern slope of central Himalaya. Atmos. Res. 2021, 250, 105365. [Google Scholar] [CrossRef]
  42. Li, G.; Xie, S.-P.; He, C.; Chen, Z. Western Pacific emergent constraint lowers projected increase in Indian summer monsoon rainfall. Nat. Clim. Chang. 2017, 7, 708–712. [Google Scholar] [CrossRef]
  43. Long, S.-M.; Li, G.; Hu, K.; Ying, J. Origins of the IOD-like Biases in CMIP Multimodel Ensembles: The Atmospheric Component and Ocean–Atmosphere Coupling. J. Clim. 2020, 33, 10437–10453. [Google Scholar] [CrossRef]
  44. Duncan, J.M.; Biggs, E.M.; Dash, J.; Atkinson, P.M. Spatio-temporal trends in precipitation and their implications for water resources management in climate-sensitive Nepal. Appl. Geogr. 2013, 43, 138–146. [Google Scholar] [CrossRef]
  45. Smalley, M.; L’Ecuyer, T. A global assessment of the spatial distribution of precipitation occurrence. J. Appl. Meteorol. Climatol. 2015, 54, 2179–2197. [Google Scholar] [CrossRef]
  46. Ren, Y.-Y.; Ren, G.-Y.; Sun, X.-B.; Shrestha, A.B.; You, Q.-L.; Zhan, Y.-J.; Rajbhandari, R.; Zhang, P.-F.; Wen, K.-M. Observed changes in surface air temperature and precipitation in the Hindu Kush Himalayan region over the last 100-plus years. Adv. Clim. Chang. Res. 2017, 8, 148–156. [Google Scholar] [CrossRef]
  47. Shrestha, A.B.; Wake, C.P.; Dibb, J.E.; Mayewski, P.A. Precipitation fluctuations in the Nepal Himalaya and its vicinity and relationship with some large scale climatological parameters. Int. J. Climatol. 2000, 20, 317–327. [Google Scholar] [CrossRef]
  48. Thakuri, S.; Dahal, S.; Shrestha, D.; Guyennon, N.; Romano, E.; Colombo, N.; Salerno, F. Elevation-dependent warming of maximum air temperature in Nepal during 1976–2015. Atmos. Res. 2019, 228, 261–269. [Google Scholar] [CrossRef]
  49. Shankar Sharma and Binod Pokharel. Nepal under Severe Drought Condition, (Newspaper Article, The Himalayan Times, 3rd March, 2021). Available online: https://thehimalayantimes.com/opinion/nepal-under-severe-drought-condition-winter-crops-affected (accessed on 12 April 2021).
  50. Agarwal, A.; Babel, M.S.; Maskey, S. Analysis of future precipitation in the Koshi river basin, Nepal. J. Hydrol. 2014, 513, 422–434. [Google Scholar] [CrossRef]
  51. Waqas, A.; Athar, H.; Shahzad, M.I. Recent variability of the observed diurnal temperature range in the Karakoram and its surrounding mountains of northern Pakistan. In Proceedings of the 2016 AGU Fall Meeting, San Francisco, CA, USA, 12–16 December 2016. [Google Scholar]
  52. Durre, I. Factors Influencing the Diurnal Temperature Range in the Contiguous United States; University of Washington: Washington, DC, USA, 2000. [Google Scholar]
  53. Pyrgou, A.; Santamouris, M.; Livada, I. Spatiotemporal analysis of diurnal temperature range: Effect of urbanization, cloud cover, solar radiation, and precipitation. Climate 2019, 7, 89. [Google Scholar] [CrossRef] [Green Version]
  54. Change, C. Working Group I: The Scientific Basis. Third Assessment Report of the Intergovernmental Panel on Climate Change; Cambridge University Press: Cambridge, UK, 2001. [Google Scholar]
  55. Lee, W.-H.; Lim, Y.-H.; Dang, T.N.; Seposo, X.; Honda, Y.; Guo, Y.-L.L.; Jang, H.-M.; Kim, H. An investigation on attributes of ambient temperature and diurnal temperature range on mortality in five east-Asian countries. Sci. Rep. 2017, 7, 1–9. [Google Scholar] [CrossRef] [Green Version]
  56. Singh, N.; Mhawish, A.; Ghosh, S.; Banerjee, T.; Mall, R. Attributing mortality from temperature extremes: A time series analysis in Varanasi, India. Sci. Total Environ. 2019, 665, 453–464. [Google Scholar] [CrossRef]
  57. Sunoj, V.J.; Shroyer, K.J.; Jagadish, S.K.; Prasad, P.V. Diurnal temperature amplitude alters physiological and growth response of maize (Zea mays L.) during the vegetative stage. Environ. Exp. Bot. 2016, 130, 113–121. [Google Scholar] [CrossRef]
  58. Freychet, N.; Hegerl, G.; Mitchell, D.; Collins, M. Future changes in the frequency of temperature extremes may be underestimated in tropical and subtropical regions. Commun. Earth Environ. 2021, 2, 1–8. [Google Scholar] [CrossRef]
  59. Giannakopoulos, C.; Kostopoulou, E.; Varotsos, K.V.; Tziotziou, K.; Plitharas, A. An integrated assessment of climate change impacts for Greece in the near future. Reg. Environ. Chang. 2011, 11, 829–843. [Google Scholar] [CrossRef]
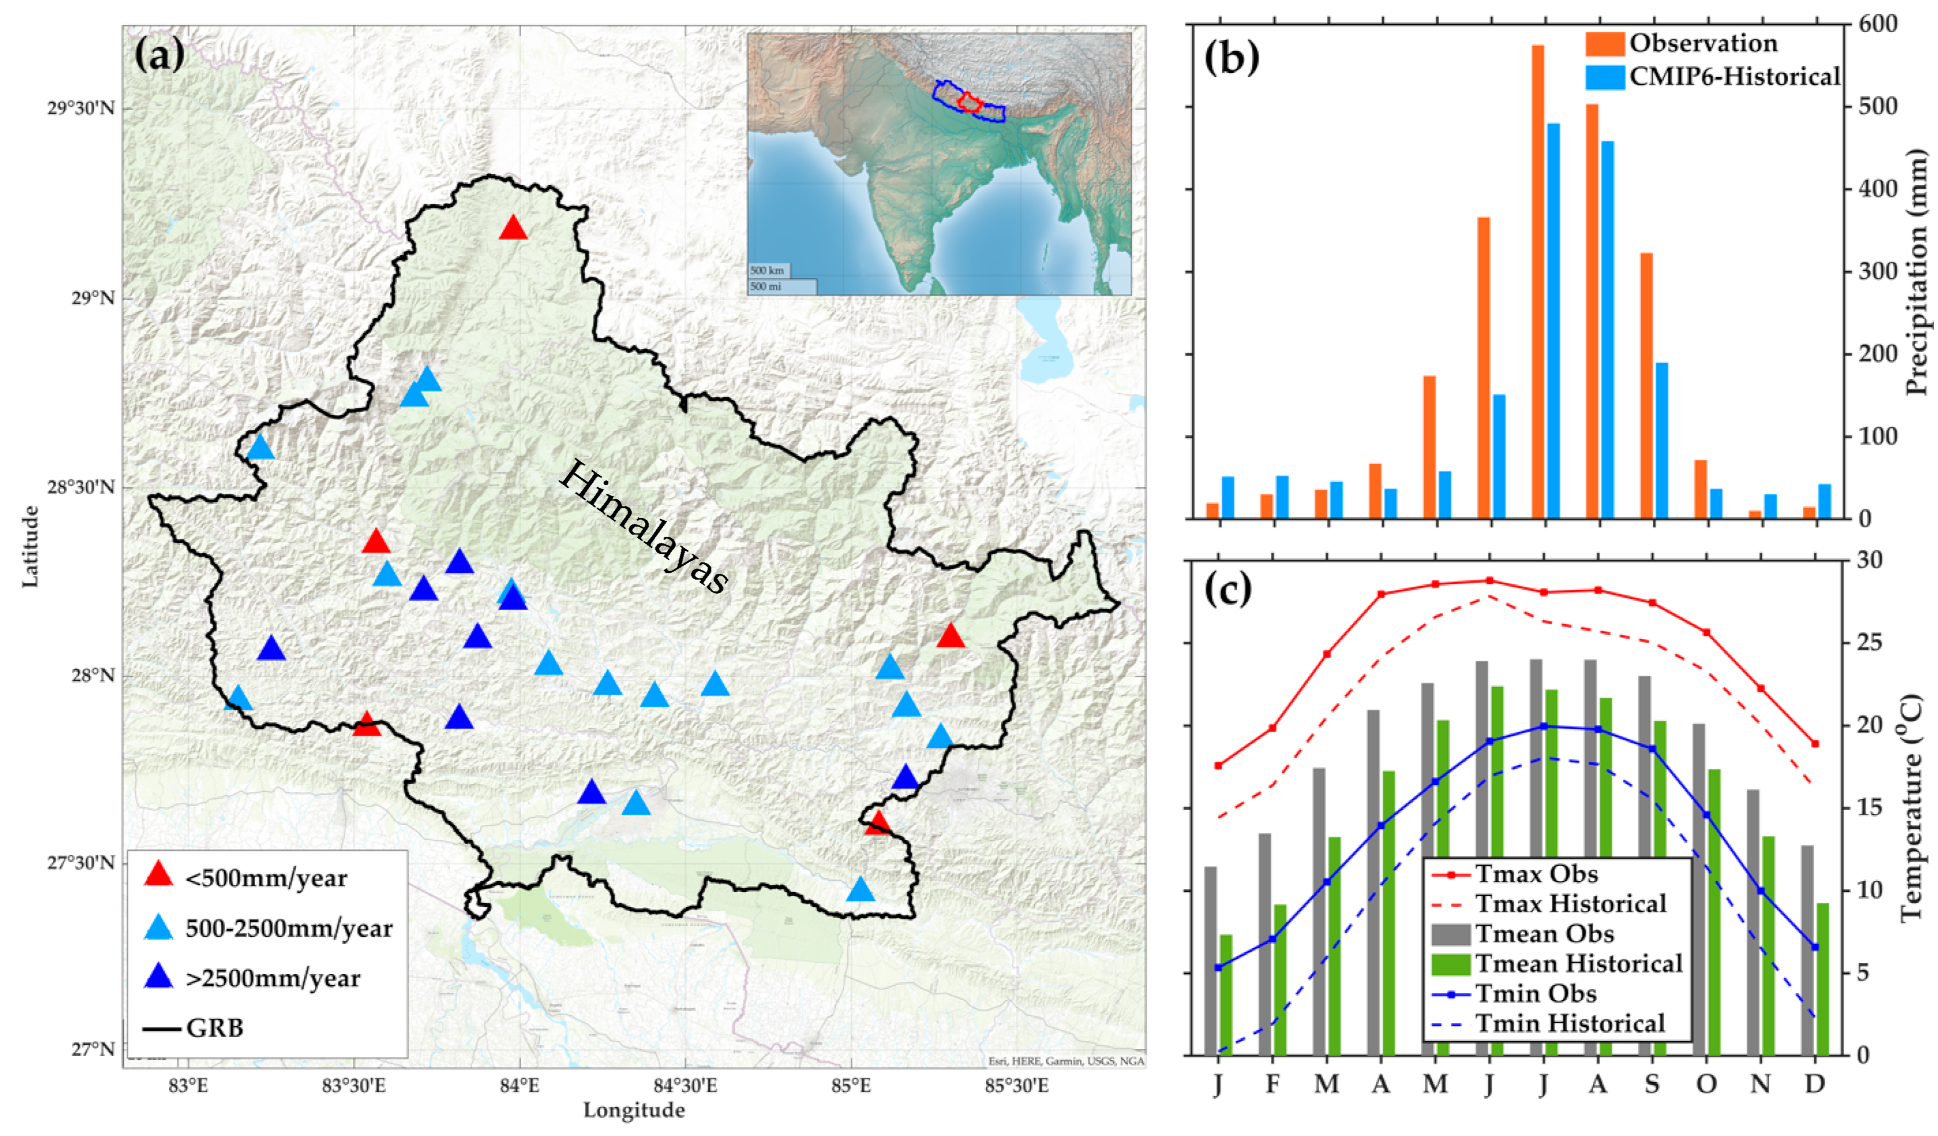
Figure 1. (a) Study area and spatial distribution of mean precipitation over GRB obtained from 28 meteorological stations. The monthly cycle of (b) average precipitation and (c) temperature over GRB during 1985–2014.
Atmosphere 13 01866 g001
Figure 2. Spatial distribution and trend of mean annual precipitation (a,d), Tmax (b,e) and Tmin (c,f) in CMIP6 (historical) over GRB from 1985 to 2014. Black dot represents significant at 95% confidence level.
Atmosphere 13 01866 g002
Figure 3. Projected changes [near-future (2015–2044), mid-future (2045–2074), distant-future (2075–2100)] in precipitation amount, Tmax, Tmin and Tmean under (a) SSP1-2.6 (b) SSP2-4.5 and (c) SSP5-8.5 over GRB.
Atmosphere 13 01866 g003
Figure 4. Projected changes [near-future (2015–2044), mid-future (2045–2074), distant-future (2075–2100)] in precipitation extremes under (a) SSP1-2.6 (b) SSP2-4.5 and (c) SSP5-8.5 over GRB.
Atmosphere 13 01866 g004
Figure 5. Projected changes in temperature extremes under (a) SSP1-2.6 (b) SSP2-4.5 and (c) SSP5-8.5 in three different future scenarios over GRB.
Atmosphere 13 01866 g005
Figure 6. Correlation between precipitation extremes and ocean-atmospheric circulation patterns on the annual scale over GRB from 1985 to 2014.
Atmosphere 13 01866 g006
Figure 7. Correlation between temperature extremes and ocean-atmospheric circulation patterns on the annual scale over GRB from 1985 to 2014.
Atmosphere 13 01866 g007
Table 1. CMIP6 ensemble models used in the current study.
S. No.Model NameSpatial Resolution after Bias-Correction (Degree)Historical (Projection)
1ACCESS-CM20.25 × 0.25°1985–2014 (2015–2100)
2ACCESS-ESM1-50.25 × 0.25°1985–2014 (2015–2100)
3BCC-CSM2-MR0.25 × 0.25°1985–2014 (2015–2100)
4CanESM50.25 × 0.25°1985–2014 (2015–2100)
5EC-Earth30.25 × 0.25°1985–2014 (2015–2100)
6EC-Earth3-Veg0.25 × 0.25°1985–2014 (2015–2100)
7INM-CM4-80.25 × 0.25°1985–2014 (2015–2100)
8INM-CM5-00.25 × 0.25°1985–2014 (2015–2100)
9MPI-ESM1-2-HR0.25 × 0.25°1985–2014 (2015–2100)
10MPI-ESM1-2-LR0.25 × 0.25°1985–2014 (2015–2100)
11MRI-ESM2-00.25 × 0.25°1985–2014 (2015–2100)
12NorESM2-LM0.25 × 0.25°1985–2014 (2015–2100)
13NorESM2-MM0.25 × 0.25°1985–2014 (2015–2100)
Table 2. Description of ETCCDI climate indices used in this study.
TypeIDIndicator NameIndicator DefinitionsUnit
PrecipitationCDDConsecutive dry daysFive consecutive days when rainfall < 1 mmDays
CWDConsecutive wet daysFive consecutive days when rainfall ≥ 1 mmDays
SDIIDaily precipitation intensityRatio of annual total precipitation to number of wet days (≥1 mm)mm/day
Rx1dayMax 1-day precipitationMaximum amount of rain in 1 daymm
Rx5dayMax 5-day precipitationMaximum amount of rain that falls in 5 consecutive daysmm
R1 mmNumber of wet daysAnnual total count when rainfall ≥ 1 mmday
R10 mmNumber of heavy rainfall daysAnnual count when rainfall ≥ 10 mmday
R20 mmNumber of extreme rainfall daysAnnual count when rainfall ≥ 20 mmday
PRCPTOTAnnual total wet daysTotal wet days of rainfallmm
TemperatureDTRDiurnal Temperature RangeAverage range of max and min temperature°C
TMmMean average temperatureAverage daily mean temperature°C
TXmMean daily max temperatureAverage daily max temperature°C
TNmMean daily min temperatureAverage daily min temperature°C
TNxWarmest daily night temperatureHottest night°C
TXnColdest day temperatureColdest day°C
FDFrost daysAnnual count when daily minimum temperature < 0 °Cdays
SUSummer daysAnnual count when daily max temperature > 25 °Cdays
TRTropical nightsAnnual count when daily min temperature > 20 °Cdays
TMge5Mean temperature of at least 5 °CDays when average temperature is 5 °Cdays
TMlt5Mean temperature below 5 °CDays when average temperature is below 5 °Cdays
TMge10Mean temperature of at least 10 °CDays when average temperature is 10 °Cdays
TMlt10Mean temperature below 10 °CDays when average temperature is below 10 °Cdays
TMge30Max temperature of at least 30 °CDays when max temperature is at least 30 °Cdays
Table 3. The seasonal and annual precipitation and temperature trend for reference and projected periods under three different SSP scenarios (unit = mm/year; °C/year).
ReferenceSSP1-2.6SSP2-4.5SSP5-8.5
PrecTmaxTminPrecTmaxTminPrecTmaxTminPrecTmaxTmin
Pre-Monsoon0.0030.019 **0.027 **0.1700.010 **0.009 **0.271 **0.021 **0.025 **0.521 **0.051 **0.057 **
Monsoon4.03 **0.013 **0.033 **1.612 **0.009 **0.009 **3.111 **0.018 **0.028 **8.971 **0.043 **0.061 **
Post-Monsoon0.5650.016 **0.029 **0.1400.008 **0.009 **0.1230.035 **0.025 **0.839 **0.04 **0.059 **
Winter−0.2460.030 **0.032 **0.0740.014 **0.012 **−0.0380.024 **0.034 **0.143 **0.069 **0.075 **
Annual4.098 *0.020 **0.031 **2.070 **0.010 **0.011 **3.428 **0.021 **0.028 **10.04 **0.051 **0.064 **
Note: * and **, indicates the significant at 90%, 95% confidence level, respectively. Bold font indicates a downward trend.
Publisher’s Note: MDPI stays neutral with regard to jurisdictional claims in published maps and institutional affiliations.