


Experimentation of Mitigation Strategies to Contrast the Urban Heat Island Effect: A Case Study of an Industrial District in Italy to Implement Environmental Codes


Abstract
:1. Background
1.1. Green Infrastructure and European Codes
1.2. Green Infrastructure and Italian Codes
1.3. Benefits of Vertical Greenery
2. Method
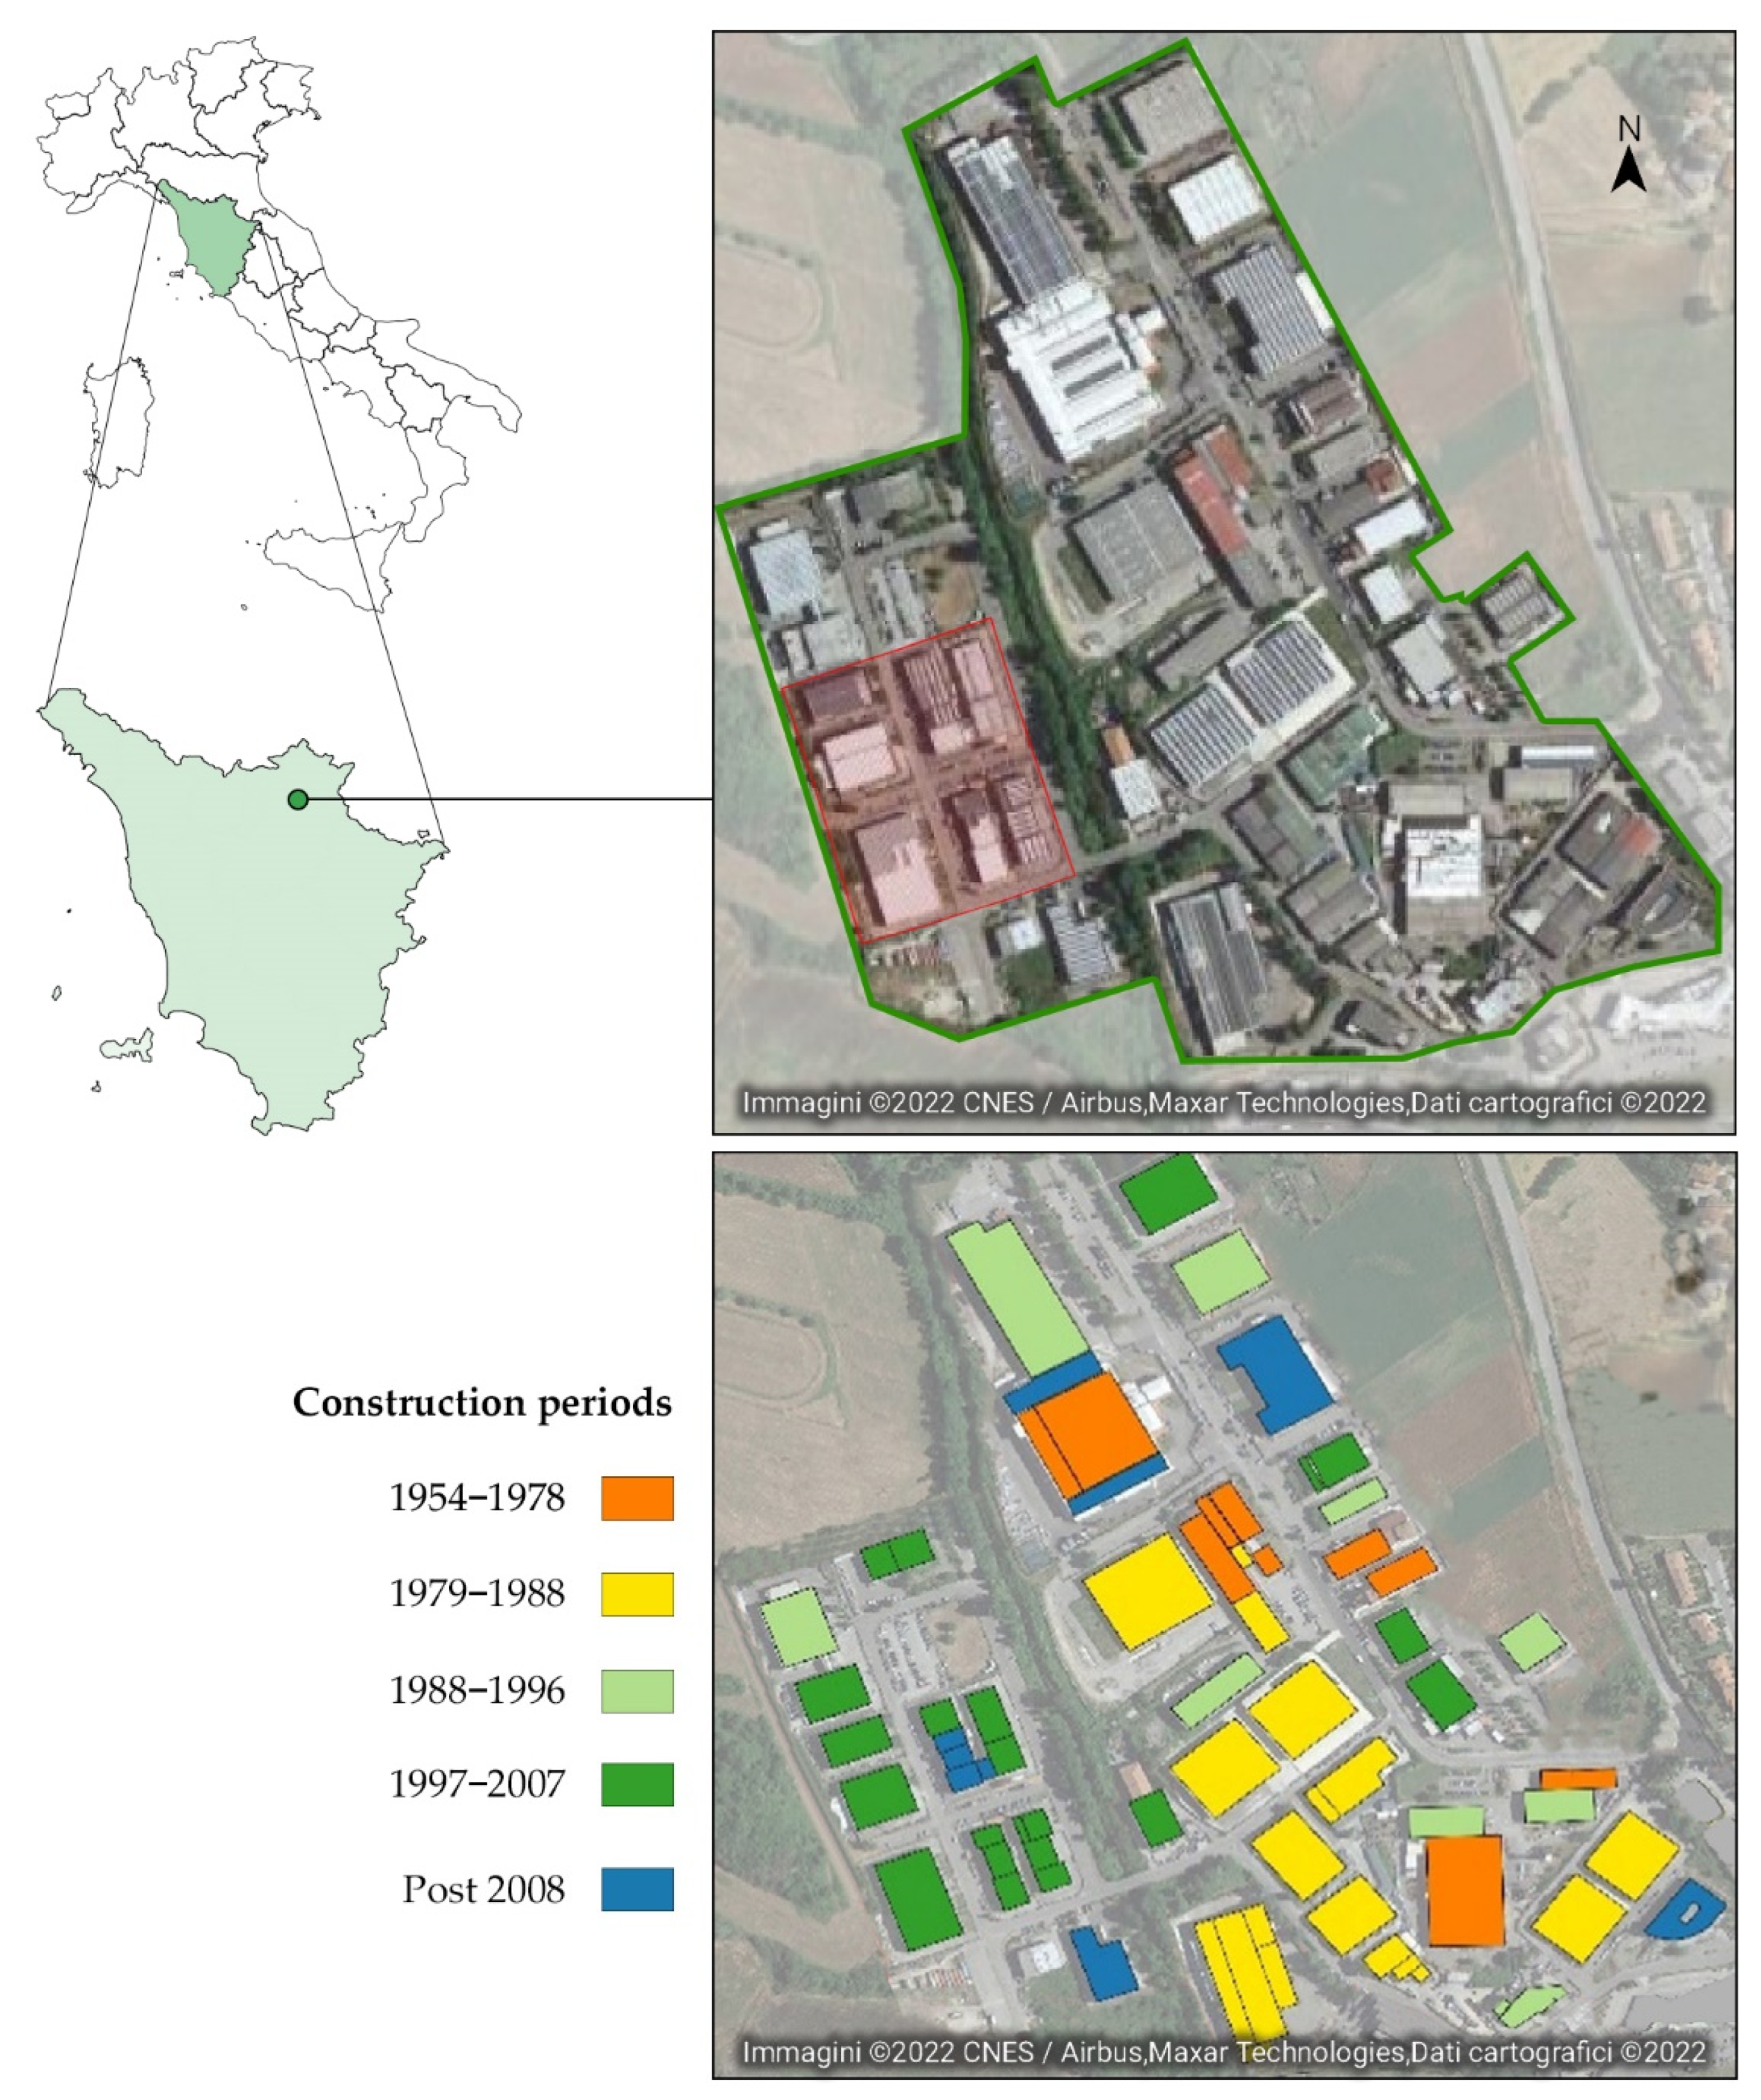
2.1. Case Study Area
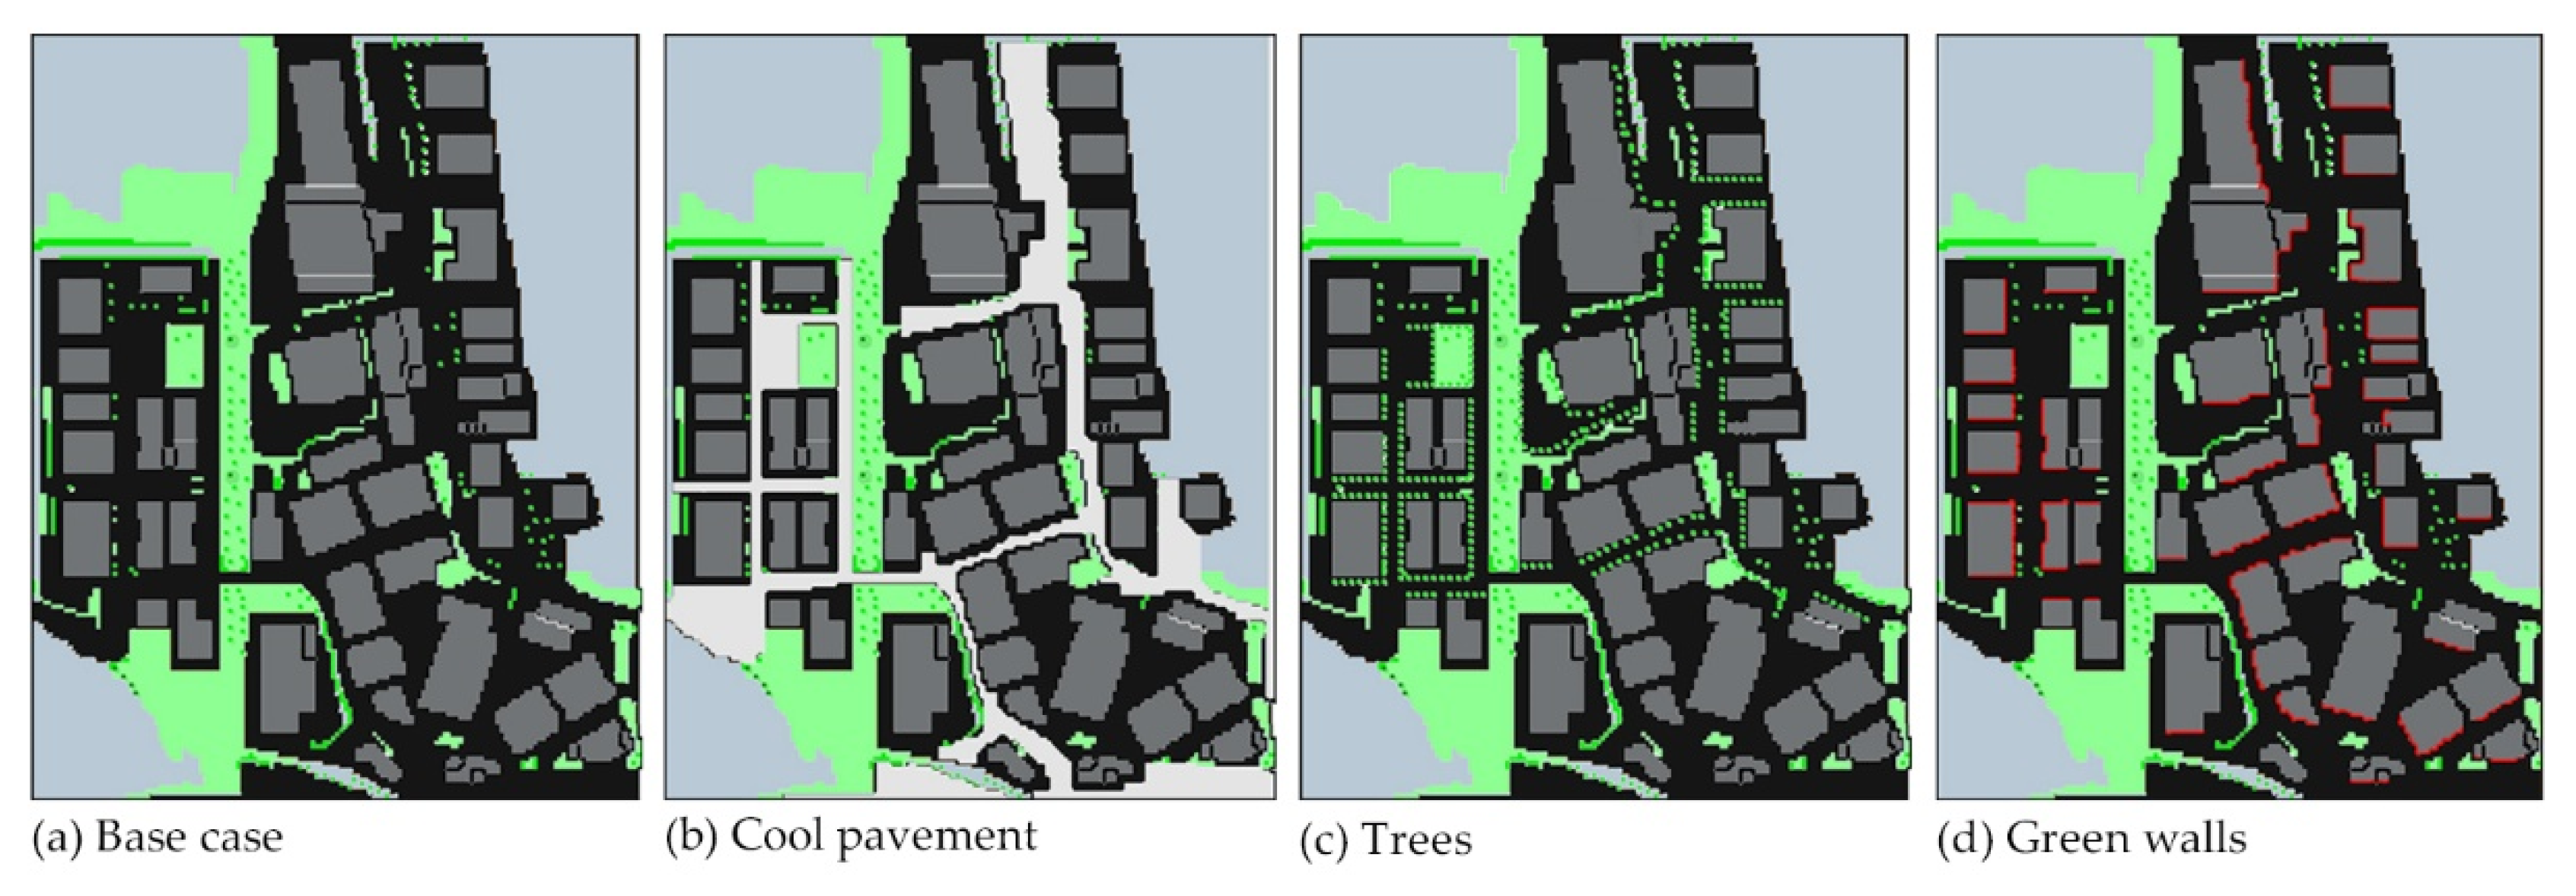
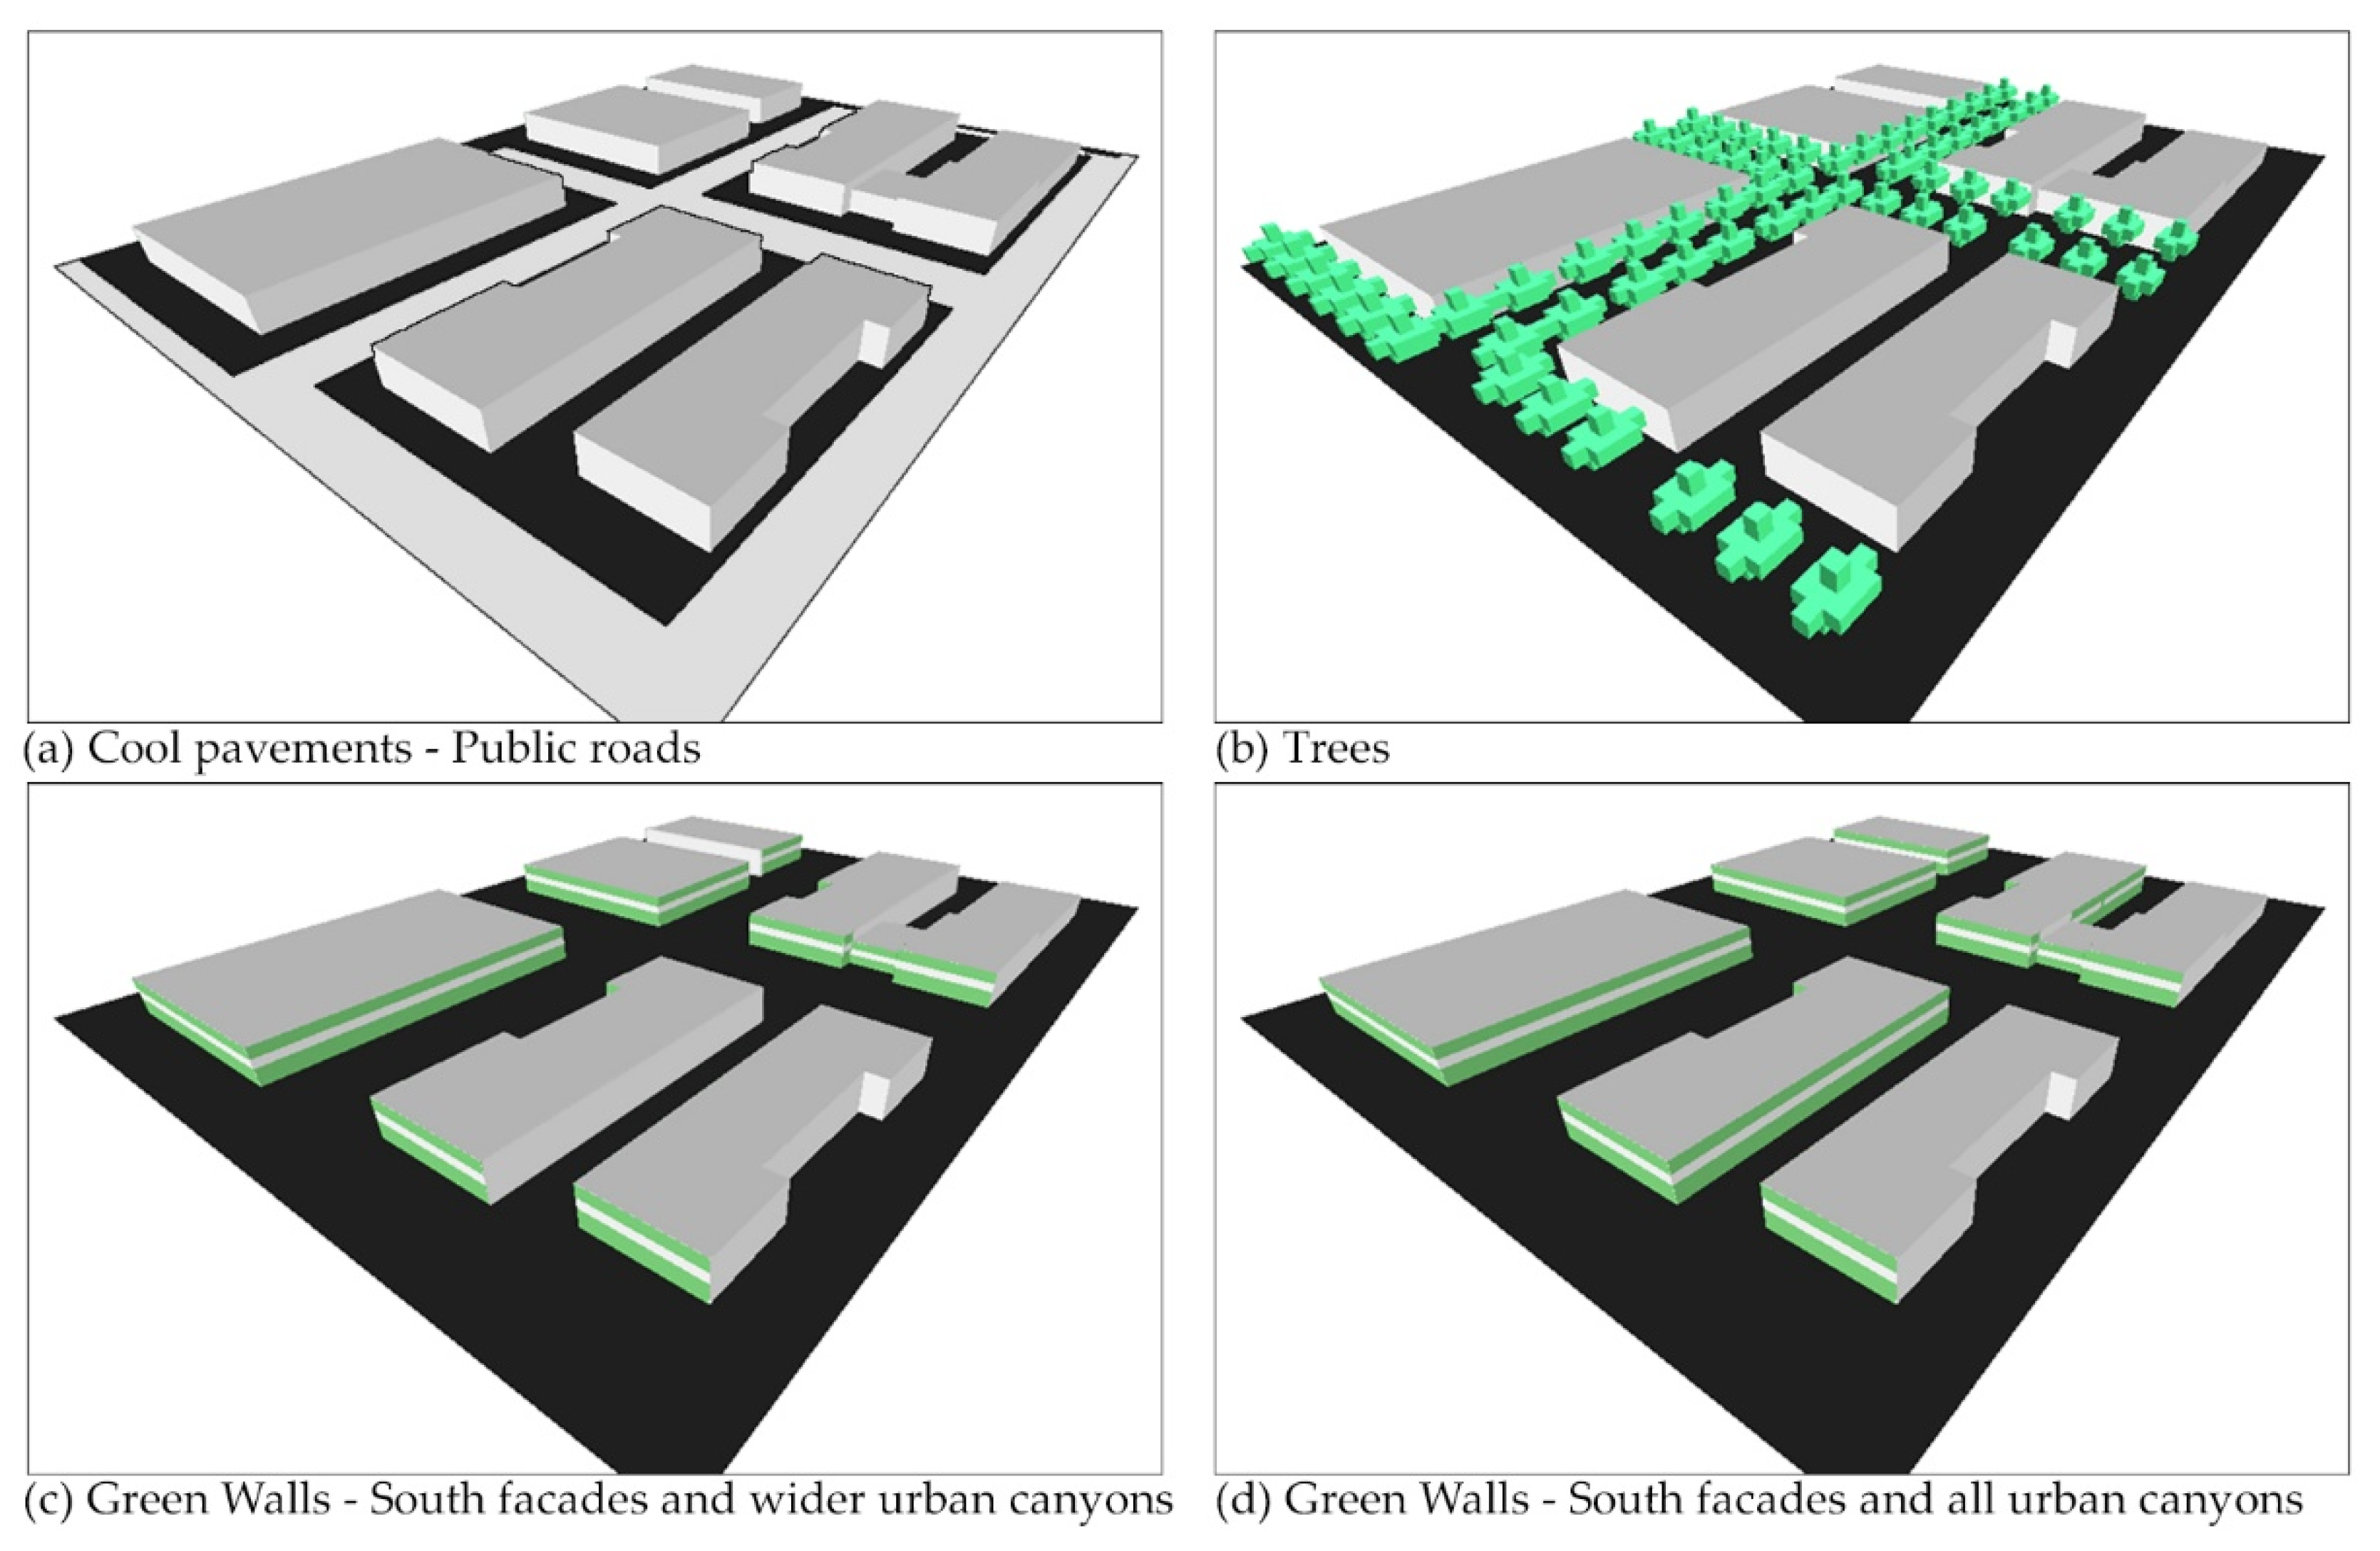
2.2. Mitigation Strategies
2.3. ENVI-met Set Up
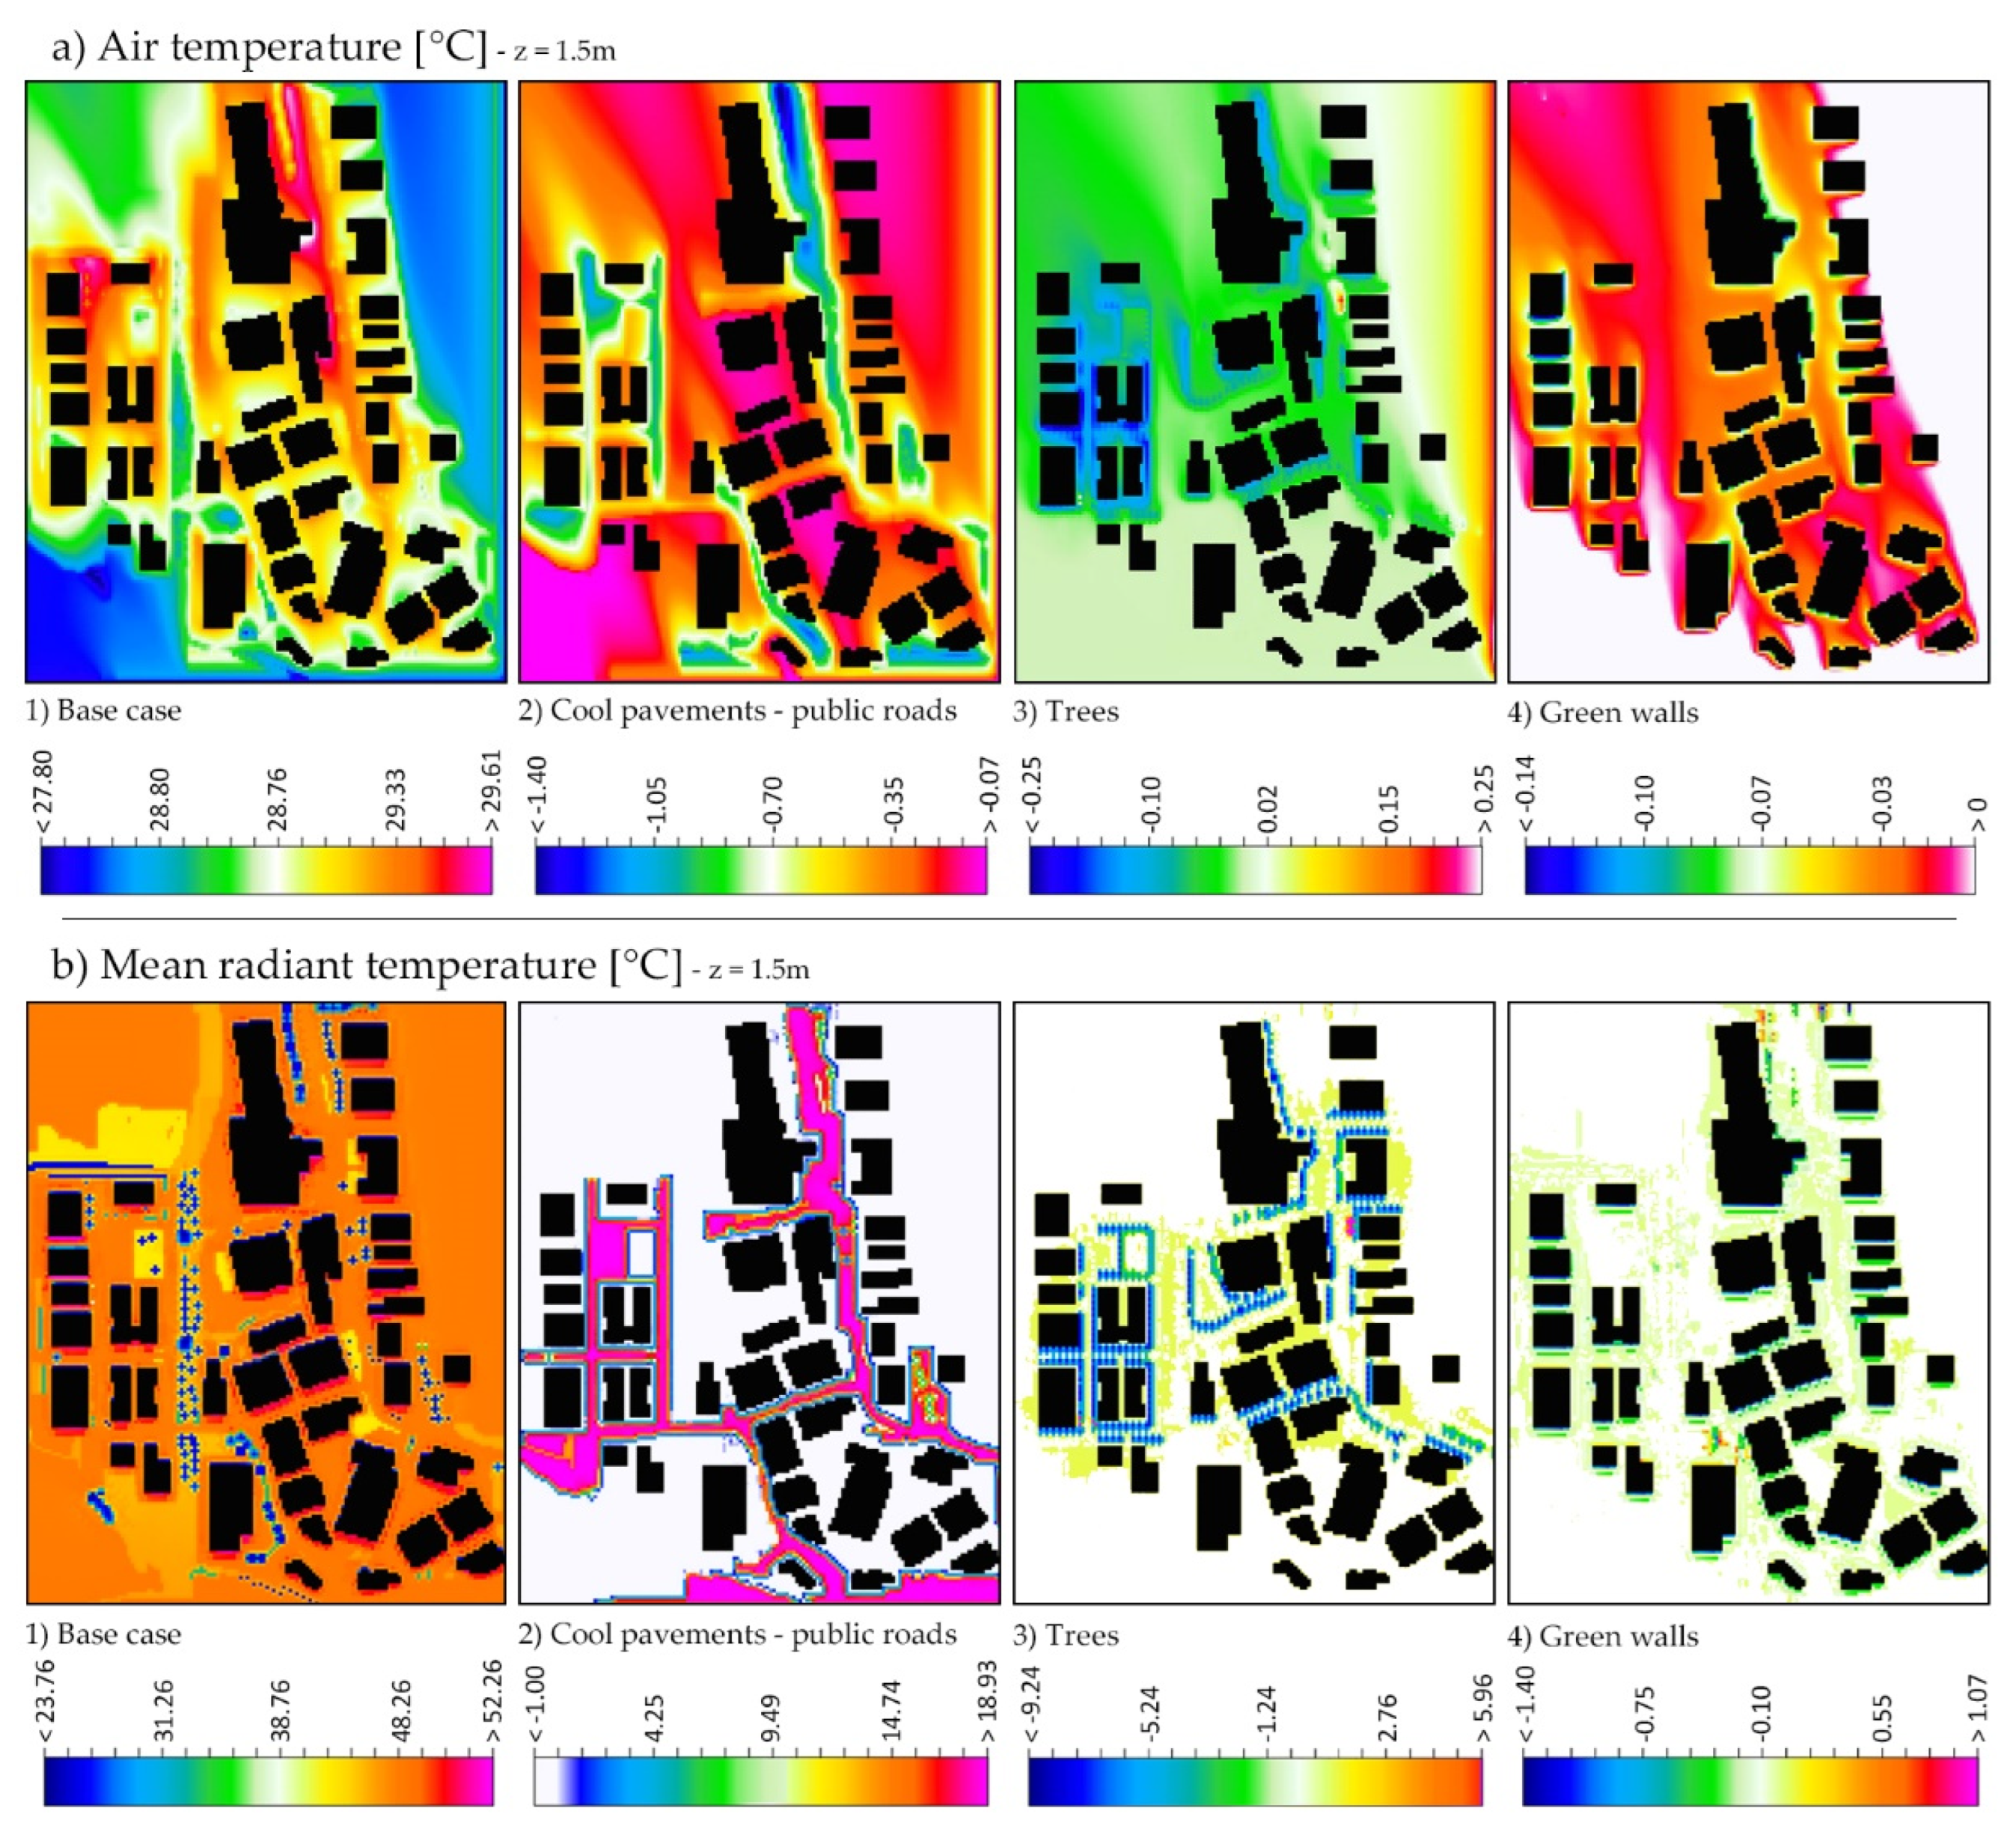
3. Results
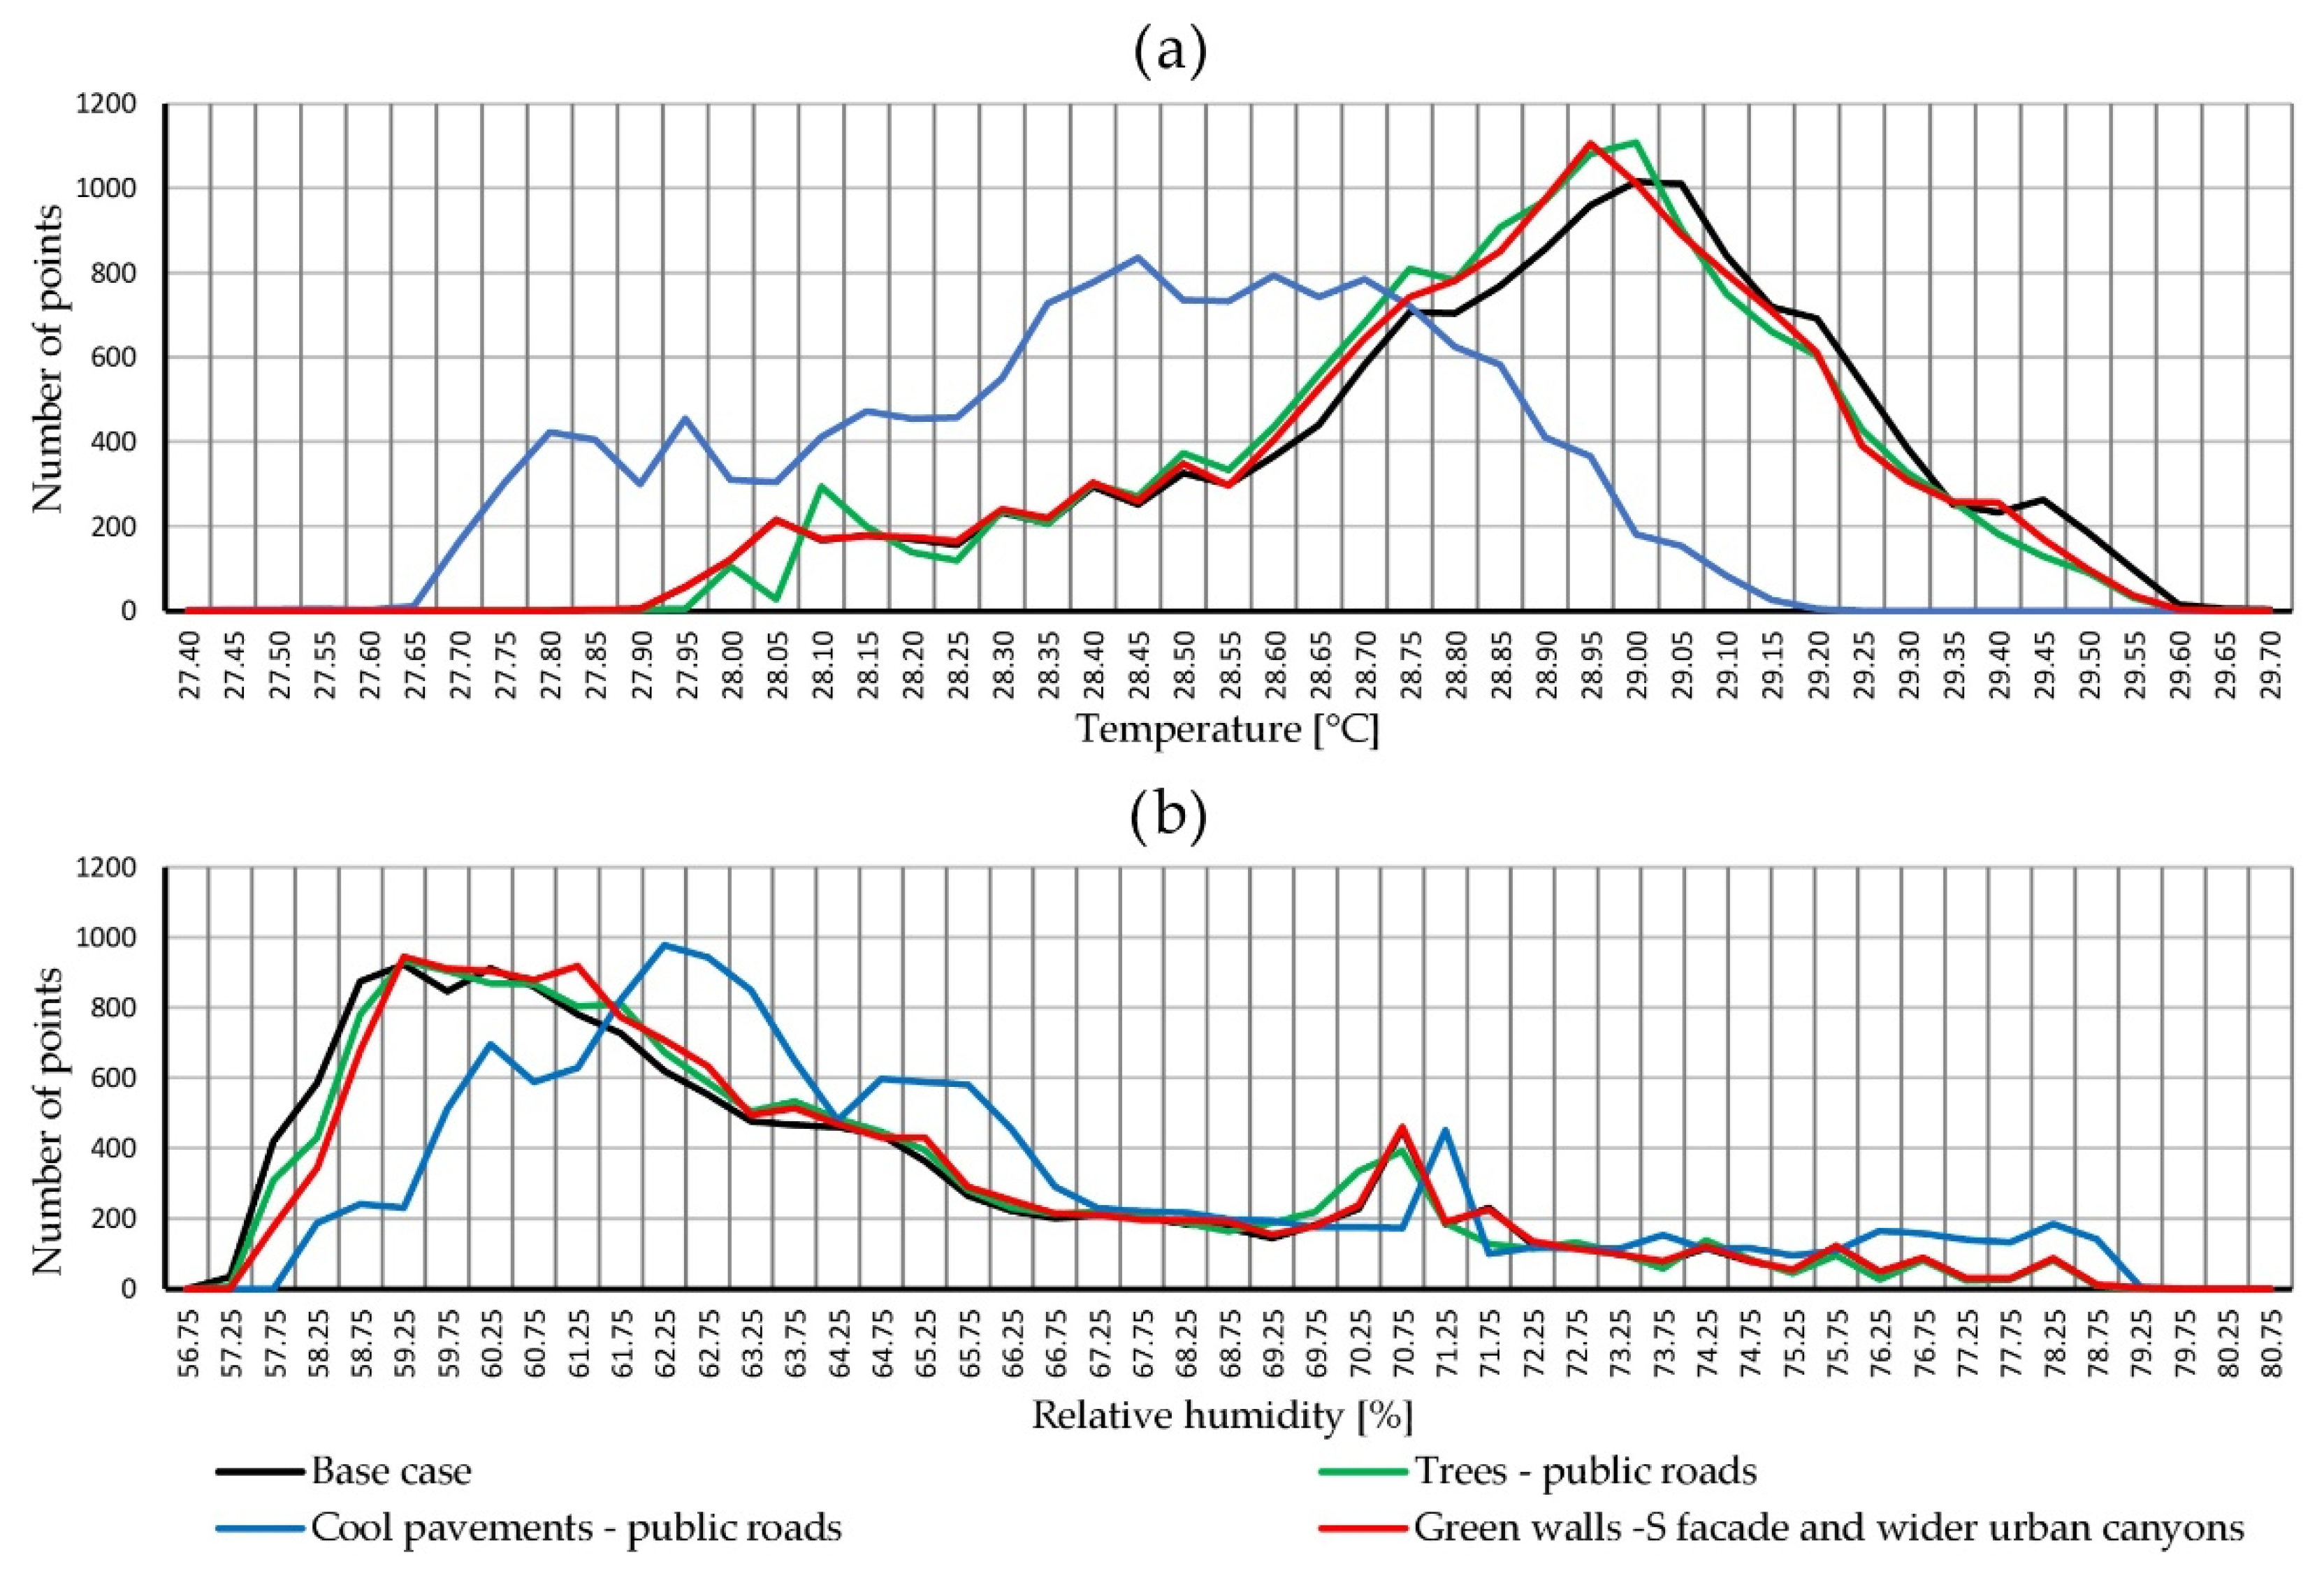
3.1. District M1
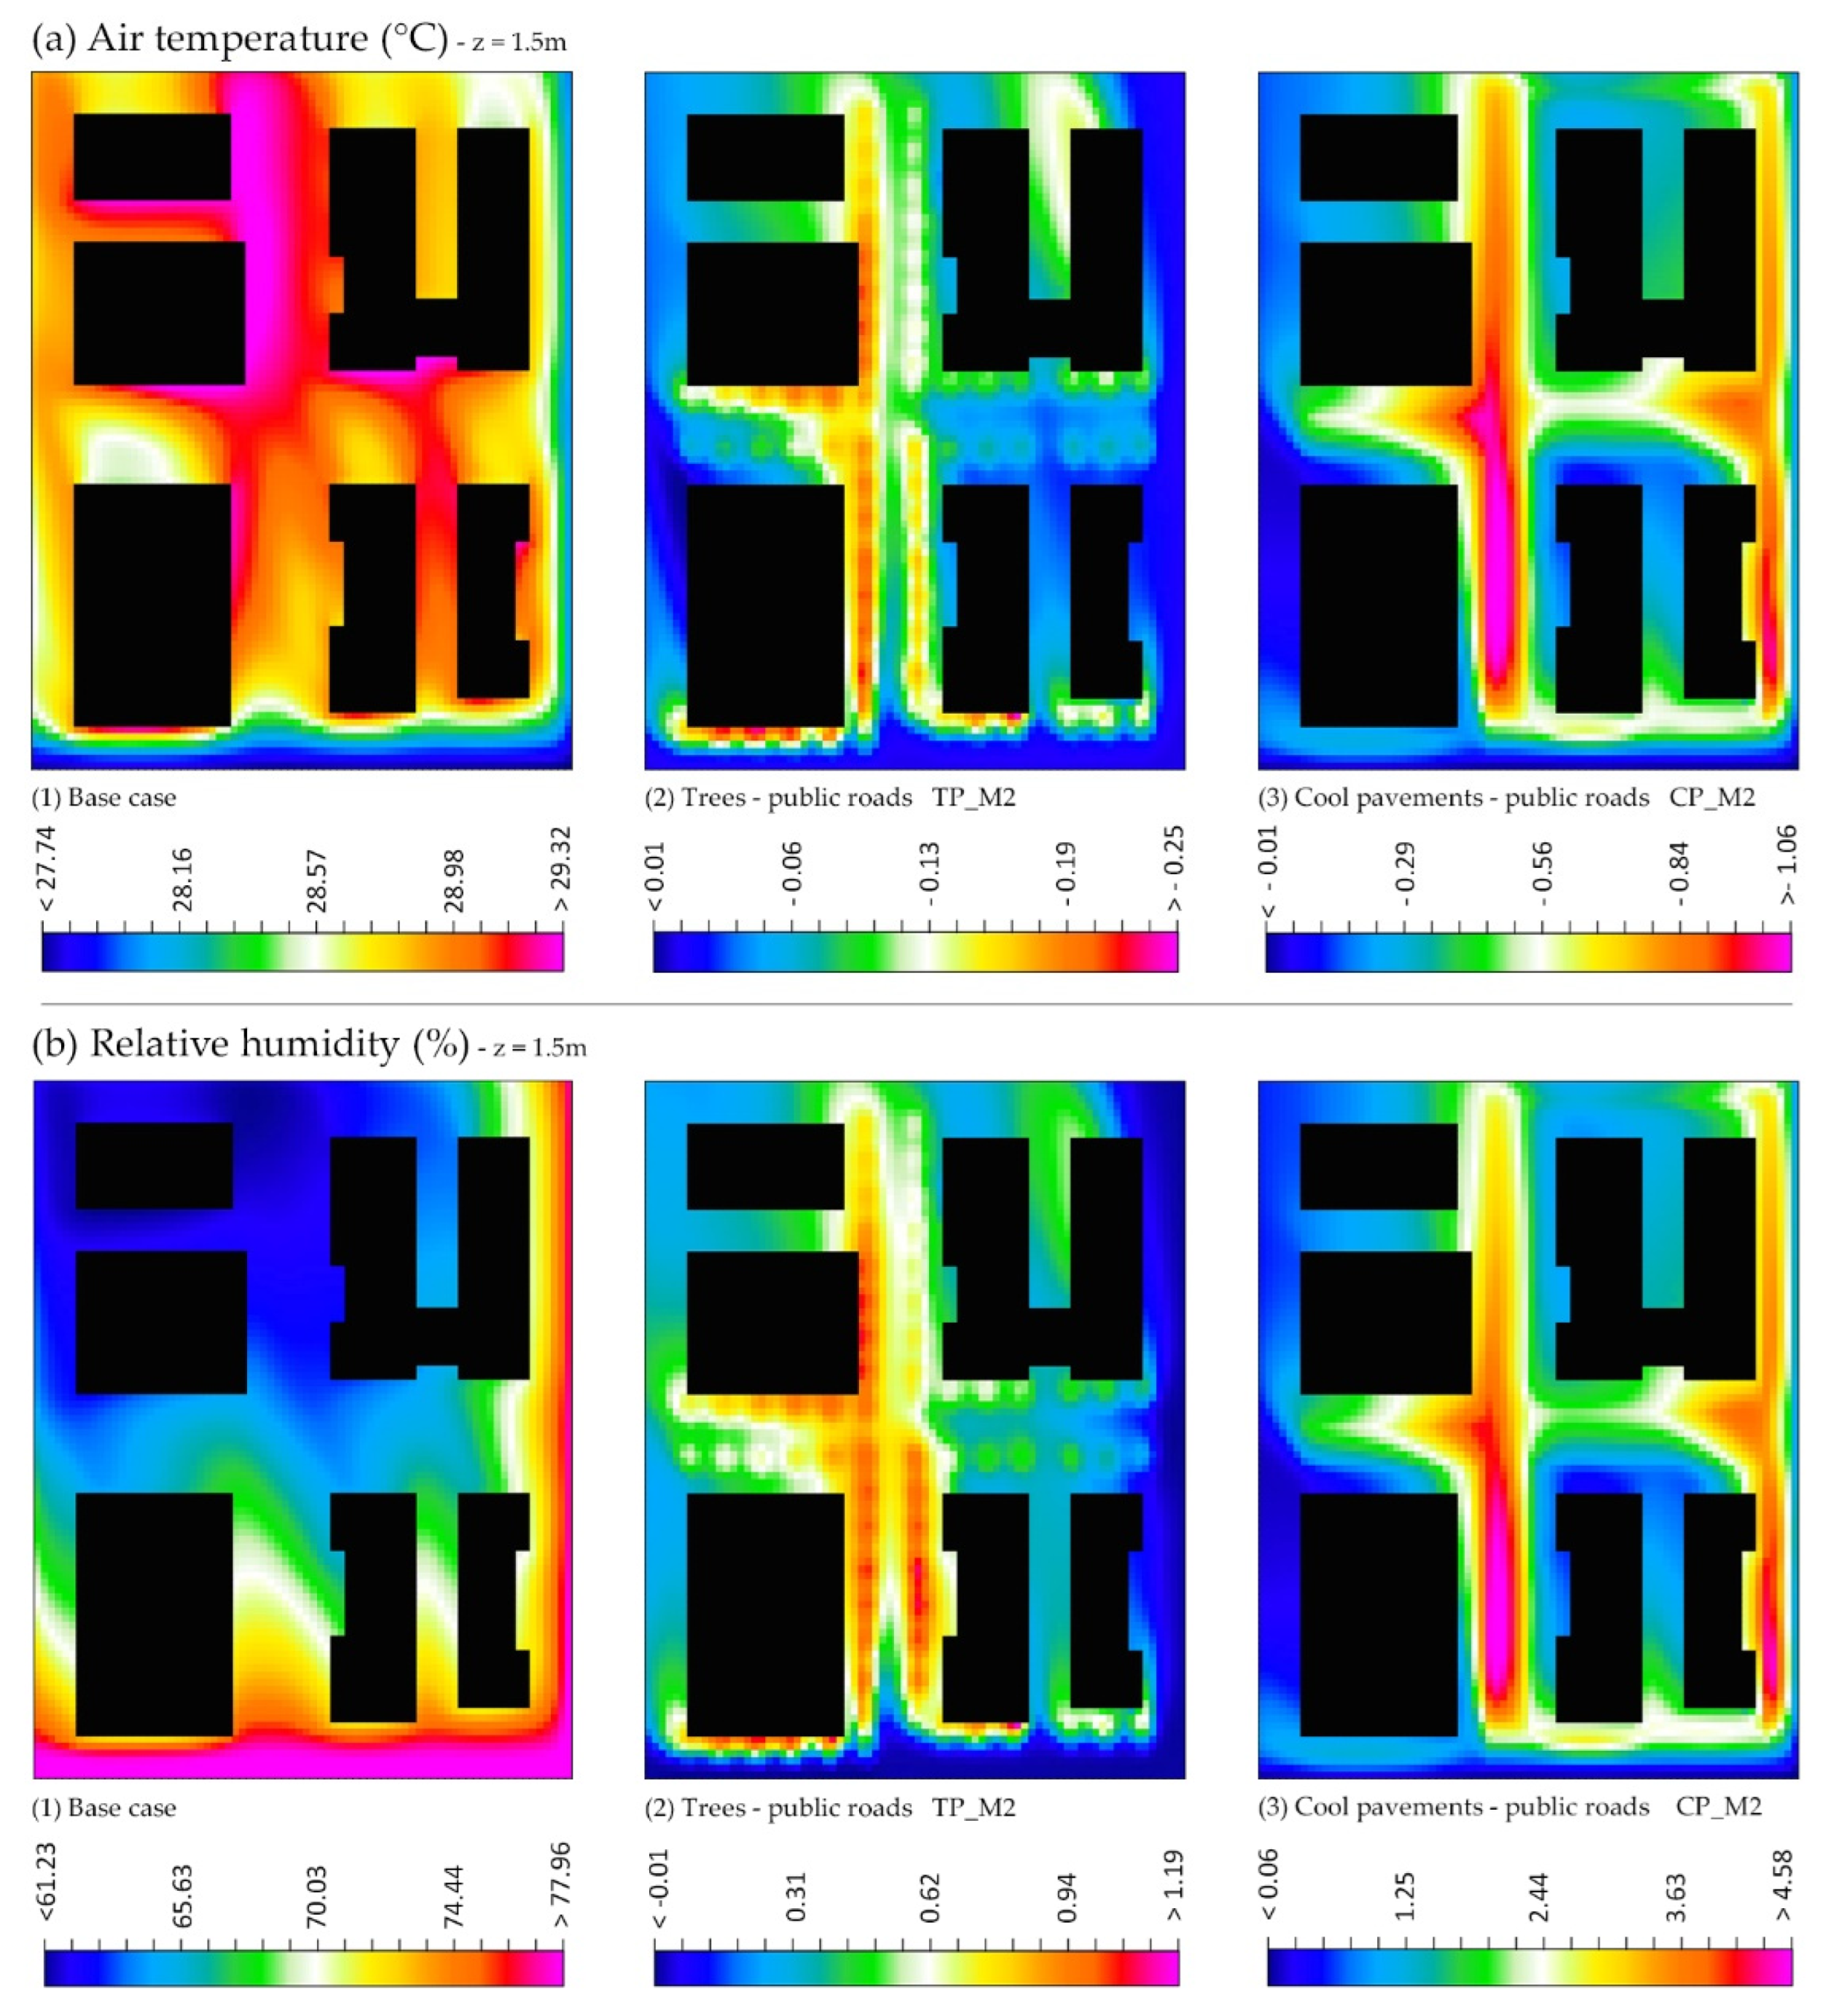
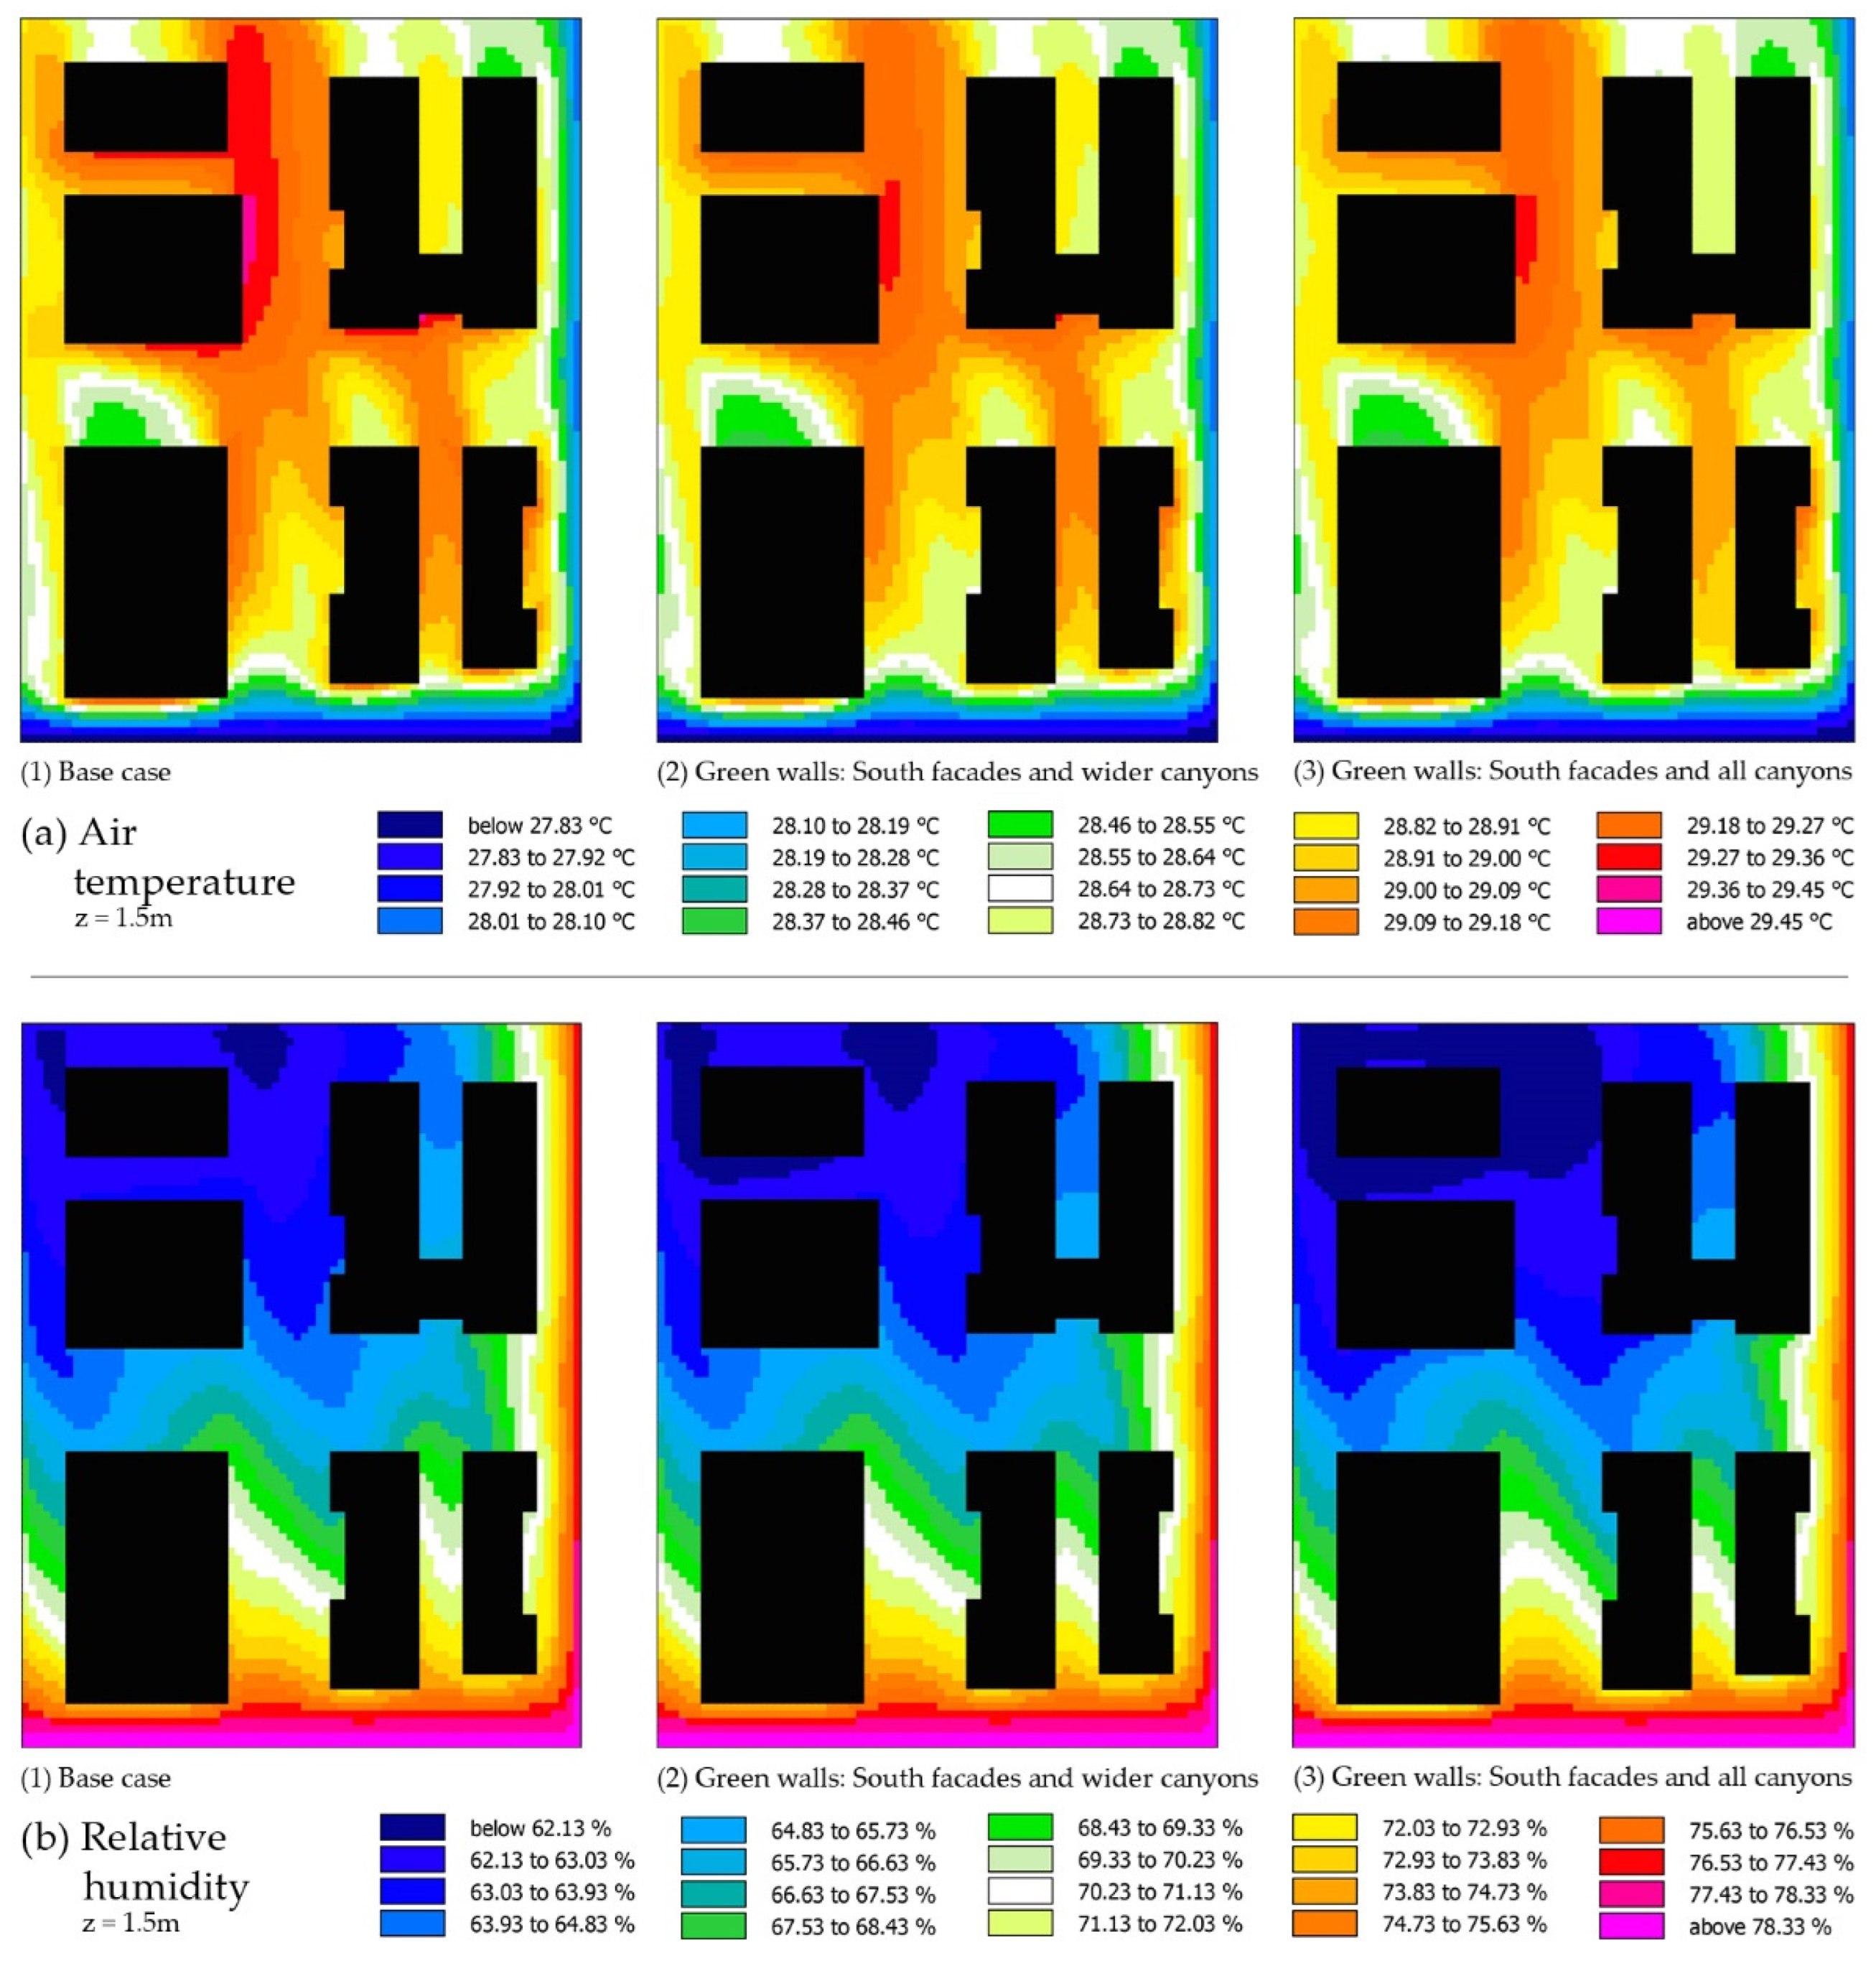
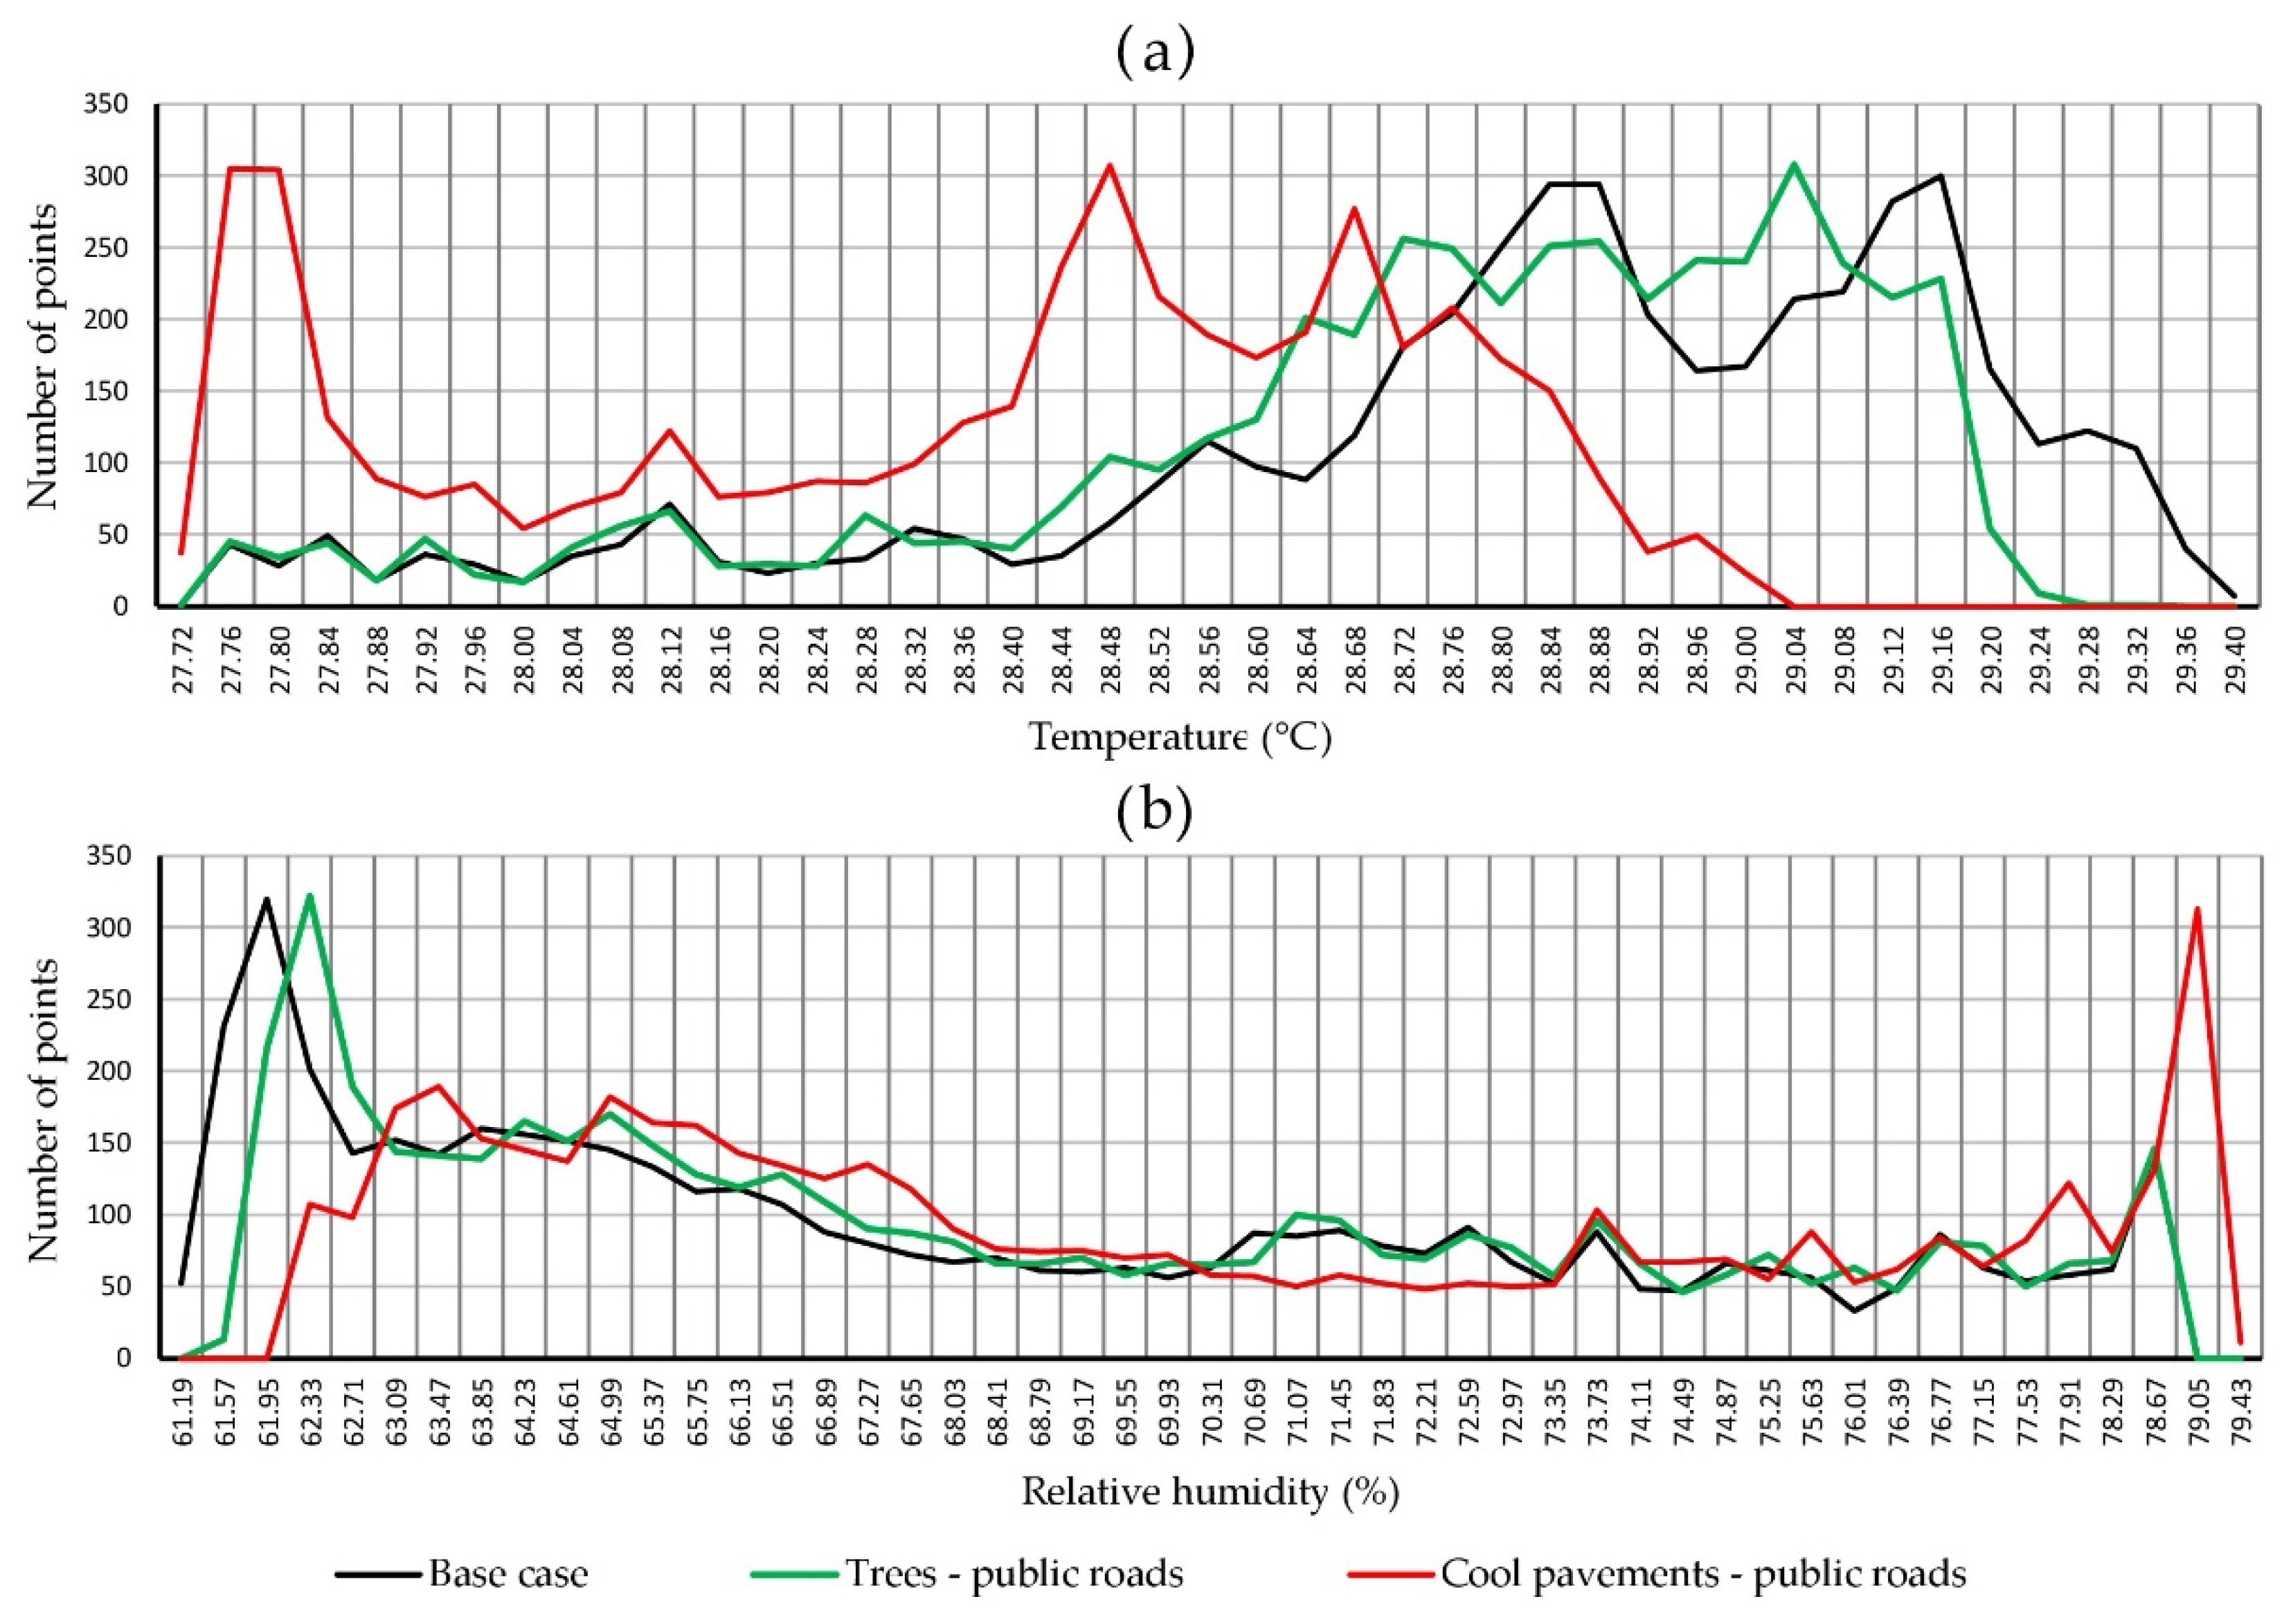
3.2. District M2
4. Discussion
5. Conclusions
Author Contributions
Funding
Institutional Review Board Statement
Informed Consent Statement
Data Availability Statement
Conflicts of Interest
References
- European Commission. Ecosystem Services and Green Infrastructure. Available online: https://biodiversity.europa.eu/green-infrastructure (accessed on 28 September 2022).
- European Commission. Paris Agreement. Available online: https://ec.europa.eu/clima/eu-action/international-action-climate-change/climate-negotiations/paris-agreement_en (accessed on 28 September 2022).
- European Commission. 2030 Climate & Energy Framework. Available online: https://climate.ec.europa.eu/eu-action/climate-strategies-targets/2030-climate-energy-framework_en (accessed on 28 September 2022).
- European Environment Agency; Kleeschulte, S.; Dige, G.; Liquete, C.; Banko, G. Spatial analysis of green infrastructure in Europe, Publications Office. 2014. Available online: https://data.europa.eu/doi/10.2800/11170 (accessed on 28 September 2022).
- European Commission. Protocollo di Kyoto sui Cambiamenti Climatici. Available online: https://eur-lex.europa.eu/legal-content/IT/ALL/?uri=URISERV:l28060 (accessed on 28 September 2022).
- European Commission. Sustainable Development Goals. Available online: https://ec.europa.eu/info/strategy/international-strategies/sustainable-development-goals_en (accessed on 3 October 2022).
- European Commission. Communication from the Commission to the European Parliament, the European Council, the Council, the European Economic and Social Committee and the Committee of the Regions. The European Green Deal; European Commission: Brusseles, Belgium, 2019. [Google Scholar]
- European Parliament and Council of the European Union. Directive 2018/844/EU. Europe. 2018. Available online: https://eur-lex.europa.eu/legal-content/IT/TXT/PDF/?uri=CELEX:32018L0844 (accessed on 2 October 2022).
- European Parliament and Council of the European Union. Directive 2010/31/EU. Europe. 2010. Available online: https://eur-lex.europa.eu/legal-content/IT/TXT/PDF/?uri=CELEX:32010L0031#:~:text=DIRETTIVA%202010%2F31%2FUE%20DEL%20PARLAMENTO%20EUROPEO%20E%20DEL%20CONSIGLIO,del%2019%20maggio%202010%20sulla%20prestazione%20energetica%20nell%E2%80%99edilizia (accessed on 3 October 2022).
- Ciacci, C.; Banti, N.; Di Naso, V.; Bazzocchi, F. Evaluation of the Cost-Optimal Method Applied to Existing Schools Considering PV System Optimization. Energies 2022, 15, 611. [Google Scholar] [CrossRef]
- Green Building Council Italia. LEED v4 for Building Operations and Maintainance. 2016. Available online: https://www.usgbc.org/sites/default/files/LEED-v4-EBOM_Italian.pdf (accessed on 26 October 2022).
- Institution for the Innovation ad Transparency of Appalts and Environmental Compatibility—ITACA. PROTOCOLLO ITACA Nazionale 2015. Non Residenziale; ITACA: Rome, Italy, 2015. [Google Scholar]
- Building Research establishment for Environmental Assessment Method—BREEAM. Refurbishment and Fit-Out Technical Manuals; BREEAM: London, UK, 2016. [Google Scholar]
- Giannico, V.; Spano, G.; Elia, M.; D’Este, M.; Sanesi, G.; Lafortezza, R. Green spaces, quality of life, and citizen perception in European cities. Environ. Res. 2021, 196, 110992. [Google Scholar] [CrossRef] [PubMed]
- German Parliament. Biotope Area Factor. Available online: https://climate-adapt.eea.europa.eu/en/metadata/case-studies/berlin-biotope-area-factor-2013-implementation-of-guidelines-helping-to-control-temperature-and-runoff#:~:text=TheBiotopeAreaFactorwas,thelayoutofthebuildings (accessed on 22 September 2022).
- European Commission. Città europee Sostenibili; European Commission: Bruxelles, Belgium, 1994. [Google Scholar]
- Vartholomaios, A.; Kalogirou, N.; Athanassiou, E.; Papadopoulou, M. The green space factor as a tool for regulating the urban microclimate in vegetation-deprived Greek cities. In Proceedings of the International Conference “Changing Cities”: Spatial Morphological Formal and Socio-Economic Dimensions, Skiathos Islands, Greek, 18–21 June 2013. [Google Scholar] [CrossRef]
- The North West Green Infrastructure Think Tank Partners. North West Green Infrastructure. 2008. Available online: http://www.greeninfrastructurenw.co.uk/resources/GIguide.pdf (accessed on 22 September 2022).
- Stadt Wien—Leitfaden Fassadenbegrunung. Available online: https://www.wien.gv.at/umweltschutz/raum/fassadenbegruenung.html (accessed on 22 September 2022).
- Governo Italiano. Norme per lo Sviluppo Degli Spazi Verdi Urbani; Governo Italiano: Rome, Italy, 2013. [Google Scholar]
- Italian Organization for Standardization. UNI 11235 Istruzioni per la Progettazione, l’esecuzione, il Controllo e la Manutenzione di Coperture Verdi; Italian Organization for Standardization: Rome, Italy, 2015. [Google Scholar]
- Liberalesso, T.; Oliveira Cruz, C.; Matos Silva, C.; Manso, M. Green infrastructure and public policies: An international review of green roofs and green walls incentives. Land Use Policy 2020, 96, 104693. [Google Scholar] [CrossRef]
- Ministero dell’economia e Delle Finanze—Bonus Verde. Normativa e Prassi. Available online: https://www.agenziaentrate.gov.it/portale/web/guest/bonus-verde/normativa-e-prassi-cittadini (accessed on 23 September 2022).
- Comune di Potenza. Regolamento Edilizio del Comune di Potenza; Comune di Potenza: Potenza, Italy, 2009. [Google Scholar]
- Comune di Bologna. Regolamento Edilizio del Comune di Bologna; Comune di Bologna: Bologna, Italy, 2021. [Google Scholar]
- Comune di Pordenone. Regolamento edilizio del Comune di Pordenone; Comune di Pordenone: Pordenone, Italy, 2020. [Google Scholar]
- Comune di Roma. Approvazione del Regolamento Capitolino del Verde Pubblico e Privato e del Paesaggio Urbano di Roma Capitale; Comune di Roma: Rome, Italy, 2019. [Google Scholar]
- Comune di Genova. Regolamento Edilizio del Comune di Genova; Comune di Genova: Genova, Italy, 2017. [Google Scholar]
- Comune di Brescia. Regolamento Edilizio del Comune di Brescia; Comune di Brescia: Brescia, Italy, 2022. [Google Scholar]
- Comune di Cremona. Regolamento Edilizio per la Qualità Paesaggistica la Sostenibilità Ambientale e l’Efficienza Energetica; Comune di Cremona: Cremona, Italy, 2012. [Google Scholar]
- Comune di Milano. Piano Aria e Clima del Comune di Milano; Comune di Milano: Milan, Italy, 2019. [Google Scholar]
- Comune di Torino. Regolamento del Verde Pubblico e Privato Della Città di Torino; Comune di Torino: Turin, Italy, 2020. [Google Scholar]
- Comune di Bari. Regolamento edilizio del Comune di Bari; Comune di Bari: Bari, Italy, 2022. [Google Scholar]
- Comune di Siena. Regolamento edilizio del Comune di Siena; Comune di Siena: Siena, Italy, 2016. [Google Scholar]
- Addo-Bankas, O.; Zhao, Y.; Vymazal, J.; Yuan, Y.; Fu, J.; Wei, T. Green walls: A form of constructed wetland in green buildings. Ecol. Eng. 2021, 169, 106321. [Google Scholar] [CrossRef]
- 3 study: South valley campus of AASTMT. Case Stud. Constr. Mater. 2022, 16, e00808. [CrossRef]
- Koch, K.; Ysebaert, T.; Denys, S.; Samson, R. Urban heat stress mitigation potential of green walls: A review. Urban For. Urban Green. 2020, 55, 126843. [Google Scholar] [CrossRef]
- Shafiee, E.; Faizi, M.; Yazdanfar, S.A.; Khanmohammadi, M.A. Assessment of the effect of living wall systems on the improvement of the urban heat island phenomenon. Build. Environ. 2020, 181, 106923. [Google Scholar] [CrossRef]
- Kenai, M.A.; Libessart, L.; Lassue, S.; Defer, D. Impact of green walls occultation on energy balance: Development of a TRNSYS model on a brick masonry house. J. Build. Eng. 2021, 44, 102634. [Google Scholar] [CrossRef]
- ENVI-met v5.2. Available online: https://www.envi-met.com/ (accessed on 1 September 2022).
- Peng, L.L.H.; Jiang, Z.; Yang, X.; Wang, Q.; He, F.; Chen, S. Energy savings of block-scale facade greening for different urban forms. Appl. Energy 2020, 279, 115844. [Google Scholar] [CrossRef]
- Viecco, M.; Jorquera, H.; Sharma, A.; Bustamante, W.; Fernando, H.; Vera, S. Green roofs and green walls layouts for improved urban air quality by mitigating particulate matter. Build. Environ. 2021, 204, 108120. [Google Scholar] [CrossRef]
- Comune di Barberino. Available online: www.comunebarberino.it (accessed on 26 October 2022).
- Banti, N.; Ciacci, C.; Bazzocchi, F.; Di Naso, V. Analysis of the industrial building stock of Mugello in Toscana: A methodological framework using GIS. In Proceedings of the Colloqui.AT.e 2022 Memoria e innovazione, Genova, Italy, 7–10 September 2022. [Google Scholar]
- Banti, N.; Ciacci, C.; Di Naso, V.; Bazzocchi, F. Assessing Typological Variants in Existing Prefabricated Industrial Buildings: Case Study of Casentino in Tuscany, Italy. J. Archit. Eng. 2022, 28, 05022009. [Google Scholar] [CrossRef]
- Paull, N.J.; Krix, D.; Irga, P.J.; Torpy, F.R. Green wall plant tolerance to ambient urban air pollution. Urban For. Urban Green. 2021, 63, 127201. [Google Scholar] [CrossRef]
- Paull, N.J.; Irga, P.J.; Torpy, F.R. Active green wall plant health tolerance to diesel smoke exposure. Environ. Pollut. 2018, 240, 448–456. [Google Scholar] [CrossRef] [PubMed]
- Google Maps. Available online: https://www.google.it/maps (accessed on 26 October 2022).
- Geoscopio. Available online: https://www.regione.toscana.it/-/geoscopio (accessed on 26 October 2022).
- Taleghani, M.; Berardi, U. The effect of pavement characteristics on pedestrians’ thermal comfort in Toronto. Urban Clim. 2018, 24, 449–459. [Google Scholar] [CrossRef]
- Evola, G.; Gagliano, A.; Fichera, A.; Marletta, L.; Martinico, F.; Nocera, F.; Pagano, A. UHI effects and strategies to improve outdoor thermal comfort in dense and old neighbourhoods. Energy Procedia 2017, 134, 692–701. [Google Scholar] [CrossRef]
- Lontorfos, V.; Efthymiou, C.; Santamouris, M. On the time varying mitigation performance of reflective geoengineering technologies in cities. Renew. Energy 2018, 115, 926–930. [Google Scholar] [CrossRef]
- Ciacci, C.; Banti, N.; Di Naso, V.; Bazzocchi, F. Evaluating Buildings’ Green Retrofitting to Improve Urban Environment at District Level. Environ. Sci. Proc. 2022, 18, 7. [Google Scholar] [CrossRef]
- Hu, L. Evaluation of Cool Pavement Strategies for Heat Island Mitigation; Final Research Report 2012; Department of Civil and Environmental Engineering, University of California: Davis, CA, USA, 2012. [Google Scholar]
- Jaafar, H.; Lakkis, I.; Yeretzian, A. Impact of boundary conditions in a microclimate model on mitigation strategies affecting temperature, relative humidity, and wind speed in a Mediterranean city. Build. Environ. 2021, 210, 108712. [Google Scholar] [CrossRef]
- Faragallah, R.N.; Ragheb, R.A. Evaluation of thermal comfort and urban heat island through cool paving materials using ENVI-Met. Ain Shams Eng. J. 2021, 13, 101609. [Google Scholar] [CrossRef]
- Abdallah, A.S.H.; Mahmoud, R.M.A. Urban morphology as an adaptation strategy to improve outdoor thermal comfort in urban residential community of new assiut city, Egypt. Sustain. Cities Soc. 2022, 78, 103648. [Google Scholar] [CrossRef]
- Sedaghat, A.; Sharif, M. Mitigation of the impacts of heat islands on energy consumption in buildings: A case study of the city of Tehran, Iran. Sustain. Cities Soc. 2022, 76, 103435. [Google Scholar] [CrossRef]
- Zhao, Y.; Chen, Y.; Li, K. A simulation study on the effects of tree height variations on the façade temperature of enclosed courtyard in North China. Build. Environ. 2022, 207, 108566. [Google Scholar] [CrossRef]
- Pérez, G.; Rincón, L.; Vila, A.; González, J.; Cabeza, L. Green vertical systems for buildings as passive systems for energy savings. Appl. Energy 2011, 88, 4854–4859. [Google Scholar] [CrossRef]
- Poddar, S.; Park, D.Y.; Chang, S. Simulation Based Analysis on the Energy Conservation Effect of Green Wall Installation for Different Building Types in a Campus. Energy Procedia 2017, 111, 226–234. [Google Scholar] [CrossRef]
- Karimi, K.; Farrokhzad, M.; Roshan, G.; Aghdasi, M. Evaluation of effects of a green wall as a sustainable approach on reducing energy use in temperate and humid areas. Energy Build. 2022, 262, 112014. [Google Scholar] [CrossRef]


| State | City | Year | Description |
|---|---|---|---|
| Germany | Berlin | 1994 | Biotope Area Factor (BAF) concept was included in the municipal regulations to express the use of green infrastructure (public green area at ground level, green roofs, and green façades) for urban areas, characterized by a higher density and significant GHG emissions [15]. |
| Sweden | Stockholm | 2010 | Green Space Factor (GSF) was introduced to calculate the green space requirements for new urban development areas [16,17]. |
| Sweden | Malmö | 2010 | Green Space Factor (GSF) and Green Points System, setting a checklist of different infrastructure alternatives for developers to provide a minimum level of green/blue spaces [16,17]. |
| United Kingdom | North-West England | 2008 and 2010 | “Northwest Green Infrastructure Guide”, The Green Infrastructure Score was introduced as a voluntary adoption of a scoring system to evaluate the benefits of greenery solutions, concerning their impacts on different aspects [18]. |
| Austria | Wien | - | “Fassadenbegrünung”, a guideline to include green facades in the urban environment for both private and public buildings, highlighting the related ecological functions and design options [19]. |
| Region | Province | Year | Regulation Article | Assessment Topic Considered |
|---|---|---|---|---|
| Basilicata | Potenza | 2009 | Art. 86 subsection 1 e 4; Art.72 comma 2 e 3; Art.73_R.E. [24] | L * |
| Emilia-Romagna | Bologna | 2021 | Art. 61 subsection 2_R.E. [25] | A/D/E/G * |
| Friuli-Venezia Giulia | Pordenone | 2020 | Art. 65 subsection 3_R.E. [26] | B/C/D/F/H/L/M/N * |
| Lazio | Roma | 2018 | Art. 23 subsection 1 R.C. n.37726 [27] | N * |
| Liguria | Genova | 2020 | Art. 56 subsection 1_R.E. [28] | A/B/C/E/F * |
| Lombardia | Brescia | 2022 | Art. 31 subsection 37_R.E. [29] | B/C/E/H/M * |
| Cremona | 2012 | Art. 137_R.E. [30] | A/L * | |
| Milano | 2022 | Action 4.2.2 Air Climate Plan [31] | A/F/L * | |
| Piemonte | Torino | 2020 | Art.21 subsection 11_R.V. [32] | N * |
| Puglia | Bari | 2022 | Art.29.2.16.3_R.E. [33] | B/D/E/F/H/I * |
| Toscana | Siena | 2016 | Art.5 subsection 4 Appendix H_R.E. [34] | B/E * |
| Green Paved Areas | Paved Areas | Building Footprint | Trees | Public Roads | |
|---|---|---|---|---|---|
| S (m2)—(n/m2) | 31,854 | 148,747 | 90,325 | 71 * | 47,916 |
| R (-) | 0.01 | 0.466 | 0.283 | - | 0.150 |
| Material | Thickness (m) | Conductivity (W/Mk) | Specific Heat (J/kgK) | Absorption (%) | Reflection (%) |
|---|---|---|---|---|---|
| Precast concrete | 0.04 | 0.85 | 840 | 70 | 30 |
| Expanded Sintered Polystyrene EPS | 0.08 | 0.035 | 1000 | 30 | - |
| Precast concrete | 0.04 | 0.85 | 840 | 70 | 30 |
| Material | Thickness (m) | Conductivity (W/mK) | Specific Heat (J/kgK) | Absorption (%) | Emissivity |
|---|---|---|---|---|---|
| Fiber Cement | 0.02 | 0.60 | 1000 | 60 | 0.90 |
| Air | 0.70 | 0.025 | 1006 | - | 0.96 |
| Rock Wool | 0.06 | 0.034 | 1000 | 42 | 0.90 |
| Fiber Cement | 0.02 | 0.60 | 1000 | 60 | 0.90 |
| Material | Thickness (m) | Conductivity (W/mK) | Specific Heat (J/kgK) | Absorption (%) | Emissivity |
|---|---|---|---|---|---|
| Elastomeric Bituminous Sheath | 0.004 | 0.17 | 1000 | 60 | 0.90 |
| Expanded Polyethylene | 0.05 | 0.035 | 1000 | 30 | 0.90 |
| Concrete | 0.08 | 0.85 | 840 | 70 | 0.90 |
| Intervention | Pavement | Albedo | Emissivity | Extension |
|---|---|---|---|---|
| CP_M1 CP_M2 | Concrete pavement light | 0.80 | 0.90 | All public roads |
| Intervention | Greening | Thickness [m] | Leaf Area Index [m2/m2] | Leaf Angle Distribution | Facades Involved |
|---|---|---|---|---|---|
| GW.1_M1 GW.1_M2 | Elix Hedera | 0.30 | 1.5 | 0.5 | South oriented and prospecting wider urban canyons |
| GW.2_M2 | Elix Hedera | 0.30 | 1.5 | 0.5 | South oriented and prospecting all urban canyons |
| Intervention | Tree | Width (m) | Height (m) | Leaf Area Density (m2/m3) | Number of Trees |
|---|---|---|---|---|---|
| TP_M1 | Tilia cordata “Rancho” | 4.05 × 5.78 | 8.63 | 1.5 | 345 |
| TP_M2 | Tilia cordata “Rancho” | 4.05 × 5.78 | 8.63 | 1.5 | 68 |
| Latitude | Longitude | Climate Zone | Heating Period | HDD (K/d) | Gh (kWh/m2a) | Dh (kWh/m2a) | Bn (kWh/m2a) | Ta (°C) | Td (°C) | FF (m/s) |
|---|---|---|---|---|---|---|---|---|---|---|
| 44.31° N | 11.16° E | E | 15/10–15/04 | 2259 | 1309 | 652 | 1204 | 14.2 | 7.9 | 2.6 |
| Model | X Size (m) | Y Size (m) | Z Size (m) | Dx (m) | Dy (m) | Dz (m) | Telescoping Factor | Nesting Grids |
|---|---|---|---|---|---|---|---|---|
| M1 Whole district | 604 | 748 | 43.62 | 4 | 4 | 1 | 30% after 2 m height | 3 in each direction |
| M1 District portion | 152 | 196 | 43.62 | 2 | 2 | 1 | 30% after 2 m height | 3 in each direction |
Publisher’s Note: MDPI stays neutral with regard to jurisdictional claims in published maps and institutional affiliations. |
© 2022 by the authors. Licensee MDPI, Basel, Switzerland. This article is an open access article distributed under the terms and conditions of the Creative Commons Attribution (CC BY) license (https://creativecommons.org/licenses/by/4.0/).
Share and Cite
Ciacci, C.; Banti, N.; Di Naso, V.; Montechiaro, R.; Bazzocchi, F. Experimentation of Mitigation Strategies to Contrast the Urban Heat Island Effect: A Case Study of an Industrial District in Italy to Implement Environmental Codes. Atmosphere 2022, 13, 1808. https://doi.org/10.3390/atmos13111808
Ciacci C, Banti N, Di Naso V, Montechiaro R, Bazzocchi F. Experimentation of Mitigation Strategies to Contrast the Urban Heat Island Effect: A Case Study of an Industrial District in Italy to Implement Environmental Codes. Atmosphere. 2022; 13(11):1808. https://doi.org/10.3390/atmos13111808
Chicago/Turabian StyleCiacci, Cecilia, Neri Banti, Vincenzo Di Naso, Riccardo Montechiaro, and Frida Bazzocchi. 2022. "Experimentation of Mitigation Strategies to Contrast the Urban Heat Island Effect: A Case Study of an Industrial District in Italy to Implement Environmental Codes" Atmosphere 13, no. 11: 1808. https://doi.org/10.3390/atmos13111808
APA StyleCiacci, C., Banti, N., Di Naso, V., Montechiaro, R., & Bazzocchi, F. (2022). Experimentation of Mitigation Strategies to Contrast the Urban Heat Island Effect: A Case Study of an Industrial District in Italy to Implement Environmental Codes. Atmosphere, 13(11), 1808. https://doi.org/10.3390/atmos13111808