Case Report

Urban Wind Field Mapping Technique for Municipal Environmental Planning: A Case Study of Cheongju-Si, Korea

1
National Institute of Environmental Research (NIER), Incheon 22689, Korea
2
The Malgum Company, Seoul 08507, Korea
*
Author to whom correspondence should be addressed.
Atmosphere 2022, 13(11), 1805; https://doi.org/10.3390/atmos13111805
Submission received: 30 August 2022 / Revised: 24 October 2022 / Accepted: 26 October 2022 / Published: 31 October 2022
(This article belongs to the Section Atmospheric Techniques, Instruments, and Modeling)

Abstract

:
The integrated management of land and environmental plans (EPs) has been a key direction of sustainable policy in Korea. Although local EPs should be established based on spatial data, much of the pertinent environmental information has not been mapped. Accordingly, we develop a wind field mapping technique for establishing local EPs. This method was developed via a numerical weather prediction model (Weather Research and Forecast—WRF), and a diagnostic meteorological model (California Meteorological model—CALMET), based on weather observation data, as well as terrain and land cover data. The developed method was applied to a case study in Cheongju-si, Korea, for verifying its effectiveness. The created wind field maps of Cheongju-si provided an intuitive visual representation of the spatial distribution of seasonal and daytime/nighttime wind patterns. Such data helped understand the directionality and patterns of winds blowing into a city, or identify stagnant areas of wind circulation. Overlaying the wind field map with maps of air pollutant emissions revealed that pollutants from industrial areas could flow along the prevailing winds into residential areas downtown. These maps also implied that open spaces, such as parks and grasslands, were recommendable for stagnant areas, instead of creating industrial complexes or residential areas.

1. Introduction

Up until the 2000s, the environmental plans (EPs) of Korean municipalities were not spatially established based on precise environmental maps. Accordingly, the functional linkages between EPs and urban land use plans have been lacking, resulting in inter-plan inconsistencies, and creating difficulties in effectively addressing urban environmental problems. While certain maps, such as those of urban biotopes and air quality monitoring, have been actively employed in management, there has been little utilization of urban climatic maps, especially those related to the wind; however, in line with the escalating importance of EP measures in urban environments to improve air pollution and to anticipate adaptation to climate change, as witnessed through heat waves or increasing number of days with high particulate matter levels, the development of urban climate maps has been actively promoted [1,2,3].
Since the adoption of the slogan, ‘National Land Development in Harmony with the Environment,’ as one of the national framework projects of the Korean government in 2013, the ‘linkage system’ or ‘integrated management,’ emphasizing the link between land use and environmental planning, has been the key focus of relevant major policies proposed by the Ministry of Environment for promoting sustainable development. Related provisions were added in 2015 by the Framework Act on Environmental Policy for establishing such linkage systems. The Framework Act on National Land was amended in 2016 to account for EP during land planning. In 2018, a joint ordinance was enacted specifying the scope of linkage systems, targeting the content, organization, and operation of relevant councils and sharing among information systems. In 2020, the existing National Comprehensive Environmental Plan (2016–2035) was revised to align with the National Comprehensive Territorial Plan (2020–2040).
Although the linkages between national government ministries have shown meaningful progress, achieving successful integrated management of land and environmental planning mandates that EPs of the city (si) or county (gun) should be closely linked with urban planning (master or management plan for the si/gun; Table 1). In urban planning, key land use decisions or the establishment of management zones are made based on spatial information using large-scale (≥1:5000) maps; therefore, EPs should also be established as spatial plans based on large-scale environmental maps. Despite this necessity, however, most environmental data have been constructed as value tables for each measurement point, while the development of spatial databases (digital maps, etc.) and their resulting application to EPs have been limited.
The Ministry of Environment provided guidelines on spatially establishing municipal EPs based on environmental maps [5]. With the mounting importance of creating zero-carbon cities and adapting to climate change, the need for climate maps for EP establishment has also been growing. For temperature and precipitation distribution, maps published by governmental agencies (e.g., the Korean Meteorological Administration—KMA) can be used; whereas for wind field maps representing the distribution of wind directions and speeds, it is necessary to use meteorological prediction models with weather observation data, digital terrain models, and land cover data. Therefore, wind field mapping is more complicated, with relatively fewer successful examples of maps created. Here, local authorities must create their own maps, but these efforts are limited by insufficient data; thus, despite their strong potential applicability in spatial planning, the required budgets, and professional workforce are typically limited at this scale. Therefore, among the various available techniques for wind field mapping, easy-to-implement methods with low costs are required.
The purpose of the present study is to introduce a wind field mapping technique applicable to municipal (si/gun) EPs that supports municipalities in improving air quality and in preparing for adaptation to climate change. To this end, a wind field mapping technique was developed by examining national and international urban climate atlas cases. With Cheongju-si as the case example, a pilot wind field map was constructed. The discussions of the map utilization plans for EP establishment are also presented in this paper.

2. Literature Review

Mapping and use of the urban climate atlas (a collection of climate maps) started in Germany. It has been actively applied in Hong Kong and several Japanese cities, including Tokyo [6]. Baumüller and his colleague climatologists were the first to study urban climate maps in the 1970s to improve air pollution via land and environmental planning in Stuttgart, a city with known stagnant air circulation [7]. Throughout the 1980s, other German cities began to introduce urban climate atlas as well.
In 1992, climatologists in Stuttgart created a climate atlas (‘klimaatlas’) of Stuttgart and neighboring regions [8]. This climate atlas was used to identify cold wind-generating, and stagnant areas, for calculating the air volume of cold wind entering the city along suburban mountain valleys at night [7,9]. In turn, these data were used for arranging buildings and establishing construction restrictions for securing municipal wind paths in cities, creating urban green corridors, and forming an air dam to retain cold winds and guide them in specific directions via densely planted large trees.
In Berlin, the ‘Landscape Program’ came into effect in 1981 as a new land use plan based on the Nature Conservation Act [10]. To this end, environmental information maps (‘umweltatlas’) were actively created and released to the public via FIS-BROKER [11,12]. The environmental maps in the climate field consisted of nine themes (e.g., climate analysis, urban climate zones, bioclimate, surface temperatures), and 87 thematic maps were constructed as maps, including day and nighttime wind fields, cold air flow, and nighttime cooling rates for the entire city or specific regions derived via climate models. Maps to serve as references for urban planners or policymakers were also included, such as the direction of wind paths to be created in the city.
The urban climate analysis technique of Germany was also applied to urban planning in multiple Japanese cities in the late 1990s, including Osaka, Fukuoka, Kobe, and Okayama [6]. In 2000, an Urban Environmental Climatic Atlas of Tokyo was created [13], with maps consisting of basic climatic information (e.g., temperature), urban elements (e.g., location and arrangement of buildings), and analysis maps for establishing measurements of urban heat island phenomena, and air quality improvements. The basic information map for identifying the urban heat island effects included a wind direction and velocity map (i.e., a wind field map).
In Hong Kong, a city characterized by high-rise buildings and high-density developments, a climate atlas, including thermal load and dynamic potential maps, was created using land cover, topography, building, and wind information [14,15]. In the mapping process, field surveys, modeling, and wind tunnel experiments were utilized, with one of the characteristics of the map being that climate zones were defined based on physiological equivalent temperature (PET) [16,17], the human heat stress index.
The pioneering case of Germany has drawn attention as an exemplary model for the linkage system of land and environmental planning in Korea, as the country has established a landscape plan (‘landschaftplan’) using spatial data [18]. The climate atlases of Germany, Japan, and Hong Kong have also affected the climate field in the EPs of Korean cities [2,3,19]. The air environment section of the Korean Guidelines for Environmental Planning for Local Authorities (revised in 2021), in accordance with Articles 18 and 19 of the Framework Act on Environmental Policy, includes “wind environment analysis” and “microclimate management.” These guidelines also specify the creation of wind-related maps for providing information on the direction of prevailing winds and circulation systems of the area, derived using numerical modeling or processing and analyses of observation data, with a list of maps that can be used for planning listed in the Guidelines appendix. Although wind-related maps are not designated as mandatory, they are recognized as important planning data for microclimate management (e.g., creating ‘cool and fresh air generation’ or ‘wind path zones’).
For Seoul, a climate atlas is available on the ‘urban planning portal’ website [20]; however, only two wind-related thematic maps (climate zones and seasonal average wind speeds at 1.5 and 10 m above the ground surface) are included; whereas a wind field map was not. In the Seoul EP (2016–2025), utilization of wind-related maps was low [21], while only maps of average annual wind speeds and the most frequent wind direction were employed in the 2030 Seoul Plan [22]. Recently, an evaluation map for wind-producing potential was created for identifying regions contributing to the formation of cold air passages in consideration of land cover, topography, and biotope information. This map was expected to be useful for utilization in EPs and urban plans [3].
The EPs (2016–2025) of Cheongju-si were established as a spatial plan based on various environmental maps to link with urban planning [23]. The five thematic maps on urban climate included wind and temperature simulations at the ground surface (5 m height), simulations of major wind paths, and stagnant wind circulation areas affected by land use, land surface temperature, and hourly temperature change. These maps adequately visualize the locations of cold air generation and direction, which contributes to the mitigation of the heat island phenomenon. These maps were thus used to locate stagnant areas of wind circulation and analyze the locations of industrial complexes, as well as the diffusion direction of air pollutants.
Since 2017, some branches of the KMA have started to create wind field maps as part of the climate information service project. For example, a wind field map of the Seoul metropolitan area was created for 2014–2018 [24,25], while the preparation of the 2018–2020 wind field map for the Gwangju and Jeonnam regions in the southwest is underway [26].

3. Methods

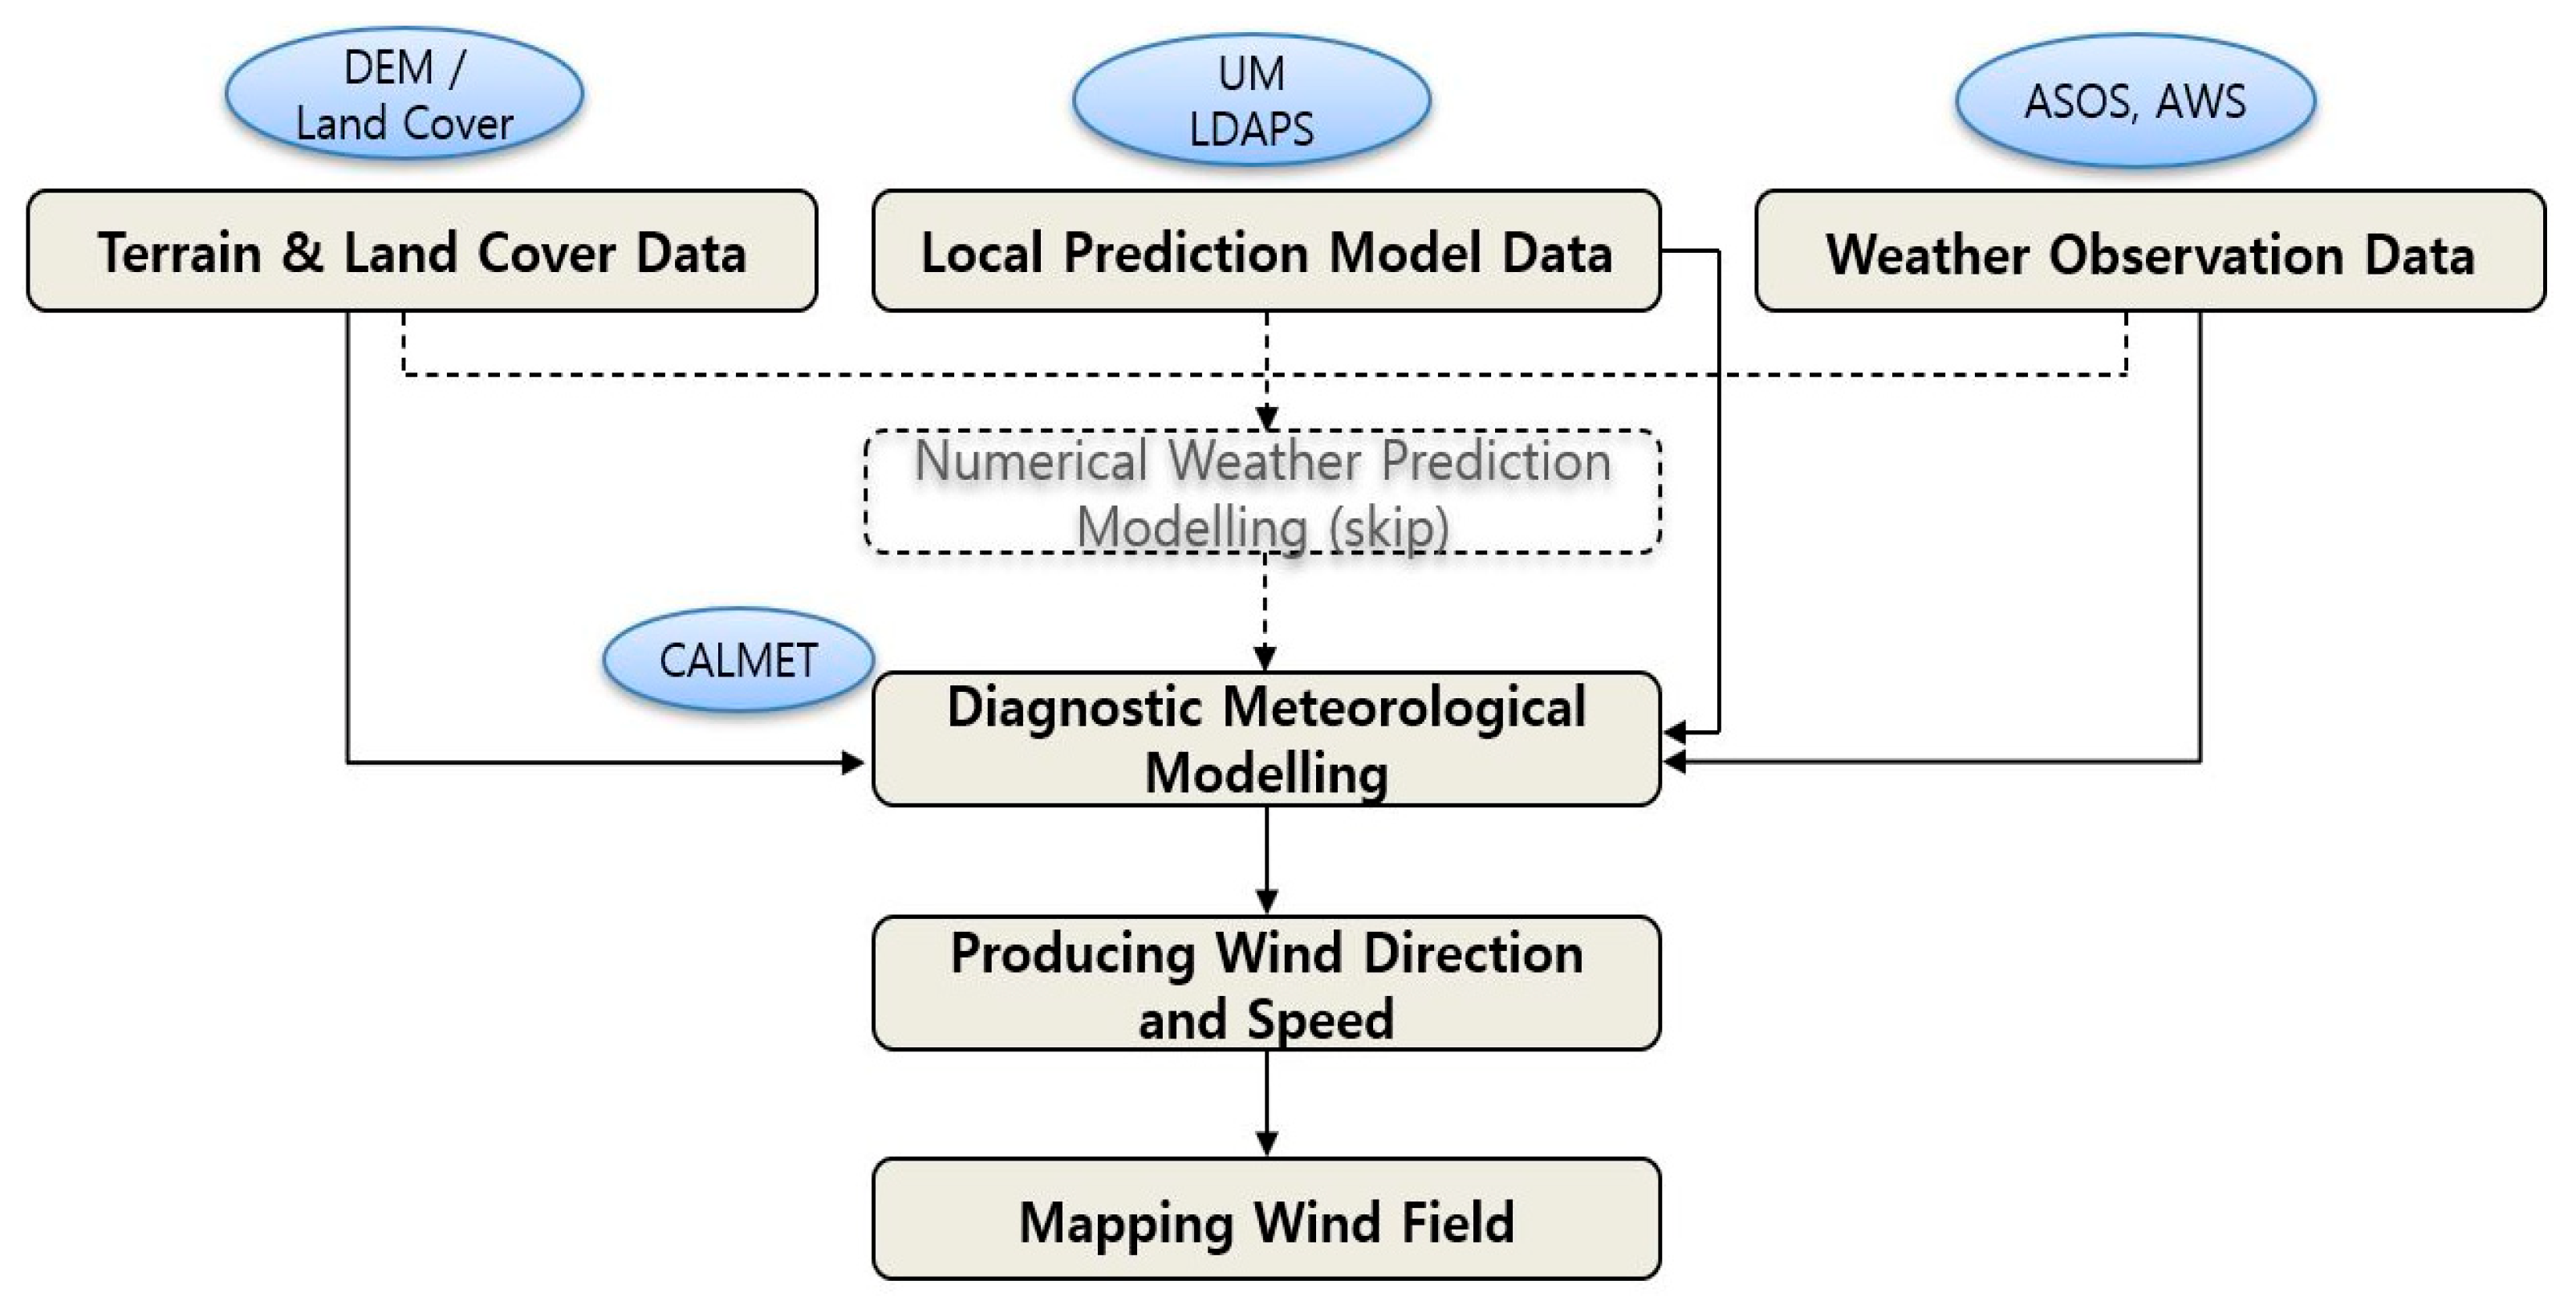
3.1. Research Workflow

Here, a meteorological modeling technique (numerical weather prediction model, diagnostic meteorological model) for wind field mapping was presented based on weather station observations and local numerical weather prediction system data (namely, the Local Data Assimilation and Prediction System—LDAPS) for local authorities establishing EPs. To verify the effectiveness of this method, a pilot mapping effort was conducted using Cheongju-si as a case example, and methods of utilizing the developed wind field map for Eps were presented.
Site-specific wind direction and speed data were acquired from four automated synoptic observation systems (ASOSs) and seven automatic weather stations (AWSs), whereas interpolating these data across the study area for wind field mapping required predictive means for meteorological modeling. Figure 1 shows the process of wind field mapping employed here, which included data collection, numerical weather prediction modeling, diagnostic meteorological modeling, calculation and derivation of wind element data (wind direction and wind speed), as well as mapping.

3.2. Data Collection

Data required for wind field mapping included LDAPS, weather station observation, terrain, and land cover data.

3.2.1. Local Data Assimilation and Prediction System and Weather Station Observation Data

Until the KMA developed its weather forecast model in 2020, the unified model (UM) had been used, a numerical weather prediction model system developed by the UK MET Office, for weather forecasting [27,28,29]. The UM is characterized by integrating the functionalities of several models, including seasonal forecasting and climate modeling, into a singular structure [30]. For this model, data with a 1.5 km spatial resolution composed of 70 layers (UM LDAPS 1.5kmL70) were generated. All data can be obtained from the Open MET Data Portal of KMA [31].
To increase the prediction accuracy of the meteorological model, a data assimilation process was required for observation data entry. Accordingly, observation data from ASOS and AWS for disaster control were obtained from the Open MET Data Portal of KMA [31] and employed here.

3.2.2. Terrain and Land Cover Data

In the numerical weather prediction and diagnostic meteorological models used for wind field mapping, the effects of terrain (e.g., elevation, slope, aspect) and land cover (e.g., forest, agricultural land, built-up area) can be considered. These models include terrain and land cover data of 30 × 30 s (0.7 km × 0.9 km in Cheongju-si) grid cells provided by the US Geological Survey (USGS); however, the spatial resolution of the data was relatively low for use in municipal wind field maps. Kim indicated that WRF modeling with 3 s (90 m) SRTM (Shuttle Radar Topography Mission) data and 1 s land cover data from the Environmental Geographic Information Service (EGIS) [32], instead of 30 s USGS data, was more successful to describe the meteorology in montane basin area [33]. Jeon and Kim presented that CALMET modeling with land cover maps of EGIS could simulate PBL (Planetary Boundary Layer) height and sea breeze better than with USGS data because EGIS data could reflect recent industrialization and urbanization [34].
The Guideline on Precise Mapping for Spatial Environmental Information (Draft) from the National Institute of Environmental Research (NIER) recommends that terrain and land cover data with high spatial resolutions (≤100 m) should be employed for this purpose [35]. For terrain, the digital elevation model (DEM) data for each map provided by the National Geographic Information Platform of the National Geographic Information Institute (NGII) were used [36]; whereas for land cover data, a mid-level classification land cover map (1:25,000) of the Environmental Geographic Information Service (EGIS) from the Korean Ministry of Environment was employed [32].

3.3. Modelling

The modeling in the present study consisted of two steps: numerical weather prediction and diagnostic meteorological modeling. In the former, the Weather Research and Forcast model (WRF version 3.6.1) [37] was employed here.
To predict three-dimensional air flow with WRF, the UM LDAPS 1.5kmL70 data were used as an initial input field. The physical schemes of WRF are presented in Table 2. Data assimilation was performed using ASOS data and upper-atmosphere observation data in 2016, with horizontal resolutions of 1.5 × 1.5 km (domain 1, 53 × 53 grids) and 500 × 500 m (domain 2, 106 × 106 grids), respectively, with respect to LDAPS resolution and a vertical resolution set to ≥15 layers. The stabilization time was set to ≥5 days, with the duration of a single model run not exceeding 40 days. The results of the numerical weather prediction model were converted to use as input data for the diagnostic meteorological model.
Here, the diagnostic meteorological model served as a meteorological processing system for generating diagnostic wind and temperature fields while calculating meteorological elements at any point via spatial interpolation and extrapolation of meteorological data. Diagnostic meteorological models include the California Meteorological Model (CALMET) [38], Meteorology and Atmospheric Photochemistry Meso-scale Model (MetPhoMod) [39], and the Climate Analysis Seoul model (CAS) [21]. Among the models, the CAS model was developed by the National Institute of Meteorological Sciences in collaboration with researchers at the Technische Universität Berlin, Germany. This model uses the MetPhoMod as the initial meteorological field and has the advantage of simulating the spatial distribution of temperature, wind direction, and wind speed according to the arrangement of buildings and vegetation in urban areas [40,41]; however, it is not overly easy for use by local authorities or private companies, as the model is not yet publicly distributed due to licensing issues with German researchers. Alternatively, CALMET is a publicly distributed model and maintains an abundance of users and model applications. Further, CALMET is also advantageous for its use as California Puff Model (CALPUFF) input data, a model for air pollutants diffusion [42,43]. Developers of CALMET described that kinematic effects of terrain on terrain-forced vertical velocity and horizontal wind components, slope flows affected by the elevation drop from the crest, and thermodynamic blocking effects of terrain on wind flow can be evaluated. [38,43] Accordingly, CALMET was deemed the most appropriate diagnostic meteorological model for use, and version 6.2.1.8. was employed here [43]. The Seoul Metropolitan Office of Meteorology and Gwangju Office of Meteorology have also used CALMET for wind field mapping [24,25,26].
The WRF modeling results from the previous step were converted into CALWRF data, whereas the terrain and land cover data were also input into the model. The horizontal resolution was set to 200 m × 200 m (250 × 250 grids), and the vertical resolution was set at ≥15 layers, with the second layer being ≤50 m.
When calculating wind speed and wind direction 10 m above ground level according to the WRF and CALMET models, hourly, daily (daytime or nighttime), seasonal, and annual data were selected depending on the purpose of use. Seasons were divided into spring (March–May), summer (June–August), autumn (September–November), and winter (December, January, February), whereas daytime and nighttime were set to 07:00–18:00 and 19:00–06:00, respectively. Based on the extracted elements, the wind direction was indicated by the directionality of arrows, whereas wind speed was indicated by arrow size. Ultimately, a wind field map was created by overlaying these data onto other thematic maps, such as digital topographic maps or those of administrative districts for local authorities.

3.4. Study Area for Pilot Test Mapping

To verify the applicability of the proposed wind field mapping technique, some wind field maps were created for Cheongju-si, Korea, as a pilot test mapping site (Figure 2a). Cheongju-si represents an area where the collection of input data for wind field maps, as well as the comparative analysis with other thematic maps, can be performed relatively easily, as various environmental spatial databases were constructed through the 2016 pilot project regarding the linkage system between environmental and land planning. Relatively high hillslopes covered by forest are located to the east and south of the city, while a river (the Mihocheon) flows from the northern part of the region to the southwestward direction (Figure 2b). Major air pollutant emission sources are notably concentrated on the north and west sides of the city (Figure 2c).
Regarding the input data for wind field mapping, based on UM LDAPS 1.5kmL70 data in 2016, AWS data from four weather stations, in addition to ASOS data from seven locations, were used (Figure 2d). For terrain information, 3 s data from the Environmental Geographic Information Service (EGIS) of the Ministry of Environment were used. For the land cover, 1:25,000 scale maps created by EGIS in 2010 were converted to 1 s grid cells for use.

4. Results

4.1. Verification of the Performance of WRF and CALMET

To make a wind field map of Cheongju-si, WRF and CALMET models were used. The results of those two models were compared with observed hourly data of 2016 from the Cheongju meteorological station. Mean bias, Root Mean Square Error (RMSE), Correlation coefficient (R), Index of Agreement (IOA), and Mean Absolute Error (MAE) were presented in Table 3 with reference values of previous study [44,45].
Mean bias and IOA of wind speed by WRF modeling were out of the value range suggested by California Air Resources Board and South Coast Air Quality Management District (CARB and SCAQMD), while RMSE was within it [44]. The MAE of wind direction by WRF was larger than that of Byon et al. [45], who reported the MAEs of wind direction by WRF ranged from 30° to 50° in Korea.
The output of WRF modeling was used as initial input data for CALMET models. After CALMET modeling closer value to observation data could be predicted (Table 3). Mean bias, RMSE, IOA of wind speed, and MAE of wind direction were within the range of CARB and SCAQMD (2006) [44] or Byon et al. [45] suggested.

4.2. Characteristics of Wind Field in Cheongju-Si

The annual wind field map of Cheongju-si in 2016, created according to the proposed wind field mapping method, is shown in Figure 3. Wind direction and wind speed are expressed in terms of arrow direction, size, and color for a more intuitive visual representation of the data at each point.
In the northern and western areas of Cheongju-si, northwesterly and westerly winds were prevailing, respectively; whereas in the eastern and southern areas, which are distributed with relatively high hillslopes covered by forest, the wind speeds and directions showed significant variability dependent upon the locations, considered here to be the effect of the mountain-valley breeze. As for the winds entering the city center, the northwesterly and westerly winds prevailed during the day, while easterly winds from the mountains were predominant during the nighttime (Figure 4).
Westerly, southwesterly, and southerly winds were predominant in the spring. In the summer, southwesterly and southerly winds prevailed, except for the northern and western regions where northwesterly and westerly winds were predominant. Northerly and northeasterly winds prevailed in the autumn, while strong northwesterly winds prevailed in winter (Figure 5).

4.3. Implication of Wind Field Maps to Environmental Plan in Cheongju-Si

When the wind field map of this study was combined with data regarding the distribution of air pollutant emission sources and residential areas, useful information was gathered for informing decision making regarding the improvement of air pollution conditions and the creation of a more comfortable air environment (Figure 6). Here, both the wind field map derived from the application of the WRF and CALMET models (Figure 6a), and the wind field map of the Cheongju-si EP, with the application of the CAS model (Figure 6b) showed strong winds blowing from the northwest to the city center, as well as the distribution of stagnant areas of wind circulation (e.g., dotted oval area) adjacent to the Mihocheon River. Relatively high montane areas are distributed to the east and south of Cheongju-si, while air pollutant emission sites are mainly concentrated to the north and west of the city; thus, the wind field map displayed that the polluted air can be blown into municipal residential areas (Figure 6c,d).
Accordingly, it is desirable in the future to avoid this area when selecting locations for new industrial complexes or air pollutant emission facilities. In more stagnant areas of wind circulation, such as those adjacent to the Mihocheon River, it is better to create open space (waterside, parks, agricultural lands, grasslands, etc.) and use it as a wind path for achieving a pleasant atmospheric environment, rather than housing or air pollutant emissions facilities (e.g., industrial complexes).

5. Discussion

5.1. Utilization of the Wind Field Map for EPs

The wind field map (Figure 6a) of Cheongju-si derived here can serve as a useful reference for site selection of new industrial complexes or other air pollutant emission facilities, as well as land use planning for alleviating stagnant areas of wind circulation. It is thus desirable to avoid the addition of new industrial complexes or other air pollutant emissions facilities in the north or west of the city, where northwesterly and westerly winds prevail, as this may further deteriorate the air quality of the city center. This point is also recognized in the EP of Cheongju-si (2016–2025), where it is recommended that (1) the industrial complexes in the north and west should be converted from ‘chimney industry’ sites to eco-complexes or high-tech industry sites. (2) Since the area south of downtown, where the Mushimcheon River passes through the residential area, is an important wind path, construction of high-rise apartment buildings should be avoided in this area [23]. In the regions of stagnant wind circulation on the west side of the urban area (Figure 6, dashed ovals), it can be seen that open spaces (e.g., waterside, parks, agricultural lands, grasslands) should be established to create more comfortable air environments, rather than housing or air pollutant emission facilities, such as industrial complexes.
Wind field maps can contribute not only to reducing air pollution but also to improving thermal comfort, thereby reducing damages from heat waves, which have recently intensified and occurred more frequently due to climate change. When combined with temperature field information, the flow direction and speed of cold air can be simulated. Furthermore, with the integrated use of the wind field and land surface temperature maps, as well as thermal comfort information, the wind circulation status of heat island areas can be identified, informing the prioritization of areas that most require wind path creation for improving thermal comfort. As a part of the Cheongju-si EP (2016–2025), the wind and temperature 5 m above ground level were simulated based on the average meteorological values and the most frequent meteorological phenomena in July over the past 30 year (1981–2010) [23]. According to the simulated results, it was predicted that after sunset, cold winds shifted from the north of the city to the southwest along the Mihocheon River, thereby expanding the cooling area [23].
The Cheongju-si EP (2016–2025) highlighted that wind field maps are quite useful for interpreting the air environment of a city: Wind field maps offer good visual references for urban planners and decision-makers. Local authorities with a low budget and limited human resources, however, may hesitate to apply wind field maps to EP. The present study suggested that modeling with a free and widely used model (e.g., CALMET) can effectively provide useful wind field maps, which may encourage local authorities to try implementing them into their EP.

5.2. Potentially More Simplified Wind Field Mapping

The effectiveness of combining the WRF and CALMET models for wind field prediction has been shown in a number of previous studies [46,47,48,49]; however, from the perspective of local authorities, there are practical difficulties in running both numerical weather prediction and diagnostic meteorological models. Notably, the Seoul Metropolitan Office of Meteorology has produced high-quality wind information with the use of the CALMET model alone [24,25]. In the Gwangju Office of Meteorology, when considering the ease of use for various urban climate analysis models (e.g., universality, public sector use examples, open source availability), urban effect applicability (e.g., 3D spatial information, wind environment analysis, thermal environment analysis), and operational feasibility (web UI, operation speed, customization), it was concluded here that with the CALMET model forming the basis, the combined use of other models capable of simulating 3D building impacts and solar radiation was more appropriate compared with the WRF model [26].
Despite the strengths of the WRF model that allowed for the prediction of meteorological elements considering the influence of topography and land cover, it can be burdensome for local authorities to operate the model in a Linux environment (unlike CALMET, which can be operated in Windows). When considering the practical difficulties, a novel alternative has been presented here, so that the numerical weather prediction model (e.g., WRF) can be skipped, while only a diagnostic meteorological model (e.g., CALMET) can be employed for the wind field mapping depending upon the circumstances of local authorities (Figure 7).

5.3. Limitation of the Proposed Wind Field Mapping and Suggestion

The wind field mapping method proposed in the present study has thus far been applied to only one study location (Cheongju-si, Korea), so the capacity to evaluate the applicability of the mapping method is limited; however, since the mapping technique employed common models with relatively easy levels of access and utilization, it is believed that other local authorities can similarly apply the proposed technique for visually deriving regional overall wind fields. Limited weather stations in the municipality can complicate data assimilation or verification, and the resulting prediction accuracy of the wind field can be lowered. Since the proposed mapping technique here did not take into account changes in wind direction, speeds, or shade effects according to building height and arrangement, the conclusions are somewhat limited when analyzing wind paths and thermal comfort at the street or human height levels, where such effects will be most appreciated. Accordingly, in addition to the methods proposed in the present study, urban-scale climate analysis models (e.g., KLAM_21) [50,51,52] that simulate cold air flow, or microclimate models (e.g., ENVI-MET) [53,54] that consider the impact of buildings in small areas would be appropriate. Recently, various local authorities have been actively creating spatial EPs and urban climate atlases, while studies applying climate models in Korea are a frequent focus as well [24,25,26,47]. Accordingly, the mapping technique proposed in the present study may require further revision following the accumulation of wind field mapping study results.

6. Conclusions

Recently, the integrated management of land and environmental plans has been a key direction of sustainable policy implementation in Korea. To this end, local EPs should be established based on spatial data; however, in practice, much of the pertinent environmental information has not been mapped. Accordingly, the present study was conducted to develop a wind field mapping technique via climate and environmental information maps necessary for establishing local EPs. Further, the developed methods here were applied in practice to examine their accuracy and mapping capacity.
Based on the UM LDAPS, AWS, ASOS, terrain, and land cover data, a method of mapping the distribution of wind direction and speed for each region of a city was developed with the use of a numerical weather prediction model (WRF), and the diagnostic meteorological model (CALMET). The developed method was then applied to create a wind field map for Cheongju-si as a pilot test.
The created Cheongju-si wind field map provided an intuitive visual representation of the spatial distribution of seasonal and daytime/nighttime wind directions and speeds. Such data are useful in identifying stagnant areas of wind circulation or understanding the directionality and patterns of the wind blowing into the city. When the wind field map was overlayed with a separate map of air pollutant emission sources and residential areas, it was revealed that pollutants emitted from industrial areas to the north and west flowed along the prevailing northwesterly and westerly winds into the downtown area, where residential areas are concentrated. These findings indicate that the creation of new industrial complexes or the addition of air pollutant emission sites should be avoided to the north and west of Cheongju-si, whereas for addressing the stagnant areas of wind circulation, open spaces, such as parks, grasslands, and agricultural lands should be created to form wind paths, rather than establishing industrial complexes or residential areas in these locations. In the established spatial Cheongju-si EP (2016–2025), these problems and improvement directions have also been reflected through a wind field map. The present study suggested a mapping method for local authorities to effectively create useful wind field maps, which could be applied in EPs, yielding similar effects shown in Cheongju-si EP.
Wind field maps can contribute not only to air quality improvements but also to enhancing thermal comfort, such as reducing damages associated with heat waves or adapting to climate change. When combined with temperature field data, the direction and speed of cold air flow can also be simulated and applied to establish wind path creation plans for the inflow of cold air into the city centers, as well as to evaluate the effectiveness of policy projects directed at wind path creation. Furthermore, combining wind field maps with maps of surface temperature or heat comfort information can also be useful for identifying and prioritizing areas requiring wind path creation for reducing heat island effects and improving the thermal comfort of the urban public.
As the importance of wind field maps in EP is increasing, and research applying urban climate models has recently intensified, the mapping technique proposed in the present study may need revision in the near future, according to recent EPs and study results.

Author Contributions

Conceptualization, Y.S. and S.P.; methodology, Y.S. and S.P.; software, M.Y.; validation, M.Y. and Y.S.; formal analysis, S.P. and M.Y.; investigation, Y.S. and H.Y.; resources, M.Y. and S.P.; data curation, S.P. and H.Y.; writing—original draft preparation, Y.S.; writing—review and editing, S.P., H.Y. and M.Y.; visualization, S.P. and H.Y.; supervision, Y.S.; project administration, H.Y.; funding acquisition, Y.S. All authors have read and agreed to the published version of the manuscript.

Funding

This research was supported by the National Institute of Environmental Research (NIER), funded by the Ministry of Environment of Korea, and from the “Guideline on Precise Mapping for Spatial Environmental Information in Climate Field (Draft)” of research, Precise Mapping and Spatial Analysis of the Environmental Information (III)—focusing on climate change [NIER-2017-01-01-051].

Institutional Review Board Statement

This study did not involve any human subjects or animals.

Informed Consent Statement

This study did not involve any human subjects.

Data Availability Statement

The data that support the findings of this study are openly available.

Acknowledgments

The authors appreciate the Ministry of Environment and the Cheongju-si who allowed the use of maps in the Cheongju-si Environmental Conservation Plan, and Bae, Min-Ki in Chungbuk Research Institute, the researcher in charge of the plan, who encouraged our research. We also would like to thank the Editage (http://www.editage.co.kr, accessed on 22 July 2022) for English language editing.

Conflicts of Interest

The authors declare no conflict of interest.

References

  1. Gyeonggi Research Institute. Production of Climatic Atlas of Gyeonggi-do: Final Report; Gyeonggi Provincial Government: Suwon, Korea, 2010. (In Korean) [Google Scholar]
  2. Oh, D.; Yeo, W. Urban Climate Mapping for Urban Planning; Busan Development Institute: Busan, Korea, 2014. (In Korean) [Google Scholar]
  3. Seoul Institute. Final Report: Seoul Climate Environment Energy Mapping Research (4th Year); Seoul Metropolitan Government: Seoul, Korea, 2016. (In Korean) [Google Scholar]
  4. Ministry of Environment & Ministry of Land, Infrastructure and Transportation. Joint Ordinance for Integrated Management of Environmental Plans and Land Plans; Ministry of Environment & Ministry of Land, Infrastructure and Transportation: Sejong, Korea, 2018. (In Korean) [Google Scholar]
  5. Ministry of Environment. A Guideline for Environmental Planning for the Local Governments; Ministry of Environment: Sejong, Korea, 2021. (In Korean) [Google Scholar]
  6. Ren, C.; Ng, E.; Katzschner, L. Urban climatic map studies: A review. Int. J. Climatol. 2011, 31, 2213–2233. [Google Scholar] [CrossRef]
  7. Baumüller, J.; Reuter, U. Demands and Requirements on a Climate Atlas for Urban Planning and Design; Office of Environmental Protection: Stuttgart, Germany, 1999. [Google Scholar]
  8. Nachbarschaftsverband Stuttgart. Klimaastlas. Landeschauptstadt Stuttgart, Amt fur Umweltschutz; Abteilung Stadtklimatologie: Stuttgart, Germani, 1992. (In German) [Google Scholar]
  9. Baumüller, J. Implementation of climatic aspects in urban development: The example Stuttgart. In Urban Climate + Urban Greenery; PGBC: Hong Kong, China, 2006; pp. 42–52. [Google Scholar]
  10. Landshaftsplan. Available online: https://www.berline.de/sen/uvk/natur-und-gruen/landschaftsplanung/landschaftsplan/ (accessed on 20 July 2022). (In German).
  11. Environmental Atlas. Available online: https://www.berlin.de/umweltatlas/en/ (accessed on 20 July 2022).
  12. Environmental Atlas of Berlin in FIS-BROKER. Available online: https://fbinter.stadt-berlin.de/fb/index.jsp?Szenario=fb_en (accessed on 20 July 2022).
  13. Tokyo Metropolitan Government. The Thermal Environment Map and Areas Designated for the Implementation of Measures Against the Heat Island Phenomenon; Bureau of the Environment, Tokyo Metropolitan Government: Tokyo, Japan, 2005. [Google Scholar]
  14. Ng, E.; Katzschner, L.; Wang, U.; Ren, C.; Chen, L. Working Paper No. 1A: Draft urban climatic analysis map—Urban climatic map and standards for wind environment—Feasibility study. In Technical Report for Planning Department HKSAR; The Chinese University of Hong Kong: Hong Kong, China, 2008. [Google Scholar]
  15. Planning Department Hong Kong SAR. Urban Climatic Map and Standards for Wind Environment—Feasibility Study—Final Report; Department of Architecture, The Chinese University of Hong Kong: Hong Kong, China, 2009. [Google Scholar]
  16. Höppe, P.R. The physiological equivalent temperature—A universal index for the biometeorological assessment of the thermal environment. Int. J. Biometeorol. 1999, 43, 71–75. [Google Scholar] [CrossRef] [PubMed]
  17. Matzarakis, A.; Meyer, H.; Iziomon, M. Application of a universal thermal index: Physiological equivalent temperature. Int. J. Biometeorol. 1999, 43, 76–84. [Google Scholar] [CrossRef] [PubMed]
  18. Go, J.; Shin, Y.; Kil, J.; Hong, G.; Kim, J. Linkage Policy of Land Planning and Environment Planning in Germany; National Institute of Environmental Research: Incheon, Korea, 2015. (In Korean) [Google Scholar]
  19. Yi, C.; Eum, J.-H.; Choi, Y.-J.; Kim, K.R.; Scherer, D.; Fehrenbach, U.; Kim, G.-H. Development of Climate Analysis Seoul (CAS) maps based on land use and meteorological model. J. Korean Assoc. Geographic. Inf. Stud. 2011, 14, 12–25, (In Korean with English abstract). [Google Scholar] [CrossRef] [Green Version]
  20. Map service for Seoul Urban Planning Portal. Available online: http://urban.seoul.go.kr/view/map/main.html (accessed on 20 July 2022). (In Korean).
  21. Seoul Institute. Environmental Conservation Plan for City of Seoul (2016–2025); Seoul Metropolitan Government: Seoul, Korea, 2016. (In Korean) [Google Scholar]
  22. Seoul Metropolitan Government & Seoul Institute. 2030 Seoul Master Plan: 2030 Seoul Plan; Seoul Metropolitan Government: Seoul, Korea, 2014. (In Korean) [Google Scholar]
  23. Chungbuk Research Institute. Cheongju-si Environmental Conservation Plan (2016–2025); Ministry of Environment & Cheongju-si: Cheongju, Korea, 2016. (In Korean) [Google Scholar]
  24. Seoul Metropolitan Office of Meteorology. Near Surface Wind Information over the West Coast of Gyeonggi; Seoul Metropolitan Office of Meteorology: Suwon, Korea, 2017. (In Korean) [Google Scholar]
  25. Seoul Metropolitan Office of Meteorology. Research on the Technical Improvement of Detailed Meteorological Information Generation in the Seoul Metropolitan Region; Seoul Metropolitan Office of Meteorology: Suwon, Korea, 2019. (In Korean) [Google Scholar]
  26. Gwangju Office of Meteorology. Development of Techniques for Producing Climate Impact Information according to Urban Environment Change; Gwangju Office of Meteorology: Gwangju, Korea, 2020. (In Korean) [Google Scholar]
  27. Korea Meteorological Administration (KMA). Textbook for Training Weather Forecasters: Beginner Course; Korea Meteorological Administration: Seoul, Korea, 2012. (In Korean) [Google Scholar]
  28. Hong, S.; Kwon, Y.C.; Kim, T.; Kim, J.E.; Choi, S.; Kwon, I.; Kim, J.; Lee, E.; Park, R.; Kim, D. The Korean Integrated Model (KIM) system for global weather forecasting. Asia-Pac. J. Atmos. Sci. 2018, 54, 267–292. [Google Scholar] [CrossRef]
  29. Park, K. Korean’s Journey Toward Objective, Scientific Weather Forecasts. The Korea Herald, 24 August 2021, page 4. Available online: http://news.koreaherald.com/view.php?ud=20210823000326&md=20210826003320_BL (accessed on 20 July 2022).
  30. Brown, A.; Milton, S.; Cullen, M.; Golding, B.; Mitchell, J.; Shelly, A. Unified modeling and prediction of weather and climate: A 25-year journey. Bull. Am. Meteorol. Soc. 2012, 93, 1865–1877. [Google Scholar] [CrossRef]
  31. Open Portal for Weather Data by Korea Meteorological Administration (KMA). Available online: https://data.kma.go.kr (accessed on 20 July 2022). (In Korean).
  32. Environmental Geographic Information Service (EGIS) by Ministry of Environment. Available online: https://egis.me.go.kr (accessed on 20 July 2022). (In Korean).
  33. Kim, J.C. Evaluation and Prediction of High Resolution Climate Simulation by Land Surface Data Improve over Complex Terrain. Ph.D. Thesis, Kangwon National University, Chuncheon, Korea, 2010. (In Korean with English abstract). [Google Scholar]
  34. Jeon, K.; Kim, Y. Study on improvement to accuracy of CALMET using a surface roughness length of landuse. J. Korean Soc. Urban Environ. 2016, 16, 383–392, (In Korean with English abstract). [Google Scholar]
  35. National Institute of Environmental Research (NIER). Precise Mapping and Spatial Analysis of the Environmental Information (III)—Focusing on Climate Change; National Institute of Environmental Research: Incheon, Korea, 2017. (In Korean) [Google Scholar]
  36. National Land Information Platform by National Geographic Information Institute (NGII). Available online: http://map.ngii.go.kr (accessed on 20 July 2022). (In Korean).
  37. Skamarock, W.C.; Klemp, J.B.; Dudhia, J.; Gill, D.O.; Barker, D.M.; Duda, M.; Huang, X.-Y.; Wang, W.; Powers, J.G. A Description of the Advanced Research WRF Version 3; NCAR Technical Note TN-475+STR; NCAR: Boulder, CO, USA, 2008. [Google Scholar]
  38. Scire, J.S.; Robe, F.R.; Fernau, M.E.; Yamartino, R.J. A User’s Guide for the CALMET Meteorological Model (Version 5); Earth Tech Inc.: Concord, MA, USA, 2000. [Google Scholar]
  39. Perego, S. Metphomod—A numerical mesoscale model for simulation of regional photosmog in complex terrain: Model description and application during Pollumet 1993 (Switzerland). Meteorol. Atmos. Phys. 1999, 70, 43–69. [Google Scholar] [CrossRef]
  40. Kim, K.R.; Yi, C.; Lee, J.-S.; Meier, F.; Jänicke, B.; Fehrenbach, U.; Scherer, D. BioCAS: Biometeorological Climate impact Assessment System for building-scale impact assessment of heat-stress related mortality. J. Geograph. Soc. Berlin 2014, 145, 62–79. [Google Scholar]
  41. Yi, C.; Kim, K.R.; An, S.M.; Choi, Y.-J.; Holtmann, A.; Jänicke, B.; Fehrenbach, U.; Scherer, D. Estimating spatial patterns of air temperature at building-resolving spatial resolution in Seoul, Korea. Int. J. Climatol. 2016, 36, 533–549. [Google Scholar] [CrossRef]
  42. Scire, J.S.; Strimaitis, D.G.; Yamartino, R.J. A User’s Guide for the CALPUFF Dispersion Model (Version 5); Earth Tech Inc.: Concord, MA, USA, 2000. [Google Scholar]
  43. CALPUFF Modeling System Version 6 User Instruction (April 2011). Available online: https://www.src.com/calpuff/download/CALPUFF_Version6_Userinstructions.pdf (accessed on 22 October 2022).
  44. California Air Resources Board and South Coast Air Quality Management District (CARB & SCAQMD). Modeling Protocol for Ozone and Particulate Matter Modeling in Support of the South Coast Air Quality Management District 2007 Air Quality Management Plan Update; CARB & SCAQMD: Sacramento, CA, USA, 2006. [Google Scholar]
  45. Byon, J.-Y.; Choi, Y.-J.; Seo, B.-K. Characteristics of a wind map over the Korean Peninsula based on mesoscale model WRF. Atmosphere 2010, 20, 195–210, (In Korean with English abstract). [Google Scholar]
  46. Hernández, A.; Saavedra, S.; Rodríguez, A.; Souto, J.A.; Casares, J.J. Coupling WRF and CALMET Models: Validation During Primary Pollutants glc Episodes in an Atlantic Coastal Region. In Air Pollution Modeling ang Its Applications XXII. NATO Science for Peace and Security Series C: Environmental Security; Steyn, D., Builties, P., Timmermans, R., Eds.; Springer: Dordrecht, The Netherlands, 2014; pp. 681–684. [Google Scholar] [CrossRef]
  47. Kim, A.-L.; Koo, Y.-S. A study on the improvement of prediction performance of fine scale wind fields using WRF and CALMET models in the complex coastal area. J. Kor. Soc. Urban Environ. 2016, 16, 83–95. [Google Scholar]
  48. Lee, H.-W.; Kim, D.-H.; Kim, M.J.; Lee, S.H.; Park, S.Y.; Kim, H.G. Study of evaluation wind resource detailed area with complex terrain using combined MM5/CALMET system. Proceedings of Autumn Conference of The Korean Society of New Renewable Energy, Busan, Korea, 16 October 2008; Korean Soc. New Renew. Energy2008. pp. 274–277, (In Korean with English abstract). [Google Scholar]
  49. Robe, F.R.; Scire, J. Combining mesoscale prognostic and diagnostic wind models: A practical approach for air quality applications in complex terrain. In Proceedings of the 10th Conference on the Applications of Air Pollution Meteorology, Phoenix, AZ, USA, 11–16 January 1998. [Google Scholar]
  50. Sievers, U.; Kossmann, M. The cold air drainage model KLAM_21—Model formulation and comparison with observations. Weather. Clim. 2016, 36, 2–24. [Google Scholar] [CrossRef]
  51. Cold Air Drainage Model KLAM_21. Available online: https://www.dwd.de/EN/ourservices/klam_21/klam-21.html (accessed on 20 July 2022).
  52. Seo, B.; Jeong, E. Comparative analysis of wind flows in wind corridor based on spatial and geomorphological characteristics to improve urban thermal environments. J. Korean Assoc. Geogr. Inf. Stud. 2017, 20, 75–88, (In Korean with English abstract). [Google Scholar]
  53. Bruse, M. Development of a Microscale Model for the Calculation of Surface Temperatures in Structured Terrain. Master’s Thesis, Institute of Geography at the Ruhr-University Bochum, Bochum, Germany, 1998. [Google Scholar]
  54. ENVI-MET. Available online: https://www.envi-met.com (accessed on 20 July 2022).
Figure 1. Mapping process of wind field data using numerical weather predictions and diagnostic meteorological models: DEM, digital elevation model; UM, unified model; LDAPS, local data assimilation, and prediction system; ASOS, automated synoptic observation system; AWS, automatic weather station; WRF, weather research and forecasting model (one of the numerical weather prediction models employed); CALMET, California meteorological model (a type of diagnostic meteorological model.).
Atmosphere 13 01805 g001
Figure 2. Overview of the study area, Cheongju-si, Korea: (a) location, (b) elevation, (c) major air pollutant emission sources, (d) meteorological observation sites, and (Source of (c): [23], translated with the consent of publishers).
Atmosphere 13 01805 g002aAtmosphere 13 01805 g002b
Figure 3. Annual wind field map of Cheongju-Si, Korea, in 2016.
Atmosphere 13 01805 g003
Figure 4. Annual wind field map of Cheongju-si, Korea, in the daytime (a) and nighttime (b) in 2016.
Atmosphere 13 01805 g004
Figure 5. Wind field map of Cheongju-si, Korea by season: (a) spring, (b) summer, (c) autumn, (d) winter.
Atmosphere 13 01805 g005aAtmosphere 13 01805 g005b
Figure 6. Application cases of wind field maps to environmental plans in Cheongju-si, Korea: (a) Annual wind field map of Cheongju-si, Korea via the WRF-CALMET model, (b) predicted wind speed distribution at 19:00 in July, Cheongju-si, Korea via the CAS model with 30-year average meteorological values, (c) distribution of air pollutant emission sources (yellowish brown) and residential areas (green), (d) distribution of stagnant areas of wind circulation (green) and industrial areas (pink). (Source of (bd): [23], translated and added dashed lines for a stagnant area of wind circulation with consent of publishers).
Atmosphere 13 01805 g006aAtmosphere 13 01805 g006b
Figure 7. Wind field mapping process without numerical weather prediction modeling and with the application of a diagnostic meteorological model: DEM, digital elevation model; UM, unified model; LDAPS, local data assimilation and prediction system; ASOS, automated synoptic observation system; AWS, automatic weather station; WRF, weather research and forecasting model (one of the numerical weather prediction models employed); CALMET, California meteorological model (a type of diagnostic meteorological model).
Atmosphere 13 01805 g007
Table 1. Linkage systems between environmental and land planning. Drawn according to the Joint Ordinance for Integrated Management of Environmental Plans and Land Plans [4].
Planning UnitEnvironmental Planning System Land Planning System
NationwideNational Comprehensive Environmental PlanNational Comprehensive Territorial Plan
Metropolitan cities/provincesEP for provincesComprehensive Plan for Provinces
EP for Seoul and other metropolitan citiesUrban master and management plans for metropolitan cities
City/county
(si/gun)
Si/gun EPSi/gun master plan, Si/gun management plan
Table 2. Physical schemes for WRF modeling.
Physical SchemeWRF Option
MicrophysicsWRF Single-Moment (WSM) 6-class
Cumulus parameterizationKain–Fritsch
Longwave radiationRRTM
Shortwave radiationGoddard
Land surface model (LSM)Noah
Surface layerMM5 similarity
Planetary boundary layer (PBL)Yonsei University (YSU)
Table 3. Statistical metrics for WRF and CALMET modeling.
WRFCALMETBenchmark
Wind
Speed
Wind
Direction
Wind
Speed
Wind
Direction
Mean Bias−0.994-−0.008 ≤±0.5 m/s (1)
RMSE (Root Mean Square Error)1.730-0.153 ≤2 m/s (1)
R (correlation coefficient)0.364-0.987 -
IOA (Index of Agreement)0.326-0.993 ≥0.6 (1)
MAE (Mean Absolute Error)-67.759 12.671≤50° (2)
Data (h)8636
Missing data (h)148
(1) California Air Resources Board and South Coast Air Quality Management District (CARB and SCAQMD), 2006 [44]; (2) Byon et al., 2010 [45].
Publisher’s Note: MDPI stays neutral with regard to jurisdictional claims in published maps and institutional affiliations.

