Article

Mould Growth Risks for a Clay Masonry Veneer External Wall System in a Temperate Climate

1
School of Architecture and Design, College of Sciences and Engineering, University of Tasmania, Inveresk Campus, Launceston 7250, Australia
2
Fraunhofer Institute of Building Physics IBP, Fraunhoferstr. 10, 83626 Valley, Germany
3
Syndicate of Technology, Environments & Design, College of Sciences and Engineering, University of Tasmania, Sandy Bay Campus, Hobart 7005, Australia
*
Author to whom correspondence should be addressed.
Atmosphere 2022, 13(11), 1755; https://doi.org/10.3390/atmos13111755
Submission received: 22 September 2022 / Revised: 17 October 2022 / Accepted: 19 October 2022 / Published: 25 October 2022
(This article belongs to the Special Issue Building Energy Codes and Greenhouse Gas Mitigation)

Abstract

:
To reduce greenhouse gas emissions, nations have introduced energy efficiency regulations for new and existing buildings. This has been considered advantageous as more efficient building envelopes would reduce energy consumed to heat and cool home interiors to within accepted thermal comfort bandwidths. However, as these methods have been adopted, many nations have identified an unintended visible presence of surface and interstitial condensation and mould in new code-compliant buildings. In Australia, it has been estimated that up to 50% of Australian houses constructed in the last decade (2006–2016) have a presence of condensation and mould. Australia introduced its first condensation and mould-related building regulations for new homes in 2019. This paper reports on the hygrothermal and mould growth analysis of the most common low-rise residential external wall system, a timber-framed clay masonry veneer wall. A key component of this paper discusses the application of innovative methods in the Australian context. The external wall’s moisture accumulation and mould growth were simulated for a period of ten years using the transient hygrothermal simulation tool, WUFI® Pro, and the mould growth model, WUFI® VTT. This study identified significant risks for this typical external wall system when constructed in a temperate climate.

1. Introduction

The objective of this research was to ascertain the most appropriate method to complete hygrothermal and mould growth simulations of modern Australian low-rise residential external wall systems. To achieve this, a contemporary and code-complaint 7-star clay masonry veneer wall system (with an insulated timber frame) was used as the case study. Since the international recognition of anthropomorphic-induced climate change, nations around the world have introduced regulations to reduce the amount of fossil fuel-generated energy that is used to heat and cool buildings. In Australia, the national building regulations have included energy efficiency requirements for new Class 1 and Class 2 buildings (free-standing and multi-residential buildings) since 2002 [1]. The national building regulations were known as the Building Code of Australia (BCA) from 1988 to 2010, and since 2011, as the National Construction Code (NCC). The Nationwide House Energy Rating Scheme (NatHERS), which was established in 1993, was re-engineered to include a star scale system from zero to ten, where a house with a score of zero stars would use the highest amount of energy to heat and cool the home, whilst a house with a ten star rating would require no energy for heating or cooling purposes [2,3,4]. In 2003, new homes were required to achieve a 4-star rating; in 2006, a 5-star rating; in 2010, a 6-star rating; and in 2023, a 7-star rating. Before 2003, many existing homes had an average star rating of 1.7 [5]. To achieve these energy efficiency requirements, new houses have included increased minimum levels of insulation and airtightness in their building envelopes (i.e., walls, floors, and roofs) [6,7].

1.1. Condensation and Mould Problem in Homes

Due to much cooler winter conditions, other developed nations, including the United States, Canada, Japan, the United Kingdom, and Germany, have established a co-relationship between better envelope design and hygrothermal design since the 1990s, as these countries encountered condensation and mould problems in buildings at earlier times [8,9,10,11,12]. However, many countries in temperate and warmer climates have not needed to consider building envelope related condensation and mould matters until the last decade, when insulation and air-tightness measures have been introduced in response to energy efficiency regulations. Mould growth involves five of the following conditions: infestation, i.e., germination of mould spores; nutrients (mainly cellulose and starch, but also dirt and dust); temperature (in the range of 0–50 °C); moisture (surface relative humidity of above 65%); and oxygen [12,13,14,15,16,17,18]. Figure 1 shows the various conducive conditions for mould growth.
According to the Australian Occupational Health and Safety (OH&S) guidelines (July 2011), the recommended range of interior relative humidity is 30–60% [20]. This range of relative humidity was adopted from the Canadian CSA Standard CAN/CSA Z412-00 (R2005)—"Office Ergonomics” which refers to ASHRAE 55 (2010) [20]. Research conducted by Dewsbury at the University of Tasmania documented a considerable quantity of interior relative humidity values recorded above 95% in subfloor zones and 85% in living room zones, with regular instances of surface and interstitial condensation and mould in Tasmanian homes [21]. The CSIRO’s national Indoor Air Study, which collected data regarding the temperatures within code-compliant housing, also collected relative humidity data [22]. Figure 2 shows the measured indoor relative humidity data that has been collected by the CSIRO. The data shows the indoor relative humidity for one calendar year, from houses in Queensland, South Australia, and Victoria [23]. The data shows that houses from different Australian states, with distinctly different climate zones, in different seasons have recorded interior relative humidity values above 75%, which may be providing conducive environments for mould growth.
In Australia’s temperate and cool-temperate climates, the external air temperature is less than 20 °C for between 50 and 92% of the hours in a calendar year. The focus in southern Australia has been to make houses warmer in winter [24]. With these insulated and more airtight new homes, with warmer interior conditions, design and construction professionals, and inhabitants, are reporting increased incidents of condensation and mould during the cooler months (April–October) in all eight Australian legislative jurisdictions [12,25]. This is a significant issue, as moisture and/or mould in the built fabric lead to building degradation and substantive impacts on human health [21,26,27,28].
Whilst this is a present issue for Australia, countries like New Zealand, which is cooler than most of Australia, had their crisis two decades ago [29]. Meanwhile, other warmer and less developed countries will have their own building condensation and mould-related crises in the coming decades. Those cooler countries that have developed standards and guidelines have made changes to insulation and airtightness in their built fabric since the late 20th century for human health reasons and have retrospectively worked towards hygrothermal simulation to solve the problems of condensation and mould in building envelopes and building interiors. Due to Australia’s post-1998 focus on reducing greenhouse gas emissions, the first, and somewhat simplistic, energy-efficient building envelope regulations were not applied in Australia until 2003.
As these insulation requirements have increased, it is only in the last decade that concerns have been raised regarding condensation and mould in new housing. Sadly, many uninsulated older houses also have mould problems, but this is often accepted as ‘normal’. At the 2021 International Conference on Moisture in Buildings, Kuenzel and Dewsbury [30] identified the international need for complex transient hygrothermal simulations to inform building envelope design.

1.2. Impact of Condensation Problems and Mould Growth on Occupant Health

Several international studies have recognized links between condensation, mould, and human health. The most detailed study was done by the World Health Organisation—Europe, which established:
“Sufficient epidemiological evidence is available from studies conducted in different countries and under different climatic conditions to show that the occupants of damp or mouldy buildings, both houses, and public buildings, are at increased risk of respiratory symptoms, respiratory infections and exacerbation of asthma”
[31]
Architectural science research has identified that Australia has twice the asthma rate of other OECD countries [31,32,33,34]. Asthma is a prominent illness in children aged 0–14 years in Australia, accounting for 12.3% of the total asthma burden [35]. There is ample proof from the discipline of medical science that mould spores are associated with several immunology and allergy conditions that may cause lifelong illnesses [36,37,38,39]. Within this context, if the built fabric of new energy-efficient homes is a cause of moisture and mould in new homes, then the design and construction professions need adequate guidance regarding the make-up of envelope systems or methods by which to ascertain whether an envelope system is truly climatically appropriate.
It has been estimated that the proportion of buildings affected by mould is 45% in Europe, 40% in the USA, 30% in Canada, and up to 50% in Australia, emphasising the significance of this problem [40]. Forty percent of respondents to a 2016 Australian national design and construction industry survey identified condensation and mould issues within stand-alone housing and multi-residential buildings constructed between 2006 and 2016 [21]. Since 2016, there have been several reported cases of condensation and mould problems in contemporary homes in different legislative jurisdictions across Australia [21,41,42,43,44,45,46]. However, to date, there has been no comprehensive investigation regarding the results of the national survey or a deep economic analysis regarding the costs associated with building rectification or impacts on human health.
In Australia, while it is acknowledged that housing affects health [47], housing and health are challengingly governed in different portfolios of government. By comparison, the European Union, the United States of America, Canada, the United Kingdom, and New Zealand have accepted the necessity for interrelated regulatory development between public health regulations and inter-related occupant health requirements within their national building regulations. The first inclusion of clauses requiring the minimisation of condensation and mould within the Australian building regulations occurred in 2019, and this has placed “Australia behind the eight ball on healthy housing” [48]. The new regulations only apply to residential buildings. The newly published regulations for 2022, to be enacted in 2023, still only require action in new residential buildings. Whereas the 2019 regulations focused on condensation [1], the 2022 regulations, which were informed by this research, have included references to the Mould Index [13]. It is hoped that non-residential buildings will be included by 2025. Compounding this, many elderly people, people with health problems, and children spend up to 90% of their time indoors [49]. Furthermore, the COVID-19 pandemic, which caused people to spend more time indoors, has created an urgent situation in which housing and health must be considered together more intentionally [50,51].

1.3. Key Focus Study Area

The research discussed in this article forms part of broader research activities that are exploring the hygrothermal considerations that need to be considered for the pathway to net zero housing in Australia. This article discusses the hygrothermal and mould growth computer simulation methods that were developed and applied, which are innovative within the Australian context [52,53]. This study has a significant national impact, establishing and informing hygrothermal analysis methods for residential wall systems within warm temperate, temperate, and cool temperate climates in Australia.
From 2008 to 2016, the University of Tasmania architectural science researchers liaised with the Tasmanian State government, the Australian Commonwealth Scientific and Industrial Research Organisation (CSIRO), the Australian Building Codes Board (ABCB), and industry-based collaborators regarding the urgent need to develop hygrothermal (condensation and mould) related guidance and regulation for the design and construction professions. Since 2014, the non-transient calculation methods have been used in Australia and have identified significant knowledge, practice, and regulatory gaps [12,21,25,54]. Non-regulatory adoption of transient hygrothermal simulation software was introduced in 2017. Specifically, this article discusses the detailed hygrothermal and mould growth computer-based simulation to explore moisture accumulation and mould growth risks associated with a clay masonry veneer low-rise residential external wall system. The analysis of the wall system explores the implications of insulation and air-tightness requirements expected for a 7-star regulatory compliant wall system in 2022. This study required the assessment of hygrothermal calculation methods, their inputs and outputs, and how the method and simulation results could inform building regulatory development. Due to the correlation between mould and several human health impacts and the regulatory lever regarding healthy building interiors, this study included methods of mould growth simulation. The hygrothermal and mould growth simulation results of a typical clay masonry veneer wall system in a cool temperate climate have been published earlier [52,53]. This article focuses on the results from the timber-framed clay masonry veneer wall system, simulated within the Cfb Köppen-Geiger classified oceanic temperate climate of Melbourne, Australia. The timber-framed clay masonry veneer wall system represents approximately 50% of new stand-alone low-rise residential buildings in Australia. The results of the other residential wall systems in different selected Australian climates will be reported in future articles.

2. Background to Condensation Risk and Mould Growth Analysis Concepts

Surface and interstitial condensation risk can be analysed using both steady-state methods and dynamic state methods [55]. During the last six decades, hygrothermal calculation methods have evolved from rather simple steady-state models to more complex steady-state models and finally to transient or dynamic simulation tools [52,55]. Historically, condensation risk analysis was a static method to evaluate the possibility of condensation formation or moisture movement which may lead to moisture-related problems within the built structure [56]. More recently, and in response to many international experiences, hygrothermal building physics has studied heat and moisture movement within the built spaces and the diffusion of moisture through the built fabric. Heat and moisture are the two elements that are intrinsically coupled, affecting levels of moisture and the occurrence of condensation and mould, which significantly impacts the building’s performance [57].
Calculating moisture or condensation risk has relied on the use of the Glaser method. The “Glaser method”, as described in the International Standard ISO 13788, is a method for calculating the interstitial condensation risk taking place under specific environmental conditions [58]. Initially, the Glaser annual calculation method involved manual condensation risk calculations, which only included a sample for a single average climate-based temperature for a winter’s day [57]. This method presumed moisture movement was only influenced by diffusion, thermal conductivity, and vapour resistance of materials, which reflected the calculation methods of the 1960s. Due to several generalisations, the results of the Glaser annual calculation method may be confusing, particularly when short-term loads such as solar radiation or rainwater are included [59]. Moreover, under certain conditions, this method does not provide an exact estimate of moisture conditions within the building envelope [58], nor does it support the inclusion of mould growth risk analysis. This method does not take into consideration that:
  • Materials can be initially wet either due to accumulated moisture or rain;
  • Materials can be hygroscopic;
  • Water movement takes place due to the combination of both vapour and liquid flow;
  • Moisture content affects the material properties;
  • Solar radiation and longwave radiation affect the hygroscopic properties of the building material;
  • Two-dimensional (2D) and three-dimensional (3D) flows of heat, air, and moisture are of significance;
  • Mould growth risk is significantly underrated due to ignoring the diurnal variations of the external and internal environmental conditions;
  • Mould growth risk assessments cannot be performed.
The development of monthly non-transient heat and moisture calculation methods recognised the need to combine steady-state and moisture accumulation methods. This method included monthly moisture accumulation and moisture drying algorithms. The interpretations performed on a monthly basis can lead to numerous errors because they do not take into account the following [55,58]:
  • Redistribution of moisture takes place due to air movements within or through the built fabric by convection;
  • Considering constant material properties is a guesstimate (e.g., the thermal conductivity of a material is dependent on its moisture content;
  • Diurnal changes in the environmental conditions;
  • Solar radiation effects are not considered;
  • Interstitial condensation risk can be overestimated and must be dealt with caution if the built fabric encounters large diurnal fluctuations and is expected to accumulate substantial amounts of moisture;
  • Considerable air movement inside the building or through the building component will lead to inaccurate results and must be dealt with caution;
  • Mould growth risk is significantly underrated due to ignoring the diurnal variations of the external and internal environmental conditions
This was followed by the development of complex transient hygrothermal simulation tools, which calculate dynamic changes within the building envelope (walls, floors, and roofs or building elements) on an hourly basis for a calendar year. Later, as desktop computer capacity increased, simulation tools have been used to complete transient calculations for several consecutive years [55]. Commonly referred to as hygrothermal assessments, this method includes numerous aspects such as environmental and climatic loads, indoor moisture level, interior relative humidity, and temperature conditions, moisture accumulation of materials, and degradation processes [60,61]. Soon after, the need for a combined approach that included mould growth was identified. Various determinants which play a vital role in the occurrence of moisture and moisture accumulation are also key determinants for mould growth analysis [62,63].
From a design and construction professional’s perspective, amendments to the material arrangement and material choices can be done within transient simulation software during the building design stage, allowing adjustments of designs and design detailing to avoid or reduce risks of mould growth and moisture accumulation [64,65].

2.1. Hygrothermal Assessment Methods

A key component of this article discusses the different hygrothermal methods explored to select the best practice methods which should be used to inform energy-efficient building envelope design in Australia. There was no guidance or requirement for any form of condensation or mould risk assessment for Australian buildings until 2019. Within this context, this study initially used non-transient heat and moisture calculation methods, for the condensation risk analysis of the external wall systems, as described in ISO 13788 compliant. Due to international research relationships, the researchers used the BS EN 15026 compliant JPA Designer condensation risk analysis software [66]. As this study progressed, it was acknowledged that best contemporary practice required the use of transient, or dynamic, state hygrothermal simulation software [67]. However, it was noted that both these models have been developed based on European and North American conditions, which are somewhat different from Australia’s cool-temperate to hot-humid climates. As these tools have been developed outside Australia and Australia’s hygrothermal skills base is quite limited, aspects of user input error, construction material choices, and methods to analyse the results could all lead to errors in the calculation or assessment of results. To limit this risk, international collaboration with the software developers occurred throughout the study.

2.1.1. Non-Transient Heat and Moisture Calculation Method

Non-transient condensation risk analysis software has been used in Australia for several years [54,68]. The preliminary outcomes of this study determined substantial inadequacies in the data used to appraise the moisture accumulation, mould growth risk, effects from and on the interior environment within new homes, the climate data inputs, and the simplicity of the ISO-13788 method [14,52]. Additionally, the simulation results did not provide informed guidance about when and how condensation may form and dry (on a daily, seasonal, or annual basis) within each wall type and how this may or may not cause structural degradation or mould growth. The introduction to the BS EN 15026 suggests that, compared to non-transient assessments, “transient hygrothermal simulation provides more detailed and accurate information on the risk of moisture problems within building components and the design of remedial treatment” [69].
One of the simulation tools used in Australia that applied the monthly calculation or the non-transient heat and moisture calculation method was the JPA Designer software [70]. Condensation risk analysis using the JPA Designer simulation tool determines whether condensation is likely to happen at the interface between the individual layers of the building component [70]. The simulations performed on the external wall types help to analyse if condensation is likely to happen at the interface between the individual layers of the simulated wall. With the hygroscopic properties of the materials and the environmental conditions, JPA claims that this software considers individual interfaces or layers in the structure (walls, floors, or roofs) and calculates [66]:
  • The amount of condensed atmospheric moisture deposited or evaporated during each month of a year;
  • The maximum amount of moisture deposited;
  • The annual moisture accumulation.
This study guided the essential need and development of a correct approach to hygrothermal simulation in Australia, resulting in a shift from the current ISO 13788 hybrid steady-state Glaser calculation method to the transient method.

2.1.2. Transient Heat and Moisture Calculation Method

In 2017, the use of transient hygrothermal analysis of building envelopes was extremely rare in Australia. Even in 2022, the use of transient hygrothermal software is limited to a small group of academics and some early adopters within the building envelope certification professions. Until mid-2019, there was no regulatory requirement for any form of building envelope condensation or mould risk assessment [1].
Many hygrothermal models have been developed and empirically validated over the last fifteen to twenty years, for example, DELPHIN, HAM, MATCH, and WUFI® [71]. Due to the research liaison between the Fraunhofer IBP and the University of Tasmania, the transient/dynamic state, BS EN 15026 compliant, WUFI® Pro software was assessed for its suitability for adaption to the Australian context [53]. This transient state hygrothermal simulation software provided a more detailed hygrothermal analysis [69,72]. The transient hygrothermal calculations on building components also consider built-in moisture, driving rain, solar radiation, longwave radiation, capillary transport, and summer condensation [73]. This transient software can be used to simulate and assess the various dew-points that take place within a multi-component envelope system [74]. As hygrothermal analysis is new in Australia [39,75], a few factors, like the selection of climate types, interior environments, building material selection, and configuration, were established before performing simulations. Excessive moisture within the built fabric can lead to mould growth [53,76,77]. Hence, the hygrothermal model cannot individually assess the condensation and mould growth risk. Mould growth simulation tools are offered as post processors for transient hygrothermal simulations and present a better assessment of the real risk of mould growth [13,78]. The upcoming section discusses the role and features of the mould growth model.

2.2. Mould Growth Simulation

The physical state of inspected buildings indicated the need to further understand the mould growth performance of regulation-compliant Australian housing [79,80]. Within this context, this article reviews mould growth simulation methods and tools that could be used in conjunction with hygrothermal simulation software. A mould growth simulation software can be used to calculate the mould growth risk in the preliminary design stage, allowing evaluation of the building envelope before the commencement of the construction stage [81]. There are several mould growth models found in the literature (e.g., temperature ratio, isopleth systems, biohygrothermal model, ESP-r mould prediction model, and empirical VTT-model) [81]. The WUFI® Bio model and the VTT/Viitanen model are two internationally recognised mould growth simulation methods [13]. For WUFI® Pro, the biohygrothermal model (WUFI® Bio) and the updated VTT model (WUFI® VTT) are available as post-processors. A detailed comparative analysis of WUFI® Bio and WUFI® VTT is discussed in Table 1.
After evaluating various simulation and calculation approaches, the WUFI® VTT, Viitanen post processing software, developed by Hukka and Viitanen at the Technical Research Centre of Finland, was used. Established from empirical studies [13], this model uses a clear six-step assessment approach, commonly named the mould index (MI) [81]. This method categorises the intensity of mould growth on the surface as percentages [13]. The mould indexes (MI) are rated on a scale from 0 to 6, where [13]:
  • MI 0: demonstrates zero mould growth;
  • MI 1: demonstrates microscopic mould growth. This is the initial stage of mould growth;
  • MI 2: demonstrates a large amount of microscopic mould growth colonisation on the surface;
  • MI 3: demonstrates visible results of mould on the surface, <10% coverage, or <50% coverage of microbial mould;
  • MI 4: demonstrates visible results of mould on the surface, 10–50% coverage, or >50% coverage of microbial mould;
  • MI 5: demonstrates a considerable amount of mould growth on the surface, >50% coverage (visual);
  • MI 6: demonstrates excessive mould growth, coverage of about 100%.
When the VTT model is used as a mould growth post-processor to the WUFI® Pro simulation, the results are simplified in the form of a traffic light system [13]. The mould growth assessment can be performed at the interfaces of the individual layers on and within the wall system, i.e., either on the outermost, internal/interstitial, or innermost layer. Based on user-selected locations within the wall system, the simulated mould growth can be analysed. Table 2 shows the graphical traffic light output and the corresponding optical classification of mould growth. Green suggests minimal mould growth risk, yellow signifies a potential risk and requires a precise assessment, and red signifies an unacceptable mould growth risk [13]. Internationally, a mould index of three, indicating a visible presence of mould, has been identified as having a negative impact on human health. For this reason, the red-unsuitable property is conservatively assigned a mould index of 2.

3. Material and Methods

The hygrothermal and mould growth analyses of the commonly constructed timber-framed clay masonry veneer wall system were completed for three different Australian climate zones, namely a warm and humid climate, a temperate climate, and a cool-temperate climate. The hygrothermal and mould growth simulations were guided by international standards and best practice guidelines, including, BS 5250:2011, ISO 13788:2012, DIN 4108:2013/2018, and ASHRAE 160:2016 Since 2017, expert guidance has been provided by the Fraunhofer Institute of Building Physics, Germany, which included knowledge regarding the imminent release of the 2020 edition of DIN4108-4 [82]. To investigate, via simulation, whether the current regulatory approach in Australia is unintentionally promoting moisture accumulation and/or unsafe amounts of mould growth requires establishing hygrothermal input parameters and the mould growth simulation method.

3.1. Hygrothermal Model Input Parameters

The input parameters that were defined for hygrothermal simulation included the selection of suitable Australian exterior climate data, the definition of interior climate (temperature, relative humidity, and interior water vapour generation), the material profiles for the timber-framed clay masonry veneer external wall system, building material properties, and the calculation period for hygrothermal simulation.
Each of the above-stated input parameters is discussed in detail below.

3.1.1. Selection of Australian Exterior Climate Data

Hygrothermal simulation of the external envelope requires site climate data that includes air temperature, relative humidity, direct beam solar radiation, hourly rainfall, wind speed, and wind direction. In Australia, like most other nations, climate data sets have been established for building energy rating purposes. Figure 3 shows how Australia was divided in 2002, based on a heating or cooling degree hour perspective, for building envelope energy efficiency purposes. However, these climatic divisions have no climate data files for simulation purposes.
The Australian Nationwide House Energy Rating Scheme (NatHERS) further divided Australia into 69 climate types [82]. Each of these climate types had a full calendar year of Typical Meteorological Year (TMY) climate data. The mean data in these climate files was selected based on air temperature and solar radiation. In a similar pattern to other developed nations, these climate data files did not include hourly precipitation (rain) data. An EPW format of this climate data was also available from the US Government via the EnergyPlus website https://energyplus.net/weather (accessed on 20 September 2021). The data within these climate files was originally coordinated by the Australian Greenhouse Office and have been certified for use by the Australian Building Codes Board for demonstrating building energy efficiency compliance. The datasets are in the RMY and EPW format, were certified and published in 2006, and use climate data up to and including 2003.
The external climate data options within WUFI® Pro include the selection of a WUFI® climate file or the selection of an appropriately formatted climate file (like EPW). As hygrothermal simulation is in its infancy in Australia, and there has been no collaboration between the Australian government and Fraunhofer IBP, resulting in no development of an appropriate Australian developed climate data file for hygrothermal simulation. Following advice from US and EU research collaborators, the EPW building energy rating climate data files were used [53]. The EPW files were imported into the software. Recognising the many deficiencies in this climate data, one of the many outcomes of this detailed study was a new Research by Higher Degree project to explore what may be needed for hygrothermal climate datasets for Australia. Internationally, there is evolving research regarding Moisture Reference Year (MRY) climate datasets for hygrothermal simulation [82,85]. However, recent research has identified that a single year of climate data may be inappropriate for oceanic climates and Australian climates, and therefore should be exposed to multi-year oscillating climate trends [86]. This is an active area of research at the University of Tasmania.

3.1.2. Establishment of Australian Interior Climates

As background activities to inform this question, many NatHERS simulations were completed for a typical new house plan. This detailed study showed what the expected interior thermal conditions were for the regulation-compliant house [33]. Due to Australia’s more temperate climates, the NatHERS system has climate-based thermostat setpoints for the intermittent heating and cooling of homes [87]. This study documented the number of hours that the habitable rooms were either passively or actively conditioned to between 20 and 23 degrees Celsius in cool-temperate climates in Australia. However, due to a lack of hygrothermal regulation, there were no requirements regarding the control of interior relative humidity. Parallel research by UTAS and CSIRO identified interior relative humidity conditions within many new homes as between 60 and 95% [23,80].
Within the transient state hygrothermal software (WUFI® Pro), there were provisions to select an indoor climate based on the following international standards: EN-15026, DIN-4108, WTA6-2, ISO-13788, ASHRAE 160, or a user-defined simulated interior temperature and relative humidity data. ISO 13788 was considered antiquated when compared to DIN-4108 and ASHRAE 160. ISO-13788 shows the very flat nature of the steady-state climate data, which would not establish the significantly variable vapour pressure differences between the internal and external sides of the building envelope [52].
Furthermore, there were published empirical studies completed that allowed for an informed approach to select between EN-15026, DIN-4108 (2017), WTA6-2, and ASHRAE 160 (2016). Figure 4 shows the interior temperature and relative humidity conditions, thermostat setpoints for heating and cooling, and control setpoints for relative humidity for EN-15026, DIN-4108, and WTA6-2. EN-15026, which controls indoor air temperature between 20 and 25.5 °C, and the relative humidity between 35 and 70%. However, the modelling method for EN 15026 does not provide any guidance to deal with minor flaws in the building envelope [88].
Figure 5 shows the interior temperature and relative humidity conditions, thermostat setpoints for heating and cooling, and control setpoints for relative humidity for ASHRAE 160, which controls indoor air temperature between 21 and 25.5 °C and relative humidity between 35 and 70%. The hygrothermal modelling method for ASHRAE 160 does allow for the inclusion of moisture that results from minor flaws in the building envelope [88]. The ASHRAE standard 160 allowed for a much more informed interior environmental profile and provided options for a more comprehensive approach to the interior environment that could be further tailored to recognise conditions in Australian homes. The variability included the heating setpoint, cooling setpoint, type of conditioning (heating only or airconditioned), number of bedrooms (to inform interior vapour load), moisture generation rate (to inform vapour load), and air exchange rate (to inform vapour leakage through the built fabric). Many of these principles have been adopted in the new version of DIN-4108 (2020).
Since two of the climates selected were from temperate and cool-temperate climate zones, a heating-only method was used for these simulations [53]. The simulations for the warm-humid climate included interior heating and cooling.

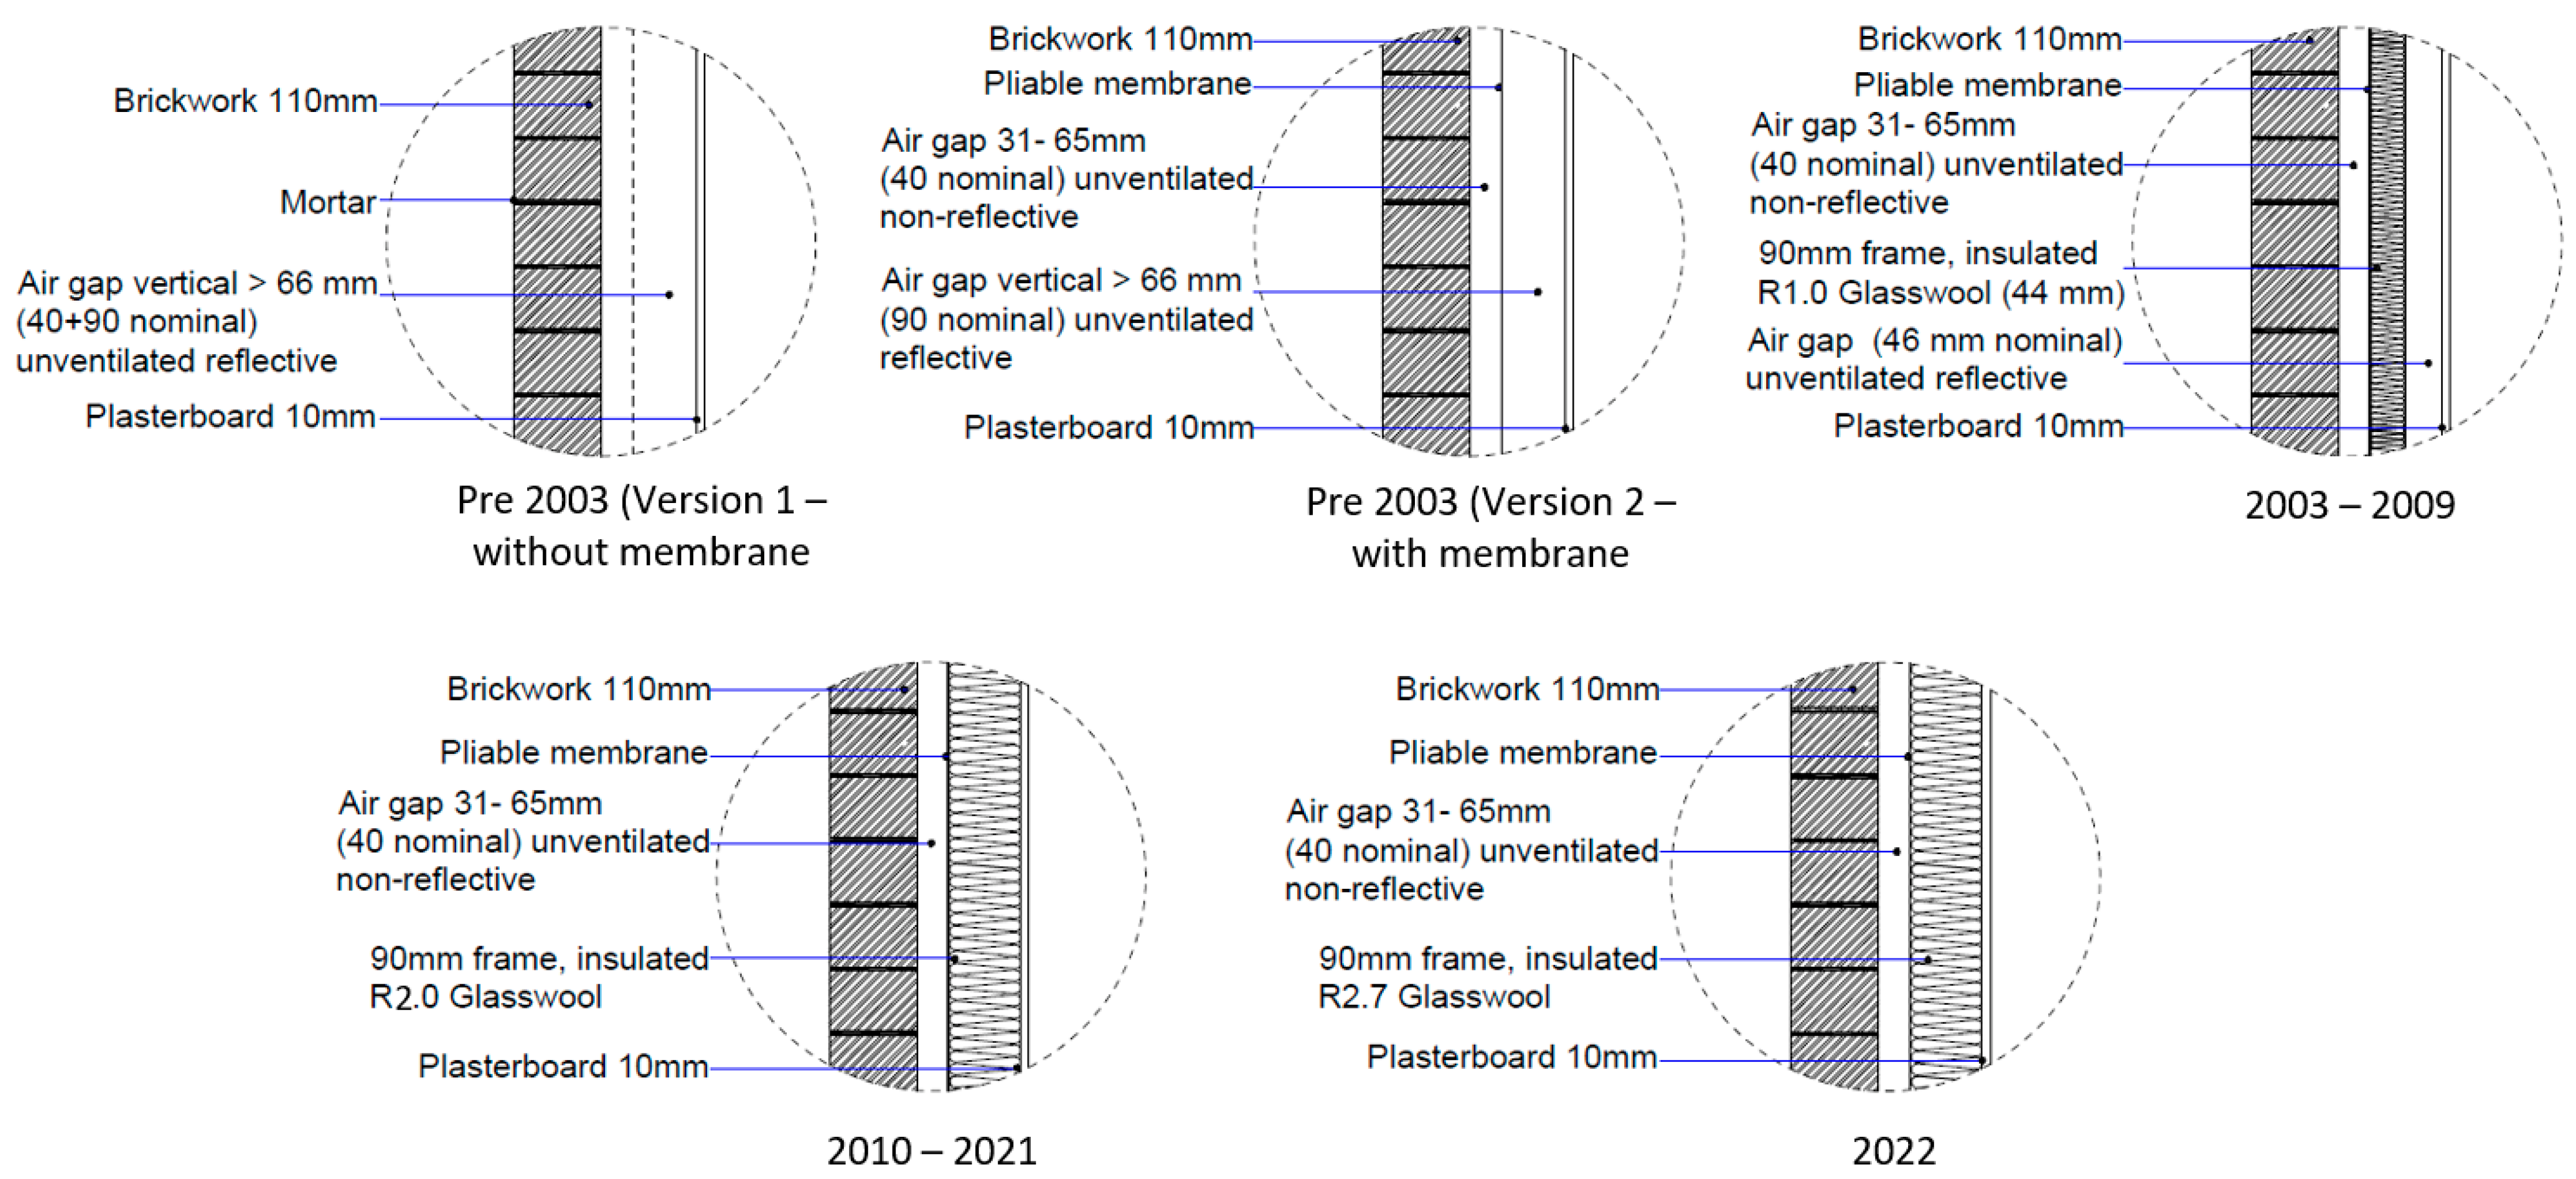
3.1.3. Timber-Framed Clay Masonry Veneer Australian Residential Wall System

The timber-framed clay masonry veneer external wall system in low-rise building regulation compliant housing in Australia consists of an interior lining, a 90 mm timber frame that often includes bulk insulation, a pliable external membrane, a 40 mm air cavity, and clay masonry cladding. This wall system was analysed to establish the different code-compliant configurations, recognising the regulatory wall insulation enhancements from 1996 to 2019 [1,89,90,91].
Figure 6 shows the code-compliant changes made in the construction of a clay masonry veneer wall since 2003. Before 2003, a brick veneer wall comprised of 110 mm of clay brick, 130 mm of air gap (90 mm structural frame and 40 mm cavity), 10 mm of paper faced-gypsum plasterboard, and the painted interior surface layer, respectively. Later, there was an addition of a 1 mm pliable membrane to the external wall system [91]. As per AS/NZ 4200, a pliable membrane could be installed to act as a sarking membrane, vapour barrier, thermal insulation, or even as a combination of all three [92,93]. A pliable membrane can be a vapour impermeable membrane (vapour barrier) or a vapour permeable membrane (breathable). Up until 2003, the most pliable membranes available in Australia were vapour impermeable [91]. According to subsequent NCC improvements (2003–2019), a brick veneer wall comprises of 110 mm of clay brick, 40 mm of air cavity, 1 mm pliable membrane, 90 mm insulated timber frame, 10 mm paper faced gypsum plasterboard, and the painted interior surface layer, respectively [1]. An extensive study was conducted to understand the impact of vapour permeable and vapour impermeable membranes in Australian residential wall systems [53].
The changes in the insulation requirements, denoted as R values, of the timber-framed clay masonry veneer wall type are shown in Table 3. These insulation requirements were used for the building material selection and arrangement and for hygrothermal modelling.
Until 2019, there was no regulation regarding the choice of pliable building membranes. Apart from concerned design and construction professionals and guidance from the Tasmania State Government, most pliable membranes installed were reflective or non-reflective and vapour impermeable. Based on this premise, the wall systems were modelled with:
  • Differing added bulk insulation (as per Table 3);
  • Vapour permeable and vapour impermeable membranes;
  • With a vented vapour cavity between the clay masonry veneer and the pliable membrane.

3.1.4. Building Material Database

Due to Australia’s slow adoption of hygrothermal design principles, there has been no requirement for Australian, or international, manufacturers to provide comprehensive water vapour diffusion resistivity or other physical property data for their construction materials. As such, the transient state hygrothermal simulation software used did not include an Australian building material database. This led to challenges associated with selecting building materials for the hygrothermal simulation of the timber-framed clay masonry veneer wall systems. The database within the transient state hygrothermal software includes material physical properties for conductivity, density, moisture absorptivity, and water vapour diffusion resistivity properties. Choosing the most similar materials required the use of NatHERS generic material properties (conductivity and density), the Australian Institute of Refrigeration, Air-conditioning and Heating [96] technical handbook, and manufacturers’ limited data and then finding similar products within the hygrothermal software database. This is a matter of concern, as early adopters of hygrothermal simulation in Australia may choose inappropriate materials, which may provide incorrect simulation results.
Table 4 shows the building materials collated from different sources to assist in the appropriate material selection for hygrothermal modelling of external walls. Additionally, for most Australian construction materials, the properties of moisture absorptivity and water vapour diffusion resistance were either not published or were unknown.
As mentioned above, due to a lack of regulation, the water vapour diffusion resistivity data of most Australian building materials were unavailable [97]. Nevertheless, there were some limited data on the vapour permeability requirements and classifications for pliable building membranes, as these must comply with the Australian Standard for pliable building membranes, AS-4200, as shown in Table 5 [93]. This allowed for a comparison between some Class 4 (non-reflective) and Class 1 (reflective) products that are commonly used in Australian residential construction.
The different versions of the wall systems as discussed above were simulated using a permeable or impermeable membrane, individually. Additionally, when the bulk insulation within the timber frame was less than 90 mm, additional air space was added between the paper-faced plasterboard lining and the bulk insulation. This reflects Australian practice where the insulation is installed from the inside and pushed outward until the pliable membrane provides a barrier (or refusal) [6].

3.1.5. Building Orientation

To understand the role of different orientations, it was considered necessary to complete simulations for all four orientations—north, south, east, and west, respectively. This was in response to the observed wall failures in previous research [54]. The different orientations, also allowed for a method to consider any effect from façade shading. The specific version of WUFI® Pro 6 used presumes the wall façade is exposed to the sun. In Australia, in many situations, the wall façade may be intentionally or unintentionally shaded. As there is no regulatory delineation for wall construction methods based on orientation, it is important to understand how shading influences the hygrothermal and mould growth analysis. Since it was noted that WUFI® Pro (2018–19) did not have the option to select façade shading, whereas other versions of WUFI®, such as WUFI® Passive and WUFI® Plus, consider façade shading. Due to this limitation, the implication of shading could not be fully established. Moreover, sensitivity analyses using orientation as a shading medium were performed to examine the implications of shading design in hygrothermal analysis.

3.1.6. Calculation Period for Hygrothermal Modelling

Initially, and applying the principles of ISO13788 [82], the simulations were completed for 2 years. According to the ASHRAE [98] standard, assessment periods longer than 3 years are suggested for modelling. Other research suggests the selection of a longer duration, that is, 10–15 years, to provide a more appropriate long-term assessment of moisture accumulation within the built fabric [99,100]. Research within the US, UK, and Europe indicated that both regulatory development and research were quickly moving toward the adoption of a minimum 10-year simulation period. Hence, appreciating leading international research, each simulation was completed for a period of 2, 5, and 10 years. This was to identify differences that may occur in the simulation results and to inform the minimum regulatory requirements in Australia.

3.2. Hygrothermal and Mould Growth Assessment Method

Historically, the presence of condensate and its cause of mould growth was the principal focus of hygrothermal simulation [17]. However, extensive research has found that mould will grow when the relative humidity is 65% in areas of low ventilation and above 75% in areas of high ventilation, well before the visible presence of moisture [13,101]. Even though recent research has provided more guidance about observed interstitial and surface mould growth within the commonly constructed Australian wall systems. The simulations completed used the mould growth calculation methods developed and applied to the WUFI VTT model [13]. If mould growth can occur within wall systems under lower relative humidity conditions, the results from this analysis could be referred to as conservative. Additionally, condensation and subsequent mould growth often occur where materials meet, which indicates a correlation between thermal bridging, conductivity, vapour resistance, and hygrothermal properties [17,54].

3.2.1. Base Model

This is the first level of assessment performed for the selected residential wall systems in three different climate zones in four different orientations (N, S, E, and W). This level of analysis determined the framework for further hygrothermal simulations and shows the moisture accumulation within the wall system. The base model assumes a perfect construction, but in reality, there is no perfect construction [82]. Perfect construction provides no allowances for air or moisture infiltration or exfiltration between the inner and outer layers of the wall system, which is not a realistic situation. Figure 7 shows an example of the base model clay masonry veneer wall as depicted in the transient state hygrothermal software. The figure shows the wall in a graphical section form. Each wall element is shown in a different colour. The layer in red denotes the clay masonry layer, light blue denotes the vented cavity layer, dark blue denotes the impermeable membrane, yellow denotes the insulation layer, and white denotes the plasterboard layer. There are various ‘cameras’ positioned at the interfaces of each material layer to assess moisture and mould growth. The assigned camera at the interface of the individual layers of the wall system monitors the wetting and drying patterns of the wall system.
Table 6 shows the wall data entry, which includes the moisture content within each element before the simulation was performed. The values adopted at this stage were the default values. Further research needs to occur to establish if the default values for moisture content are correct for Australian construction materials. In all cases, the initial moisture content and temperature were constant throughout each material. The initial relative humidity was set at 80%, reflecting the measured values within Australian homes and recommendations within ASHRAE 160 and advice from researchers at Fraunhofer IBP, who were informed about the likely changes to DIN4108-4. The initial temperature of 20 degrees Celsius was selected based on the NATHERS thermostat setting for living spaces, which is less than the 21 degrees Celsius recommended in ASHRAE 160. Table 7 and Table 8 show the user-defined settings for the exterior and interior surfaces of the timber-framed clay masonry veneer wall system. The hygrothermal simulation calculates the saturation pressures over a cross-section of the construction where the individual layers are represented with thicknesses linked to their water vapour diffusion resistance, using Sd-values or water vapour diffusion equal to the air layer thicknesses. The Sd-value describes the capacity of a material to withstand water vapour diffusion, depending on its thickness. The Sd-value is expressed in metres.

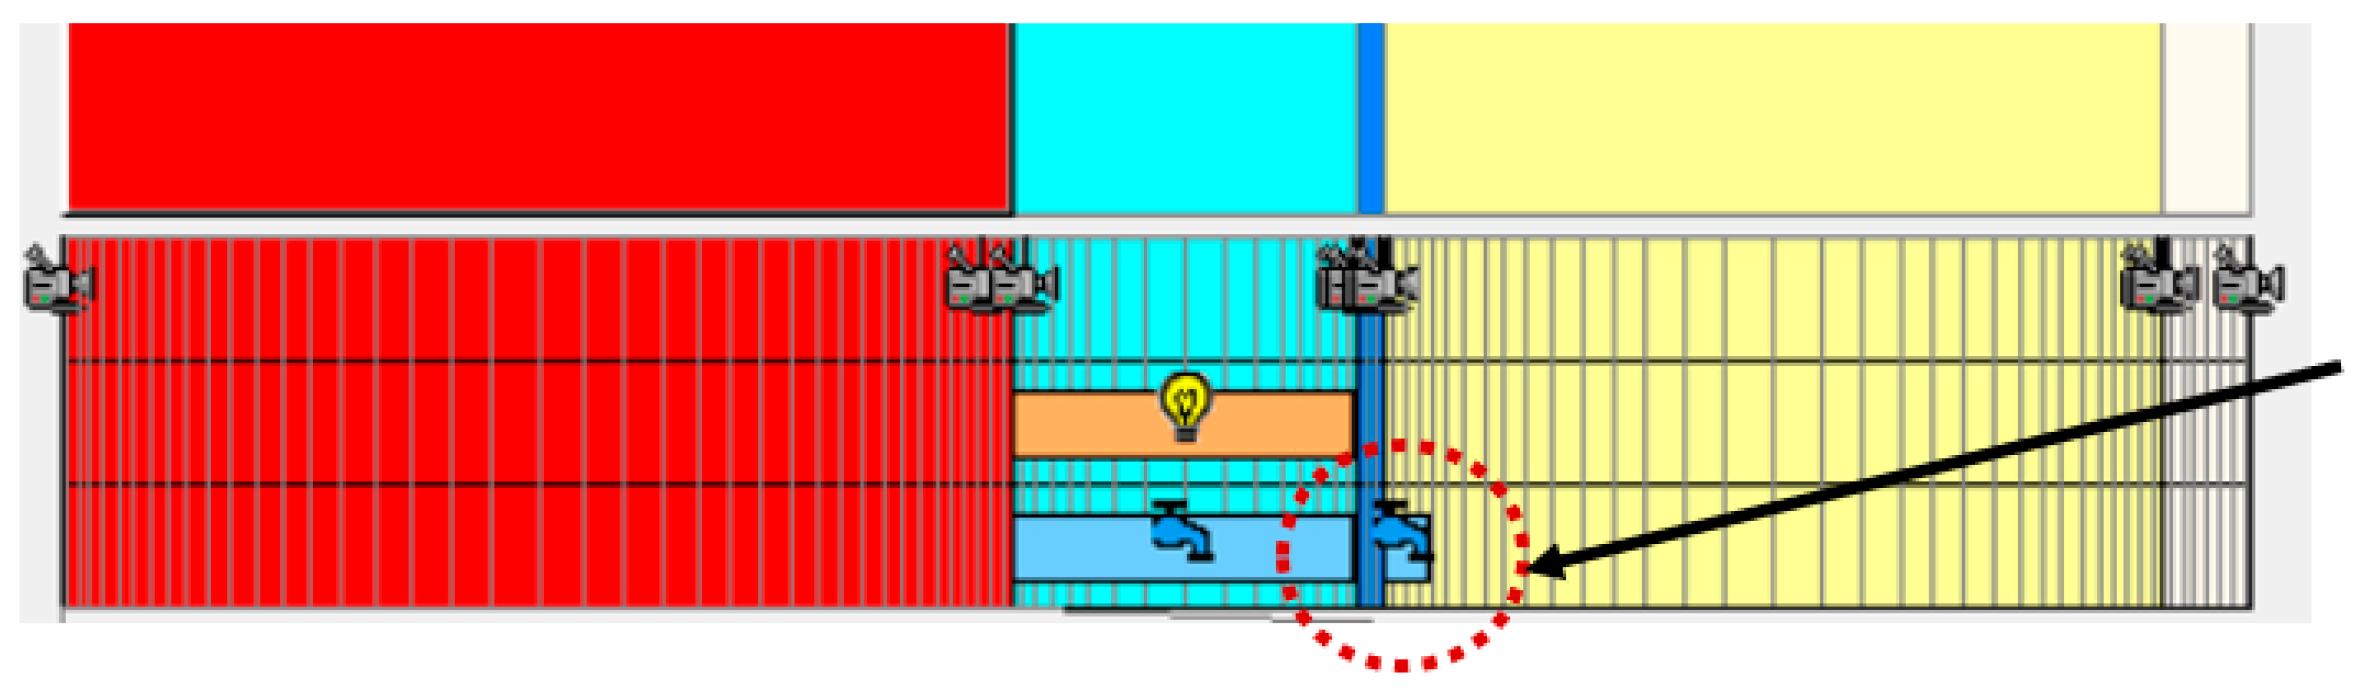
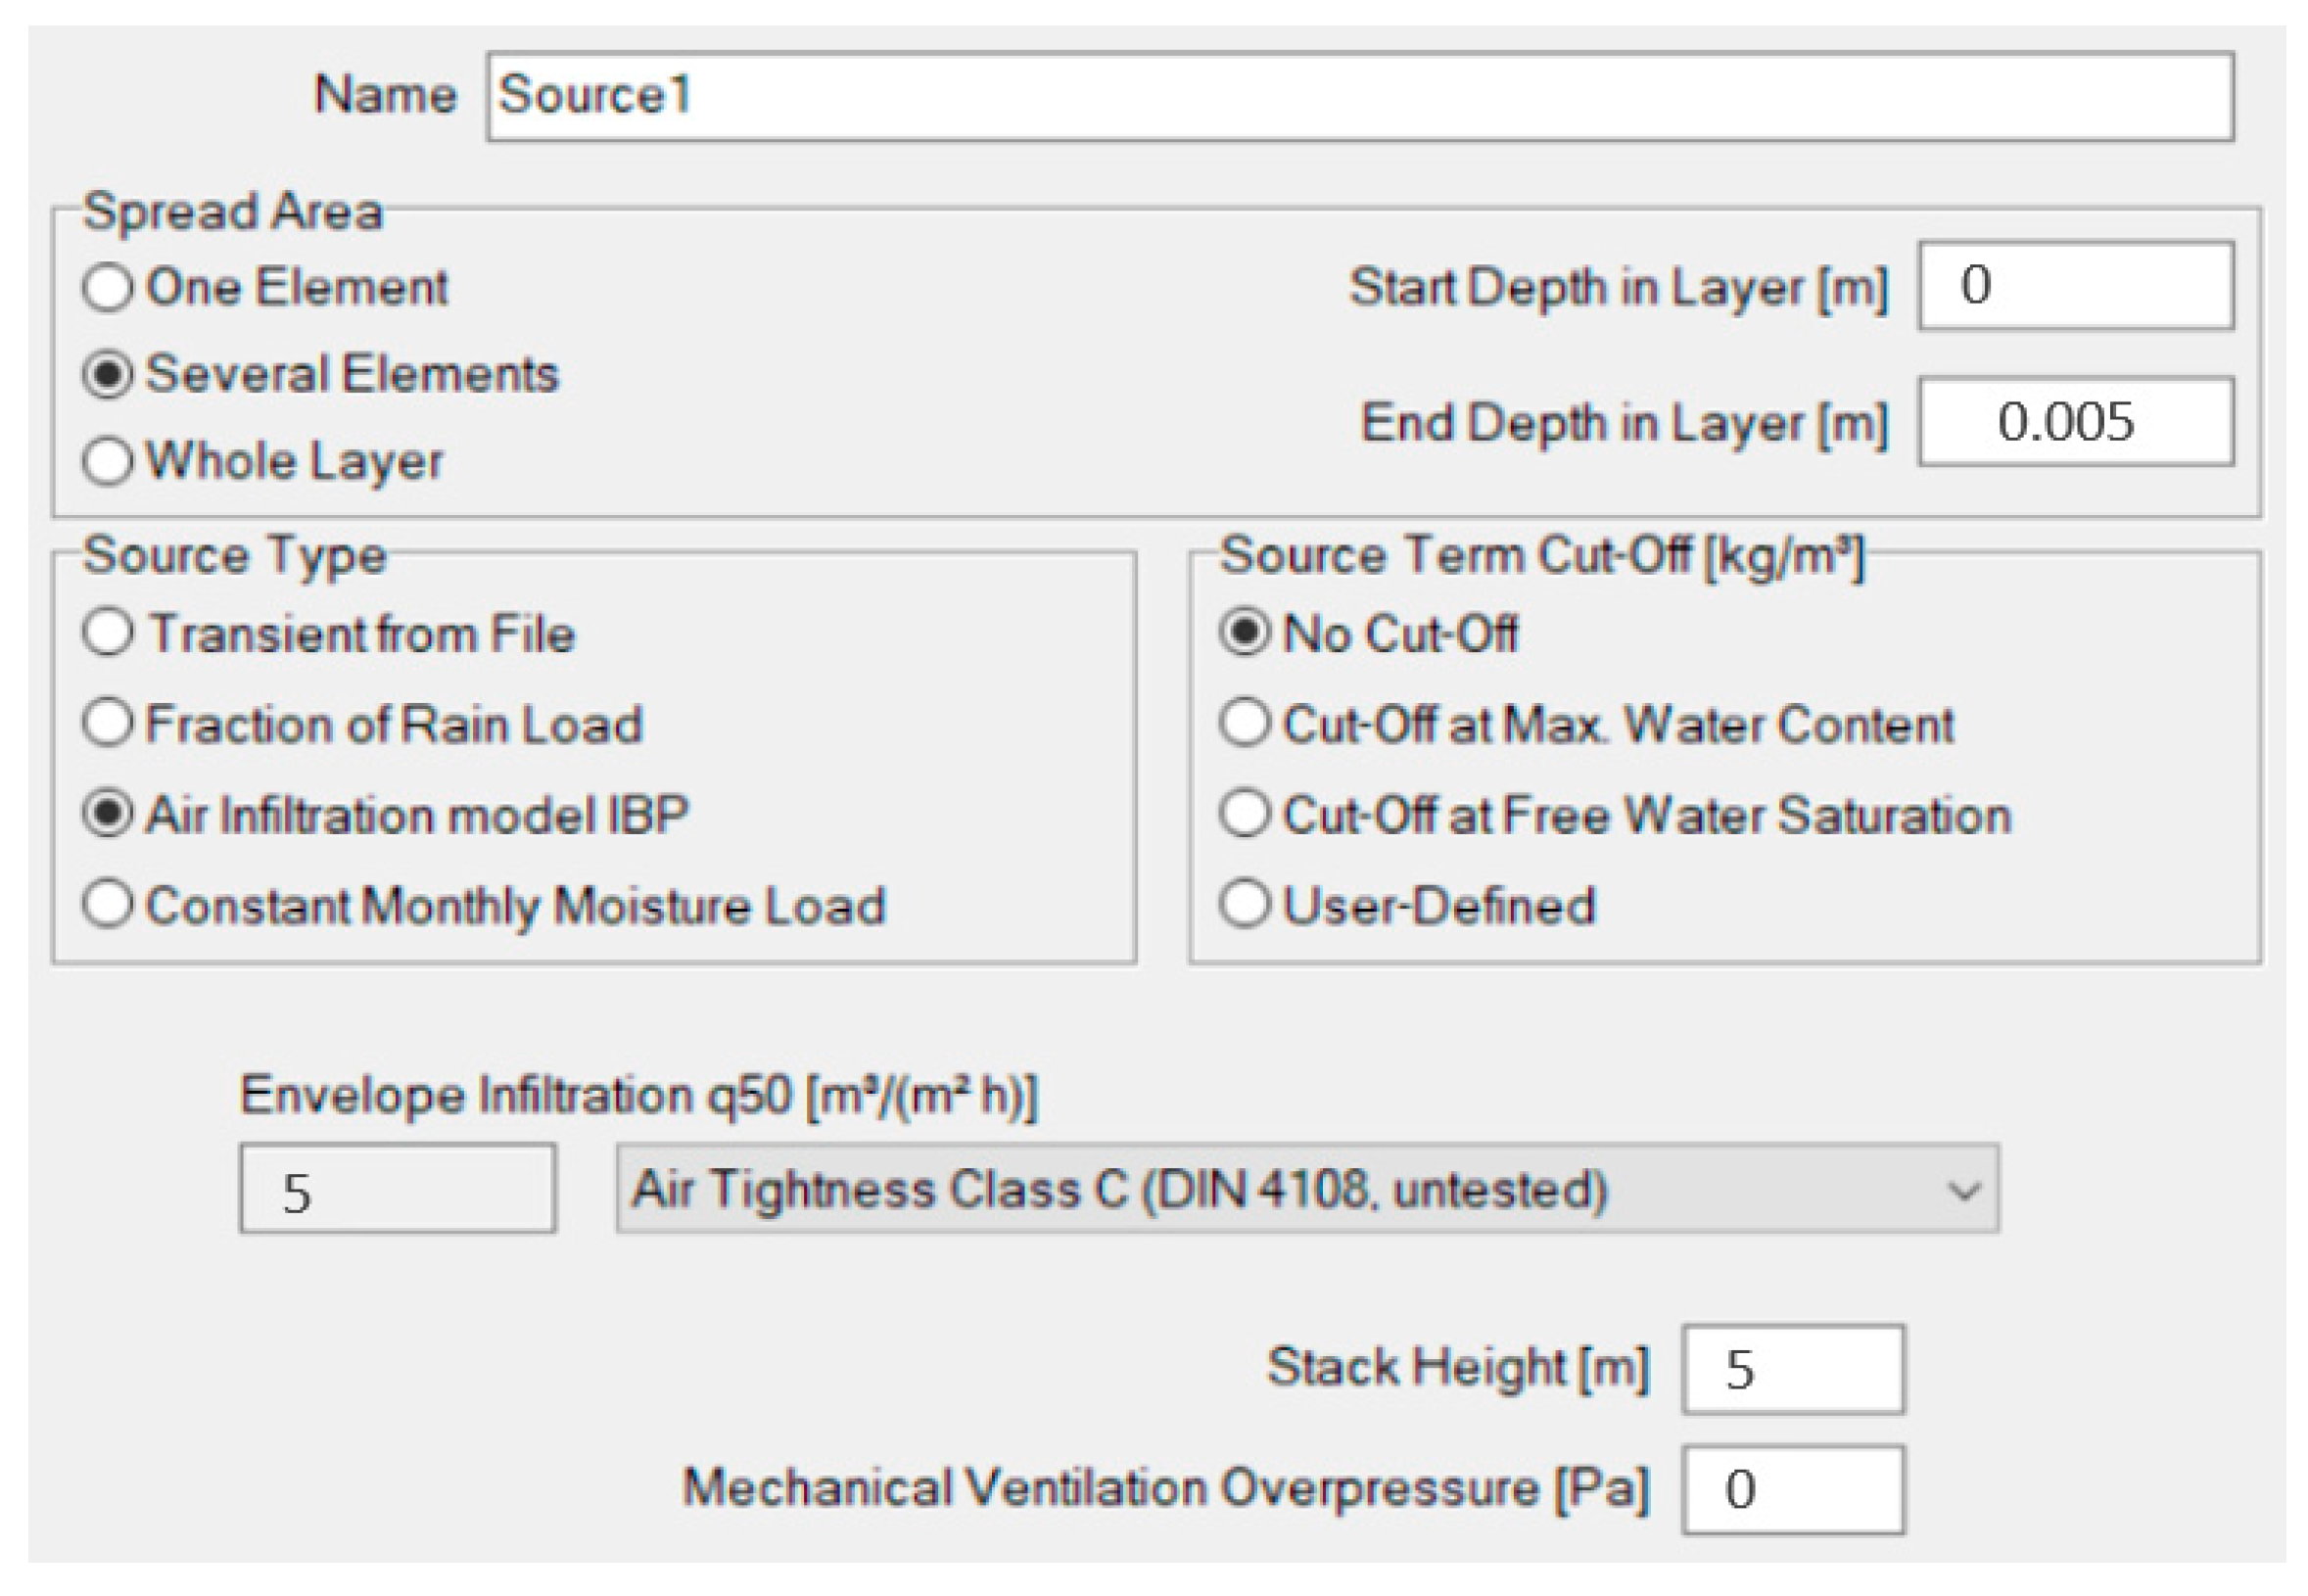
3.2.2. Moisture Source Model

Exploration has shown that moisture still penetrates within the built fabric, even in a wall system constructed in a research laboratory [75]. Even in a flawlessly built wall system, it has been frequently recorded that moisture has infiltrated through the wall. Hence, the ASHRAE 160 standard and researchers worldwide recommend adding a moisture source within the built fabric. This level of analysis adds a moisture source to the base model so that the simulations consider the impact of small amounts of moisture penetrating through the pliable membrane. As per ASHRAE 160 and DIN 4108, 1% of rain is applied to the moisture source model. This value has been verified by research in Europe and America [30,102]. It is well known that moisture moves through a clay masonry wall and into the vented vapour cavity. It is also becoming increasingly documented that moisture ingress occurs through typically installed pliable membrane systems in Australia [32].
Figure 8 shows an example of the moisture source model as applied to the clay masonry veneer wall as depicted in the transient state hygrothermal software. A moisture source is added to the insulation layer for the hygrothermal and mould growth analysis of this version of the wall system. The wall system needs to be hygrothermally simulated with this in mind to promote the walls’ ability to get wet and dry. Due to the capillary action, limited moisture enters through the wall assemblies in the default (base model) transient hygrothermal simulations. Hence, a moisture source was added to perform this level of analysis. In this timber-framed clay masonry veneer wall system, two moisture sources were added, namely:
  • Within the air cavity between the clay masonry and the pliable membrane wall;
  • Five mm from the outer edge of the bulk insulation layer.
Figure 9 shows a snapshot of the selections made in this model as advised in the Australian context for the moisture ingress through the pliable membrane layer and into the bulk insulation layer, source type, source term cut off, and envelope infiltration [103].

3.2.3. Latex Paint Model

To ascertain whether the typical acrylic interior paint may affect moisture and mould within the wall system, the last level of analysis added latex paint to the interior surface of the paper-faced plasterboard material layer. Latex paint is a vapour control layer and has lower vapour permeability than paper-faced plasterboard. The application of latex paint decreases the amount of water vapour moving outward from the conditioned room into the insulation layer of the wall system. Therefore, latex paint with an Sd-value of 0.7 was applied as a vapour control layer in this last level of analysis [104].

4. Results and Discussion (2 Years, 5 Years, and 10 Years)

The results of the hygrothermal and mould growth simulation method analyse the results from a 7-star NatHERS timber-framed clay masonry veneer wall system with a permeable membrane for 10 years in the temperate climate of Melbourne, Australia. To perform transient state hygrothermal simulations using WUFI® Pro and mould growth simulations using the mould growth model, WUFI® VTT, interior and exterior climates, and material physical properties require attributing as discussed in the methodology section above. This section compares the outcomes from the west, north, south, and east orientations, respectively. The west-facing clay masonry veneer wall in the Melbourne cool-temperate climate has shown significant amounts of moisture accumulation compared to other orientations [52].

4.1. Hygrothermal Assessment

Figure 10 shows the graphical representation of the hygrothermal simulation result of the timber-framed clay masonry veneer wall system with a vapour-permeable membrane in the west orientation for 10 years. The figure shows the temperature and relative humidity fluctuations through the different layers of the 7-star clay masonry veneer wall system. The top section shows the final temperature and vapour pressure values between the interior and exterior of the wall. The green line and the green fill show the fluctuations in relative humidity between 10 and 100% across the different parts of the wall. The blue line and blue fill show the moisture accumulation within the different layers of the wall system. This graphical data about the relative humidity condition is significant. It would be expected that a wall system would have occasional times when the relative humidity is above 65%. Nevertheless, this type of relative humidity condition could support mould growth. This indicates that the results of the hygrothermal simulation require further analysis.
As an example of the hygrothermal simulation results, Table 9 shows the moisture content within each element of the 7-star timber-framed clay masonry veneer wall with a vapour-permeable membrane in the temperate climate of Melbourne, Australia, with a northern, southern, and eastern (equatorial) orientation. This table shows the moisture accumulation results from the 2-, 5-, and 10-years hygrothermal simulations. This table shows the initial, final, minimum, and maximum moisture content within each wall component. The table shows that the final moisture content for each material is identical for the 2, 5 and 10 years of simulation. This indicates an annual cycle of wetting and drying with nil long-term moisture accumulation.
Table 10 shows the moisture content within each element of the 7-star timber-framed clay masonry veneer wall with a vapour-permeable membrane in the temperate climate of Melbourne, Australia, with a western (equatorial) orientation. This table shows the results from the 2-, 5-, and 10-years hygrothermal simulations for the timber-framed clay masonry veneer wall with western orientation. The data shows that there is no difference in the moisture accumulation results between the 2 years, 5 years, and 10 years of hygrothermal simulation.
Table 9 and Table 10 show that stability in moisture accumulation within the individual layers of the clay masonry veneer wall system in the temperate climate zone is reached after 5 years. However, different wall systems respond to moisture and mould growth risks differently, and as this research was exploring the best method for all wall systems, the 10-year method is recommended.
However, the moisture accumulation within some of the individual layers, i.e., the brick layer and 40 mm air cavity layer, in the western orientation is more compared to other orientations. Additionally, as per the simulation graphical results, the relative humidity within components of the wall system is often greater than 65%, which is a realistic scenario, as shown in Figure 2, indicating that even though there is no moisture accumulation, mould growth may be occurring.

4.2. Mould Growth Assessment

This section discusses the mould growth results of the 7-star timber-framed clay masonry veneer wall system with a vapour-permeable membrane in the temperate climate of Melbourne, Australia. In the timber-framed clay masonry veneer wall, the different layers of the wall system are analysed for hygrothermal and mould growth assessment.
Figure 11 shows an example of the mould growth result of the first layer analysed in the north-orientated 7-star timber-framed clay masonry veneer wall, with a vapour-permeable pliable membrane. The first layer analysed is the clay masonry layer. This graph shows the seasonal patterns of mould growth between 0.0000 and 0.0055 during the ten years of mould growth simulation. These values of mould growth are well below the mould index of 3, indicating a wall with a safe amount of mould growth.
By comparison, Figure 12 shows the mould growth simulation for the outside surface of the pliable membrane within the air cavity layer of the timber-framed clay masonry veneer wall for the ten years of mould growth simulation. At this location, in this orientation, it is evident that for the 10 years of simulation, the mould index exceeds 2.0. The rate of mould growth continues to increase for each of the 10 years of simulation. A mould index greater than 2 indicates that this wall may be climatically inappropriate and support an unsuitable amount of mould growth.
Figure 13 shows the mould growth simulation for the outer layer of the wall batt insulation within the timber-framed clay masonry veneer wall for the ten years of mould growth simulation. At this location within the wall, in this orientation, it is evident that the mould index exceeds 2.5 during the 10 years of simulation. The rate of mould growth continues to increase for each of the 10 years of simulation. A mould index greater than 2.5 indicates that this wall may be climatically inappropriate and support an unsuitable amount of mould growth.
Noting these differences, Table 11, Table 12, Table 13 and Table 14 show in greater detail the mould index simulation results for location within the timber-framed clay masonry veneer wall, for each of the cardinal orientations (north, south, east, and west).
Table 11 shows the mould index from different locations within the northern orientation of this external wall system from the 2-, 5-, and 10-years of mould growth simulation. The data shows that the outer locations, namely the interior surface of the clay masonry, the exterior surface of the pliable membrane, and the exterior surface of the wall batt insulation, have a different rate of simulated mould growth between the 5 years and 10 years mould growth simulations. The two inner locations have the same mould index for the 2, 5, and 10-year simulations.
Table 12 shows the mould index from different locations within the 7-star clay masonry wall in the southern orientation when the external wall system is simulated for the durations of 2 years, 5 years, and 10 years. In this orientation, the interior surface of the clay masonry and the exterior and interior surfaces of the plasterboard have the same mould index for all three types (2 years, 5 years, and 10 years) of mould growth simulation. However, the mould index is of increasing value for the interior surface of the clay masonry, the exterior surface of the pliable membrane, and the exterior surface of the wall batt insulation locations for the 2-, 5-, and 10-year simulations, respectively. For this orientation, each simulation type provides a very different mould growth result, namely:
  • The 2-years simulation calculates a maximum mould index from 0.000 to 1.500, indicating this wall system is fine;
  • The 5-years simulation calculates a maximum mould index from 0.000 to 2.500, indicating this wall would have a significant mould growth risk;
  • The 10-years simulation calculates a maximum mould index from 0.000 to 3.500, indicating this wall would have a significant mould growth risk.
Table 13 shows the mould index from different locations within the eastern orientation when this external wall system is simulated for the duration of 2 years, 5 years, and 10 years. In this orientation, the exterior and interior surfaces of the clay masonry and plasterboard locations have the same mould index for all three types of mould growth simulation. However, the mould index is of increasing value for the exterior surface of the pliable membrane and wall batt insulation locations for the 2-, 5-, and 10-year simulations respectively. For this orientation, none of the mould index values is greater than 2.
Table 14 shows the mould index from different locations within the western orientation when this external wall system is simulated for the duration of 2 years, 5 years, and 10 years. In this orientation, the exterior surface of the pliable membrane and the interior and exterior surfaces of the plasterboard lining have the same mould index for all three types of mould growth simulation. However, the mould index varies for the interior surface of the clay masonry and the exterior surface of the wall batt insulation locations for the 2-, 5-, and 10-year simulations. For this orientation, the 2- and 5-year simulations have a mould index of less than 2, whilst the 10-year simulation has a mould index of 2 for the insulation layer.
Table 15 shows a summary of the mould growth simulation results for this wall system for the 2 years, 5 years, and 10 years of mould growth simulations. The mould growth results are simplified into the traffic light system, where:
  • Red indicates that the mould growth rate is at an unacceptable level of 2 or greater;
  • Yellow indicates that the mould growth rate is a risk, and the wall system requires a more detailed analysis;
  • Green indicates that the simulated mould growth is at an acceptable level.
In this mould growth analysis, for this timber-framed clay masonry veneer wall, simulated using the temperate climate data for Melbourne, Australia, the results show that:
  • The 2-year mould growth simulation shows the least amount of mould growth risk;
  • The 5-year mould growth simulation shows a greater amount of mould growth risk than the 2-year simulation, but a lesser amount of mould growth risk than the 10-year simulation;
  • The 10-year mould growth simulation shows the greatest amount of mould growth risk.
Additionally, the results show that the orientation of the wall system, which includes solar-driven vapour pressure and drying potential, and shading, plays a significant role in the wall’s ability to support or hinder potential mould growth risk. Considering the thickness of the individual layers of the clay masonry wall system, the mould growth analysis of the clay masonry layer and the insulation layer is performed on the interior and exterior surfaces, whereas the other layers (air cavity, vapour permeable membrane, and plasterboard) are assessed only at the exterior surface, as shown in Table 15.
The mould growth results of the clay masonry veneer wall in the Cfb Köppen-Geiger classified climate, applying the BER TMY climate data for Melbourne, with a permeable membrane, show the following results:
  • Exterior climate–The datasets are in the RMY and EPW format, were certified and published in 2006, and use climate data up to, and including 2003. It could be argued that more appropriate data should be used, but due to the infancy of hygrothermal research in Australia, this will occur in future research. One of the significant issues identified was the lack of precipitation data;
  • Establishment of interior climate for hygrothermal simulations—Australia has no specified interior conditions within its building regulations; however, the majority of Australian new homes demonstrate envelope thermal performance via the NatHERS scheme. Through the use of NatHERS simulations, the results provided insights into the interior temperature conditions of modern homes, which have been corroborated by CSIRO studies. This article analysed the appropriateness of the interior temperature conditions recommended within ASHRAE 160 and DIN 4108. These standards recommend an interior temperature of 21.1 °C be used for hygrothermal simulations;
  • Simulation span—The three mould growth graphs presented show the variability of mould growth subject to orientation. These demonstrate the need for a ten-year simulation, so as to grasp the long-term mould growth pattern and identify long-term risks within the built fabric;
  • Orientation and shading—The four orientations explored in the research showed two wall systems with nil or an acceptable amount of mould growth and two wall systems with concerning amounts of mould growth. WUFI® Pro (2022) does not allow for a wall system to be shaded. In a real scenario, the external wall may be intentionally or unintentionally shaded, removing the solar-driven drying potential. The non-equatorial orientated walls always performed worse, indicating a need to focus on southern orientated simulations for the southern hemisphere.

5. Conclusions

In Australia, it has been identified that up to 40% of Australian homes may face condensation and mould problems. Therefore, an appropriate method to undertake hygrothermal and mould growth analysis is urgently needed. This detailed study set out to establish the most appropriate method, given the available empirically validated transient simulation tools. After a review of the appropriateness of the simulation methods, the principles identified in ASHRAE standard 160 were identified as the most appropriate for this first stage of hygrothermal simulation in Australia. This is justified based on the use of more specific thermostat setpoints, relative humidity conditions, and air change rates for the interior environment. Additional inputs included the addition of ventilation and moisture within the 40 mm air cavity and the inclusion of a moisture source through the pliable membrane layer. Several challenges were encountered, including adequate climate data and the selection of construction materials. There is an urgent need to establish contemporary multi-year hygrothermal climate datasets and a database of construction materials for Australia. Changes to these critical inputs would change the simulation results discussed in this article. There may also need to be an Australian Standard developed to specify simulation software capabilities, input requirements and how to report simulation results.
The hygrothermal simulation results from the case study a masonry veneer external wall system identified that the final moisture content of the wall materials was identical for the 2-, 5-, and 10-year simulations, indicating little value in the multi-year simulations. However, this study identified that the 2-year mould growth simulation showed the least amount of mould growth risk. The 5-year mould growth simulation results showed a greater amount of mould growth risk than the 2-year simulation but a lesser amount of mould growth risk than the 10-year simulation. Whilst the 10-year simulation showed the greatest amount of mould growth risk. Significantly, the long-term mould index value increased such that a wall system that was suitable in a 2-year simulation had an unacceptable mould index in the 5-year simulation. Whilst the results from the 10-year simulation showed an unacceptable or concerning mould index for three of the four cases. Considering the external residential wall system should have a life of 70 years, or more, based on these results the mould growth simulation should be completed for a minimum of 10 years. Additionally, the orientation of the wall had an impact on both simulated moisture and mould growth risks, indicating that the highest risk was for the non-equatorial facing wall system. Recognising the shading limitations within the software, all simulations should be completed in a non-equatorial orientation to establish possible mould growth risks.
This detailed study has identified the simulation methods that should be used in temperate climates and the need for a minimum of 10 years of mould growth calculation.

Author Contributions

Conceptualization, data collection and analysis, and manuscript–preparation and revision; S.N.; experimental–technical guidance, project administration, editing, and manuscript–revision and editing, M.D.; guidance in using the hygrothermal simulation software, WUFI®, in the Australian context, H.K.; article development advice, P.W. All authors have read and agreed to the published version of the manuscript.

Funding

This research received no external funding.

Institutional Review Board Statement

Not applicable.

Informed Consent Statement

Not applicable.

Data Availability Statement

Not applicable.

Acknowledgments

This research has been made possible through funding from the Tasmanian state government via Consumer, Building and Occupational Services, Department of Justice.

Conflicts of Interest

The authors declare no conflict of interest.

References

  1. ABCB. National Construction Code: Volume 2; The Australian Building Codes Board: Canberra, Australia, 2019; Volume 2.
  2. Ballinger, J.A.; Cassell, D. Solar efficient housing and NatHERS: An important marketing tool. Fuel Energy Abstr. 1995, 4, 273. [Google Scholar]
  3. Delsante, A. A Validation of the ‘AccuRate’ Simulation Engine Using BESTEST; The Australian Greenhouse Office: Canberra, Australia, 2004. [Google Scholar]
  4. Australian Greenhouse Office. The National Greenhouse Strategy: Strategic Framework for Advancing Australia’s Greenhouse Response; Parliament of Australia: Canberra, Australia, 1998. Available online: https://www.aph.gov.au/Parliamentary_Business/Committees/Senate/Environment_and_Communications/Completed%20inquiries/1999-02/gobalwarm/report/c04 (accessed on 21 September 2022).
  5. Australian Greenhouse Office. Energy Research for the Building Code of Australia; Commonwealth of Australia: Canberra, Australia, 2000. [Google Scholar]
  6. Dewsbury, M. The Empirical Validation Of House Energy Rating (HER) Software for Lightweight Housing in Cool Temperate Climates. Ph.D. Thesis, University of Tasmania, Launceston, Tasmania, Australia, 2011. [Google Scholar]
  7. McLeod, P. The Cost Effectiveness of Housing Thermal Performance Improvements in Avoiding CO2-Emissions. Ph.D. Thesis, University of Tasmania, Launceston, Tasmania, Australia, 2013. [Google Scholar]
  8. 5250:2002, B; Code of Practice for Control of Condensation in Buildings. British Standards Institution: London, UK, 2002.
  9. Hamdan, M.A. Layered wall design to prevent moisture condensation on its inside surface. Energy Convers. Manag. 2002, 43, 1821–1828. [Google Scholar] [CrossRef]
  10. Karagiozis, A.; Salonvaara, M. Hygrothermal system-performance of a whole building. Build. Environ. 2001, 36, 779–787. [Google Scholar] [CrossRef]
  11. Salonvaara, M.; Ojanen, T.; Kokko, E.; Karagiozis, A. Drying capabilities of wood frame walls with wood siding. In Proceedings of the 7th Thermal Performances of the Exterior Envelopes of Buildings Conference, Thermal VII, Clearwater Beach, United States, 6–10 December 1998. [Google Scholar]
  12. Dewsbury, M.; Law, T.; Potgieter, J.; Fitz-Gerald, D.; McComish, B.; Chandler, T.; Soudan, A. Scoping Study of Condensation in Residential Buildings-Final Report; Department of Industry Innovation and Science: Tasmania, Australia, 2016. [Google Scholar]
  13. Viitanen, H.; Krus, M.; Ojanen, T.; Eitner, V.; Zirkelbach, D. Mold risk classification based on comparative evaluation of two established growth models. In Proceedings of the 6th International Building Physics Conference, IBPC 2015, Torino, Italy, 14–17 June 2015; pp. 1425–1430. [Google Scholar]
  14. Nath, S.; Dewsbury, M.; Orr, K. Is new housing a health hazard? In Proceedings of the Engaging Architectural Science: Meeting the Challenges of Higher Density, 52nd International Conference of the Architectural Science Association 2018, RMIT University, Melbourne, Australia, 28 November–1 December 2018; pp. 71–78. [Google Scholar]
  15. Clarke, J.A.; Johnstone, C.M.; Kelly, N.J.; McLean, R.C.; Rowan, N.J.; Smith, J.E. A technique for the prediction of the conditions leading to mould growth in buildings. Build. Environ. 1999, 34, 515–521. [Google Scholar] [CrossRef]
  16. Straus, D.C.; Cooley, J.D.; Wong, W.C.; Jumper, C.A. Studies on the role of fungi in sick building syndrome. Arch. Environ. Health: Int. J. 2003, 58, 475–478. [Google Scholar] [CrossRef]
  17. Tsongas, G.A.; Riordan, F. Minimum conditions for visible mold growth. ASHRAE 2016, 58, 32. [Google Scholar]
  18. Lie, S.K.; Vestøl, G.I.; Høibø, O.; Gobakken, L.R. Surface mould growth on wooden claddings–effects of transient wetting, relative humidity, temperature and material properties. Wood Mater. Sci. Eng. 2018, 14, 129–141. [Google Scholar] [CrossRef]
  19. Kowalski, W. Aerobiological Engineering Handbook: Airborne Disease and Control Technologies; McGraw Hill Professional: New York, NY, USA, 2005. [Google Scholar]
  20. Law, T. Comfort energetics: Thermal comfort under energy constraints. In The Future of Thermal Comfort in an Energy-Constrained World; Springer: Berlin/Heidelberg, Germany, 2013; pp. 83–115. [Google Scholar]
  21. Dewsbury, M.; Law, T. Recent increases in the occurrence of condensation and mould within new Tasmanian housing. In Proceedings of the 50th International Conference of the Architectural Science Association University of Adelaide, Adelaide, Australia, 7–9 December 2016; pp. 715–724. [Google Scholar]
  22. Cheng, M.; Galbally, I.; Gillett, R.; Keywood, M.; Lawson, S.; Molloy, S.; Powell, J. Indoor Air Project Part 1: Main Report—Indoor Air in Typical Australian Dwellings; CSIRO and the Bureau of Meteorology: Victoria, Australia, 2010. [Google Scholar]
  23. Ambrose, M. Interior Recorded Relative Humidity of Australian States; Nath, S., Ed.; CSIRO: Canberra, Australia, 2020. [Google Scholar]
  24. Hampton, A. Thermal mass and insulation for temperate climates. Environ. Des. Guide 2010, 1–11. [Google Scholar]
  25. Dewsbury, M. Condensation in Tasmanian homes-an update from UTAS. In Connections; Consumer, Building and Occupational Services, Department of Justice: Tasmania, Australia, 2018. [Google Scholar]
  26. Paevere, P.; Nguyen, M.; Syme, M.; Leicester, K.H. Nailplate backout—Is it a problem in plated timber trusses. In Proceedings of the 10th World Conference on Timber Engineering WCTE2008, Miyazaki, Japan, 2–5 June 2008. [Google Scholar]
  27. Täubel, M.; Hyvärinen, A. Occurrence of mycotoxins in indoor environments. In Environmental Mycology in Public Health; Elsevier: Amsterdam, The Netherlands, 2016; pp. 299–323. [Google Scholar]
  28. Cederlund, O.; Josefsson, F. An Evaluation of Two Well Insulated Roof Structures. Master’s Thesis, Lund University, Lund, Sweden, 2015. Available online: https://lup.lub.lu.se/luur/download?func=downloadFile&recordOId=7456132&fileOId=7456139 (accessed on 21 September 2022).
  29. Dyer, P. Something rotten in the state…. In ArchitectureNow; AGM A Division of BCI Central: Auckland, New Zealand, 2021; Available online: https://architecturenow.co.nz/articles/something-rotten-in-the-state/ (accessed on 21 September 2022).
  30. Künzel, H.; Dewsbury, M. Moisture control design has to respond to all relevant hygrothermal loads. In UCL Open: Environment Preprint; UCL Press: London, UK.
  31. WHO. WHO Guidelines for Indoor Air Quality: Dampness and Mould; WHO Regional Office for Europe: Copenhagen, Denmark, 2009.
  32. Dewsbury, M.; Nath, S.; Olaoye, T.S.; Künzel, H. Condensation and mould in Australian homes. In Proceedings of the 1st International Conference on Moisture in Buildings (ICMB21), London, UK, 28–29 June 2021. [Google Scholar]
  33. Nath, S.; Dewsbury, M.; Douwes, J. Has a singular focus of building regulations created unhealthy homes? Archit. Sci. Rev. 2019, 387–401. [Google Scholar] [CrossRef]
  34. Nath, S.; Dewsbury, M. Is regulation making homes unhealthy? In Proceedings of the AIRAH Building Physics Forum Conference, Wollongong, Australia, 22–23 November 2018. [Google Scholar]
  35. Knibbs, L.D.; Woldeyohannes, S.; Marks, G.B.; Cowie, C.T. Damp housing, gas stoves, and the burden of childhood asthma in Australia. Med. J. Aust. 2018, 208, 299–302. [Google Scholar] [CrossRef] [PubMed]
  36. Juel Holst, G.; Pørneki, A.; Lindgreen, J.; Thuesen, B.; Bønløkke, J.; Hyvärinen, A.; Elholm, G.; Østergaard, K.; Loft, S.; Brooks, C. Household dampness and microbial exposure related to allergy and respiratory health in Danish adults. Eur. Clin. Respir. J. 2020, 7, 1706235. [Google Scholar] [CrossRef] [PubMed] [Green Version]
  37. Mendell, M.J.; Kumagai, K. Observation-based metrics for residential dampness and mold with dose–response relationships to health: A review. Indoor Air 2017, 27, 506–517. [Google Scholar] [CrossRef]
  38. Thacher, J.D.; Gruzieva, O.; Pershagen, G.; Melén, E.; Lorentzen, J.C.; Kull, I.; Bergström, A. Mold and dampness exposure and allergic outcomes from birth to adolescence: Data from the BAMSE cohort. Allergy 2017, 72, 967–974. [Google Scholar] [CrossRef]
  39. Brambilla, A.; Gasparri, E. Hygrothermal behaviour of emerging timber-based envelope technologies in Australia: A preliminary investigation on condensation and mould growth risk. J. Clean. Prod. 2020, 276, 124129. [Google Scholar] [CrossRef]
  40. Brambilla, A.; Sangiorgio, A. Mould growth in energy efficient buildings: Causes, health implications and strategies to mitigate the risk. Renew. Sustain. Energy Rev. 2020, 132, 110093. [Google Scholar] [CrossRef]
  41. Holmes, A. Masonic Care residents given days to vacate homes in Newstead over mould fears. The Examiner, 12 September 2019. [Google Scholar]
  42. Moodie, C. Mould in rental homes under the spotlight as family claims health problems from mouldy house. ABC News, 20 February 2021. [Google Scholar]
  43. Moodie, C.; Shine, R. Mould in newly built Perth home blamed for family’s rashes, joint pain and headaches. ABC News, 25 November 2020. [Google Scholar]
  44. Brown, A.; Atkin, L. Mould in Melissa’s home was so bad she slept in her car. The Canberra Times, 9 December 2018. [Google Scholar]
  45. Farnsworth, S. Doctor had to plead for boy with lung problems to be moved out of mouldy rental house. ABC News, 18 December 2017. [Google Scholar]
  46. Asher, N.; Altree-Williams, A. Mould woes add strain for Melbourne renters during coronavirus stage 4 lockdown. ABC News, 30 August 2020. [Google Scholar]
  47. Baker, E.; Lester, L.H.; Bentley, R.; Beer, A. Poor housing quality: Prevalence and health effects. J. Prev. Interv. Community 2016, 44, 219–232. [Google Scholar] [CrossRef] [PubMed]
  48. Bentley, R.; Baker, E. Mould and Damp Health Costs Are about 3 Times Those of Sugary Drinks. We Need a Healthy Housing Agenda. Available online: https://www.thefifthestate.com.au/urbanism/hazmat/mould-and-damp-health-costs-are-about-3-times-those-of-sugary-drinks-we-need-a-healthy-housing-agenda/ (accessed on 27 October 2020).
  49. Cincinelli, A.; Martellini, T. Indoor air quality and health. Int. J. Environ. Res. Public Health 2017, 14, 1286. [Google Scholar] [CrossRef] [PubMed] [Green Version]
  50. Lades, L.K.; Laffan, K.; Daly, M.; Delaney, L. Daily emotional well-being during the COVID-19 pandemic. Br. J. Health Psychol. 2020, 25, 902–911. [Google Scholar] [CrossRef] [PubMed]
  51. Zachary, Z.; Brianna, F.; Brianna, L.; Garrett, P.; Jade, W.; Alyssa, D.; Mikayla, K. Self-quarantine and weight gain related risk factors during the COVID-19 pandemic. Obes. Res. Clin. Pract. 2020, 14, 210–216. [Google Scholar] [CrossRef]
  52. Nath, S.; Dewsbury, M. The use of an innovative hygrothermal simulation method to develop built fabric recommendations for southern Australia. In Proceedings of the 53rd International Conference of the Architectural Science Association (ANZAScA)IIT Roorkee, Roorkee, India, 28–30 November 2019; pp. 1–10. [Google Scholar]
  53. Nath, S.; Dewsbury, M.; Watson, P.; Lovell, H.C.; Künzel, H.M. A bio-hygrothermal mould growth analysis of typical Australian residential wall systems. In Proceedings of the 54th International Conference of the Architectural Science Association (ANZAScA), Auckland, New Zealand, 26–27 November 2020; pp. 1–11. [Google Scholar]
  54. Dewsbury, M.; Soudan, A.; Su, F.; Geard, D.; Cooper, A.; Law, T. Condensation Risk Mitigation for Tasmanian Housing; UTAS: Tasmania, Australia, 2018. [Google Scholar]
  55. Mumovic, D.; Ridley, I.; Oreszczyn, T.; Davies, M. Condensation risk: Comparison of steady-state and transient methods. Build. Serv. Eng. Res. Technol. 2006, 27, 219–233. [Google Scholar] [CrossRef] [Green Version]
  56. Janssens, A.; Hens, H. Condensation risk assessment. In Proceedings of the Thermal Performance of the Exterior Envelopes of Buildings VII: Conference Proceedings, Clearwater beach, FL, USA, 6–10 December 1998; pp. 199–206. [Google Scholar]
  57. Little, J.; Ferraro, C.; Arregi, B. Assessing Risks in Insulation Retrofits Using Hygrothermal Software Tools; Historic Environment Scotland Technical Paper: Edinburgh, Scotland, 2015; Available online: https://www.researchgate.net/profile/Joseph-Little/publication/283710903_Assessing_risks_in_insulation_retrofits_using_hygrothermal_software_tools_-_Heat_and_moisture_transport_in_internally_insulated_stone_walls/links/5643a40908aef646e6c6c367/Assessing-risks-in-insulation-retrofits-using-hygrothermal-software-tools-Heat-and-moisture-transport-in-internally-insulated-stone-walls.pdf (accessed on 21 September 2022).
  58. British Standards. BS5250:2011; Code of Practice for Control of Condensation in Buildings. British Standards Institution: London, UK, 2011. Available online: https://isolergrund.uk/wp-content/uploads/2020/06/BS-5250-2011-A1-2016e.pdf (accessed on 21 September 2022).
  59. Künzel, H.M.; Zirkelbach, D. Advances in hygrothermal building component simulation: Modelling moisture sources likely to occur due to rainwater leakage. J. Build. Perform. Simul. 2013, 6, 346–353. [Google Scholar] [CrossRef]
  60. Cascione, V.; Marra, E.; Zirkelbach, D.; Liuzzi, S.; Stefanizzi, P. Hygrothermal analysis of technical solutions for insulating the opaque building envelope. Energy Procedia 2017, 126, 203–210. [Google Scholar] [CrossRef]
  61. Lstiburek, J.; Carmody, J. Moisture Control Handbook: Principles and Practices for Residential and Small Commercial Buildings; John Wiley & Sons: Hoboken, NJ, USA, 1996. [Google Scholar]
  62. Liu, J.; Aizawa, H.; Yoshino, H. CFD prediction of surface condensation on walls and its experimental validation. Build. Environ. 2004, 39, 905–911. [Google Scholar] [CrossRef]
  63. Arens, E.A.; Baughman, A. Indoor humidity and human health: Part II--buildings and their systems. ASHRAE 1996. [Google Scholar]
  64. Künzel, H.M.; Holm, A.; Zirkelbach, D.; Karagiozis, A.N. Simulation of indoor temperature and humidity conditions including hygrothermal interactions with the building envelope. Sol. Energy 2005, 78, 554–561. [Google Scholar] [CrossRef]
  65. Choidis, P.; Kraniotis, D.; Lehtonen, I.; Hellum, B. A Modelling Approach for the Assessment of Climate Change Impact on the Fungal Colonization of Historic Timber Structures. Forests 2021, 12, 819. [Google Scholar] [CrossRef]
  66. JPA TL Ltd. Development of Transient Condensation Risk Analysis Software Initial Considerations; Dewsbury, M., Ed.; JPA TL Ltd.: Launceston, TAS, Australia, 2017. [Google Scholar]
  67. Künzel, H.M. Simultaneous Heat and Moisture Transport in Building Components—One-and Two-Dimensional Calculation Using Simple Parameters; Fraunhofer Institute of Building Physics: Stuttgart, Germany, 1995; Available online: https://wufi.de/de/wp-content/uploads/sites/9/2014/12/K%C3%BCnzel-1995-Simultaneous-Heat-and-Moisture-Transport1.pdf (accessed on 21 September 2022).
  68. Law, T. Condensation in TAS Houses; Building Designers Australia: Campbell Town, TAS, Australia, 2015. [Google Scholar]
  69. BS EN 15026; Hygrothermal Performance of Building Components and Building Elements—Assessment of Moisture Transfer by Numerical Simulation. British Standards: London, UK, 2007.
  70. JPA TL Ltd. SAP 9.92 Module & U-Value Modules & Condensation Risk; JPA TL Ltd: Newcastle upon Tyne, UK, 2016; Available online: https://www.techlit.co.uk/downloads/JPAUserManualUK6.03.pdf (accessed on 21 September 2022).
  71. Thomann, F.S.; Hall, M.R.; Mokaya, R.; Stevens, L.A. Hygrothermal simulation-informed design of mesoporous desiccants for optimised energy efficiency of mixed mode air conditioning systems. J. Mater. Chem. A 2015, 3, 17290–17303. [Google Scholar] [CrossRef] [Green Version]
  72. Chang, S.J.; Kim, S. Hygrothermal performance of exterior wall structures using a heat, air and moisture modeling. Energy Procedia 2015, 78, 3434–3439. [Google Scholar] [CrossRef] [Green Version]
  73. Fraunhofer Institute of Building Physics. WUFI® 2021; Fraunhofer Institute of Building Physics: Stuttgart, Germany; Available online: https://wufi.de/en/software/wufi-pro/ (accessed on 21 September 2022).
  74. Antretter, F.; Klingenberg, K.; Pazold, M. All-in-One Design Tool Solution for Passive Houses and Buildings—Monthly Energy Balance and Hygrothermal Simulation. In Proceedings of the Thermal Performance of the Exterior Envelopes of Whole Buildings XII International Conference, Clearwater, FA, USA, 1–5 December 2013; pp. 626–640. [Google Scholar]
  75. Olaoye, T.S.; Dewsbury, M.; Künzel, H. A Method for Establishing a Hygrothermally Controlled Test Room for Measuring the Water Vapor Resistivity Characteristics of Construction Materials. Energies 2021, 14, 4. [Google Scholar] [CrossRef]
  76. Harriman, L. Mold and dampness. ASHRAE J. 2012, 54, 132. [Google Scholar]
  77. Olaoye, T.S.; Dewsbury, M. Establishing an environmentally controlled room to quantify water vapour resistivity properties of construction materials. In Proceedings of the 53rd International Conference of the Architectural Science Association, IIT Roorkee, Roorkee, India, 28–30 November 2019. [Google Scholar]
  78. Vereecken, E.; Vanoirbeek, K.; Roels, S. A preliminary evaluation of mould prediction models based on laboratory experiments. Energy Procedia 2015, 78, 1407–1412. [Google Scholar] [CrossRef] [Green Version]
  79. Dewsbury, M.; Law, T. Temperate climates, warmer houses and built fabric challenges. Procedia Eng. 2017, 180, 1065–1074. [Google Scholar] [CrossRef]
  80. Dewsbury, M.; Law, T.; Henderson, A. Investigation of Destructive Condensation in Australian Cool Temperate Buildings; Building Standards and Occupational Licensing, Department of Justice Tasmania: Tasmania, Australia, 2016; Available online: https://www.researchgate.net/profile/Mark-Dewsbury-2/publication/301894751_Final_report_-_Investigation_of_destructive_condensation_in_Australian_cool-temperate_buildings/links/572c319908ae057b0a095c80/Final-report-Investigation-of-destructive-condensation-in-Australian-cool-temperate-buildings.pdf (accessed on 21 September 2022).
  81. Vereecken, E.; Saelens, D.; Roels, S. A comparison of different mould prediction models. In Proceedings of the Building Simulation 2011: 12th Conference of International Building Performance Simulation Association, Sydney, Australia, 14–16 November 2011. [Google Scholar]
  82. ISO. ISO 13788:2012; Hygrothermal Performance of Building Components and Building Elements—Internal Surface Temperature to Avoid Critical Surface Humidity and Interstitial Condensation—Calculation Methods. International Organization for Standardization: Geneva, Switzerland, 2012.
  83. ABCB. Climate Zone Map: Australia Wide; The Australian Building Codes Board: Canberra, Australia, 2019. Available online: https://www.abcb.gov.au/Resources/Tools-Calculators/Climate-Zone-Map-Australia-Wide# (accessed on 21 September 2022).
  84. Reardon, C.; Milne, G.; McGee, C.; Downton, P. Your Home Technical Manual, Australia’s Guide to Environmentally Sustainable Homes, 4th ed.; Australian Government: Canberra, Australia, 2010. Available online: https://www.hort360.com.au/wordpress/uploads/Energy/Lighting/Your%20home%20technical%20manual%20(4th%20Edition).pdf (accessed on 21 September 2022).
  85. DIN. DIN 4108-3: 2018-10; Thermal Protection and Energy Economy in Buildings—Part 3. Protection against Moisture Subject to Climate Conditions—Requirements, Calculation Methods and Directions for Planning and Construction. German Institute for Standardisation (Deutsches Institut für Normung): Berlin, Germany, 2018. Available online: https://infostore.saiglobal.com/en-us/standards/din-4108-3-2018-10-409818_saig_din_din_2678066/ (accessed on 21 September 2022).
  86. Su, F.; Dewsbury, M.; Fay, R.; Kuenzel, H.M. The Southern Hemisphere’s Vulnerability to Climate Change; AIRAH Building Physics: Sydney, NSW, Australia, 12 October 2022. [Google Scholar]
  87. Nationwide House Energy Rating Scheme. Software Accreditation Protocol; Australia; 2019. Available online: https://www.nathers.gov.au/sites/default/files/2019-10/2019%20NatHERS%20Software%20Accreditation%20Protocol.pdf (accessed on 21 September 2022).
  88. Künzel, H.M. Accounting for unintended moisture sources in hygrothermal building analysis. In Proceedings of the 10th Nordic Symposium of Building Physics, Lund, Sweden, 15–19 June 2014; pp. 947–953. [Google Scholar]
  89. ABCB. Building Code of Australia: Volume 2; The Australian Building Codes Board: Canberra, Australia, 1996.
  90. ABCB. Building Code of Australia: Volume 2; The Australian Building Codes Board: Canberra, Australia, 2005.
  91. ABCB. Building Code of Australia: Volume 2; The Australian Building Codes Board: Canberra, Australia, 2009.
  92. AS4200.2; Pliable Building Membranes and Underlays Part 2: Installation. Australian Standard: Sydney, Australia, 2017. Available online: https://infostore.saiglobal.com/preview/as/as4000/4200/4200.2-2017.pdf?sku=1911465 (accessed on 21 September 2022).
  93. AS/NZS4200.1; Pliable Building Membranes and Underlays Part 1: Materials. Australian Standard: Sydney, Australia. 2017. Available online: https://infostore.saiglobal.com/en-us/standards/as-4200-1-2017-99530_saig_as_as_209243/ (accessed on 21 September 2022).
  94. ABCB. Building Code of Australia: Volume 2; The Australian Building Codes Board: Canberra, Australia, 2010.
  95. ABCB. National Construction Code: Volume 2; The Australian Building Codes Board: Canberra, Australia, 2016.
  96. AIRAH. AIRAH Technical Handbook edition 5—Heat transfer, thermal properties and insulation. The Australian Institute of Refrigeration, Air Conditioning and Heating: Canberra, Australia, 2013. [Google Scholar]
  97. Law, T.; Chen, D. Hygrothermal Extension to the Residential House Energy Rating Software Used in Australia. Int. Build. Perform. Simul. Assoc. 2020. Available online: http://www.ibpsa.org/proceedings/BSO2020/BSOV2020_Law.pdf (accessed on 21 September 2022).
  98. ASHRAE. Standard 160-2016; Criteria for Moisture-Control Design Analysis in Buildings (ANSI Approved). American Society of Heating, Refrigerating and Air-Conditioning Engineers: Atlanta, GA, USA, 2016.
  99. Zirkelbach, D.; Schafaczek, B.; Künzel, H. Long-term hygrothermal performance of green roofs. In Proceedings of the Buildings XI, Atlanta, GA, USA, 4 December 2010. [Google Scholar]
  100. Gasparri, E.; Brambilla, A.; Aitchison, M. Hygorthermal analysis of timber-based external walls across different Australian climate zones. In Proceedings of the WCTE 2018, World Conference on Timber Engineering, Seoul, South Korea, 20–23 August 2018. [Google Scholar]
  101. Bastholm, C.J.; Madsen, A.M.; Frisvad, J.C.; Richter, J. Xerophilic fungi in museum repositories challenge our perception of healthy buildings and the preservation of cultural heritage. In Proceedings of the 17th International Healthy Buildings Conference, Online, 21–23 June 2021; SINTEF Academic Press: Trondheim, Norway. [Google Scholar]
  102. Van Den Bossche, N.; Lacasse, M.; Janssens, A. Watertightness of masonry walls: An overview. In Proceedings of the 12th International conference on Durability of Building Materials and Components (XII DBMC-2011), Porto, Portugal, 12–15 April 2011; pp. 49–56. [Google Scholar]
  103. Künzel, H.M. Addition of Moisture Source Inputs for Hygrothermal Simulations in the Australian Context; Nath, S., Ed.; School of Architecture & Design, University of Tasmania: Tasmania, Australia, 2019. [Google Scholar]
  104. Künzel, H.M. Addition of Latex Paint and Appropriate sd-Value Selection in the Australian Context; Nath, S., Ed.; School of Architecture & Design, University of Tasmania: Tasmania, Australia, 2020. [Google Scholar]
Figure 1. Growth conditions for mould [19,20].
Atmosphere 13 01755 g001
Figure 2. Indoor relative humidity in different seasons of Australian states [23].
Atmosphere 13 01755 g002
Figure 3. Australian climate zone map. [83,84].
Atmosphere 13 01755 g003
Figure 4. Graph showing the interior temperature and relative humidity profiles for EN−15026, DIN−4108, and WTA6−2.
Atmosphere 13 01755 g004
Figure 5. Graph showing temperature and relative humidity profile as generated according to ASHRAE 160 standards.
Atmosphere 13 01755 g005
Figure 6. Sectional details of the clay masonry veneer wall in the NCC climate zone 6.
Atmosphere 13 01755 g006
Figure 7. Example of a typical code-compliant clay masonry veneer wall—the base model.
Atmosphere 13 01755 g007
Figure 8. Example of a typical code-compliant clay masonry veneer wall—with a moisture source added inside the pliable membrane layer.
Atmosphere 13 01755 g008
Figure 9. WUFI® Pro settings for moisture ingress through the pliable membrane.
Atmosphere 13 01755 g009
Figure 10. Graphical output of the 7−star clay masonry veneer wall with a vapour-permeable membrane in a temperate climate—north orientation—10 years.
Atmosphere 13 01755 g010
Figure 11. Graph showing mould growth results and mould index within the clay masonry layer of the 7-star clay masonry veneer wall with a vapour-permeable membrane—north orientation.
Atmosphere 13 01755 g011
Figure 12. Graph showing mould growth result and mould index for the outside surface of the pliable membrane within the 40 mm air cavity layer of the 7-star clay masonry veneer wall with a vapour-permeable membrane—western orientation.
Atmosphere 13 01755 g012
Figure 13. Graph showing mould growth results and mould index within the insulation layer of the 7-star clay masonry veneer wall with a vapour-permeable membrane—western orientation.
Atmosphere 13 01755 g013
Table 1. Comparison between the WUFI® VTT model and WUFI® Bio model.
CriterionWUFI® VTT/Viitanen ModelWUFI® Bio/Biohygrothermal Model
Assessment methodThe Viitanen model is an empirically verified experimental model based on research laboratory studies on mould growth. This model uses a strong multi-step assessment: the mould index (MI), which explains the mould growth intensity on the surface in percentage. [13].The transient biohygrothermal model is a theoretical model [13].
Mould growth rateThis model restricts the projected mould growth rate to a climate-specific maximum value [13].The biohygrothermal model permits constant growth if there are suitable boundary conditions [13].
Mould indexWith the use of this model, a low level of the mould index is achieved during the unfavourable mould growth conditions [81].Using the biohygrothermal model, the mould index remains constant during unfavourable mould growth conditions [81].
ResultsFor both models, WUFI® VTT and WUFI® Bio, the results can be presented in a simplified multi-year mould index graph. Subject to the maximum mould index during the simulation period, a graphical traffic light system is used to highlight the mould growth risk [13].
Table 2. Mould growth risk calculation results [13].
Software GraphicLamp ColourDescription
Atmosphere 13 01755 i001RedCorresponds to a mould index of approximately ≤3.0. This type of construction is usually unacceptable.
Atmosphere 13 01755 i002Amber/yellowCorresponds to a mould index of >1.0 and <3.0. Additional criteria or investigations are needed to assess the suitability.
Atmosphere 13 01755 i003GreenCorresponds to a mould index of approximately ≤1.0. This type of construction is usually acceptable.
Table 3. Regulatory insulation requirements for clay masonry veneer wall from 1996 to 2022 [1,89,90,94,95].
Building Regulation PeriodAdded Insulation (R-Value)
Cool-TemperateTemperateWarm-Humid
1996–2002No insulationNo insulationNo insulation
2003–2005R1.0R0.6R0.5
2006–2009R1.5R1.0R1.0
2010–2021R2.0R2.0R2.0
2022R2.7R2.7R2.7
Table 4. Data showing specifications of the timber-framed clay masonry veneer wall system [96].
S.N.LayerSourceThickness (mm)NatHERS or ManufacturerWUFI®
R-Value (K/W)Density (kg/m3)R-Value (K/W)Porosity
(m3/m3)
Bulk Density (kg/m3)Specific Heat Capacity (J/kg·K)
1.Acrylic paint
2.Paper-faced plasterboard liningNatHERS10R0.06 R0.050.65850850
Knauf10R0.06650
Gyprock10R0.04–R0.05570
3.Glass-wool bulk insulation
(reflective)
NatHERS90R2.0-R2.000.8612001400
Bradford90R2.0-
4.Pliable membrane (Vapour impermeable)NatHERS1R0.0N.A.R0.000.00124001000
5.Pliable membrane (Vapour permeable)NatHERS1R0.0N.A.R0.000.0011302300
6.Reflective vapour cavityNatHERS~40 mmR0.133–R0.68N.A.R0.170.9991.31000
7.Clay masonryNatHERS110R0.6-R0.180.411650850
Table 5. Vapour control classification (vapour permeance µg/N·s) [93].
ClassVCM CategoryMinMax
1Vapour barrier0.00000.0022
2Vapour barrier0.00220.1429
3Vapour permeable0.14291.1403
4Vapour permeable1.1403No max
Table 6. Default settings of a typical clay masonry veneer wall.
NoMaterial/LayerThickness (m)Water Content (kg/m3)
1Solid clay masonry extruded0.1109.20
2Air layer0.0401.88
3Foil—BS5250 1000 MN·s/g0.0010.00
4Insulation (Isover Integra AP HWF Top)0.09019.60
5Air layer0.0401.88
6Gypsum board0.0106.30
Table 7. User-defined settings of the exterior surface.
ItemValueJustification
Heat resistance ((m2·K)/W)0.0588The standard value for outer surface air film resistance
Sd-value (m)NILNo coating for unpainted clay masonry
Shortwave radiation absorptivity0.8Representing red clay masonry
Ground shortwave reflectivity0.2Standard value representing suburban grass
Table 8. User-defined settings of the interior surface.
ItemValueJustification
Heat resistance ((m2·K)/W)0.125The standard value for inner surface air film resistance
Sd-value (m)NILThe initial analysis did not consider the vapour control effect of paint due to the regular service penetrations through the plasterboard lining system and the standard ‘glue and screw’ fixing system
Table 9. Water content properties of 7−star clay masonry veneer wall—north, south, and east orientation (kg/m3).
MaterialInitial Moisture Content2 Years5 Years10 Years
FinalMinMaxFinalMinMaxFinalMinMax
Brick9.204.862.519.424.862.519.424.862.519.42
40 mm air cavity1.880.670.212.030.670.212.030.670.212.03
Membrane0.000.000.000.000.000.000.000.000.000.00
Insulation0.820.700.370.820.700.370.820.700.370.82
Air gap1.881.150.273.131.150.273.131.150.273.13
Plasterboard6.305.622.536.535.622.536.535.622.536.53
Table 10. Water content properties of 7-star clay masonry veneer wall—west orientation (kg/m3).
MaterialInitial Moisture Content2 Years5 Years10 Years
FinalMinMaxFinalMinMaxFinalMinMax
Brick9.205.332.239.425.332.239.425.332.239.42
40 mm air cavity1.880.890.203.130.890.203.130.890.203.13
Membrane0.000.000.000.010.000.000.010.000.000.01
Insulation0.820.720.370.840.720.370.840.720.370.84
Air gap1.881.170.272.001.170.272.001.170.272.00
Plasterboard6.305.632.506.305.632.506.305.632.506.30
Table 11. Mould growth simulation results for the 7-star clay masonry veneer wall—northern orientation.
Material2 Years5 Years10 Years
Max Mould IndexMax Mould IndexMax Mould Index
Clay masonry (exterior surface)0.0020.0020.005
Clay masonry (interior surface)0.0040.0040.0013
Membrane (exterior surface)0.0060.0020.006
Insulation (exterior surface)0.0250.0250.025
Plasterboard (exterior surface)0.0030.0030.003
Plasterboard (interior surface)0.0030.0030.003
Table 12. Mould growth simulation results for the 7-star clay masonry veneer wall—southern orientation.
Material2 Years5 Years10 Years
Max Mould IndexMax Mould IndexMax Mould Index
Clay masonry (exterior surface)0.0080.0080.008
Clay masonry (interior surface)1.2501.5002.000
Membrane (exterior surface)0.7501.2502.000
Insulation (exterior surface)1.5002.5003.500
Plasterboard (exterior surface)0.0000.0000.000
Plasterboard (interior surface)0.0000.0000.000
Table 13. Mould growth simulation results for the 7-star clay masonry veneer wall—eastern orientation.
Material2 Years5 Years10 Years
Max Mould IndexMax Mould IndexMax Mould Index
Clay masonry (exterior surface)0.0050.0050.005
Clay masonry (interior surface)0.2000.2000.200
Membrane (exterior surface)0.1250.1250.075
Insulation (exterior surface)0.5001.001.00
Plasterboard (exterior surface)0.0020.0020.002
Plasterboard (interior surface)0.0020.0020.002
Table 14. Mould growth simulation results for the 7-star clay masonry veneer wall—western orientation.
Material2 Years5 Years10 Years
Max Mould IndexMax Mould IndexMax Mould Index
Clay masonry (exterior surface)0.0080.0030.008
Clay masonry (interior surface)0.5000.5000.750
Membrane (exterior surface)0.3000.3000.300
Insulation (exterior surface)1.2501.5002.000
Plasterboard (exterior surface)0.0000.0000.000
Plasterboard (interior surface)0.0000.0000.000
Table 15. Mould growth results of a typical cavity clay masonry veneer wall in all cardinal orientations in CZ 6.
2 Years5 Years10 Years
NorthSouthEastWestNorthSouthEastWestNorthSouthEastWest
Clay masonry (exterior surface)
Clay masonry (interior surface)
Air cavity (exterior surface)
Membrane (exterior surface)
Insulation (exterior surface)
Insulation (interior surface)
Plasterboard (exterior surface)
Publisher’s Note: MDPI stays neutral with regard to jurisdictional claims in published maps and institutional affiliations.

