
Evaluation and Prediction Model for Ice–Snow Tourism Suitability under Climate Warming


Abstract
1. Introduction
2. Materials and Methods
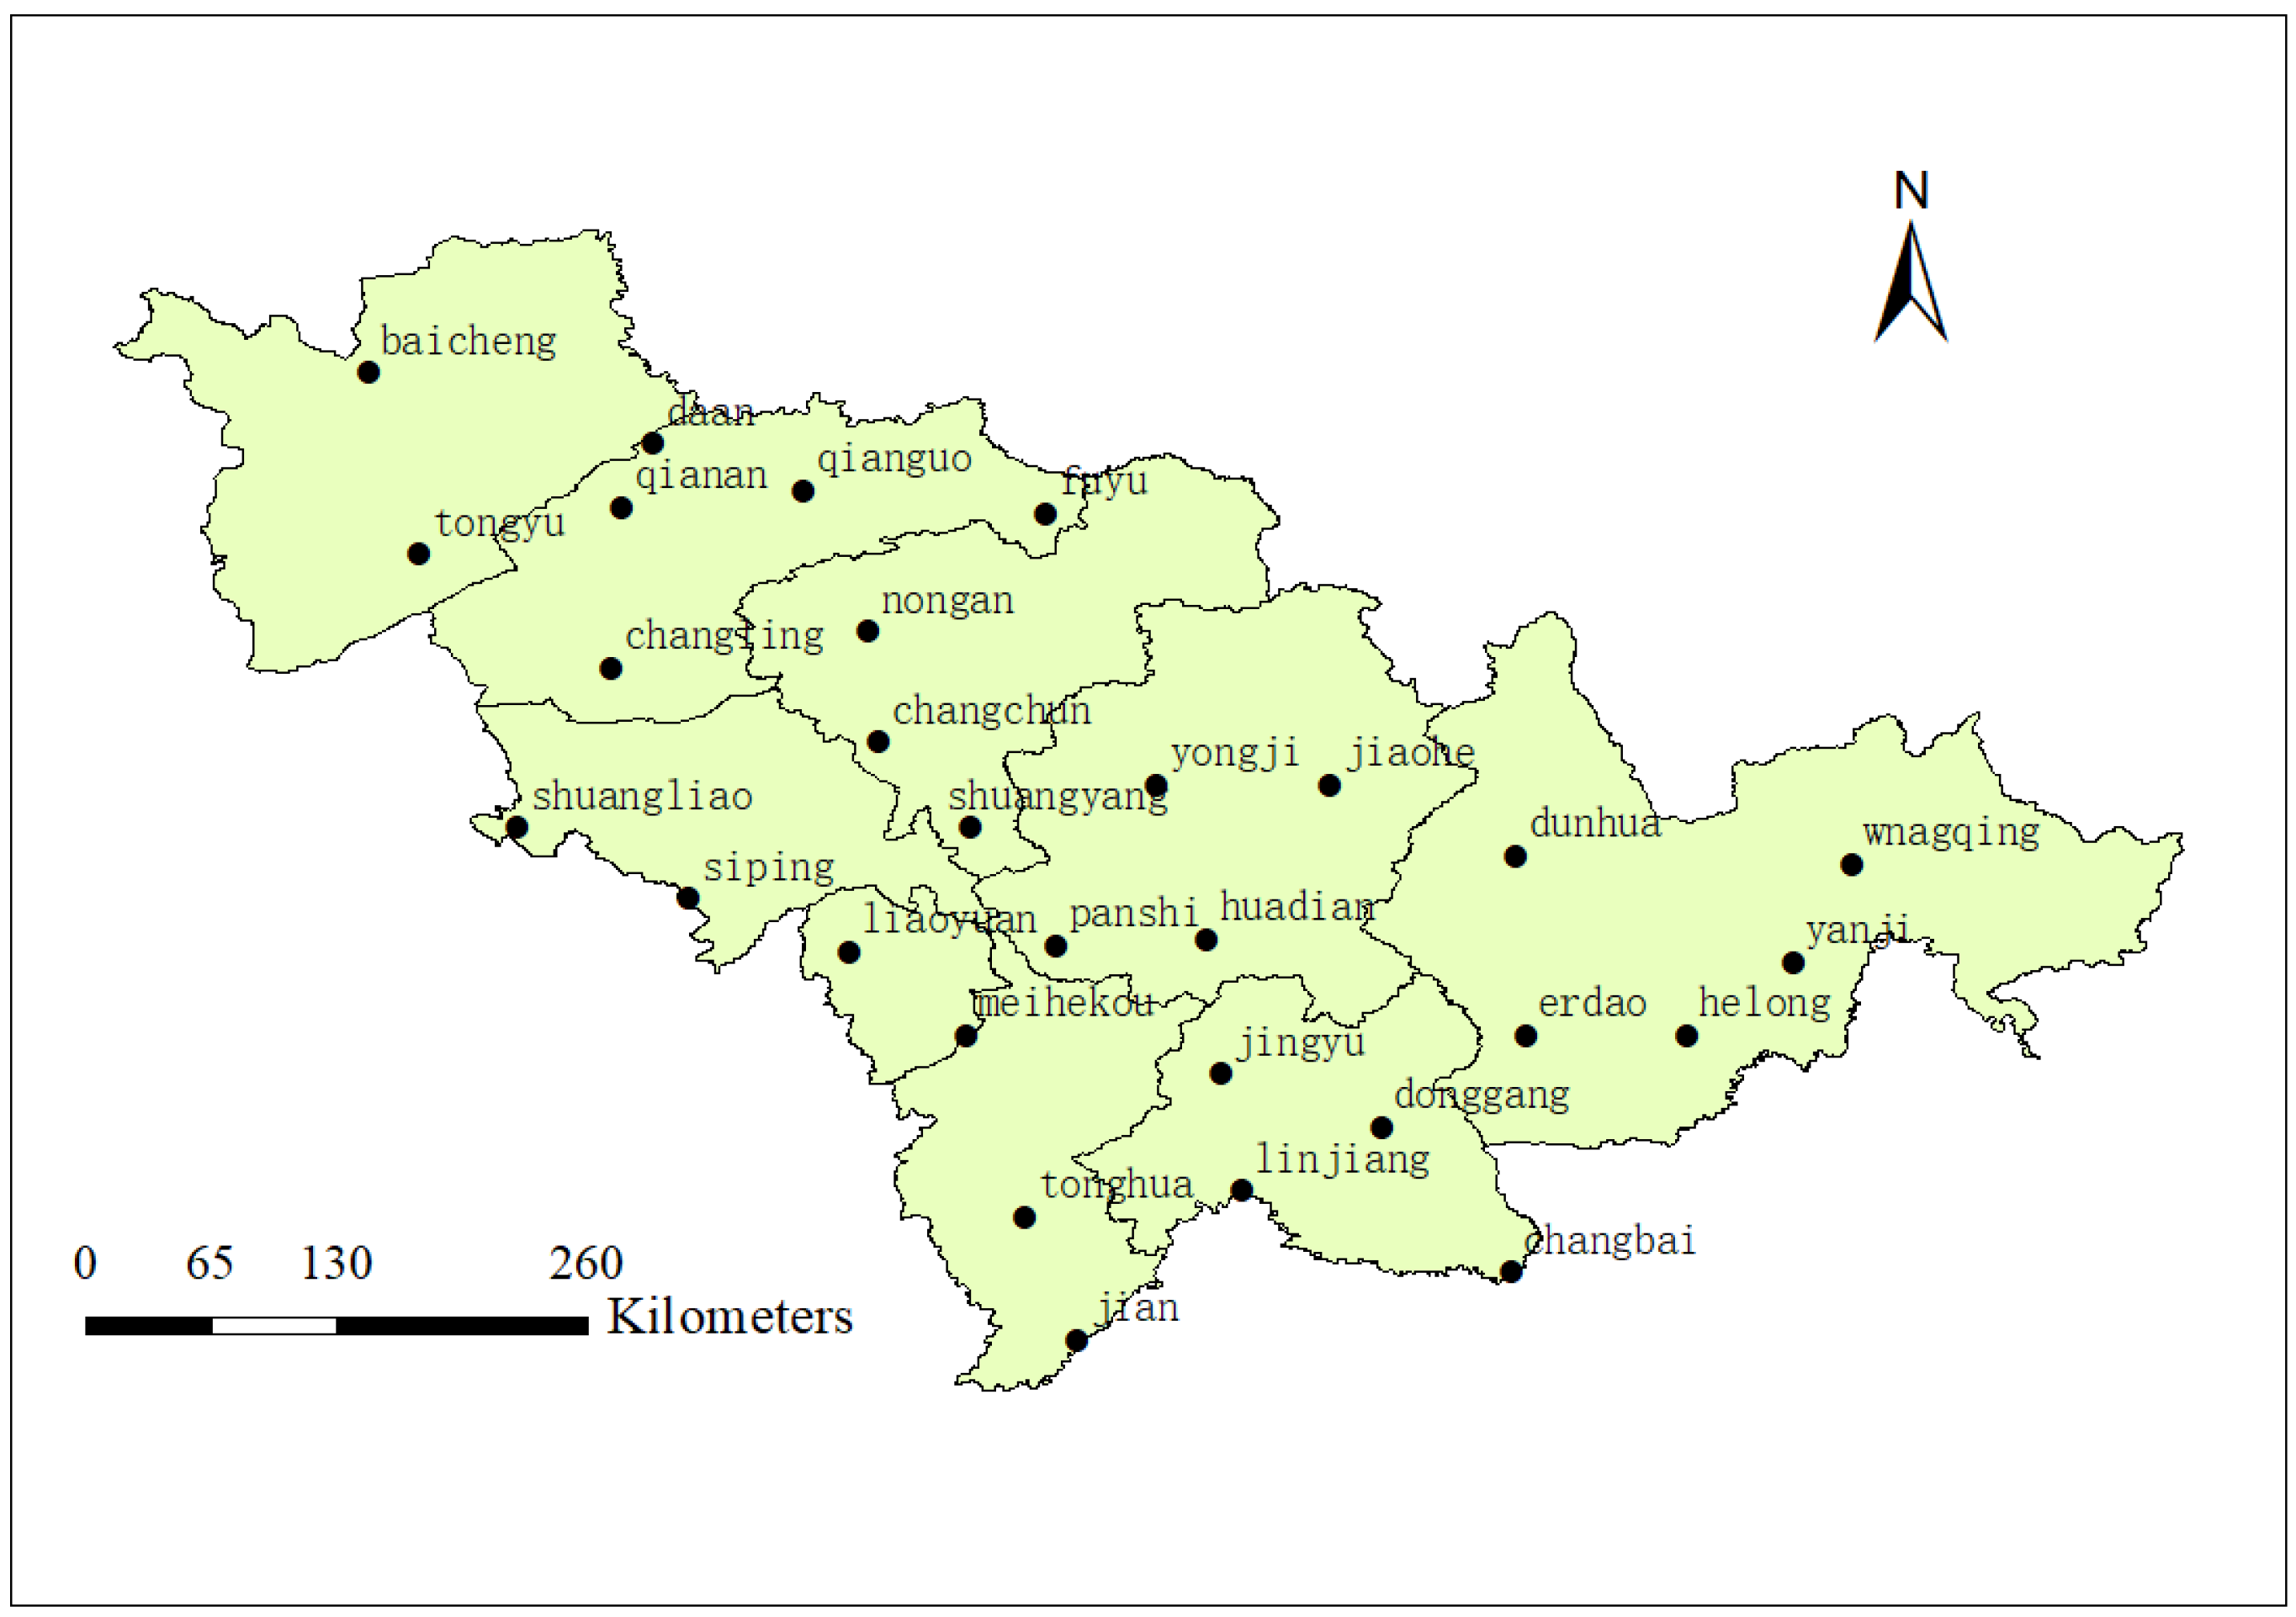
2.1. Study Area
2.2. Data Collection
2.3. Methods
3. Results
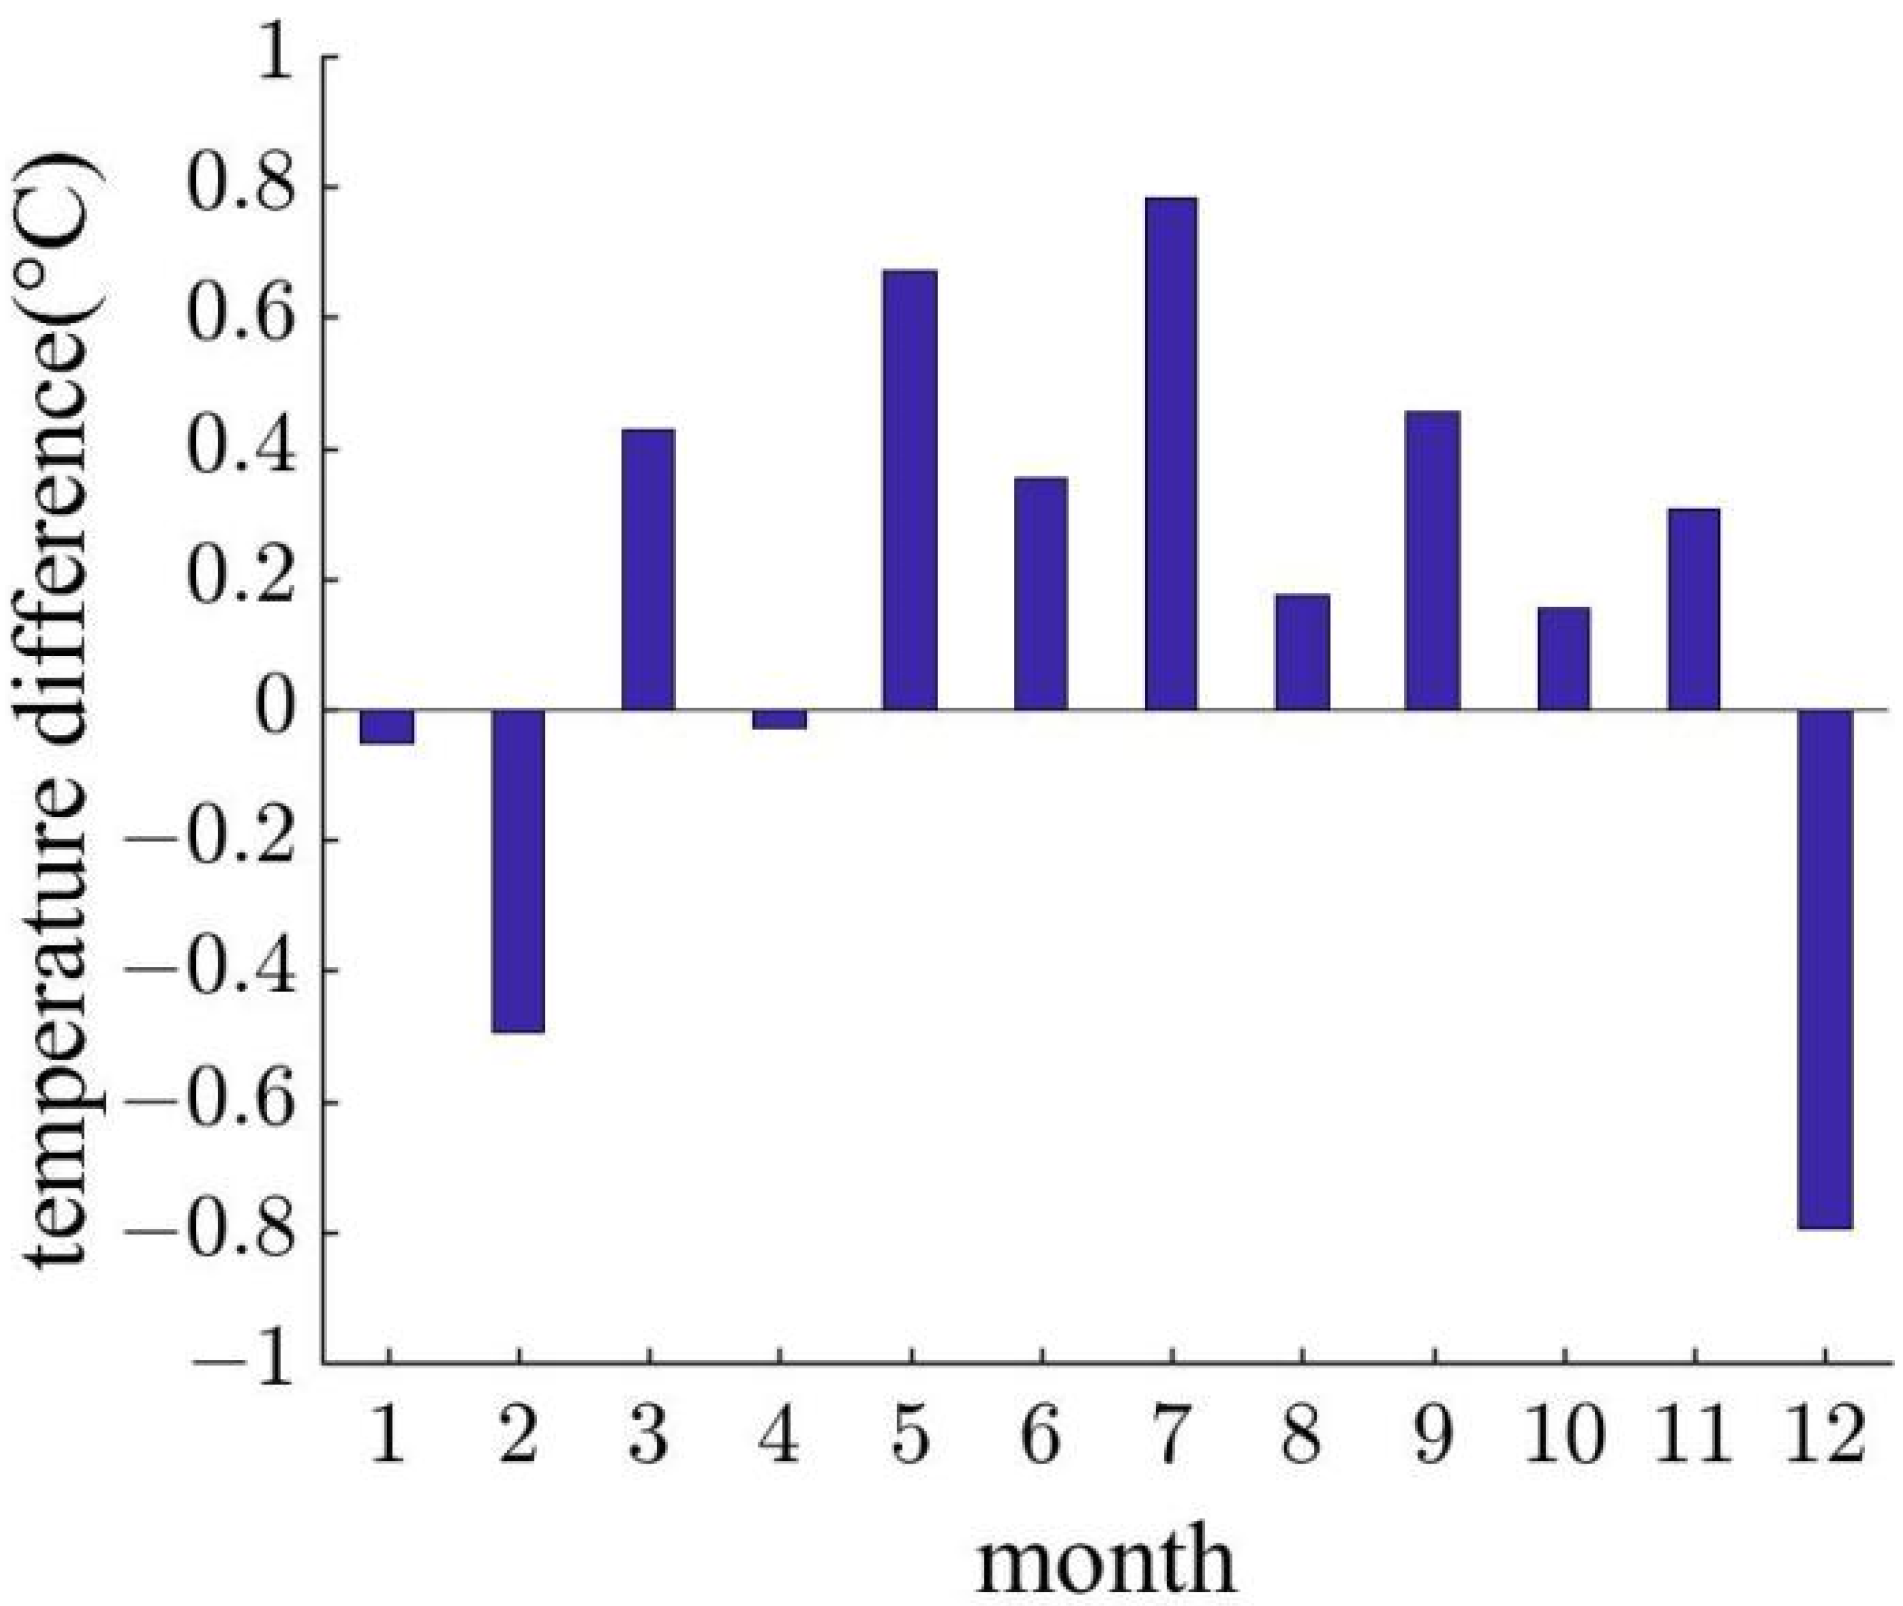
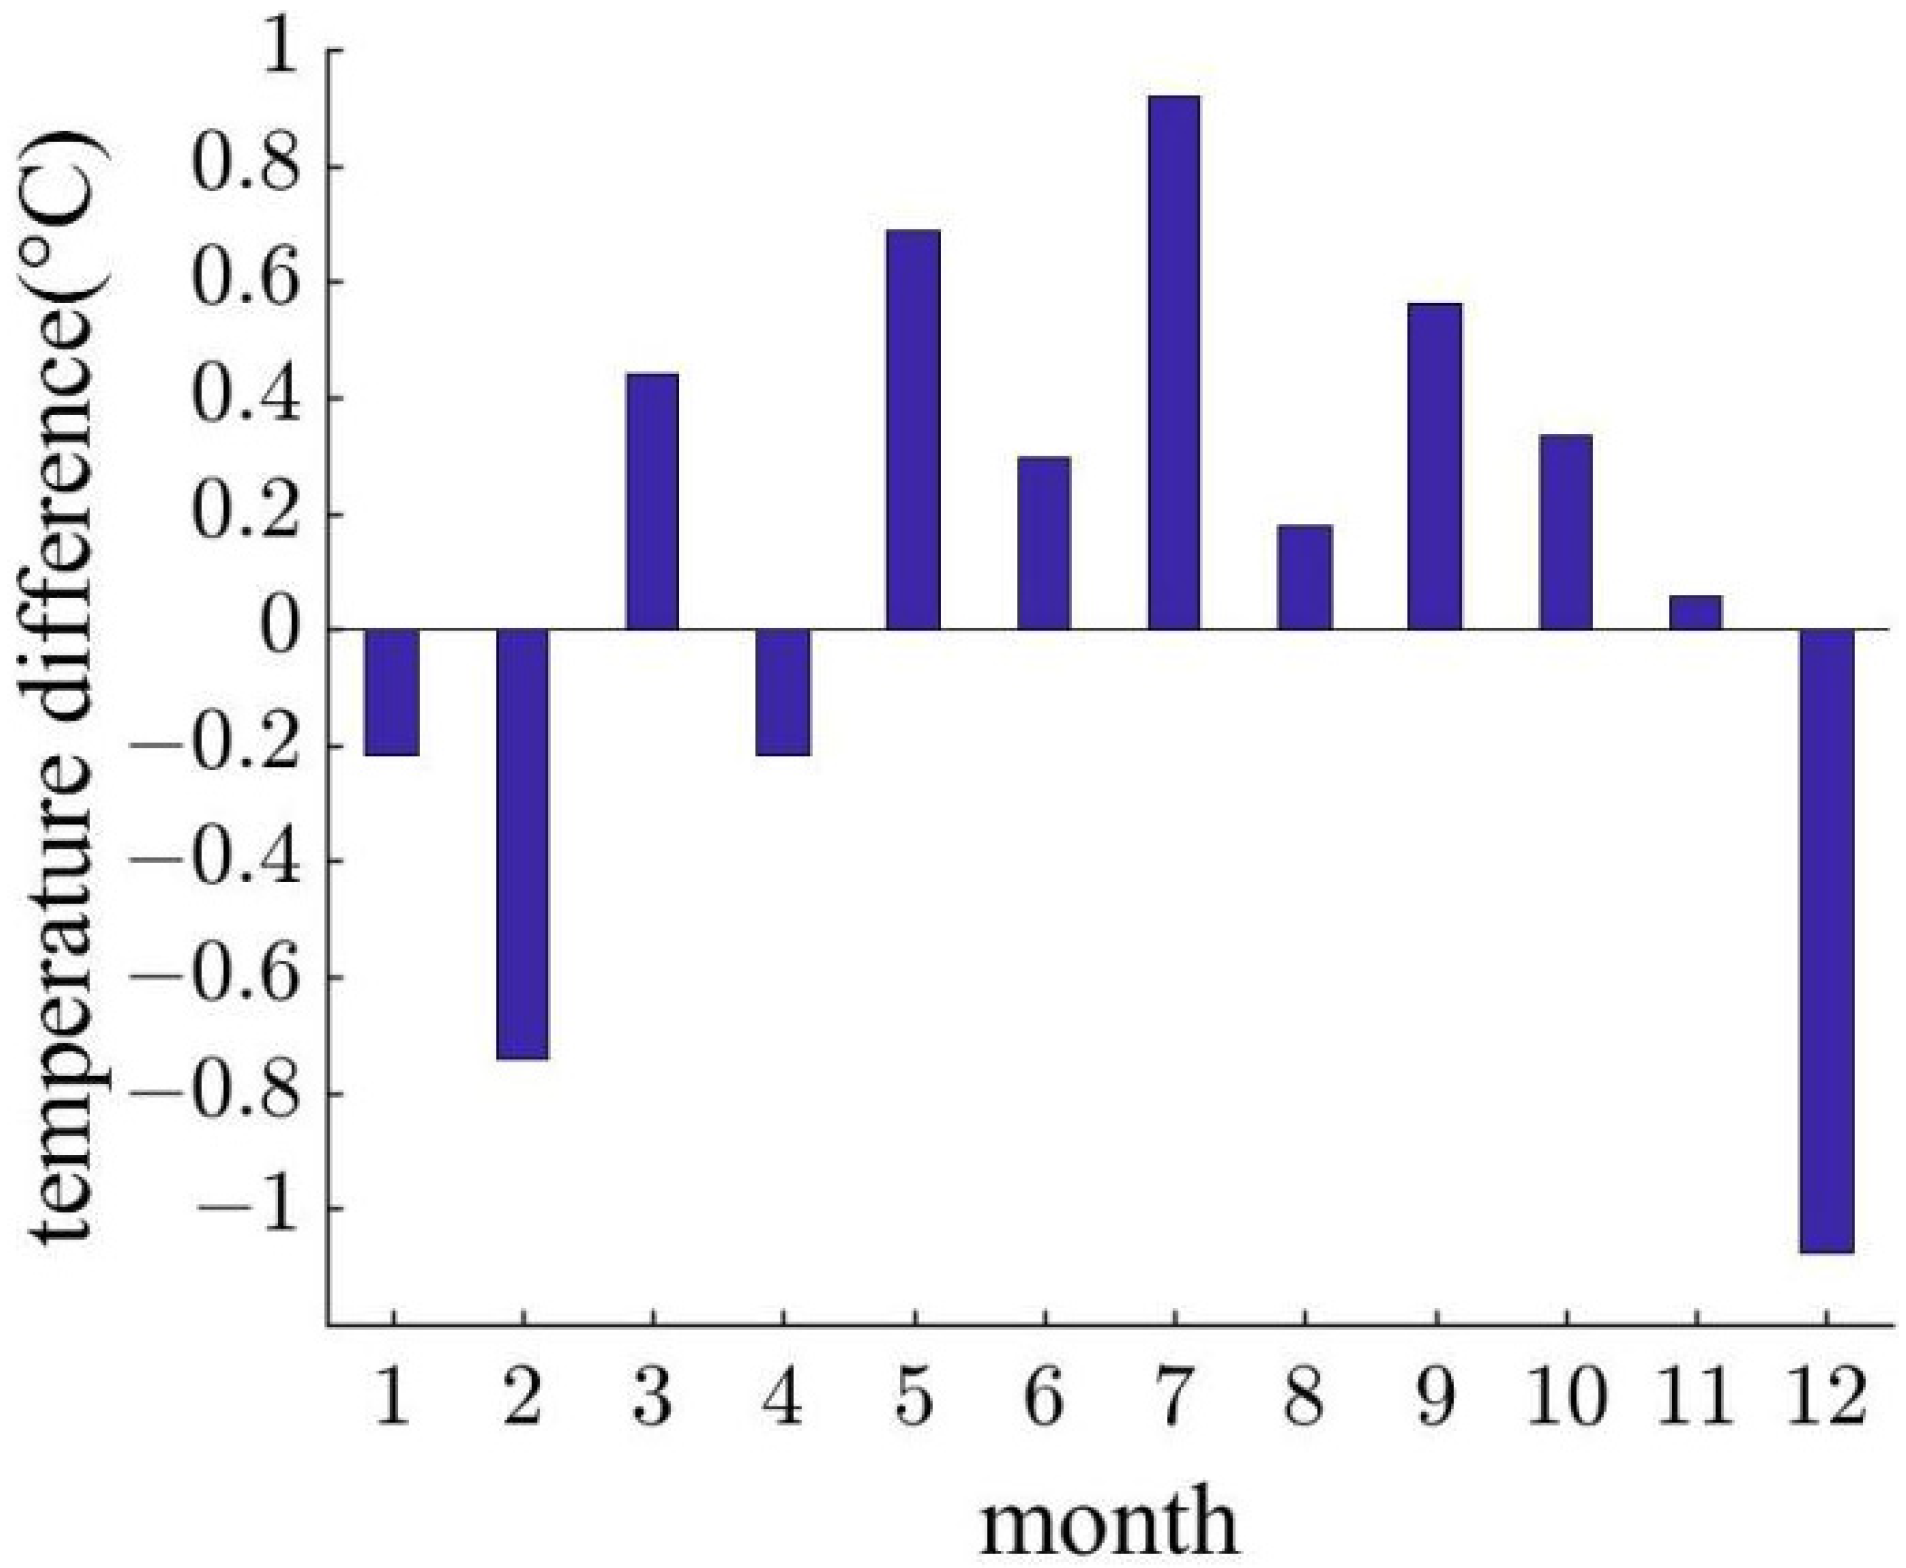
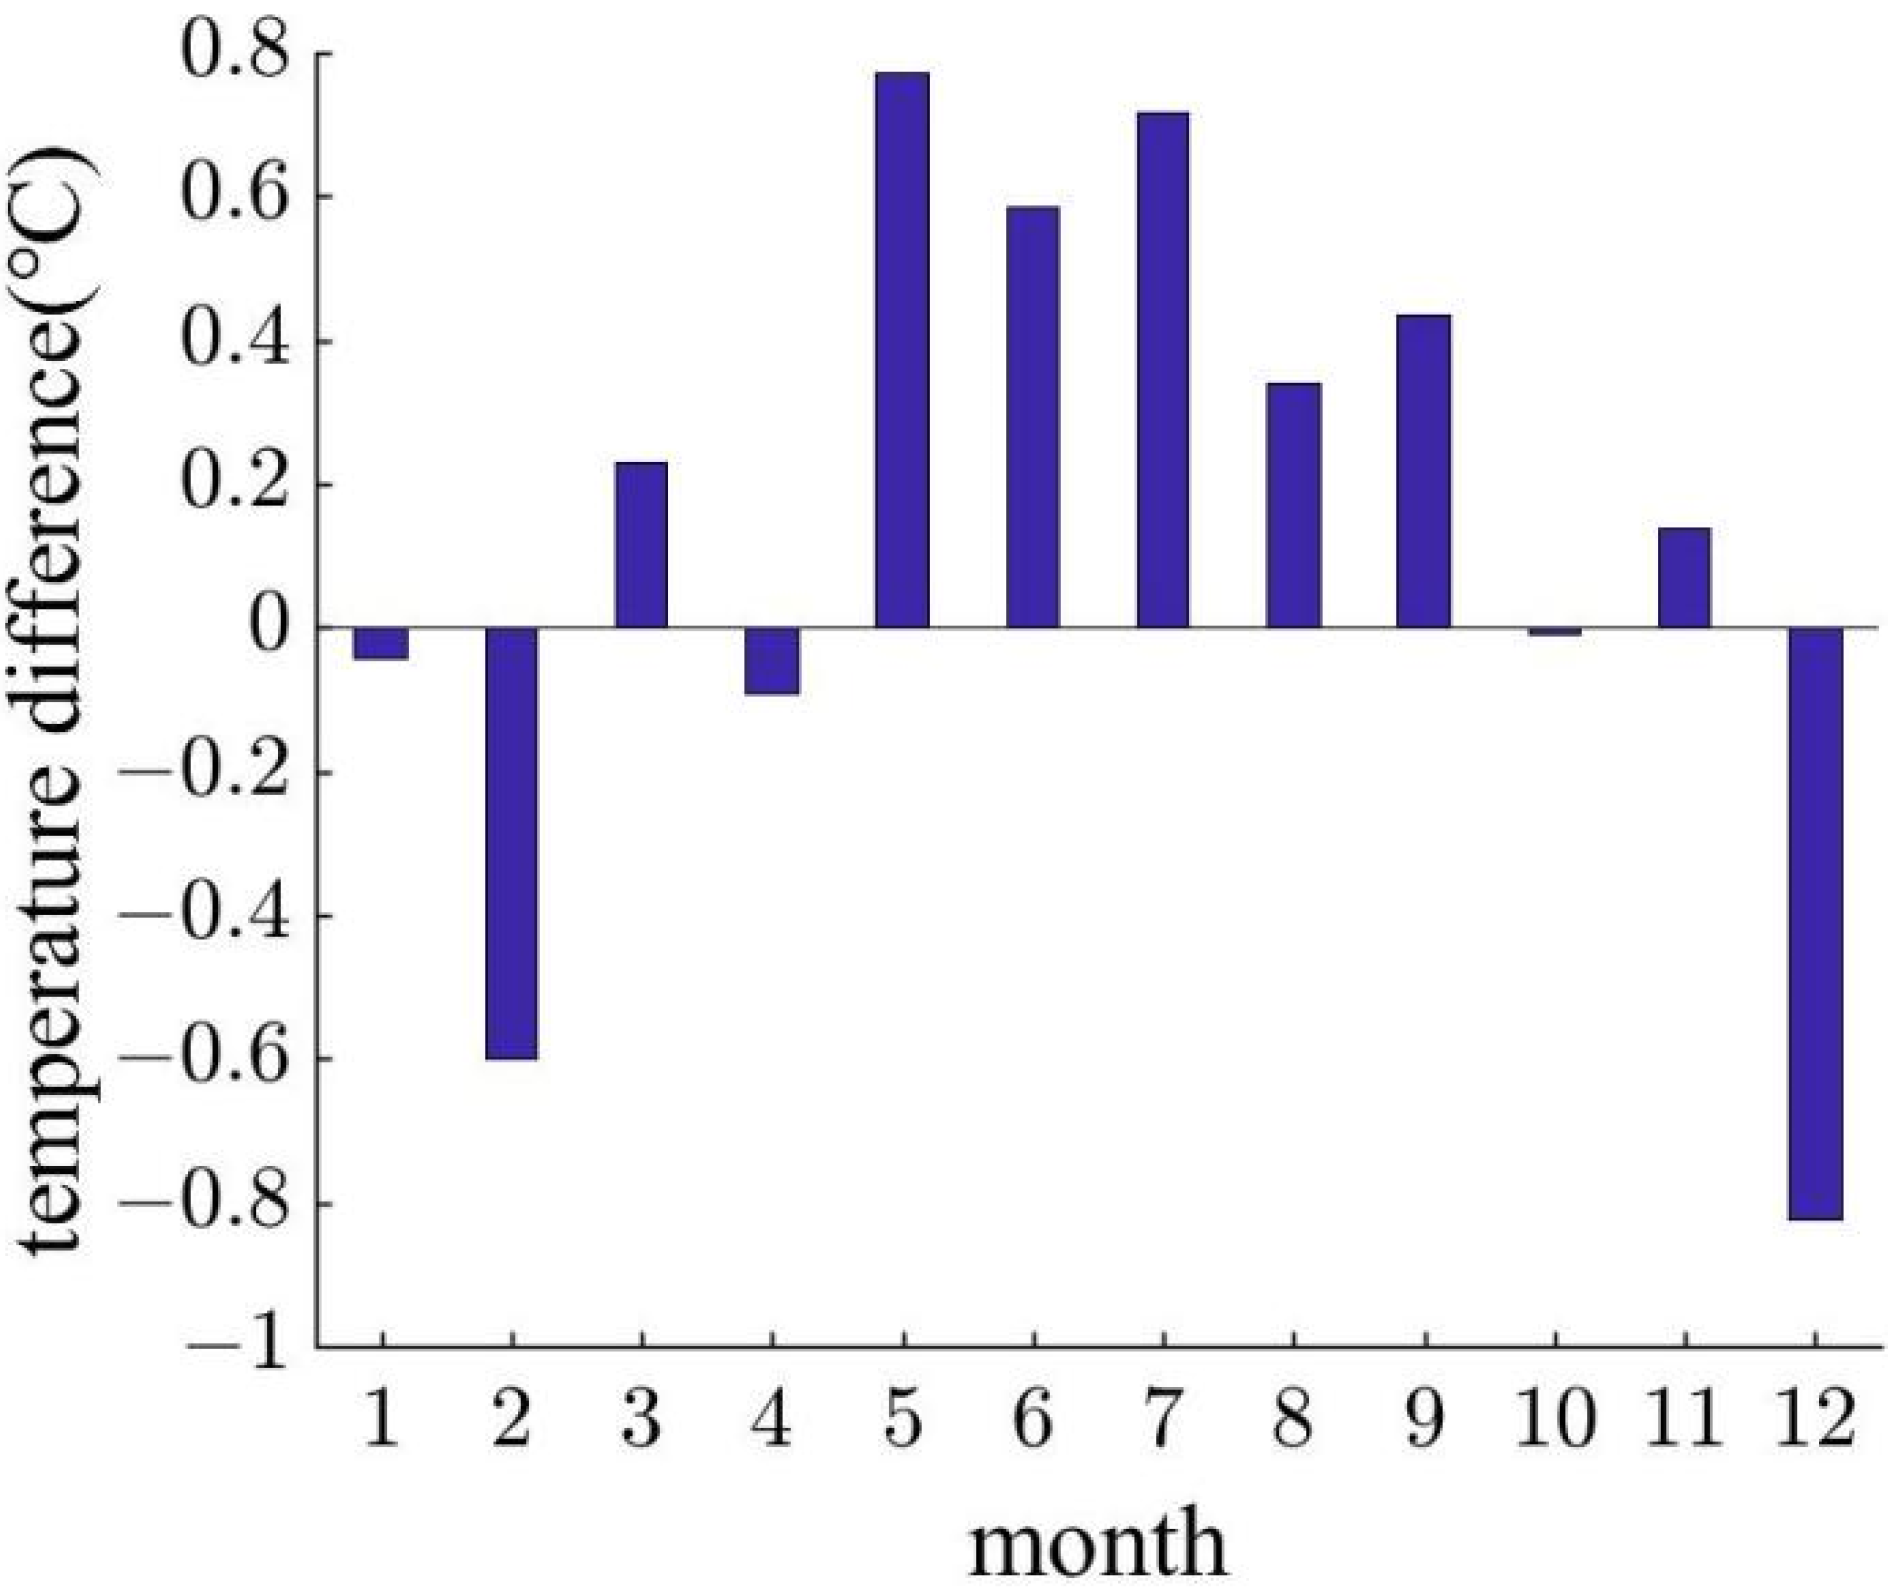
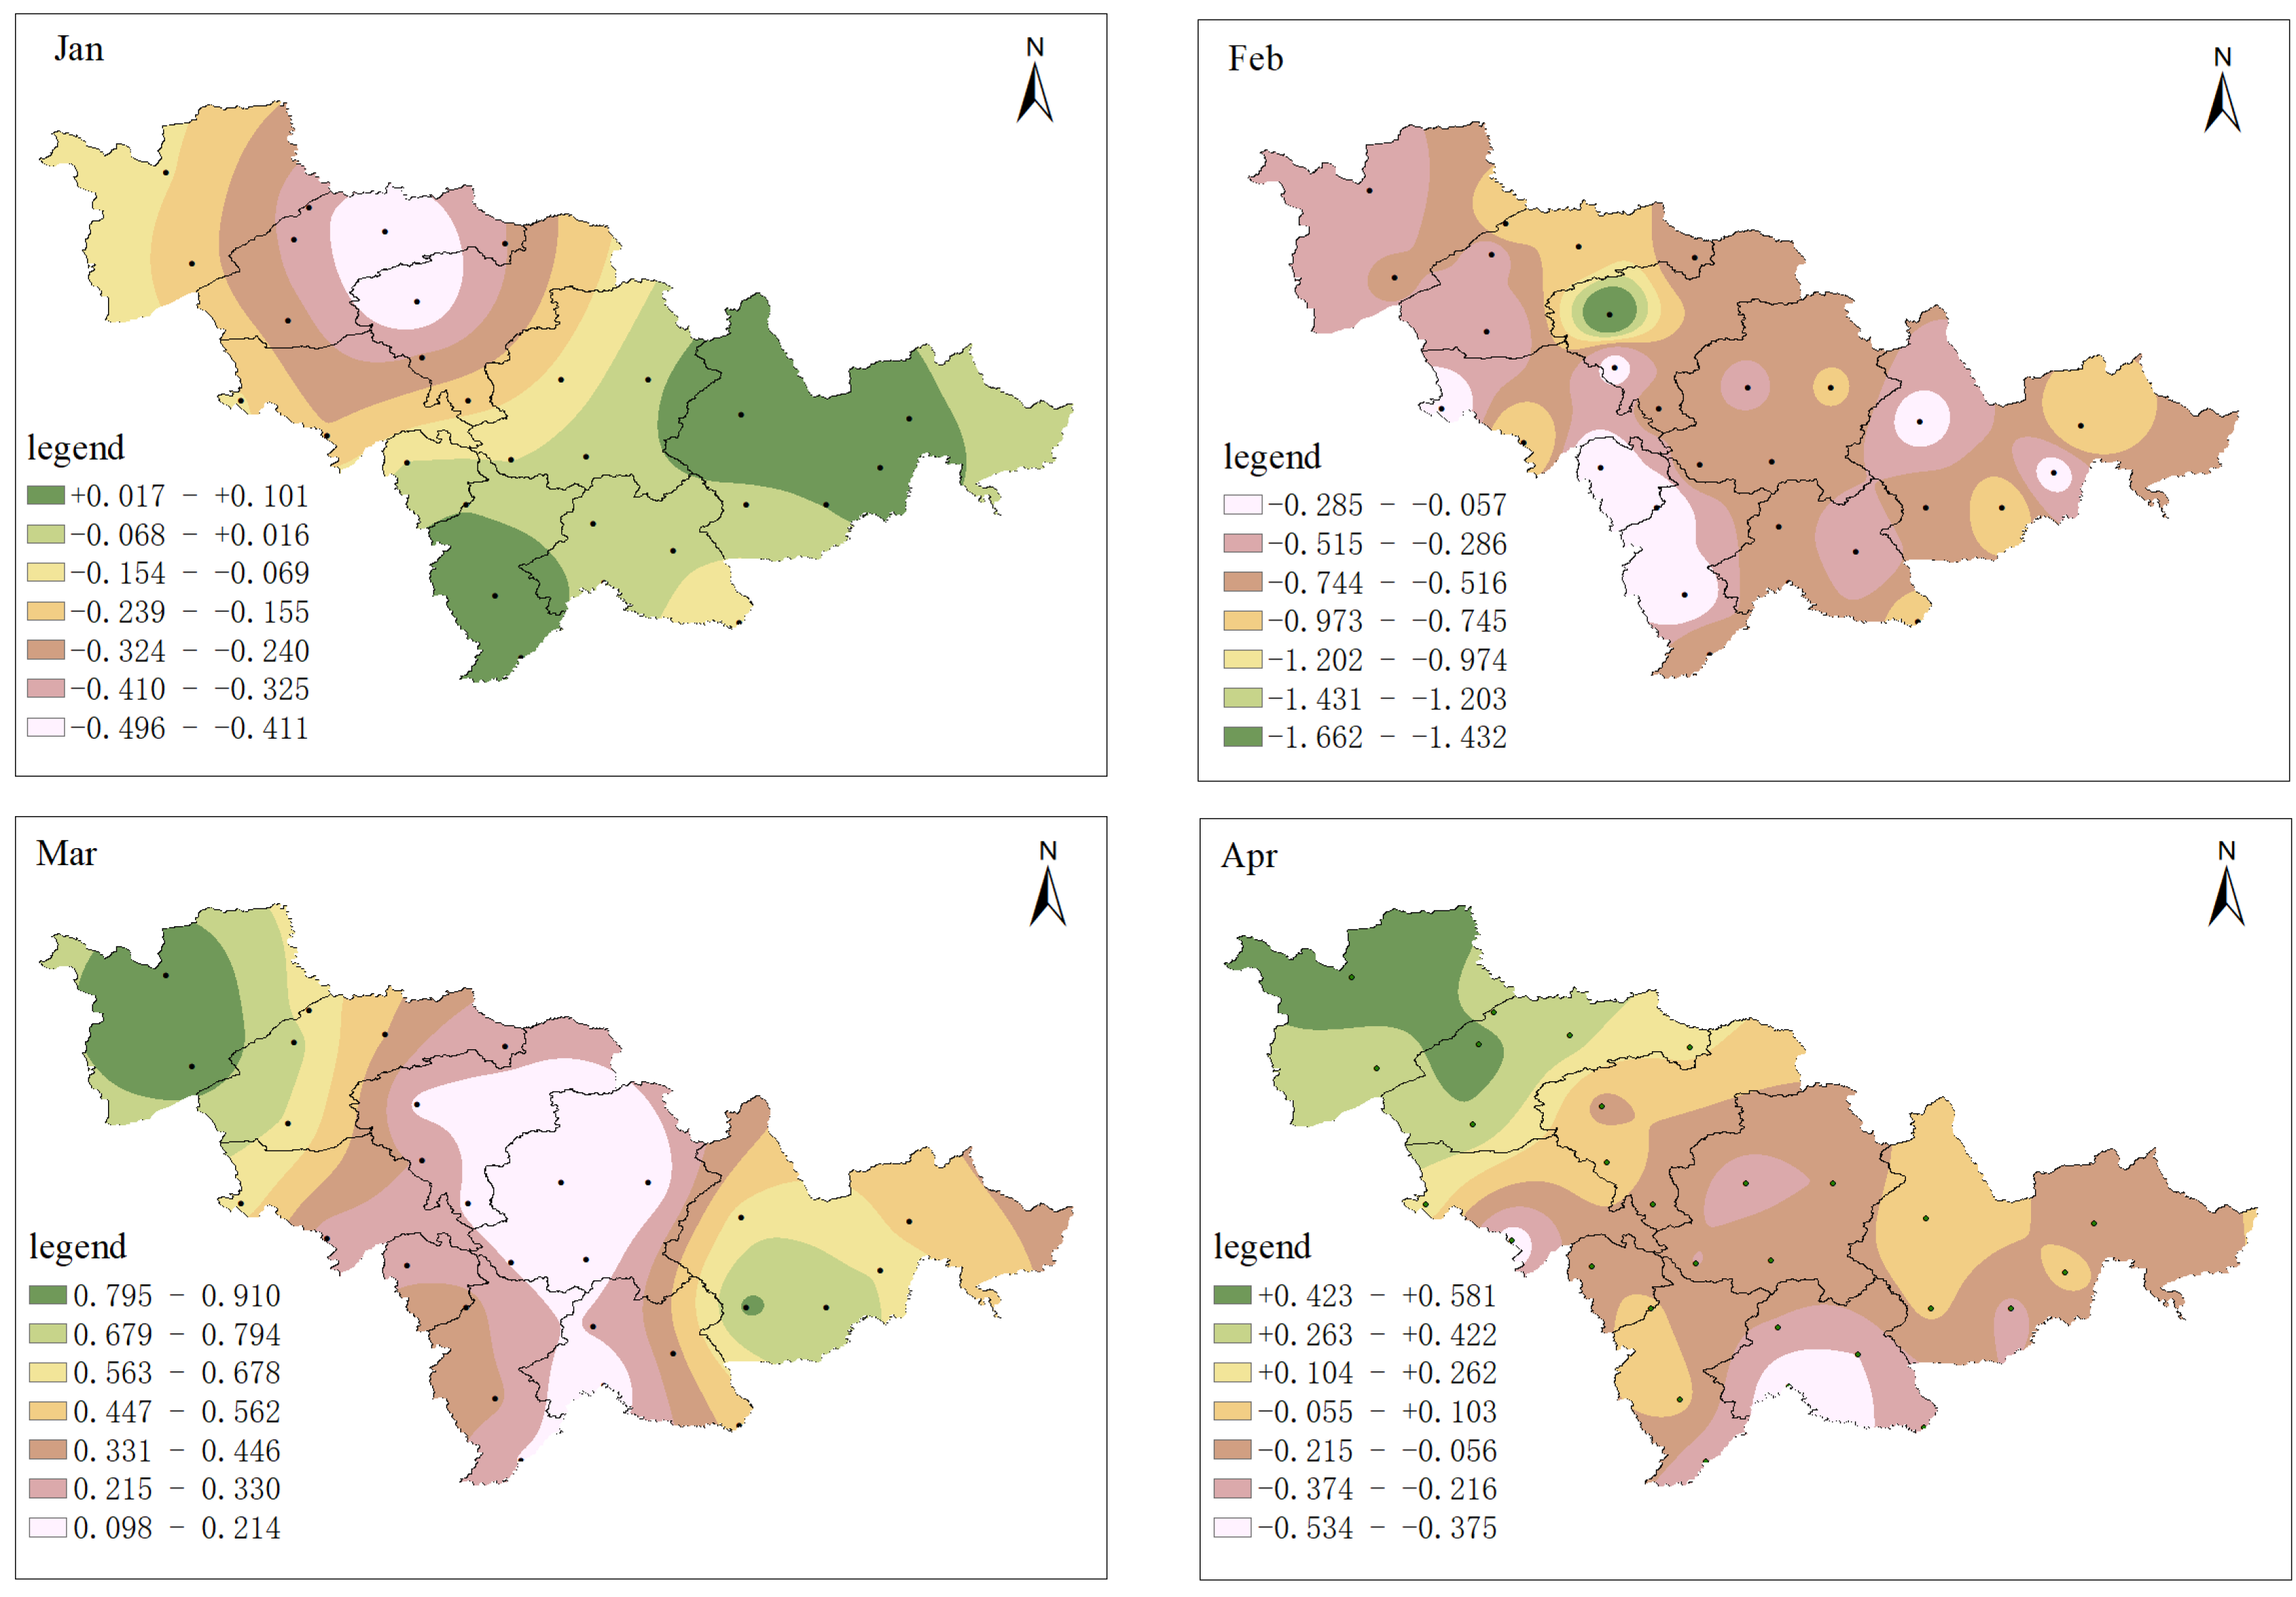
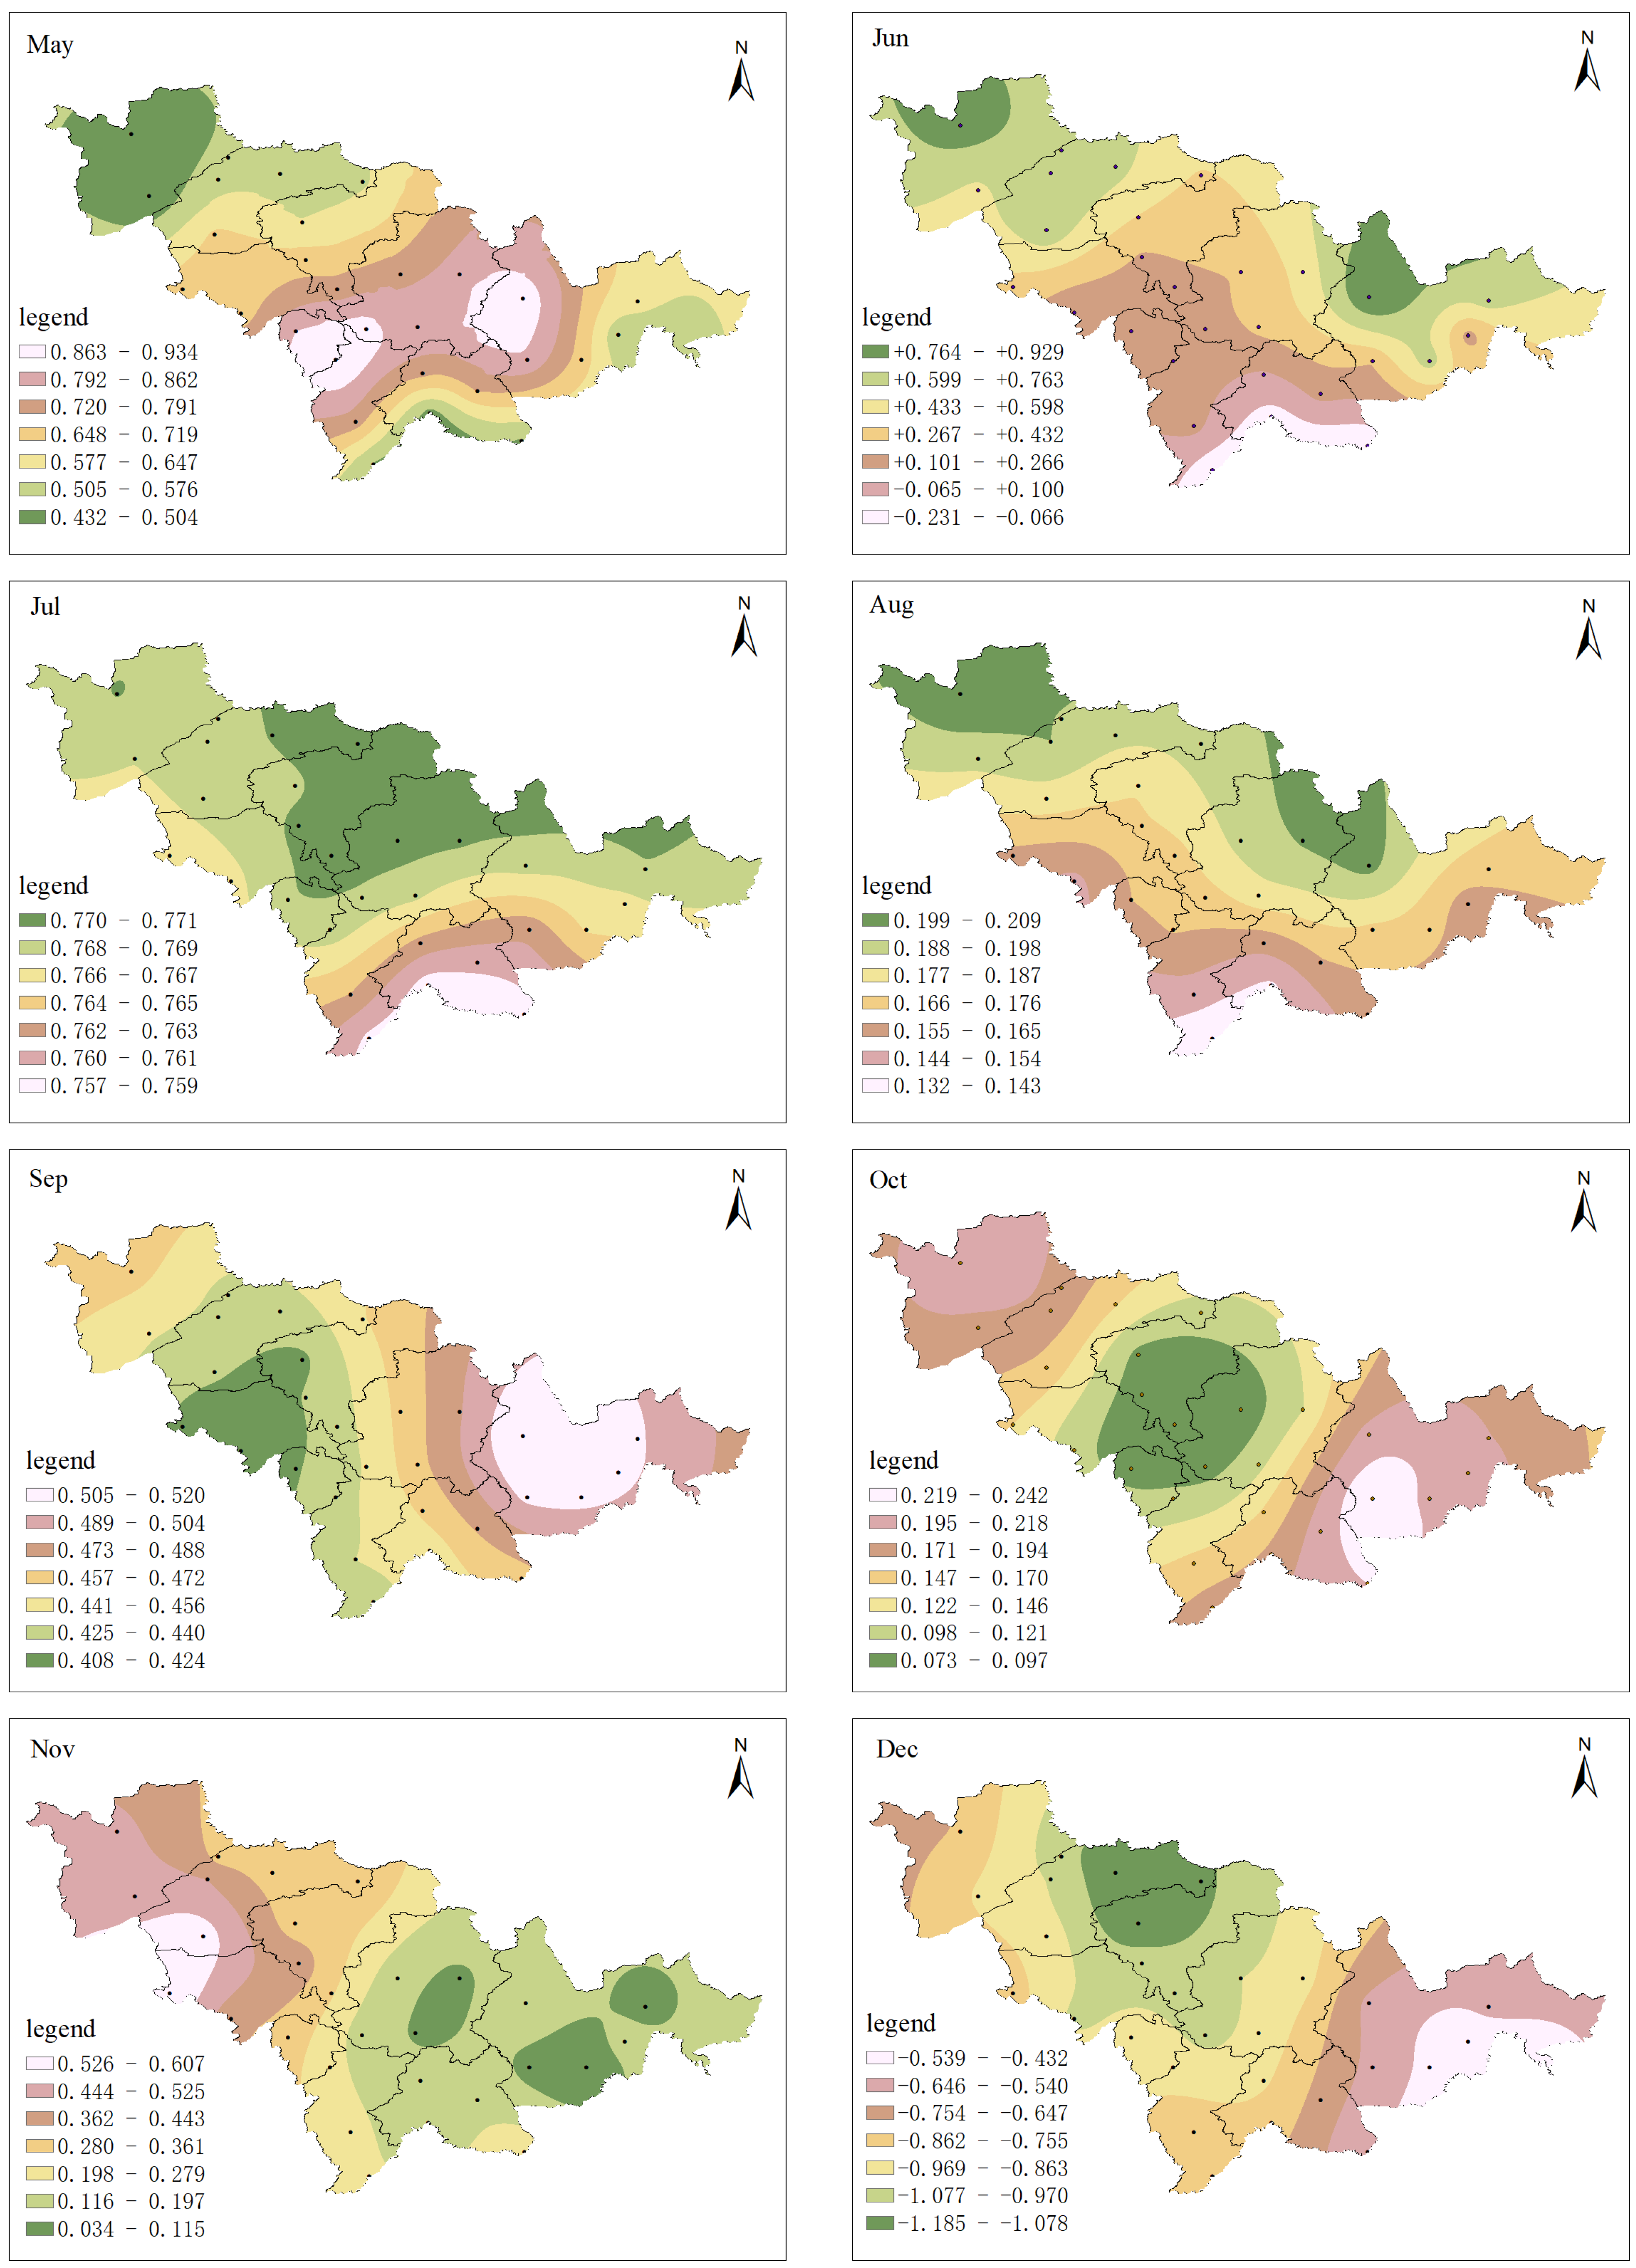
3.1. Variation of Temperature in Long Time Period
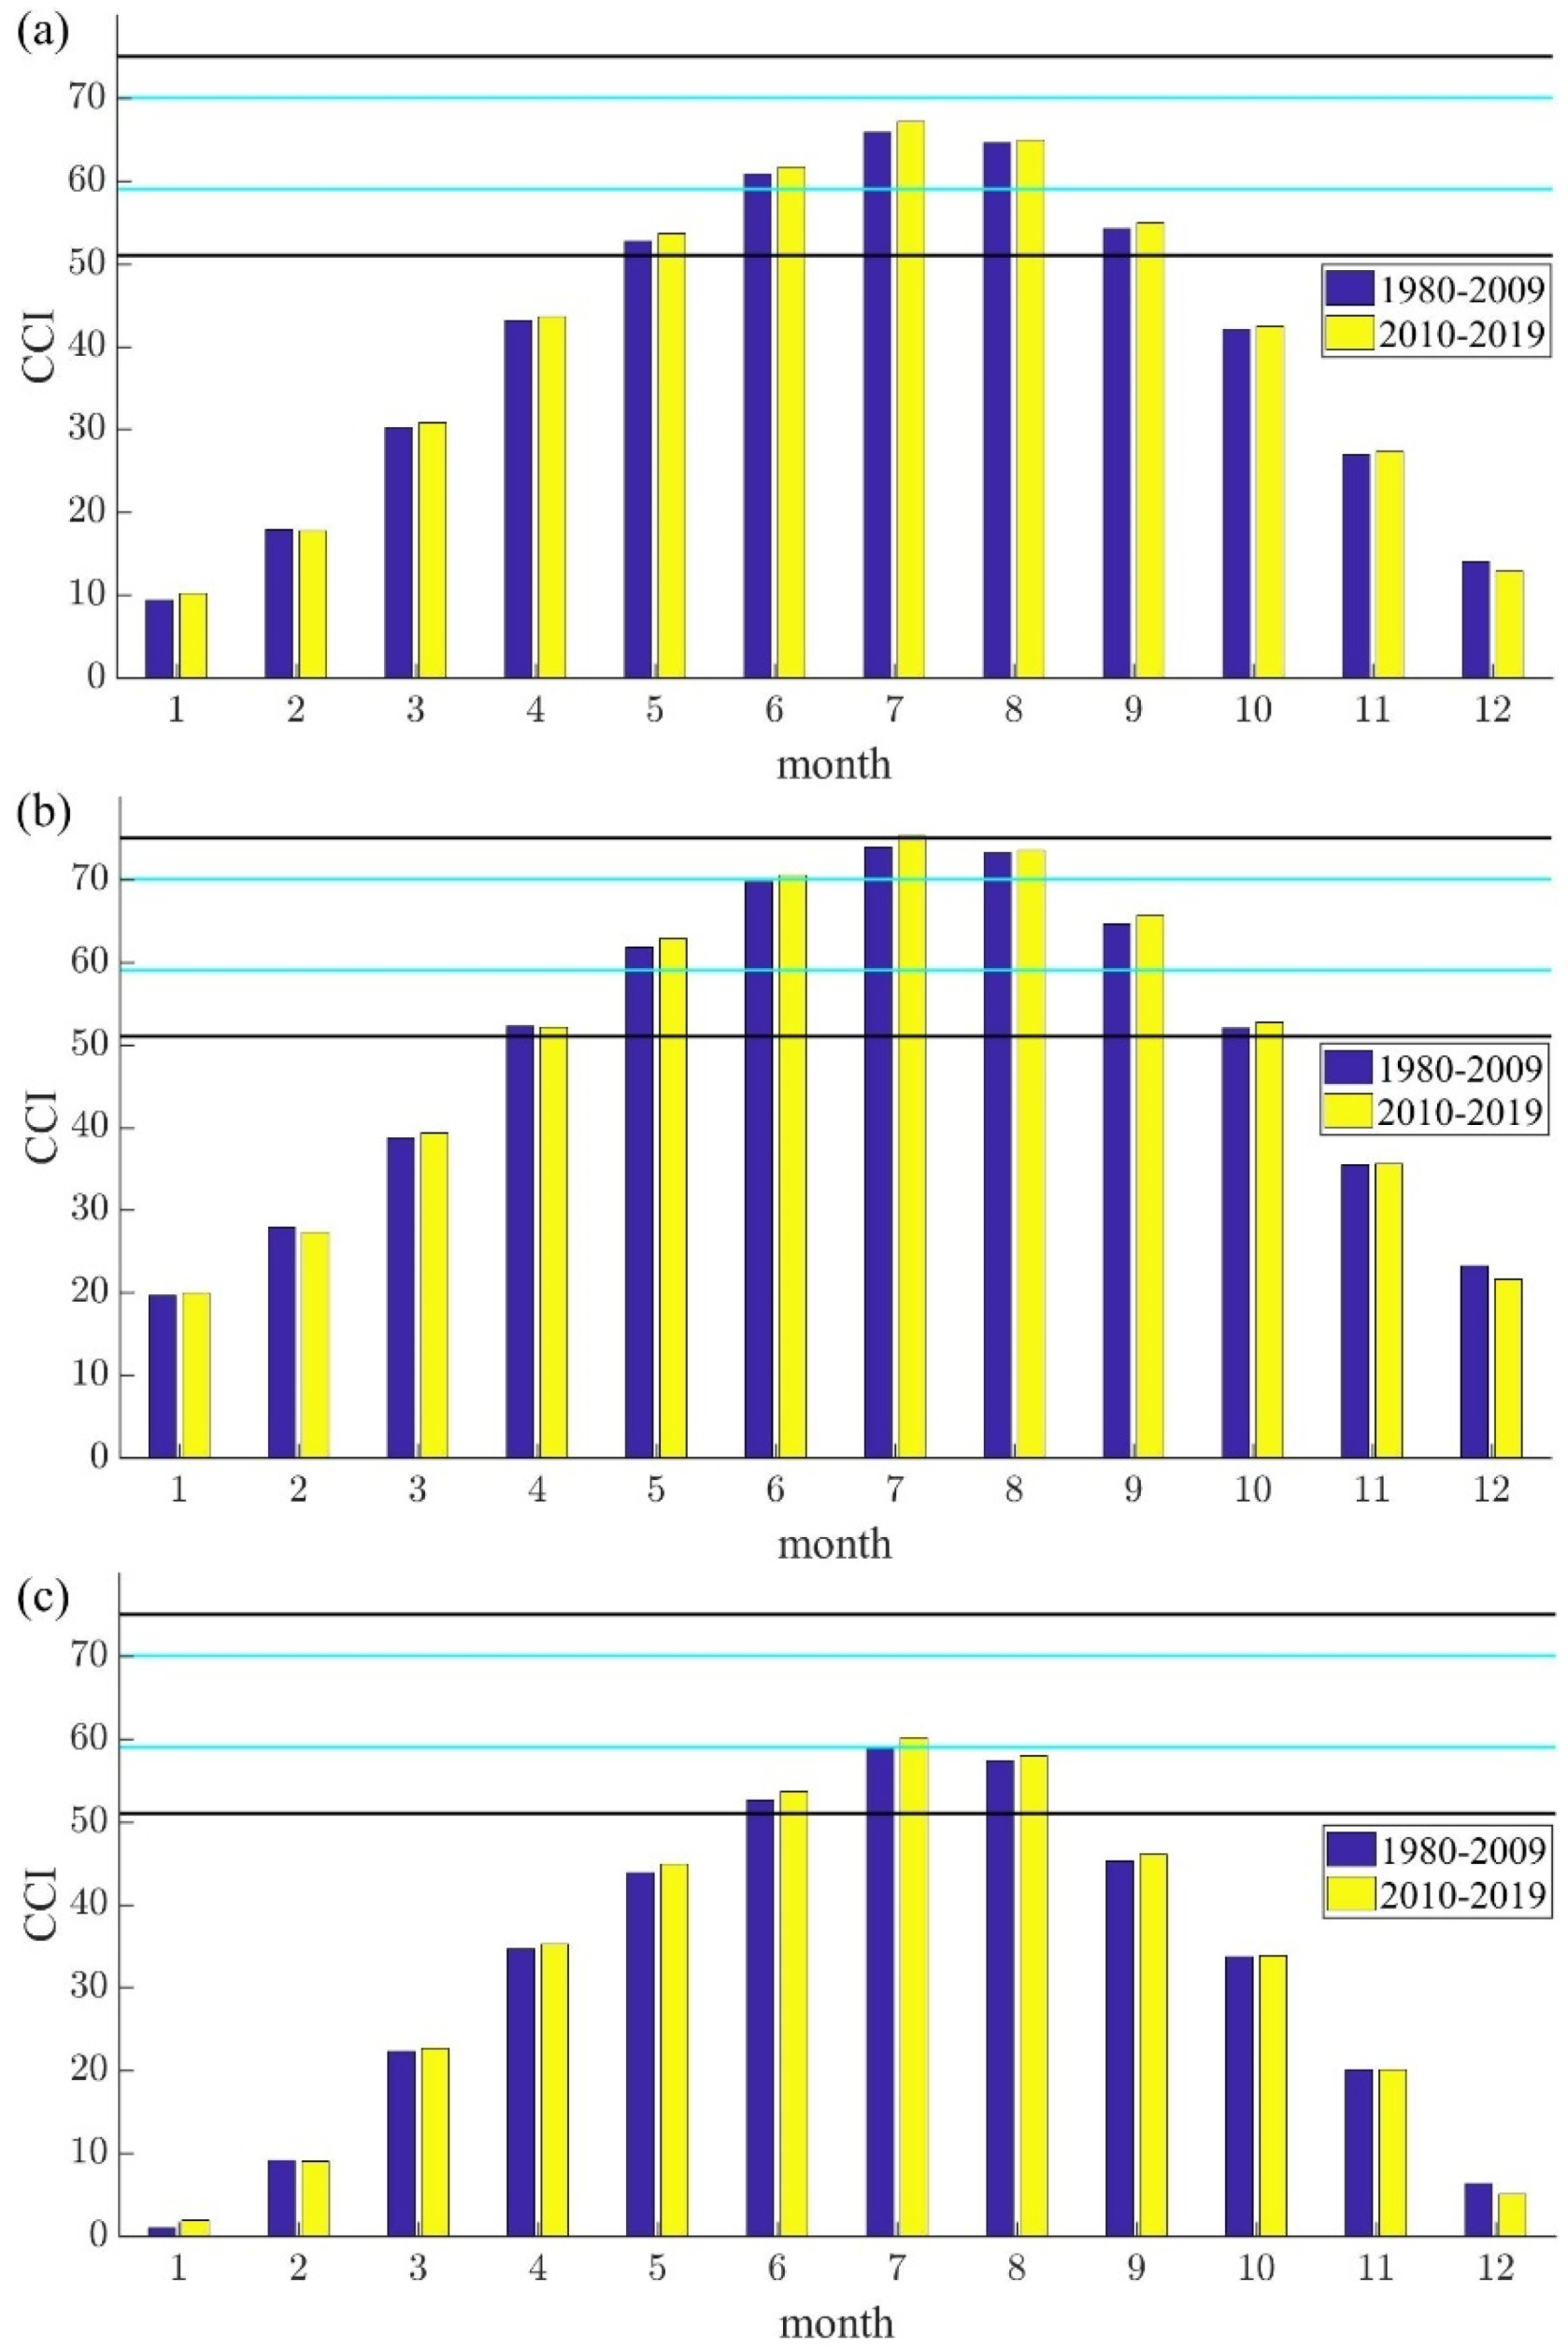
3.2. Statistical Analysis of Climate Comfort Index (CCI)
4. Evaluation and Prediction Model for Ice–Snow Tourism Suitability Index (ISTSI)
4.1. Construction of Evaluation and Prediction Model for ISTSI

| Grade | Average Wind Speed (m/s) | Temperature (°C) | Relative Humidity (%) | CCI | ICL | Precipitation and Strong Wind | S | |
|---|---|---|---|---|---|---|---|---|
| Optimum | UL | 0 | 2 | 60 | 39.5 | 2.1 | Medium snow and below, does not affect travel | 0 |
| LL | 3.3 | −12 | 60 | 15.1 | 3.3 | |||
| Suitable | UL | 3.3 | −12 | 60 | 15.1 | 3.3 | ||
| LL | 5.4 | −16 | 60 | 7.8 | 3.6 | |||
| Not very suitable | UL | 5.4 | −16 | 60 | 7.8 | 3.6 | ||
| LL | 7.9 | −20 | 60 | 0.7 | 3.9 | |||
| Not suitable | UL | 8.0 | −20 | 60 | 0.7 | 3.9 | Heavy snow or above is heavy snow, sleet, or strong wind | −100 |
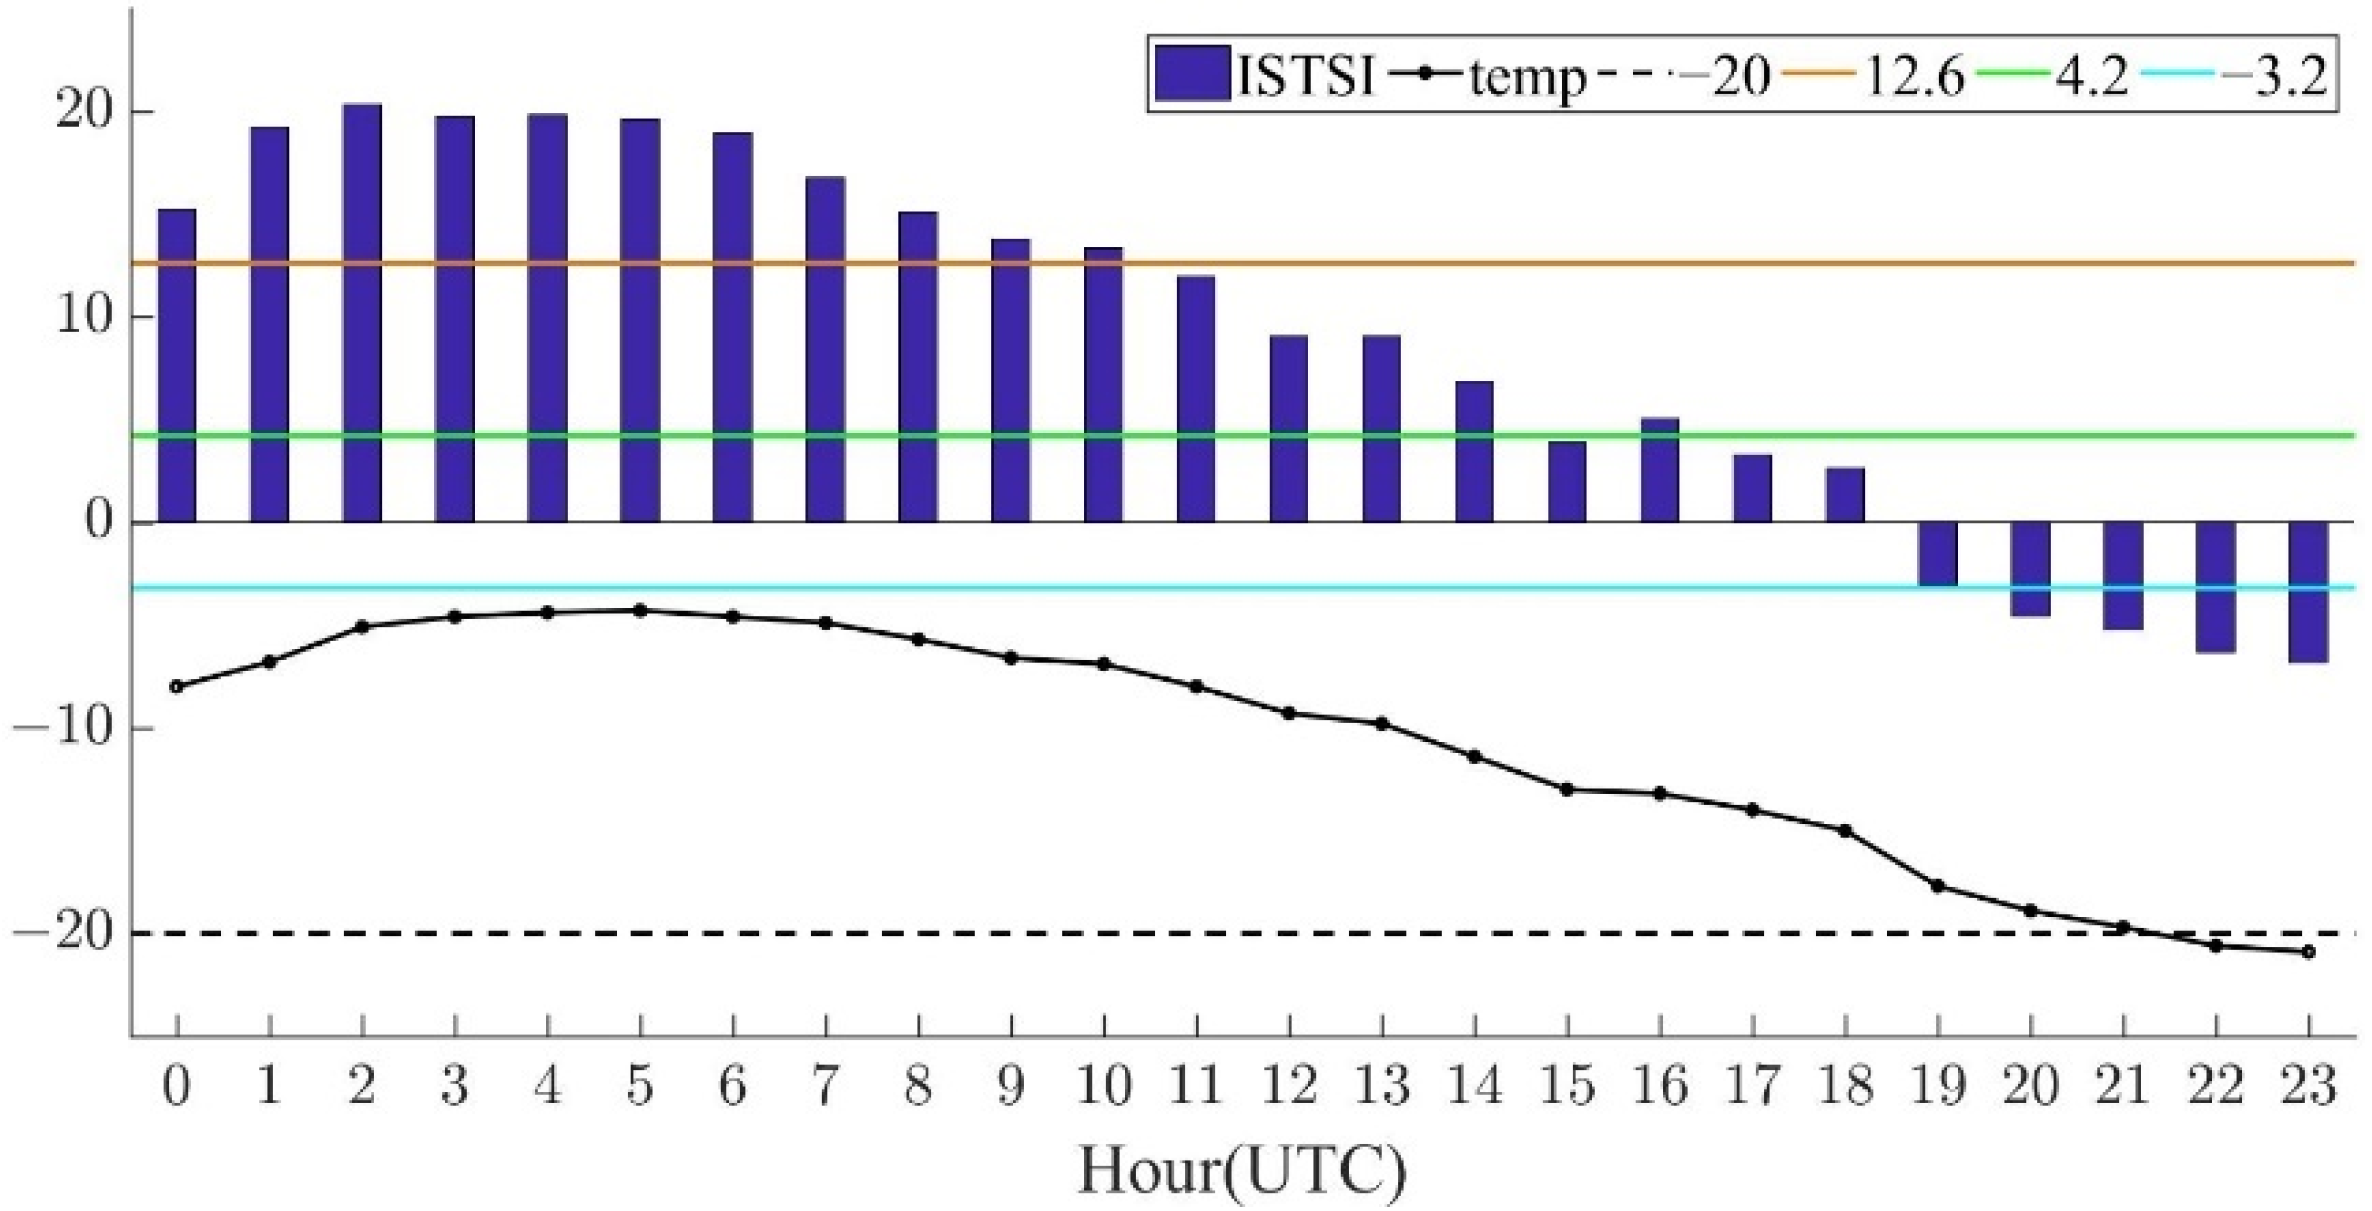
4.2. Case Test
5. Conclusions
6. Discussion
Author Contributions
Funding
Institutional Review Board Statement
Informed Consent Statement
Data Availability Statement
Acknowledgments
Conflicts of Interest
References
- Cetin, M. Climate comfort depending on different altitudes and land use in the urban areas in Kahramanmaras City. Air Qual. Atmos. Health 2020, 13, 991–999. [Google Scholar] [CrossRef]
- Scott, D.; Hall, C.M.; Gossling, S. Global tourism vulnerability to climate change. Ann. Tour. Res. 2019, 77, 49–61. [Google Scholar] [CrossRef]
- De Freitas, C.R.; Scott, D.; McBoyle, G. A second generation climate index for tourism (CIT): Specification and verification. Int. J. Biometeorol. 2008, 52, 399–407. [Google Scholar] [CrossRef]
- Blazejczyk, K.; Epstein, Y.; Jendritzky, G.; Staiger, H.; Tinz, B. Comparison of UTCI to selected thermal indices. Int. J. Biometeorol. 2012, 56, 515–535. [Google Scholar] [CrossRef] [PubMed]
- Gungor, S.; Cetin, M.; Adiguzel, F. Calculation of comfortable thermal conditions for Mersin urban city planning in Turkey. Air Qual. Atmos. Health 2021, 14, 515–522. [Google Scholar] [CrossRef]
- Zeng, D.; Wu, J.; Mu, Y.; Deng, M.; Wei, Y.; Sun, W. Spatial-temporal pattern changes of UTCI in the China-Pakistan economic corridor in recent 40 years. Atmosphere 2020, 11, 858. [Google Scholar] [CrossRef]
- Mölders, N. Outdoor universal thermal comfort index climatology for Alaska. Atmos. Clim. Sci. 2019, 9, 558–582. [Google Scholar] [CrossRef][Green Version]
- Vinogradova, V. Using the universal thermal climate index (UTCI) for the assessment of bioclimatic conditions in Russia. Int. J. Biometeorol. 2021, 65, 1473–1483. [Google Scholar] [CrossRef]
- Junyuan, Z.; Shengjie, W. Spatio-temporal evolution and prediction of tourism comprehensive climate comfort in Henan province, China. Atmosphere 2021, 12, 823. [Google Scholar]
- Michelle, R.; Daniel, S.; Lindsay, M.; Ravidya, B.; Adrian, T.; Roché, M.; Amanda, C. An Inter-comparison of the holiday climate index (HCI: Beach) and the tourism climate index (TCI) to explain Canadian tourism arrivals to the Caribbean. Atmosphere 2020, 11, 412. [Google Scholar]
- Hasanah, N.; Maryetnowati, D.; Edelweis, F.; Indriyani, F.; Nugrahayu, Q. The climate comfort assessment for tourism purposes in Borobudur Temple Indonesia. Heliyon 2020, 6, e05828. [Google Scholar] [CrossRef] [PubMed]
- Houghten, F.C.; Yaglou, C.P. Determining lines of equal comfort. Trans. Am. Soc. Heat. Vent. Eng. 1923, 29, 165–176. [Google Scholar]
- Terjung, W.H. Physiologic climates of the conterminous United States: A bioclimatic classification based on man. Ann. Assoc. Am. Geogr. 1966, 56, 141–179. [Google Scholar] [CrossRef]
- Siple, P.A.; Passel, C.F. Measurements of dry atmospheric cooling in sub-freezing temperatures. Proc. Am. Philos. Soc. 1945, 89, 177–199. [Google Scholar]
- Defreitas, C.R. Human climates of northern China. Atmos. Environ. 1979, 13, 71–77. [Google Scholar] [CrossRef]
- Yu, Z.K.; Sun, G.N.; Luo, Z.W.; Feng, Q. An analysis of climate comfort degree and tourism potential power of cities in Northern China in summer to the north of 40° N. Nat. Resour. J. 2015, 30, 327–339. [Google Scholar]
- Zare, S.; Hasheminejad, N.; Shirvan, H.E.; Hemmatjo, R.; Sarebanzadeh, K.; Ahmadi, S. Comparing universal thermal climate Index (UTCI) with selected thermal indices/environmental parameters during 12 months of the year. Weather Clim. Extreme 2018, 19, 49–57. [Google Scholar] [CrossRef]
- Jing, H. Analysis and application of comfort index. Meteorol. Mon. 2001, 27, 47–51. [Google Scholar]
- Jigang, B.; Yifang, C. Tourism Geography, 3rd ed.; Higher Education Press: Beijing, China, 2012; pp. 125–129. [Google Scholar]
- Yao, X.; Zhang, M.; Zhang, Y.; Xiao, H.; Wang, J. Research on evaluation of climate comfort in northwest China under climate change. Sustainability 2021, 13, 10111. [Google Scholar] [CrossRef]
- Cao, Y.Q.; Gao, L. Regional characteristics of climate comfort in summer in Liaoning during past 30 years. Sci. Geogr. Sin. 2016, 36, 1205–1211. [Google Scholar]
- Noome, K.; Fitchett, J.M. An assessment of the climatic suitability of Afriski Mountain Resort for outdoor tourism using the Tourism Climate Index (TCI). J. Mt. Sci. 2019, 16, 2453–2469. [Google Scholar] [CrossRef]
- Hongqiao, W.; Xiangjun, M.; Zhengfang, W. Temporal and spatial responses of climate comfortable index in Jilin Province. J. Arid. Land Resour. Environ. 2012, 26, 141–148. [Google Scholar]
- Yong, X.; Feng, G.; Doudou, L. Construction of the tourism meteorological index system in Jilin Province. In Proceedings of the 33rd Annual Meeting of China Meteorological Society, Xi’an, China; 2016. [Google Scholar]
- Tian, L.; Xiaoxia, Z.; Yuanyuan, D.; Shaojun, Q. Jilin Province winter tourism meteorological index method study. In Proceedings of the 35th Annual Meeting of China Meteorological Society, Hefei, China, 24–26 October 2018. [Google Scholar]
- Wu, F.; Yang, X.; Shen, Z.; Yi, Z. Long-term trends and spatiotemporal variations of climate comfort in China during 1966–2016. Therm. Sci. 2020, 24, 2445–2453. [Google Scholar] [CrossRef]
- Andi, Y. To Jilin to experience the “drunk beauty” ice and snow. Sino-Foreign Cult. Exch. 2022, 1, 58–60. [Google Scholar]


| CCI | ICL | ||
|---|---|---|---|
| Scope | Sensory Degree | Scope | Appropriate Clothing |
| ≤25 | Extremely cold and uncomfortable | >2.5 | Down jacket or fur garment |
| 26–38 | Cold and most people are uncomfortable | 1.8–2.5 | Casual clothes and thick coats |
| 39–50 | Cool and a few people are uncomfortable | 1.5–1.8 | Traditional winter clothing |
| 51–58 | Cool, most people are comfortable | 1.3–1.5 | Common casual clothes in spring and autumn |
| 59–70 | Warm, the most comfortable | 0.7–1.3 | Shirts and casual clothes |
| 71–75 | Hot and most people are comfortable | 0.5–0.7 | Light summer clothes |
| 76–79 | Stuffy, a few people are uncomfortable | 0.3–0.5 | Short-sleeve open-neck shirt |
| 80–85 | Hot, most people are uncomfortable | 0.1–0.3 | Tropical single clothes |
| >85 | Extremely hot and uncomfortable | <0.1 | Short sleeves, shorts |
| Grade | Sensory Degree | Average Wind Speed (m/s) | Daily Maximum Temperature (°C) | Precipitation |
|---|---|---|---|---|
| 1 | Optimum | ≤3.3 | −12–−2 | sunny or cloudy weather |
| 2 | Suitable | 3.3–5.4 | −16–−12 | light snow |
| 3 | not very suitable | 5.4–7.9 | −20–−16 | moderate snow or sleet |
| 4 | not suitable | ≥8.0 | <−20 | heavy snow and above |
| Grade | Suitable Degree | Appropriate Clothing |
|---|---|---|
| >37.4 | Not suitable | Traditional winter clothing |
| 12.6–37.4 | Optimum | Casual clothes and thick coats |
| 4.2–12.6 | Suitable | Down jacket or fur garment |
| −3.2–4.2 | Not very suitable | Down jacket or fur garment |
| <−3.2 | Not suitable | Down jacket or fur garment |
| Time (UTC) | Yongji | Donggang | Time (UTC) | Yongji | Donggang | ||||
|---|---|---|---|---|---|---|---|---|---|
| Wind Speed m/s | Relative Humidity % | Wind Speed m/s | Relative Humidity % | Wind Speed m/s | Relative Humidity % | Wind Speed m/s | Relative Humidity % | ||
| 0:00 | 1.2 | 75 | 2.2 | 76 | 12:00 | 0.8 | 92 | 3.2 | 89 |
| 1:00 | 2.7 | 78 | 1.7 | 69 | 13:00 | 0.8 | 92 | 2.3 | 87 |
| 2:00 | 1.3 | 100 | 3.6 | 67 | 14:00 | 0.2 | 92 | 2.2 | 88 |
| 3:00 | 2.0 | 100 | 4.9 | 69 | 15:00 | 0.3 | 89 | 2.1 | 89 |
| 4:00 | 4.0 | 99 | 5.3 | 69 | 16:00 | 0.4 | 88 | 0.8 | 88 |
| 5:00 | 2.4 | 97 | 4.5 | 74 | 17:00 | 0.8 | 89 | 1.2 | 87 |
| 6:00 | 2.3 | 93 | 3.5 | 79 | 18:00 | 0.8 | 87 | 0.7 | 87 |
| 7:00 | 2.2 | 86 | 3.9 | 86 | 19:00 | 0.4 | 86 | 1.3 | 87 |
| 8:00 | 1.2 | 84 | 2.5 | 94 | 20:00 | 0.8 | 86 | 0.9 | 87 |
| 9:00 | 0.8 | 83 | 2.8 | 91 | 21:00 | 0.5 | 84 | 0.9 | 85 |
| 10:00 | 0.4 | 89 | 2.3 | 87 | 22:00 | 0.9 | 85 | 0.8 | 84 |
| 11:00 | 0.8 | 94 | 3.0 | 89 | 23:00 | 1.1 | 85 | 0.8 | 89 |
Publisher’s Note: MDPI stays neutral with regard to jurisdictional claims in published maps and institutional affiliations. |
© 2022 by the authors. Licensee MDPI, Basel, Switzerland. This article is an open access article distributed under the terms and conditions of the Creative Commons Attribution (CC BY) license (https://creativecommons.org/licenses/by/4.0/).
Share and Cite
Yu, J.; Cai, W.; Zhou, M. Evaluation and Prediction Model for Ice–Snow Tourism Suitability under Climate Warming. Atmosphere 2022, 13, 1806. https://doi.org/10.3390/atmos13111806
Yu J, Cai W, Zhou M. Evaluation and Prediction Model for Ice–Snow Tourism Suitability under Climate Warming. Atmosphere. 2022; 13(11):1806. https://doi.org/10.3390/atmos13111806
Chicago/Turabian StyleYu, Jie, Weiying Cai, and Miaolei Zhou. 2022. "Evaluation and Prediction Model for Ice–Snow Tourism Suitability under Climate Warming" Atmosphere 13, no. 11: 1806. https://doi.org/10.3390/atmos13111806
APA StyleYu, J., Cai, W., & Zhou, M. (2022). Evaluation and Prediction Model for Ice–Snow Tourism Suitability under Climate Warming. Atmosphere, 13(11), 1806. https://doi.org/10.3390/atmos13111806