Abstract
Black carbon in snow (BCS) has a significant impact on global climate and is an important component of Earth system modeling. Here, we provide a comprehensive evaluation of BCS simulations in the Coupled Model Intercomparison Project Phase 6 (CMIP6) and its radiative forcing on a global scale. Overall, the multi-model mean generally captures the characteristics of BCS spatial patterns, with maximum concentrations in East Asia and the Tibetan Plateau (~120 ng·g−1), and the lowest in Antarctica (~0.05 ng·g−1). The BCS concentrations in all CMIP6 multi-model mean and individual models generally exhibit a temporally increasing trend globally, with particularly large increases after the 1940s. In terms of seasonal cycles, individual models are generally consistent in most regions. Globally, BCS concentrations are highest around January and lowest in September. The albedo reduction in the Tibetan Plateau and East Asia simulated by the CMIP6 multi-model mean reached ~0.06 in 2014 and may influence climate more than expected.
1. Introduction
Snow has a particularly high albedo and contributes to Earth’s climate regulation [1,2]. Black carbon (BC), produced by incomplete combustion of fossil fuels, biofuel, and biomass, is considered a strong short-lived climate forcer [3,4,5] because it darkens snow surfaces, thereby reducing albedo and triggering positive feedback through snow melting [1,4,6,7]. Thus, BC influences hydrography through promoting iceberg melting and surface runoff [8,9,10].
The earliest studies of BC in snow (herein BCS) were conducted in the 1960s–1980s, mainly in polar regions, and many snow samples containing BC particles were collected [11,12,13]. During 1983–1984, Clarke et al. [14] collected snow samples from most Arctic regions, with the project continued by Doherty et al. [15] in 2010. Collections were extended to Antarctica after 1985 [16]. The BCS at mid-latitudes also demands attention because of the heavy anthropogenic activity there, and many field campaigns have been undertaken, including the drilling of ice cores and snow collection in North America [17], Europe [18], East Asia [19,20], and the Tibetan Plateau [21,22]. Such campaigns have provided many BCS observations, but their temporospatial distribution is still limited by sampling conditions [12,13].
Modeling can overcome this lack of coverage through simulating BCS over regional and global domains. For example, Yasunari et al. [23] applied the GEOS-5 model with aerosol tracers and a state-of-the-art snow-darkening module (GOSWIM) to study the snow-darkening effect on climate in the spring snowmelt season. Flanner et al. [8] used the Snow, Ice, and Aerosol Radiative (SNICAR) model coupled with a general circulation model to assess climate forcing and response related to BCS concentrations in the Northern Hemisphere.
The Coupled Model Intercomparison Project (CMIP) of the World Climate Research Programme, which is currently the most popular modeling product, employs a protocol that systematically defines model simulations and provides numerous useful model outputs in standardized formats [24,25]. In recent decades, the project has evolved through five phases to become a major international multi-model research activity [26,27,28]. Its simulations have supported many climate-change studies as well as national and international assessments of climate change [29]. For example, Lee et al. [30] evaluated BCS and its albedo forcing with eight models in CMIP Phase 5 (CMIP5) against Arctic observations, and Allen et al. [31] evaluated the vertical distribution of BC aerosols using CMIP5 model outputs. The latest Phase 6 (CMIP6) is now receiving attention, with as many as 112 models taking part including many with outputs supporting studies of global climate forcing over the next 5–10 years [29,32,33]. For example, Zhao et al. [34] provided a comprehensive evaluation of mineral dust, which also comprises strong light-absorbing particles, including its global emission, deposition, burden, and optical depth. However, as an important climate forcer, BCS simulated by CMIP6 models receives little attention. More than 30 models in CMIP6 provide simulations for BC aerosol, with only 9 including BCS [25]. The Intergovernmental Panel on Climate Change Sixth Assessment Report (AR6) just provides assessments of BC in the atmosphere and ignores BC in snow [29].
Here we provide a comprehensive evaluation of BCS simulations in CMIP6 on a global scale, including induced radiative forcing (RF). The manuscript is organized as follows. Datasets and methods are described in Section 2, and the results are presented in Section 3. A discussion of radiative forcing caused by BCS is given in Section 4. Finally, the conclusions are provided in Section 5.
2. Data and Methods
2.1. CMIP6 Models and Simulations
At the time of this study, there were nine CMIP6 models simulating BCS, and only seven Earth System models (ESMs) providing historical simulations of interest (Table 1).
The analysis considered the monthly global mass of snow (snw) and the BC it contained (sootsn) over the period 1850–2014 from CMIP6 historical experiments (https://esgf-node.llnl.gov/projects/cmip6/; accessed on 1 May 2022). The used BCS mass concentration was calculated as sootsn/snw, and the seven ESM simulations were adjusted to a unified resolution of 1.875° × 2.5°.
Based on the BCS geographical distribution and its typical concentrations [12,13,15], global snow-covered land areas were divided into 11 study regions (A–K) as follows and shown in Figure 1. Arctic and Subarctic regions: (A) European Arctic (EArc; 60°–90° N, 0°–70° E); (B) Russian Arctic (RArc; 60°–90° N, 70°–180° E); (C) Alaska (50°–90° N, 140°–180° W); (D) Canadian Arctic (CArc; 60°–90° N, 75°–140° W); and (E) Greenland (Gre; 60°–90° N, 0°–75° W). Northern Hemisphere mid-latitudes: (F) Europe (30°–60° N, 10°W–60° E); (G) East Asia without the Tibetan Plateau (EA; 10°–55° N, 60°–150° E); (H) central North America (CA; 30°–60° N, 60°–140° W); and (I) the Tibetan Plateau (TP; 20°–40° N, 70°–105° E). Southern Hemisphere: (J) mid-latitude Andes (0°–60° S, 30°–90° W); and (K) Antarctica (Ant; 60°–90° S, 180° W–180° E). Properties of the snow cover vary from region to region, which have non-negligible impact on the distribution of BCS. For example, in the mountain regions of Europe, snow cover trends are characterized by large regional and altitudinal variations and significantly retreat in around April [35,36]. In North America, snow cover has increased in the fall and decreased in the spring [36]. In China, snow cover also shows strong regional variations, and accumulates around October [37].
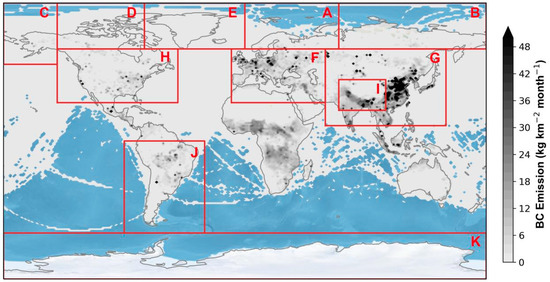
Figure 1.
Global BC emission rates averaged over 1980–2014, and regional groupings.

Table 1.
Model outputs used in this study.
Table 1.
Model outputs used in this study.
| Model | Institution | Experiment | Variables | Resolution | Reference |
|---|---|---|---|---|---|
| CESM2 | NCAR a | historical | Sootsn; Snw | 0.9375° × 1.25° | [38] |
| CESM2-FV2 | NCAR | historical | Sootsn; Snw | 1.875° × 2.5° | [38] |
| CESM2-WACCM | NCAR | historical | Sootsn; Snw | 0.9375° × 1.25° | [39] |
| CESM2-WACCM-FV2 | NCAR | historical | Sootsn; Snw | 1.875° × 2.5° | [38] |
| NorESM2-LM | NCC b | historical | Sootsn; Snw | 1.875° × 2.5° | [40] |
| NorESM2-MM | NCC | historical | Sootsn; Snw | 0.9375° × 1.25° | [40] |
| TaiESM1 | AS-RCEC c | historical | Sootsn; Snw | 0.9375° × 1.25° | [41] |
a National Center for Atmospheric Research, Climate and Global Dynamics Laboratory, 1850 Table Mesa Drive, Boulder, CO 80305, USA; b NorESM Climate Modeling Consortium consisting of CICERO (Center for International Climate and Environmental Research, Oslo 0349, Norway), MET-Norway (Norwegian Meteorological Institute, Oslo 0313, Norway), NERSC (Nansen Environmental and Remote Sensing Center, Bergen 5006, Norway), NILU (Norwegian Institute for Air Research, Kjeller 2027, Norway), UiB (University of Bergen, Bergen 5007, Norway), UiO (University of Oslo, Oslo 0313, Norway) and UNI (Uni Research, Bergen 5008, Norway), Norway. Mailing address: NCC, c/o MET-Norway, Henrik Mohns plass 1, Oslo 0313, Norway; c Research Center for Environmental Changes, Academia Sinica, Nankang, Taipei 11529, Taiwan.
2.2. BC Emissions
To elucidate the spatial heterogeneity of BCS, total BC emissions from 73 sources were obtained from the global BC emission inventory of Peking University, China, at 0.1° × 0.1° spatial and monthly temporal resolutions for the period 1980–2014 (http://inventory.pku.edu.cn/home.html; accessed on 1 May 2022).
2.3. Calculation of BCS RF
Snow albedo reduction (AR) and RF caused by CMIP6-simulated BCS were estimated to assess the influence of CMIP6 BCS on snow properties and regional/global climate. AR was calculated using the SNICAR model [8], which is a commonly used snow radiative-transfer model [42,43]. A semi-infinite snowpack was assumed with a snow grain size of 1000 μm, representing old snow conditions, consistent with previous studies [44,45]. RF was calculated by multiplying the all-sky snow AR by the incident solar radiance provided by Modern-Era Retrospective Analysis for Research and Applications, version 2 (MERRA-2) datasets.
3. Results
3.1. BCS Spatial Distribution
The global distribution of multi-model mean BCS concentrations averaged over the period 1980–2014 is shown in Figure 2a, the mean concentrations for the 11 regions and globally are shown in Figure 2c–g, and the standard deviations between the results of the seven individual models are presented in Figure 2b.
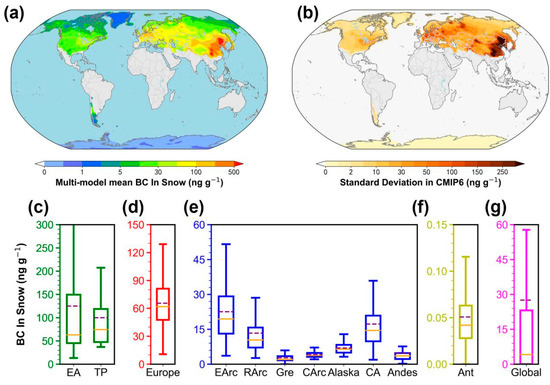
Figure 2.
(a) Multi-model mean BC concentrations in snow (BCS) averaged over 1980–2014. (b) Inter-model standard deviation of BCS concentrations for the seven individual-model outputs, 1980–2014. (c–g) Statistics for multi-model mean regional and global BCS concentrations with mean values (purple dashed lines) and median values (orange solid lines).
On a global scale, there is significant spatial heterogeneity in multi-model mean BCS concentrations (Figure 2a), with high concentrations clustered at mid-latitude regions and lower concentrations at the poles, as described previously [12]. The highest concentrations occur in East Asia at mid-latitudes, with multi-model mean levels of ~30–>500 ng·g−1 (average ~120 ng·g−1), likely due to high BC emissions from China and South Asian regions such as India over recent decades (Figure 1) [12,46]. The spatial heterogeneity of BCS concentration is also most pronounced in this region, with concentrations being largely >300 ng·g−1 in eastern China, but <60 ng·g−1 over more than half of the region. BCS concentrations are relatively low in the mid-latitude regions of the Tibetan Plateau and Europe, with multi-model mean concentrations of 30–200 and 10–130 ng·g−1, respectively, corresponding to relatively low local BC emissions (Figure 1). The European and Russian Arctic regions have BCS concentrations of ~3–50 and ~3–30 ng·g−1, respectively, comparable with or even higher than concentrations in the mid-latitude regions of central North America and the Andes, even though the former regions have much lower local BC emissions. The higher BCS concentrations in Europe and the Russian Arctic are likely derived from BC transport from East Asia [15]. BCS concentrations in central North America range from ~3 to ~40 ng·g−1 (average 20 ng·g−1), most likely arising from local BC emissions as in East Asia and Europe. The situation is similar in the Andes and the three western Arctic regions (Greenland, Canadian Arctic, and Alaska), with BCS concentrations generally being relatively low at several ng·g−1. BCS concentrations were lowest in Antarctica (multi-model mean ~0.05 ng·g−1), where there is little local BC emission or transport (Figure 1) [4].
Overall, the multi-model mean capture the major characteristics of BCS spatial patterns well, consistent with the results of other models [47,48,49] and confirming the contrast between high BCS concentrations at mid-latitudes and lower concentrations at the poles. However, inter-model variations (indicated by standard deviations) are significant (Figure 2b), especially in regions such as East Asia and Europe which have high BCS concentrations and standard deviations of ~200 ng·g−1. Thus, there may be significant differences between the BCS concentrations estimated by the seven individual models.
3.2. Temporal Trends
Temporal trends in global and regional multi-model mean and individual-model BCS concentrations from preindustrial times to the present day (1850–2014) are shown in Figure 3a–l, and changes in average concentrations in modern times (1980–2014) relative to the preindustrial period (1850–1900) are shown in Figure 4.
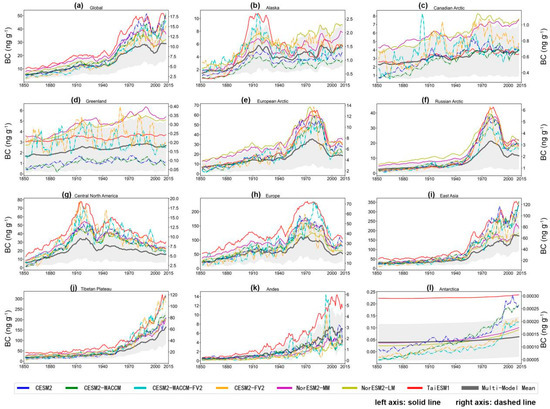
Figure 3.
Temporal trends (1850–2014) in yearly BC concentrations in snow (BCS) from multi-model mean and individual models, globally (a) and regionally (b–l). Gray lines represent multi-model mean BCS; other colors represent individual model results. The inter-model standard deviation is shown by gray shading. Data were processed with five-point smoothing. Values for solid lines are on the left axis and those for dashed lines on the right.
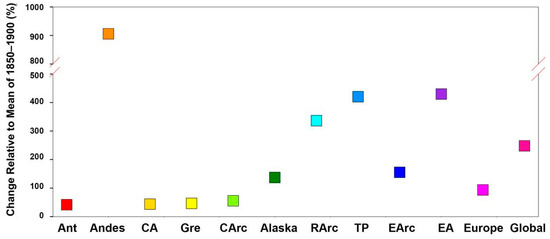
Figure 4.
Relative changes in multi-model mean BC concentrations in snow over the period 1850–2014 (1980–2014 mean relative to 1850–1900 mean).
The CMIP6 BCS concentrations generally exhibit an increasing trend during 1850–2014, for all regions, but the timing of the peak concentration varies between regions. Globally, the multi-model mean show a slowly increasing trend from 1850 to 1940, with an overall increase of about 5 ng·g−1, with a rapid increase over the following 70 years from ~10 ng·g−1 in the 1940s to ~30 ng·g−1 in 2014 (Figure 3a). Compared with the preindustrial era, concentrations in the present era are higher by up to ~300% (Figure 4). Trends are consistent across the seven individual models, although four NCAR models (CESM2, CESM2-WACCM, CESM2-FV2, CESM2-WACCM-FV2) yield significantly lower concentrations. This trend may be primarily due to the increase of BC emissions during the early industrial era in North America and Europe, which declined in the late 20th Century [12].
In the high-latitude Alaska region, multi-model mean BCS concentrations increased steadily from ~1.5 ng·g−1 in 1850 to ~6 ng·g−1 in 2014 (Figure 3b), with a peak of ~5 ng·g−1 in the 1920s, similar to central North America. For the Canadian Arctic and Greenland, multi-model mean BCS concentrations increased steadily at ~1 ng·g−1 throughout 1850–2014 (Figure 3c,d), with present-era concentrations being about 50% higher than preindustrial levels (Figure 4). Most individual-model results exhibit trends similar to those of multi-model means, although models CESM2-FV2, CESM2-WACCM-FV2 display more complex variations. For the European and Russian Arctic regions, trends in multi-model mean and individual-model BCS concentrations are similar to those at mid-latitudes, increasing slowly from about 1850 to 1940, then more rapidly after the 1940s, followed by a significant downward trend from the 1970s to the 2000s, and finally stable concentrations from the 2000s to the present day, with multi-model mean concentrations of ~10 ng·g−1 (Figure 3e,f). This trend is similar to that in Europe, likely due to local BC emissions in Europe influencing BCS concentrations through long-range transport.
In central North America, multi-model mean BCS concentrations increased rapidly from 10 ng·g−1 in the preindustrial period to ~30 ng·g−1 in the 1920s, before decreasing to present-day levels (Figure 3g). In Europe, multi-model mean BCS concentrations also increased rapidly in the early period, from 20 ng·g−1 during preindustrial times to ~80 ng·g−1 in the 1970s, before decreasing rapidly (Figure 3h), possibly due to the implementation of the Clean Air Act in the early 1970s, which resulted in BC emissions peaking during that decade [12]. For East Asia and the Tibetan Plateau, multi-model mean BCS concentrations before the 1940s were generally stable at low levels of ~25 ng·g−1, before increasing rapidly to exceed 150 ng·g−1 in 2014 (Figure 3i–j and Figure 4). The rate of increase in BCS concentration over the last 70 years in these regions has been much higher than that in other regions, likely due to rapid industrial development in East Asia. Overall, trends in the four mid-latitude regions are related to historical changes in local BC emissions [12].
In the Southern Hemisphere, multi-model mean BCS concentrations in the Andes region remained unchanged at 1 ng·g−1 until the 1940s, when they began to increase (Figure 3k). By around 2014, concentrations were ~6 ng·g−1. Although BCS concentrations are not particularly high in this region, the increase from preindustrial times to the present is the greatest of all regions, at +900% (Figure 4). Individual-model results and multi-model mean are generally consistent, although models CESM2-FV2 and CESM2-WACCM-FV2 (Table 1) exhibit an anomalous peak at around the 1990s. In Antarctica, multi-model mean BCS concentrations exhibit a steady trend from 1850 to the present, while the four NCAR models yield an increasing trend (Figure 3l).
3.3. Seasonal Cycles
Seasonal cycles in BCS concentrations simulated by multi-model mean and individual models, averaged globally and regionally from the preindustrial to present eras (1850–2014), are shown in Figure 5a–l. Globally, BCS concentrations are highest in January and February, and remain relatively high from March to May, likely influenced by enrichment caused by snow melting (Figure 5a). Concentrations then decrease as the snowpack recedes, reaching a yearly minimum in September, after which, as snowfall increases, simulated BCS concentrations rise again. The cycle varies over the 11 regions due to the different timings of snowfall and melt. In the Northern Hemisphere, BCS concentrations at high latitudes generally show a peak 2–3 months later than at mid-latitudes.
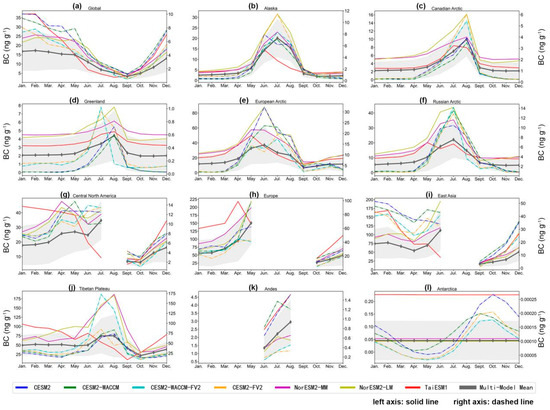
Figure 5.
Seasonal BC concentrations in snow (BCS) cycles based on multi-model mean and individual models, averaged over 1850–2014 globally (a) and regionally (b–l). Gray lines represent multi-model mean BCS, other colors indicate individual model results. The inter-model standard deviation is shown as gray shading. Data were processed with five-point smoothing; values for solid lines are on the left axis and for dashed lines on the right. Models are described in Table 1.
In Alaska and the Russian Arctic, BCS concentrations generally remain constant over January–April, at ~5 ng·g−1 for multi-model means, before increasing from April to a peak in July at ~20 ng·g−1 and then decreasing rapidly during July–September to 5 ng·g−1 again (Figure 5b,f). The individual models generally yield the same seasonal cycle, except for model TaiESM1 (Table 1), for which BCS concentration peaks earlier around June. The Canadian Arctic and Greenland display similar seasonal cycles, with BCS concentrations remaining stable during January–April at ~2 ng·g−1 (multi-model mean) before increasing to respective maxima of ~8 ng·g−1 and ~4 ng·g−1 in August, consistent with trends reported for Greenland by Hagler et al. (Figure 5c,d) [50]. Concentrations then decrease rapidly in August and September to levels comparable with those of January–April. However, for Greenland the CESM2-FV2 and CESM2-WACCM-FV2 models (Table 1) yield earlier July peak concentrations. In the European Arctic, BCS concentrations have the earliest peak of the five high-latitude Northern Hemisphere regions (Figure 5e). During January–March, multi-model mean BCS concentrations remain stable at ~10 ng·g−1 before increasing over the next 3 months to a maximum of ~40 ng·g−1 in June, then decreasing through September to a stable level of ~10 ng·g−1. In such Arctic regions, BCS concentrations generally peak during summer, with the main source of BC aerosol being biomass burning during late spring and summer [51,52,53,54].
At mid-latitudes in the Northern Hemisphere, the seasonal snowpack melts during summer, so there is no BCS concentration to report. In central North America and Europe (Figure 5g,h), multi-model mean BCS concentrations display a consistent increasing trend from October to May with lowest values occurring around October, especially in March and April, which may due to a significant retreat of snow cover during this time [40]. In these regions, the seven individual models are less consistent, especially the TaiESM1 model, which yields a decreasing trend between January and July in central North America, in contrast to the other models. This may be due to differences in model parametrization, such as in the timing of aerosol deposition and the meltwater scavenging efficiency of BC particles in snow, which may have a strong influence on the seasonal cycle and amplitude of BCS concentrations [55,56]. In East Asia, BCS concentrations increase rapidly between September and February, followed by a decreasing trend to April (Figure 5i). However, during April and June, BCS concentrations then tend to rise again due to enrichment of BCS through snowmelt [13]. For the Tibetan Plateau, with its high altitude, there is extensive snow cover in summer and the seasonal cycle of BCS concentrations is similar to those of high-latitude regions, with BCS concentrations remaining stable during January–April at ~50 ng·g−1 (multi-model mean) before increasing through August to ~75 ng·g−1, followed by a decrease to October to levels comparable with those of January–April (Figure 5j).
In the Andes region, multi-model mean BCS concentrations increase consistently from April to October, to a maximum of ~3 ng·g−1. However, individual model results are inconsistent, with all models except TaiESM1 reaching a maximum between July and September, followed by decreasing trends (Figure 5k). For Antarctica, multi-model and NorESM2-MM, NorESM2-LM, and TaiESM1 model mean BCS concentrations appear constant over the whole year. In contrast, the NCAR models (CESM2, CESM2-WACCM, CESM2-FV2, CESM2-WACCM-FV2; Table 1) yield seasonal cycles with minimum and maximum concentrations in May and October, respectively (Figure 5l). This difference between the models is likely to be related to simulated snow depth. BCS concentration is strongly influenced by snowmelt and is closely related to snow depth [13]. And considering this, the seasonal cycle of the NCAR models may be more realistic in Antarctica.
4. Discussion
BCS affects regional and global climate primarily by altering snow albedo and the radiation balance of the Earth System [8], with RF caused by BC thus being an important aspect of studies of BC in the snowpack. Possible effects of CMIP6-simulated BCS concentrations were assessed by consideration of average AR and RF caused by present-day (1980–2014) multi-model global and regional mean concentrations (Figure 6 and Figure 7).
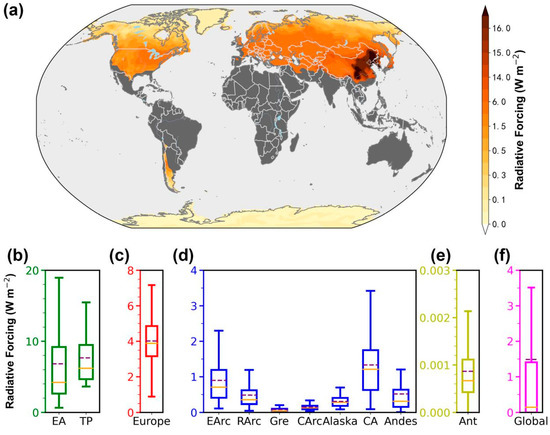
Figure 6.
Global distribution of radiative forcing associated with CMIP6 multi-model mean BC concentrations in snow (a) and statistical results (b–f), averaged globally and regionally over 1980–2014.
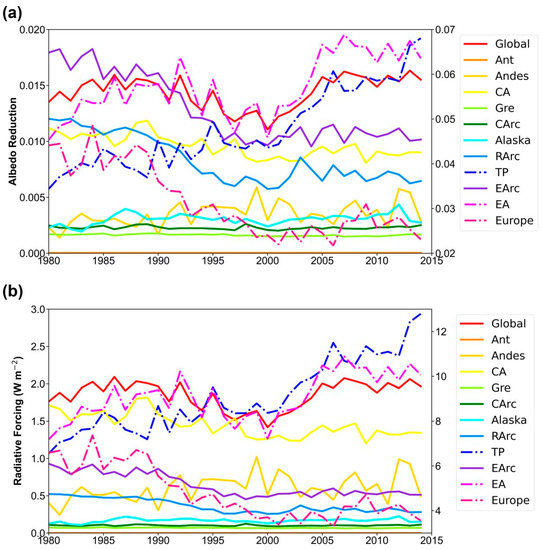
Figure 7.
Temporal trends in (a) all-sky albedo reduction and (b) radiative forcing caused by CMIP6 multi-model mean BC concentrations in snow, globally and regionally during 1980–2014. Values for solid lines are on the left axis and for dashed lines on the right.
The spatial distribution of RF induced by multi-model mean BCS concentrations averaged over 1980–2014 is shown in Figure 6a, with associated statistics in Figure 6b. The global distribution of BCS-induced RF appears consistent with that of BCS concentration, being higher at mid-latitudes and lower at higher latitudes. The global average BCS-induced RF is ~1.5 W m−2 (Figure 6f), although it is below average in most of the 11 regions studied. BCS-induced RF is strongest in East Asia and the Tibetan Plateau, averaging ~7 W m−2 due to the high BCS concentrations and strong incident radiation [12]. BCS-induced RFS in Europe is slightly lower, averaging ~4 W m−2. All other regions have RF values of <4 W m−2, with the European Arctic and central North American regions being relatively higher, with average levels of ~1 W m−2. The Russian Arctic, Greenland, Canadian Arctic, Alaska, and Andes regions have RF levels of generally <1 W m−2, with the lowest BCS-induced RF occurring in Antarctica, at ~0.001 W m−2.
Temporal trends in global and regional AR and RF associated with multi-model-mean BCS concentrations during 1980–2014 are shown in Figure 7a,b. Globally, AR and RF underwent a gradual downward trend during the 1980s and 1990s before increasing again to present levels. For the regions, East Asia had a trend generally consistent with the global trend, indicating a significant impact of BCS-induced RF there. The Europe, European Arctic, Russian Arctic, and central North America regions exhibited a decreasing trend in AR and RF during 1980–2000, remaining relatively stable after 2000. For the other regions, barring the Tibetan Plateau, BCS-induced AR and RF were relatively stable during 1980–2014. For the Tibetan Plateau, AR and RF exhibited a strongly increasing trend during 1980–2014 (Figure 7). A previous study found that a 6% reduction in snow albedo can lead to regional surface warming of 0.86 °C in spring [57]. The AR in the Tibetan Plateau and East Asia simulated by the CMIP6 multi-model mean was about 0.06 in 2014, implying that the climate has been more strongly influenced by BCS than expected.
5. Conclusions
A comprehensive evaluation of CMIP6 BCS simulations has been undertaken on a global scale, together with associated RF. Multi-model mean and seven individual-model historical simulations were compared in terms of BCS spatial distribution, temporal trends, and seasonal cycles. The following conclusions were drawn.
The CMIP6 multi-model mean generally captures the major characteristics of BCS spatial patterns consistently with other models [47,48,49]. The highest BCS concentrations occur in East Asia and on the Tibetan Plateau, averaging ~120 ng·g−1. Concentrations are relatively low in Europe, the European and Russian Arctic, and central North America, of the order of tens of ng·g−1. Even lower concentrations occur in Greenland, the Canadian Arctic, Alaska, and the Andes, at <10 ng·g−1. The lowest concentrations are found in Antarctica, at ~0.05 ng·g−1. However, inter-model standard deviations are significant, especially in the regions with higher BCS concentrations such as East Asia and Europe.
Regarding temporal trends, BCS concentrations from all CMIP6 multi-model mean and individual models exhibit generally consistent global trends, with a significant increase after the 1940s. In mid-latitude regions, trends are related to local BC emission histories, with BCS concentrations peaking in central North America at around the 1920s and in Europe during the 1970s. In East Asia, the levels show a sharp increase from the 1950s.
The individual models show generally consistent seasonal cycles in most regions. Globally, BCS concentrations are highest in January and February, and lowest in September. For the nine Northern Hemisphere regions, seasonal cycles vary with the timing of snowfall and melt. BCS concentrations are lowest at around September, with the highest concentrations occurring earlier at mid-latitudes (March–April) and later at high latitudes (June–August).
Historical BCS-induced AR and RF were also considered. AR in the Tibetan Plateau and East Asia simulated by the CMIP6 multi-model mean reached ~0.06 in 2014, which might lead to regional surface warming of 0.86 °C in spring [57] and a greater influence on climate than expected.
Author Contributions
Conceptualization, Y.C.; methodology, Y.C.; software, Y.X.; formal analysis, Y.C., X.L., Y.X., S.Y., D.W., T.S., J.C., X.Z. and X.N.; data curation, Y.C.; writing—original draft preparation, Y.C.; writing—review and editing, Y.C.; visualization, Y.C.; funding acquisition, D.W. All authors have read and agreed to the published version of the manuscript.
Funding
This research was funded by State Key Laboratory of Cryospheric Science, Northwest Institute of Eco-Environment and Resources, Chinese Academy Sciences [Grant Number: SKLCS-OP-2021-05], and the Natural Science Foundation of Gansu Province, China [Grant Number: 22JR5RA418]. And The APC was funded by [SKLCS-OP-2021-05].
Data Availability Statement
All the CMIP6 datasets are available at https://esgf-node.ipsl.upmc.fr/projects/cmip6-ipsl/ (accessed on 1 May 2022). And MERRA-2 datasets are available at https://disc.gsfc.nasa.gov/ (accessed on 1 May 2022).
Acknowledgments
This research was supported by State Key Laboratory of Cryospheric Science, Northwest Institute of Eco-Environment and Resources, Chinese Academy Sciences (Grant Number: SKLCS-OP-2021-05), the Natural Science Foundation of Gansu Province, China (22JR5RA418) and the Supercomputing Center of Lanzhou University.
Conflicts of Interest
The authors declare no conflict of interest.
References
- Hadley, O.L.; Kirchstetter, T.W. Black-carbon reduction of snow albedo. Nat. Clim. Chang. 2012, 2, 437–440. [Google Scholar] [CrossRef]
- Hansen, J.; Nazarenko, L. Soot climate forcing via snow and ice albedos. Proc. Natl. Acad. Sci. USA 2004, 101, 423–428. [Google Scholar] [CrossRef] [PubMed]
- Bond, T.; Bergstrom, R.W. Light Absorption by Carbonaceous Particles: An Investigative Review. Aerosol Sci. Technol. 2006, 40, 27–67. [Google Scholar] [CrossRef]
- Bond, T.C.; Doherty, S.J.; Fahey, D.W.; Forster, P.M.; Berntsen, T.; DeAngelo, B.J.; Flanner, M.G.; Ghan, S.; Kärcher, B.; Koch, D.; et al. Bounding the role of black carbon in the climate system: A scientific assessment. J. Geophys. Res. Atmos. 2013, 118, 5380–5552. [Google Scholar] [CrossRef]
- Brandt, R.E.; Warren, S.G.; Clarke, A.D. A controlled snowmaking experiment testing the relation between black carbon content and reduction of snow albedo. J. Geophys. Res. Earth Surf. 2011, 116, D08109. [Google Scholar] [CrossRef]
- Cui, J.; Shi, T.; Zhou, Y.; Wu, D.; Wang, X.; Pu, W. Satellite-based radiative forcing by light-absorbing particles in snow across the Northern Hemisphere. Atmos. Chem. Phys. 2021, 21, 269–288. [Google Scholar] [CrossRef]
- Jacobson, M.Z. Climate response of fossil fuel and biofuel soot, accounting for soot’s feedback to snow and sea ice albedo and emissivity. J. Geophys. Res. Earth Surf. 2004, 109, D21. [Google Scholar] [CrossRef]
- Flanner, M.G.; Zender, C.S.; Randerson, J.T.; Rasch, P.J. Present-day climate forcing and response from black carbon in snow. J. Geophys. Res.: Atmos. 2007, 112, D11202. [Google Scholar] [CrossRef]
- Cao, B.; Gruber, S.; Zheng, D.; Li, X. The ERA5-Land soil temperature bias in permafrost regions. Cryosphere 2020, 14, 2581–2595. [Google Scholar] [CrossRef]
- Ramanathan, V.; Carmichael, G. Global and regional climate changes due to black carbon. Nat. Geosci. 2008, 1, 221–227. [Google Scholar] [CrossRef]
- Chýlek, P.; Srivastava, V.; Cahenzli, L.; Pinnick, R.G.; Dod, R.L.; Novakov, T.; Cook, T.L.; Hinds, B.D. Aerosol and graphitic carbon content of snow. J. Geophys. Res. Earth Surf. 1987, 92, 9801–9809. [Google Scholar] [CrossRef]
- Kang, S.; Zhang, Y.; Qian, Y.; Wang, H. A review of black carbon in snow and ice and its impact on the cryosphere. Earth-Sci. Rev. 2020, 210, 103346. [Google Scholar] [CrossRef]
- Qian, Y.; Yasunari, T.J.; Doherty, S.J.; Flanner, M.G.; Lau, W.K.M.; Ming, J.; Wang, H.; Wang, M.; Warren, S.G.; Zhang, R. Light-absorbing particles in snow and ice: Measurement and modeling of climatic and hydrological impact. Adv. Atmos. Sci. 2015, 32, 64–91. [Google Scholar] [CrossRef]
- Clarke, A.D.; Noone, K.J. Soot in the arctic snowpack: A cause for perturbations in radiative transfer. Atmos. Environ. 1985, 41, 64–72. [Google Scholar] [CrossRef]
- Doherty, S.J.; Warren, S.G.; Grenfell, T.C.; Clarke, A.D.; Brandt, R.E. Light-absorbing impurities in Arctic snow. Atmos. Chem. Phys. Discuss. 2010, 10, 11647–11680. [Google Scholar] [CrossRef]
- Warren, S.G.; Clarke, A.D. Soot in the atmosphere and snow surface of Antarctica. J. Geophys. Res. Earth Surf. 1990, 95, 1811–1816. [Google Scholar] [CrossRef]
- Doherty, S.J.; Dang, C.; Hegg, D.A.; Zhang, R.; Warren, S.G. Black carbon and other light-absorbing particles in snow of central North America. J. Geophys. Res. Atmos. 2014, 119, 12–807. [Google Scholar] [CrossRef]
- Sigl, M.; Abram, N.J.; Gabrieli, J.; Jenk, T.M.; Osmont, D.; Schwikowski, M. 19th century glacier retreat in the Alps preceded the emergence of industrial black carbon deposition on high-alpine glaciers. Cryosphere 2018, 12, 3311–3331. [Google Scholar] [CrossRef]
- Ming, J.; Xiao, C.; Du, Z.; Yang, X. An overview of black carbon deposition in High Asia glaciers and its impacts on radiation balance. Adv. Water Resour. 2013, 55, 80–87. [Google Scholar] [CrossRef]
- Wang, X.; Doherty, S.J.; Huang, J. Black carbon and other light-absorbing impurities in snow across Northern China. J. Geophys. Res. Atmos. 2013, 118, 1471–1492. [Google Scholar] [CrossRef]
- Xu, B.; Cao, J.; Hansen, J.; Yao, T.; Joswia, D.R.; Wang, N.; Wu, G.; Wang, M.; Zhao, H.; Yang, W.; et al. Black soot and the survival of Tibetan glaciers. Proc. Natl. Acad. Sci. USA 2009, 106, 22114–22118. [Google Scholar] [CrossRef] [PubMed]
- Zhang, Y.; Kang, S.; Sprenger, M.; Cong, Z.; Gao, T.; Li, C.; Tao, S.; Li, X.; Zhong, X.; Xu, M.; et al. Black carbon and mineral dust in snow cover on the Tibetan Plateau. Cryosphere 2018, 12, 413–431. [Google Scholar] [CrossRef]
- Yasunari, T.J.; Koster, R.D.; Lau, W.K.M.; Kim, K. Impact of snow darkening via dust, black carbon, and organic carbon on boreal spring climate in the Earth system. J. Geophys. Res. Atmos. 2015, 120, 5485–5503. [Google Scholar] [CrossRef]
- Eyring, V.; Bony, S.; Meehl, G.A.; Senior, C.A.; Stevens, B.; Stouffer, R.J.; Taylor, K.E. Overview of the Coupled Model Intercomparison Project Phase 6 (CMIP6) experimental design and organization. Geosci. Model Dev. 2016, 9, 1937–1958. [Google Scholar] [CrossRef]
- Lamarque, J.F.; Shindell, D.T.; Josse, B.; Young, P.J.; Cionni, I.; Eyring, V.; Bergmann, D.; Cameron-Smith, P.; Collins, W.J.; Doherty, R.; et al. The Atmospheric Chemistry and Climate Model Intercomparison Project (ACCMIP): Overview and description of models, simulations and climate diagnostics. Geosci. Model Dev. 2013, 6, 179–206. [Google Scholar] [CrossRef]
- Meehl, G.A.; Boer, G.J.; Covey, C.; Latif, M.; Stouffer, R.J. The Coupled Model Intercomparison Project (CMIP). Bull. Am. Meteorol. Soc. 2000, 81, 313–318. [Google Scholar] [CrossRef]
- Meehl, G.A.; Covey, C.; Delworth, T.; Latif, M.; McAvaney, B.; Mitchell, J.F.B.; Stouffer, R.J.; Taylor, K.E. THE WCRP CMIP3 Multimodel Dataset: A New Era in Climate Change Research. Bull. Am. Meteorol. Soc. 2007, 88, 1383–1394. [Google Scholar] [CrossRef]
- Taylor, K.E.; Stouffer, R.J.; Meehl, G.A. An Overview of CMIP5 and the Experiment Design. Bull. Am. Meteorol. Soc. 2012, 93, 485–498. [Google Scholar] [CrossRef]
- IPCC. Climate Change 2021: The Physical Science Basis; Cambridge University Press: Cambridge, UK, 2021; p. 3949. Available online: https://www.ipcc.ch/report/ar6/wg1/ (accessed on 15 May 2022).
- Lee, Y.H.; Lamarque, J.-F.; Flanner, M.G.; Jiao, C.; Shindell, D.T.; Berntsen, T.; Bisiaux, M.M.; Cao, J.; Collins, W.J.; Curran, M.; et al. Evaluation of preindustrial to present-day black carbon and its albedo forcing from Atmospheric Chemistry and Climate Model Intercomparison Project (ACCMIP). Atmospheric Chem. Phys. 2013, 13, 2607–2634. [Google Scholar] [CrossRef]
- Allen, R.J.; Landuyt, W. The vertical distribution of black carbon in CMIP5 models: Comparison to observations and the importance of convective transport. J. Geophys. Res. Atmos. 2014, 119, 4808–4835. [Google Scholar] [CrossRef]
- Tian-Jun, Z.; Li-Wei, Z.; Xiao-Long, C. Commentary on the Coupled Model Intercomparison Project Phase 6 (CMIP6). Clim. Chang. Res. 2019, 15, 445–456. [Google Scholar] [CrossRef]
- Griffiths, P.T.; Murray, L.T.; Zeng, G.; Shin, Y.M.; Abraham, N.L.; Archibald, A.T.; Deushi, M.; Emmons, L.K.; Galbally, I.E.; Hassler, B.; et al. Tropospheric ozone in CMIP6 simulations. Atmos. Chem. Phys. 2021, 21, 4187–4218. [Google Scholar] [CrossRef]
- Zhao, A.; Ryder, C.L.; Wilcox, L.J. How well do the CMIP6 models simulate dust aerosols? Atmos. Chem. Phys. 2022, 22, 2095–2119. [Google Scholar] [CrossRef]
- Brown, R.D.; Petkova, N. Snow cover variability in Bulgarian mountainous regions, 1931–2000. Int. J. Climatol. 2007, 27, 1215–1229. [Google Scholar] [CrossRef]
- Brown, R.D. Northern Hemisphere snow cover variability and change, 1915–1997. J. Clim. 2000, 13, 2339–2355. [Google Scholar] [CrossRef]
- Yang, J.Y.; Ding, S.L.; Liu, J.-F. Variations of snow cover in the source regions of the Yangtse and Yellow Rivers in China between 1960 and 1999. J. Glaciol. 2007, 53, 420–426. [Google Scholar]
- Danabasoglu, G.; Lamarque, J.; Bacmeister, J.; Bailey, D.A.; DuVivier, A.K.; Edwards, J.; Emmons, L.K.; Fasullo, J.; Garcia, R.; Gettelman, A.; et al. The Community Earth System Model Version 2 (CESM2). J. Adv. Model. Earth Syst. 2020, 12, e2019MS001916. [Google Scholar] [CrossRef]
- Gettelman, A.; Mills, M.J.; Kinnison, D.E.; Garcia, R.R.; Smith, A.K.; Marsh, D.R.; Tilmes, S.; Vitt, F.; Bardeen, C.G.; McInerney, J.; et al. The Whole Atmosphere Community Climate Model Version 6 (WACCM6). J. Geophys. Res. Atmos. 2019, 124, 12380–12403. [Google Scholar] [CrossRef]
- Seland, Ø.; Bentsen, M.; Olivié, D.; Toniazzo, T.; Gjermundsen, A.; Graff, L.S.; Debernard, J.B.; Gupta, A.K.; He, Y.-C.; Kirkevåg, A.; et al. Overview of the Norwegian Earth System Model (NorESM2) and key climate response of CMIP6 DECK, historical, and scenario simulations. Geosci. Model Dev. 2020, 13, 6165–6200. [Google Scholar] [CrossRef]
- Lee, W.-L.; Wang, Y.-C.; Shiu, C.-J.; Tsai, I.-C.; Tu, C.-Y.; Lan, Y.-Y.; Chen, J.-P.; Pan, H.-L.; Hsu, H.-H. Taiwan Earth System Model Version 1: Description and evaluation of mean state. Geosci. Model Dev. 2020, 13, 3887–3904. [Google Scholar] [CrossRef]
- Singh, D.; Flanner, M.G.; Millour, E. Improvement of Mars Surface Snow Albedo Modeling in LMD Mars GCM With SNICAR. J. Geophys. Res. Planets 2018, 123, 780–791. [Google Scholar] [CrossRef]
- He, C.; Flanner, M.G.; Chen, F.; Barlage, M.; Liou, K.-N.; Kang, S.; Ming, J.; Qian, Y. Black carbon-induced snow albedo reduction over the Tibetan Plateau: Uncertainties from snow grain shape and aerosol–snow mixing state based on an updated SNICAR model. Atmos. Chem. Phys. 2018, 18, 11507–11527. [Google Scholar] [CrossRef]
- Pu, W.; Cui, J.; Wu, D.; Shi, T.; Chen, Y.; Xing, Y.; Zhou, Y.; Wang, X. Unprecedented snow darkening and melting in New Zealand due to 2019–2020 Australian wildfires. Fundam. Res. 2021, 1, 224–231. [Google Scholar] [CrossRef]
- Dang, C.; Warren, S.G.; Fu, Q.; Doherty, S.J.; Sturm, M.; Su, J. Measurements of light-absorbing particles in snow across the Arctic, North America, and China: Effects on surface albedo. J. Geophys. Res. Atmos. 2017, 122, 10149–10168. [Google Scholar] [CrossRef]
- Li, C.; Bosch, C.; Kang, S.; Andersson, A.; Chen, P.; Zhang, Q.; Cong, Z.; Chen, B.; Qin, D.; Gustafsson, Ö. Sources of black carbon to the Himalayan–Tibetan Plateau glaciers. Nat. Commun. 2016, 7, 12574. [Google Scholar] [CrossRef]
- Dou, T.; Xiao, C.; Shindell, D.T.; Liu, J.; Eleftheriadis, K.; Ming, J.; Qin, D. The distribution of snow black carbon observed in the Arctic and compared to the GISS-PUCCINI model. Atmos. Chem. Phys. 2012, 12, 7995–8007. [Google Scholar] [CrossRef]
- Jiao, C.; Flanner, M.G.; Balkanski, Y.; Bauer, S.E.; Bellouin, N.; Berntsen, T.K.; Bian, H.; Carslaw, K.S.; Chin, M.; De Luca, N.; et al. An AeroCom assessment of black carbon in Arctic snow and sea ice. Atmos. Chem. Phys. 2014, 14, 2399–2417. [Google Scholar] [CrossRef]
- Namazi, M.; von Salzen, K.; Cole, J.N.S. Simulation of black carbon in snow and its climate impact in the Canadian Global Climate Model. Atmos. Chem. Phys. 2015, 15, 10887–10904. [Google Scholar] [CrossRef]
- Hagler, G.S.W.; Bergin, M.H.; Smith, E.A.; Dibb, J.E.; Anderson, C.; Steig, E.J. Particulate and water-soluble carbon measured in recent snow at Summit, Greenland. Geophys. Res. Lett. 2007, 34, L16505. [Google Scholar] [CrossRef]
- Hegg, D.A.; Warren, S.G.; Grenfell, T.C.; Doherty, S.J.; Larson, T.V.; Clarke, A.D. Source Attribution of Black Carbon in Arctic Snow. Environ. Sci. Technol. 2009, 43, 4016–4021. [Google Scholar] [CrossRef]
- Generoso, S.; Bey, I.; Attié, J.-L.; Bréon, F.-M. A satellite- and model-based assessment of the 2003 Russian fires: Impact on the Arctic region. J. Geophys. Res. Earth Surf. 2007, 112, D15302. [Google Scholar] [CrossRef]
- Warneke, C.; Bahreini, R.; Brioude, J.; Brock, C.A.; de Gouw, J.A.; Fahey, D.W.; Froyd, K.D.; Holloway, J.S.; Middlebrook, A.; Miller, L.; et al. Biomass burning in Siberia and Kazakhstan as an important source for haze over the Alaskan Arctic in April 2008. Geophys. Res. Lett. 2009, 36, L02813. [Google Scholar] [CrossRef]
- Stohl, A. Characteristics of atmospheric transport into the Arctic troposphere. J. Geophys. Res. Earth Surf. 2006, 111, D11306. [Google Scholar] [CrossRef]
- Qian, Y.; Flanner, M.G.; Leung, L.R.; Wang, W. Sensitivity studies on the impacts of Tibetan Plateau snowpack pollution on the Asian hydrological cycle and monsoon climate. Atmos. Chem. Phys. 2011, 11, 1929–1948. [Google Scholar] [CrossRef]
- Qian, Y.; Wang, H.; Zhang, R.; Flanner, M.G.; Rasch, P.J. A sensitivity study on modeling black carbon in snow and its radiative forcing over the Arctic and Northern China. Environ. Res. Lett. 2014, 9, 064001. [Google Scholar] [CrossRef]
- Oaida, C.M.; Xue, Y.; Flanner, M.G.; Skiles, S.M.; De Sales, F.; Painter, T.H. Improving snow albedo processes in WRF/SSiB regional climate model to assess impact of dust and black carbon in snow on surface energy balance and hydrology over western U.S. J. Geophys. Res. Atmos. 2015, 120, 3228–3248. [Google Scholar] [CrossRef]
Publisher’s Note: MDPI stays neutral with regard to jurisdictional claims in published maps and institutional affiliations. |
© 2022 by the authors. Licensee MDPI, Basel, Switzerland. This article is an open access article distributed under the terms and conditions of the Creative Commons Attribution (CC BY) license (https://creativecommons.org/licenses/by/4.0/).