Abstract
It is indisputable that global warming has triggered more frequent extreme weather and in turn led to severe flood disasters. To understand the trend of extreme rainfall under 1.5 °C and 2 °C warming, we investigated the historical variation and future trends in extreme rainfall for the Huai River basin, which has frequently been hit by floods, using recorded meteorological data and a projection of five General Circulation Models in the Coupled Model Intercomparison Project 6. We used the years 1995–2014 as the baseline period to study the temporal and spatial changes in extreme rainfall under 1.5 °C and 2.0 °C warming scenarios. The results indicated that (1) temperatures in the Huai River basin have risen significantly from 1995 to 2014, but there are insignificant variation trends in annual precipitation (AP), intensive precipitation (R95P), maximum daily precipitation (Rx1d) and heavy rain days (Rr50) during the same time span. (2) From 2015 to 2100, both temperature and extreme rainfall indices show increase trends, with a higher rate of increase under a higher emission scenario. (3) Under the warming scenario of 1.5 °C, AP, R95P, Rx1d and Rr50 in the basin will likely increase by 4.6%, 5.7%, 6.2% and 13.4%, respectively, compared with that in the baseline period. Under the warming scenario of 2.0 °C, AP, R95P, Rx1d and Rr50 will probably increase by 7.3%, 7.4%, 10.9% and 19.0%, respectively. (4) Spatially, the changes in extreme rainfall indices under the warming scenarios of 1.5 °C and 2.0 °C generally tend to increase from north to south. Higher intensity extreme rainfall will likely extend to the whole of the Huai River basin. It is therefore essential to study adaptive measures to cope with flooding in the Huai River basin induced by the increase in future rainfall extremes.
1. Introduction
To some extent, extreme weather has an effect on socioeconomics [1]. As the planet has warmed, the frequency and intensity of extreme climatic events have been largely on the rise since the middle of the 20th century [2,3,4]. Extreme rainfall has been one of the main hazard sources, usually resulting in severe basin floods; moreover, it has a major impact on socioeconomic development [5]. During 17–23 July 2021, an extremely heavy rainstorm occurred in the Henan province with the storm center in the city of Zhengzhou. Over 200 mm fell in one 24-h period at Zhengzhou station, leading to huge economic loss and many deaths [6]. According to the annual report issued in 2022 by the Ministry of Emergency Management (MEM) of China, high-intensity rainfall over China in 2021 was 6% above the multiple-year average from 1961 to 2021. The direct economic losses induced by extreme rainfall amounted to about 245.89-billion-yuan, accounting for more than 70% of the total direct economic losses induced by natural hazards [7]. Climatic extremes will likely increase in the future according to the GCMs (General Circulation Models) projections [2,3]. It is therefore of significance to study the historical variation in extreme rainfall and its future trend to support flood control and guarantee sustainable socioeconomic development.
As a major driver of basin floods, extreme rainfall generally tends to increase in frequency and intensity in the context of global warming. Zhang et al. (2012) analyzed the variation in extreme rainfall in the Xinjiang Uyghur autonomous region during 1961–2010 by using 14 rainfall indices and found that variability in extreme rainfall tended to increase for more than 50 rainfall gauges [8]. Song et al. (2018) constructed an extreme rainfall series for meteorological stations in Beijing using the annual maximum value method and the threshold method. The constructed series exhibited an increasing trend both in the frequency and intensity of extreme rainfall [9]. Major rivers and most provinces in China have been hit by rainfall storms in recent decades. Wang et al. (2017) reported that the rainfall intensity of most rainfall gauges in the Huai River basin tended to increase during 1960–2014, particularly after 2000 [10]. However, the maximum 5-day precipitation, wet days and consecutive wet days decreased significantly from 1960 to 2010 for most part of the Huang-Huai-Hai Rivers [11]. Statistical results indicated that both the annual precipitation and extreme rainfall over China exhibited an increasing trend during the past 60 years [12]. However, the occurrence of extreme rainfall events showed a significant difference in terms of spatial distribution, not only in China but also in the other countries of the world [13,14,15,16]. The average rainfall for a large area cannot completely represent the characteristics of small-scale regional rainfall storms, thus the features of regional rainstorms have attracted much attention. During mid-July to August in 2021, high intensity rainfall occurred in Jincheng County in Shanxi province, Sui county in Hubei province, and Lantian county in Shaanxi province, leading to a severe flash flood and landslides [7]. Extreme rainfall is one of the causes of natural hazards and huge economic and human losses, hence the critical importance to understand its past and future changes.
Global Circulation Models are currently the most powerful tools to project future climate change [17,18,19]. Fu et al. (2008) investigated Decadal climatic variability, trends, and future scenarios for the north China plain by using multi-GCM outputs from the Fourth Assessment Report of the Intergovernmental Panel on Climate Change (IPCC) and found the north China plain will probably undergo warm and dry climate in the future with a higher intensity extreme rainfall occurring regionally [20]. The projections of GCMs for the Hai River basin indicated that the frequency of extreme precipitation events has an increase trend under A1B and A2 scenarios [21]. By using CMIP5 (Coupled Model Intercomparison Project 5) models, Chen et al. (2013) projected a change in extreme rainfall events in China by the end of the 21st century. It was found that the number of days and the intensity of medium rain, large rain and heavy rain will likely increase [22]. Gao et al. (2012) evaluated the reliability of a GCMs in climate change simulation over East Asia. Validation of each simulation and the ensemble average showed good performances of GCMs in reproducing mean temperature and precipitation of the present period of 1981–2000 [23]. However, uncertainty still exists in rainfall projections. It also found the largest uncertainties in precipitation projection are in eastern China during the summer season. Quartile Analysis is a commonly used approach in dealing with uncertainty in GCMs projections [24,25].
Global warming by 1.5 and 2 °C is a global concern. The increase in temperature has already resulted in profound alterations to human and natural systems, bringing increases in extreme weather, droughts and floods [2,26]. Global warming by 1.5 °C might have irrecoverable effects on the natural system, while 1.5 °C global warming will probably cause an unprecedented risk to vulnerable population and areas [27,28]. To mitigate and reduce its potential effects, the Paris Agreement under the United Nations Framework Convention on Climate Change (UNFCCC) was adopted by 196 Parties at COP 21 in Paris [29]. The goal of the Paris Agreement is to pursue efforts to limit global warming to well below 2 °C, preferably to 1.5 °C, compared to pre-industrial levels. The effects of 1.5 and 2 °C global warming have been attracted broad attentions from not only government officials but also scientific communities [30,31,32].
The Huai River basin is one of the seven major rivers in China, situated in the transitional climate zone from arid climate in North China to humid climate in South China, where it is highly influenced by the Eastern Asia Monsoon. The river basin is densely populated, with a population density of over 600 persons per square kilometers, which is approximately 5 times the China average. Meanwhile, The Huai River supports over 17% of crop productivity of China. In recent decades, floods induced by extreme rainfall have been increasing in the Huai River basin, severely threatening food security in China and the safety of the local people. Although there are numerous studies available in the literature on climate change impact to the Huai River basin [33,34,35], previous studies mainly focus on water resources, with the used climate scenarios being issued in IPCC-TAR (Third Assessment Report), IPCC-AR4 (Fourth Assessment Report), and IPCC-AR5 (Fifth Assessment Report). There are only a few studies on the change in rainfall extremes under the newly issued SSPs scenarios, which can directly link with local communities. It is therefore critical and essential to understand variation trends of rainfall extremes in the Huai River basin under the newly issued scenarios for the planning of effective flood control of the Huai River. With multiple CMIP6-GCM projections, the main objectives of the study are to investigate changes in extreme rainfall for the basin under 1.5 and 2 °C global warming. The expected results could provide scientific support for the planning of flood control and adaptation to climate change in the Huai River. The paper is presented as follows: Section 2 introduces the study catchment and the methods used; Section 3 presents the results in detail; Section 4 discusses the findings of the study, followed by a summary and conclusions in Section 5.
2. Data Sources and Methodology
2.1. Study Catchment
The Huai River basin is located in eastern China, between the Yangtze River basin and the Yellow River basin, with a drainage area of approximately 270,000 km2. The Huai River flows from west to east and runs across Henan, Anhui, Jiangsu and Shandong provinces, with a temperate monsoon climate in the northern part and subtropical monsoon climate in the southern part. The annual mean temperature ranges from 11 °C to 16 °C, decreasing spatially from south to north. The monthly average temperature peaks in July at about 25 °C and reaches a low of below 0 °C in January. The multiple-year average annual precipitation is about 920 mm and decreases from north to south. The precipitation in summer accounts for more than half of the annual precipitation.
2.2. Data Sources
Daily precipitation and temperature readings from 1995 to 2014 gauged at 177 meteorological stations were collected to analyze the historical variation in climatic variables. The major river system and locations of rain gauges in the basin are shown in Figure 1.
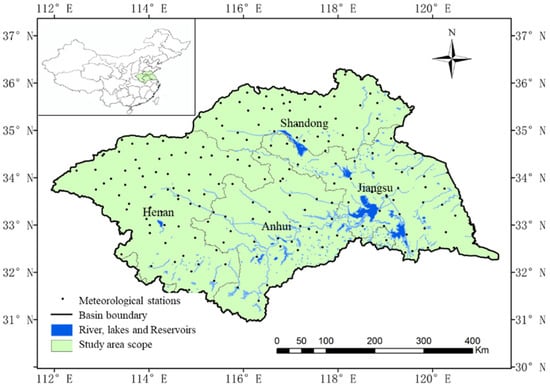
Figure 1.
Major river system and locations of meteorological stations in the Huai River basin.
There are tens of GCMs available in CIMP5 and CMIP6. Previous studies indicate that five GCMs (CanESM5, CNRM-ESM2-1, IPSL-CM6A-LR, MIROC6 and MRI-ESM2-0) are reasonably suitable for China, especially for the eastern part [28,32]. Thus, projections of the five GCMs from CMIP6 were employed to investigate future trends of temperature and rainfall. The time spans of historical simulation and future projection under the multiple future emission scenarios of the five GCMs are 1995–2014 and 2015–2100, respectively. The general information of the five GCMs is shown in Table 1. In this study, the GCMs projections under the four Shared Socioeconomic Pathways (SSPs) scenarios were used to investigate future changes in climatic variables. SSPs is a newly launched scenario for climate change research that combines pathways of future radiative forcing and their associated climate changes with alternative pathways of socioeconomic development. The four adopted scenarios of SSP1-2.6, SSP2-4.5, SSP3-7.0 and SSP5-8.5 represent the low forcing scenario, medium radiative forcing scenario, medium and high radiative forcing scenario and high forcing scenario, respectively.

Table 1.
General information of 5 GCMs in CMIP6.
2.3. Methods
2.3.1. Mann–Kendall Test
The Mann–Kendall nonparametric trend test (M–K method) is a commonly used method to detect the variation trend of a time series [36,37]. The method is based on an assumption of stability of a time series and does not require the samples to follow a certain statistical distribution. It is therefore suitable for hydro-meteorological series and has been widely used in climate sciences. Suppose {x1, x2, x3, …, xn} is an independent random time series, then the M–K statistic UF can be defined and calculated as follows:
where, n is the length of the time series, Sgn is a symbolic function, xi and xj are the measured values at the year i and j, respectively.
The statistic UF approximately follows a standard normal distribution. A positive value indicates an increasing trend, and a negative value indicates a decreasing trend. Given a significance level α, if |UF| > |Uα|, then a significant variation trend is detectable. UF is ± 1.96 at the significance level of 0.05.
2.3.2. Theil Sen Slope Calculation
The Theil Sen Slope is a nonparametric estimation method based on median estimation of a series trend. This method calculates the Kendall slope value β to determine the variation trend of a time series [37]. The positive β indicates an increasing trend, while the negative β indicates a decreasing trend. A higher absolute value of β means a greater increasing or decreasing trend of a series.
where, Median represents median function, xi and xj represent series sample values at i and j, respectively. The i and j are the order number of the series with .
2.3.3. Extreme Rainfall Index
Drawing on the extreme climate indices recommended by the World Meteorological Organization, four extreme rainfall indices were selected to measure the climatic extremes of the Huai River basin, covering annual precipitation (AP), intensive precipitation (R95P), maximum daily precipitation (Rx1d) and heavy rain days (Rr50). These four indices reflect extreme rainfall situations at different time scales and have been widely applied to China, Asia, and throughout the world [38,39,40,41]. The definition of the four extreme rainfall indices is given in Table 2. AP indicates the climatic situation at an annual scale, while the other three indices closely link to regional floods.
Table 2.
Definition of extreme rainfall indices.
3. Results
3.1. Historical Variation and Future Trend of Temperature
Using the recorded temperature in the Huai River basin and the projected temperatures under different future climate scenarios, the basin average annual temperatures from 1995 to 2100 are shown in Figure 2. Trend rates and M–K statistics of the recorded temperature series from 1995 to 2014 and the ensemble mean temperature series from 2015 to 2100 were estimated by the Theil Sen Slope estimation and Mann–Kendall test (Table 3).
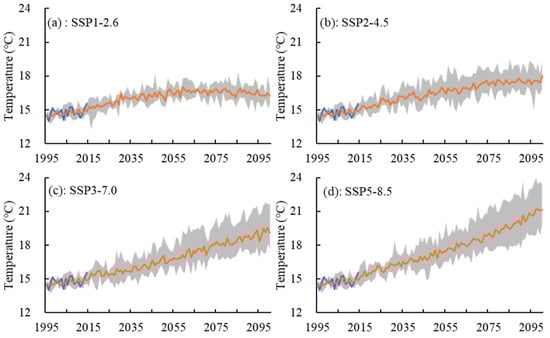
Figure 2.
Historical variation and projection trend of temperature under SSPs scenarios (a to d represent SSP1-2.6, SSP2-4.5, SSP3-7.0, and SSP5-8.5 respectively) for the Huai River basin (the blue solid line and the orange solid line are the recorded annual value and the ensemble mean of five GCMs projections, the grey area is the variation range of five GCMs projections, same to Figure 3, Figure 4, Figure 5 and Figure 6).
Table 3.
The tested results of temperature variation trend under different scenario for the Huai River basin.
Figure 2 and Table 3 show that (1) the recorded temperature falls in the range of CMIP6 multi-model simulations and matches well with the ensemble mean of multiple GCM simulations. Statistical results indicate that the average simulated and recorded temperatures are 14.77 °C and 14.70 °C, respectively, with a relative error of 2.7%. It shows that the CMIP6 multi-model has a good performance on the temperature simulation of the Huai River basin. (2) During the period of 1995–2014, the observed and simulated temperature presented a rising trend of 0.20 °C/10a and 0.26 °C/10a, respectively. The M–K values of the simulated and observed annual temperature series are 3.7 and 2.04, which are higher than the threshold value of 1.96 at the confidence level of 0.05, indicating a significant rising trend in annual temperature. (3) From 2015 to 2100, the annual temperature exhibited significant rising trends for all four scenarios, with linear increasing rates of 0.14 °C/10a, 0.30 °C/10a, 0.50 °C/10a and 0.67 °C/10a under the SSP1-2.6, SSP2-4.5, SSP3-7.0 and SSP5-8.5 scenarios, respectively. It can also be found that the annual temperature under the SSP1-2.6 scenario will reach a peak of around 2060 and then stabilize around 15–17 °C. The temperature trends under the SSP3-7.0 and SSP5-8.5 scenarios are much higher than those in the baseline period of 1995–2014.
3.2. Historical Variation and Future Trends of Rainfall Extremes
The four extreme rainfall indices were calculated using the recorded daily rainfall and the downscaled daily rainfall based on the five GCM projections. Historical and future variations in extreme rainfall indices in the Huai River basin are shown in Figure 3, Figure 4, Figure 5 and Figure 6. The trend diagnosis results are given in Table 4.
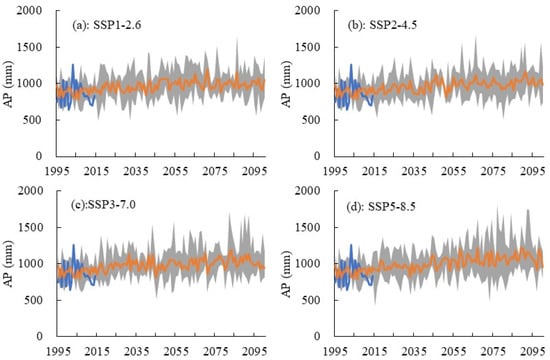
Figure 3.
Historical variation and projection trend of AP under SSPs scenarios (a to d represent SSP1-2.6, SSP2-4.5, SSP3-7.0, and SSP5-8.5 respectively) for the Huai River basin (same to Figure 2).
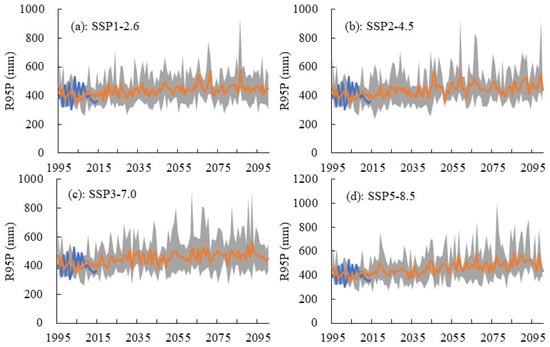
Figure 4.
Historical variation and projection trend of R95P under SSPs scenarios (a to d represent SSP1-2.6, SSP2-4.5, SSP3-7.0, and SSP5-8.5 respectively) for the Huai River basin (same to Figure 2).
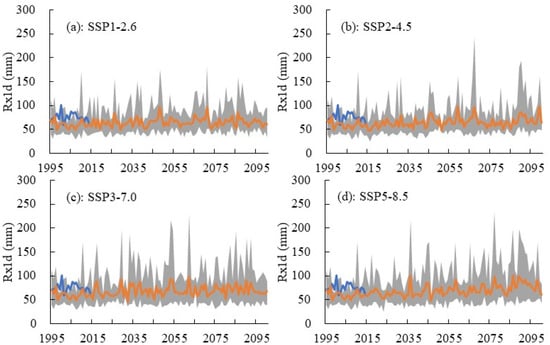
Figure 5.
Historical variation and projection trend of Rx1d under SSPs scenarios (a to d represent SSP1-2.6, SSP2-4.5, SSP3-7.0, and SSP5-8.5 respectively) for the Huai River basin (same to Figure 2).
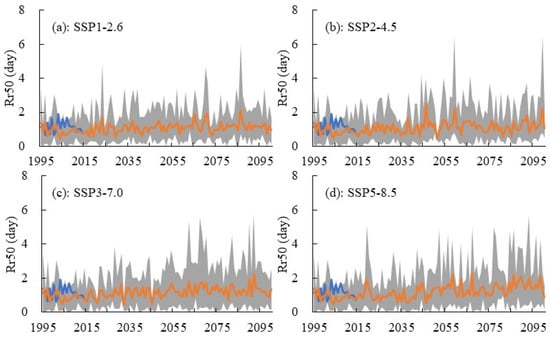
Figure 6.
Historical variation and projection trend of Rr50 under SSPs scenarios (a to d represent SSP1-2.6, SSP2-4.5, SSP3-7.0, and SSP5-8.5 respectively) for the Huai River basin (same to Figure 2).
Table 4.
Tendency rate and M-K statistics of extreme rainfall index under SSPs scenarios in the Huai River basin.
Figure 3, Figure 4, Figure 5 and Figure 6 show that (1) during 1995–2014, the four extreme rainfall indices derived from CMIP6 multi-GCM simulation data fit the recorded data well, while the observed values of Rx1d and Rr50 are slightly larger than the simulated values for some years. (2) The four extreme rainfall indices present an insignificant decreasing trend over 1995–2014. The trends of the four extreme rainfall indices derived from CMIP6 simulations are generally consistent with that derived from the observed data, with the exception of AP. The observed AP presents an insignificant decreasing trend of −1.02 mm/a, while the ensemble mean of AP derived from simulations exhibits an insignificant increasing trend of 1.33 mm/a. (3) Since the absolute values of the Mann–Kendall values of the four extreme rainfall indices during 1995–2014 are less than the threshold value of 1.96, the extreme rainfall indices show an insignificant variation trend in historical period of 1995–2014. (4) During 2015–2100, all four extreme rainfall indices present increasing trends with a large variability in the far future. The Mann-Kendall test results indicate that AP, R95P, and Rr50 exhibit significant increasing trends under all four scenarios. Rx1d presents significant increasing trends under SSP2-4.5 and SSP5-8.5, while it has insignificant increasing trends under SSP1-2.6 and SSP3-7.0. (5) The growth rates of all four extreme rainfall indices are highest under SSP5-8.5, followed by SSP3-7.0 and SSP2-4.5, and the lowest in SSP1-2.6. Under the scenario of SSP1-2.6, the growth rates of AP, R95P, Rx1d and Rr50 are 0.97 mm/a, 0.44 mm/a, 0.04 mm/a, and 0.03 d/10a, respectively, while they are 2.10 mm/a, 1.10 mm/a, 0.23 mm/a, and 0.037/10a under SSP5-8.5.
In general, the multiple CMIP6 GCM simulations match well with the recorded extreme rainfall in the Huai River basin. In the historical period of 1995–2014, the extreme rainfall indices have insignificant decreasing trends. In the period of 2015–2100, the extreme rainfall indices show a significant increasing trend with the exception of Rx1d under SSP1-2.6 and SSP3-7.0. The growth rate is higher in higher emission scenarios, e.g., SSP5-8.5 than that in the lower emission scenarios, e.g., SSP1-2.6. As rainfall extremes are main drivers of floods in the Huai River basin, increases in the projected rainfall extremes mean flood issues in the Huai River will likely be aggravated in the context of global warming, particularly under the higher emission scenarios. It is essential to find an adaptive solution for guarantying the flood security of the Huai River basin.
3.3. Changes in Extreme Rainfall Indices under 1.5 °C and 2 °C Global Warming
3.3.1. Determination of Time Spans for 1.5 °C and 2.0 °C Global Warming
According to the sixth assessment report of the IPCC, the global temperature during 2011–2020 has risen by 1.09 °C [3] compared with the global average temperature before the Industrial Revolution (1850–1900). If global temperatures continue to rise by 0.41 °C and 0.91 °C on this basis, the global temperature rise will reach 1.5 °C and 2.0 °C.
In this study, we used the temperature projections of GCMs under different emission scenarios to detect the year global warming reached 1.5 °C and 2.0 °C by searching for a 0.41 °C and 0.91 °C increase in the 20-year moving average temperature relative to that in 2001–2020. Taking the detected year as the central point, the previous and subsequent 10 years of the central point are combined and taken as the time span of 1.5 °C and 2.0 °C global warming. The detected time spans of 1.5 °C and 2.0 °C global warming are given in Table 5.
Table 5.
Time spans of 1.5 °C and 2.0 °C global warming under SSPs emission scenarios.
Table 5 shows that the detected target global warming spans are associated with GCMs and emission scenarios. The likely time spans of 1.5 °C and 2.0 °C global warming are in the 2030s and 2050s. Under the higher emission scenario, e.g., SSP5-8.5, the time span of target global warming will occur several years earlier than that under the lower emission scenarios. It is also found that global temperature rises were projected by CNRM-ESM2-1, MIROC6 and MRI-ESM2-0 to be under 2 °C if the SSP1-2.6 emission scenario occurred, which means the goal of limiting global warming in the Paris Agreement will probably be reached under the lower emission scenario of SSP1-2.6.
3.3.2. Changes in Extreme Rainfall Indices
Based on the recorded daily rainfall in 1995–2014 and the downscaled daily rainfall in time spans of 1.5 °C and 2.0 °C global warming, four extreme rainfall indices (AP, R95P, Rx1d, and Rr50) in the Huai River basin were calculated. Quartile analyses of the four extreme rainfall indices are shown in Figure 7 based on multiple GCM projections under different scenarios. Taking 1995–2014 as the baseline period, changes in extreme rainfall indices of the Huai River basin over the time spans of 1.5 °C and 2.0 °C global warming were investigated and appear in Figure 8.
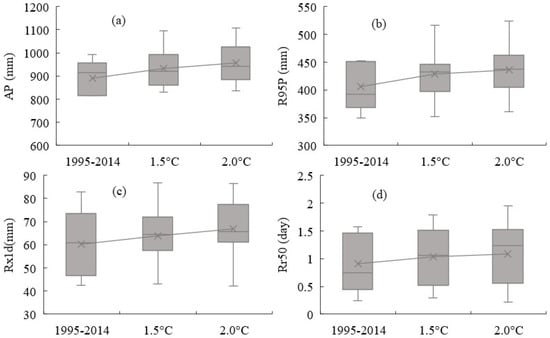
Figure 7.
Quartile analysis on extreme rainfall indices in baseline period and time spans of 1.5 °C and 2 °C global warming (a to d represent scenarios of SSP1-2.6, SSP2-4.5, SSP3-7.0, and SSP5-8.5 respectively) (a–d).
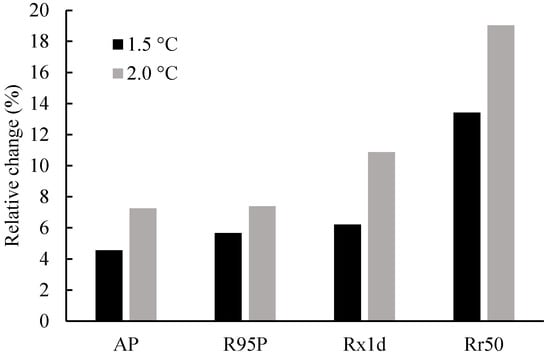
Figure 8.
Relative changes in extreme rainfall indices under 1.5 °C and 2.0 °C global warming relative to baseline.
Figure 7 and Figure 8 indicate that (1) in general, the four extreme rainfall indices in the time spans of 1.5 °C and 2.0 °C global warming are larger than that in the baseline period, although uncertainty still exists in the projected values. (2) Under the 1.5 °C global warming, AP, R95P, and Rx1d increase from 891.4 mm, 406.0 mm, and 60.2 mm in the baseline period to 932.0 mm, 428.9 mm, and 63.9 mm, with relative increases of 4.6%, 5.7% and 6.2%; meanwhile, Rr50 increases from 0.91 days in the baseline period to 1.03 days, with an increase of 13.4%. (3) Under the 2.0 °C global warming, AP, R95P, and Rx1d increase to 956.0 mm, 436.0 mm, and 66.7 mm, with relative increases of 7.3%, 7.4%, and 10.9%, respectively; Rr50 increases to 1.08 days, with an increase of 19.0%. (4) Relative to baseline, the increase rates of all four extreme rainfall indices under 2.0 °C global warming are higher than those under 1.5 °C global warming, which implies that flood risk will likely increase due to global warming.
3.4. Spatial Patterns of Changes in Extreme Rainfall Indices
Figure 9 shows the spatial distributions of changes in extreme rainfall indices relative to the baseline of 1995–2014, based on the ensemble mean of four extreme rainfall indices calculated by five GCM projections under the scenarios of 1.5 °C and 2.0 °C global warming.
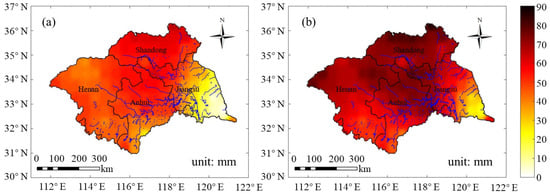
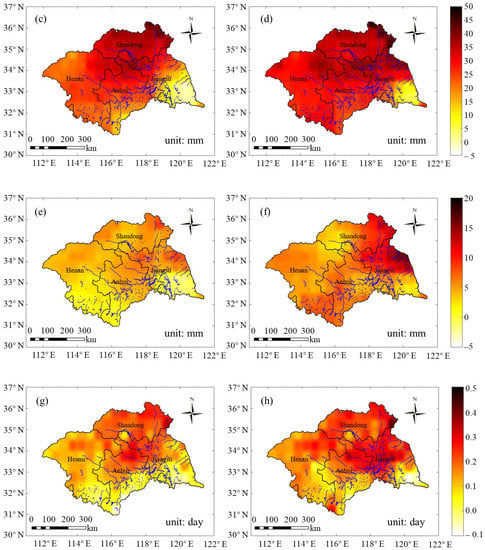
Figure 9.
Spatial distribution of changes in AP (a,b), R95P (c,d), Rx1d (e,f), and Rr50 (g,h) for the Huai River basin under 1.5 °C and 2.0 °C global warming scenarios (left: changes under 1.5 °C global warming with the number of a, c, e, and g from top to bottom; right: changes under 2.0 °C global warming with the number of b, d, f, and h from top to bottom).
The AP over the Huai River basin decreases roughly from south to north. The AP in the south of Anhui is more than 1400 mm, while that in the north of Shandong is about 600 mm. Figure 9a shows that (1) compared with the baseline of 1995–2014, changes in AP under the 2.0 °C warming scenario are higher than those under the 1.5 °C warming scenario over the Huai River basin. The spatial patterns of changes in AP under the 1.5 °C and 2.0 °C warming scenarios are similar. (2) Under the 1.5 °C warming scenario, the eastern part of the Huai River basin shows the lowest change in AP of about 20 mm, and changes in AP in Shandong province and northern part of Anhui province are higher than those in other areas. (3) Under the 2.0 °C warming scenario, changes in AP tend to decrease from west to east, with the highest change of over 80 mm occurring in the west of Henan province and the lowest change in AP of 10–20 mm in the east of the Huai River basin.
Throughout the basin, the R95P decreases from southeast to northeast, with the largest value of about 500 mm in the east of Jiangsu and the south of Anhui province, and the lowest value of about 300 mm in the north of Henan and the west of Shandong. It can be seen from Figure 9b that (1) under the 1.5 °C warming scenario, the changes in R95P decrease from north to south and from west to east, with the largest changes of more than 30 mm occurring in the northern part of the Huai River basin and the lowest changes of less than 10 mm in the eastern part of the basin. (2) In general, the spatial pattern of changes in R95P under the 2.0 °C warming scenario are similar to those under the 1.5 °C warming scenario, with the highest change of more than 40 mm occurring in the northeast part of the basin, and the slightest changes of less than 10 mm occurring in the eastern region of the Huai River basin. (3) Changes in R95P under the 2.0 °C warming scenario are 5–10 mm higher than those under the 1.5 °C warming scenario for most regions of the Huai River basin, with an exception of some regions in Shandong province.
The Rx1d over the Huai River basin decreases from east to west, with the largest Rx1d of about 80 mm in the east of Jiangsu province. Figure 9c indicates that (1) under the 1.5 °C warming scenario, changes in Rx1d over the Huai River basin decrease from north to south, with the largest change of over 5 mm in Shandong and part of Anhui province, and a negative change of about −3 mm in the southeastern and southwestern parts of the Huai River basin. This suggests that flood risk in some regions of Jiangsu, Henan and the south of Anhui might decrease due to global warming and that in Shandong province will probably be aggravated. (2) Under the 2.0 °C warming scenario, the Rx1d in the north of Jiangsu has the largest increase of more than 15 mm, followed by the west of Anhui province and the southeast of the Henan province, with an increase of about 5–10 mm, while the west of Shandong province and Jiangsu province show the lowest change in Rx1d. (3) Changes in Rx1d under the 2.0 °C warming scenario are higher than those under the 1.5 °C warming scenario for most areas, with the highest increase of >5 mm occurring in the south and east of the river basin, except for some parts of western Shandong province.
Spatially, the Rr50 over the Huai River basin decreases from southeast to northwest, with the highest of about 2 d occurring in the east of Jiangsu and the lowest of about 0.6 d occurring in Anhui, Henan and the west of Shandong province. It can be seen from Figure 9d that (1) under the 1.5 °C warming scenario, changes in Rr50 tend to decrease from north to south with the largest increase of about 0.2 d occurring in the central and north of the basin. In the south of Anhui and Jiangsu provinces, changes in Rr50 are negative, which shows Rr50 under the 1.5 °C warming scenario being less than that in the baseline. (2) Under the 2.0 °C warming scenario, the east of Shandong province shows the largest increase in Rr50 of more than 0.4 d, while that in the middle and northern parts of the Huai River basin show an increase of 0.1–0.3 d. For the south of Jiangsu province, Rr50 under the 2.0 °C warming scenario is likely less than that in the baseline period.
During the past period, storm days in the south and southeast of the Huai River basin are higher than that in the other areas of the basin, indicating a higher flood pressure in this area. However, under global warming, the increase in storm days in the northern part of the Huai River basin is higher than the other areas, which indicates that north Jiangsu and south Shandong in the Huai River basin will probably face a higher pressure of flood threat than before. The flood threat will likely cover the whole Huai River basin under 1.5 and 2.0 °C global warming. Flood control will not only focus on the local scale, but also extend to the whole Huai River basin.
4. Discussion
4.1. Extreme Rainfall Indices
The Huai River basin is situated in a transitional climatic zone, from the arid climate of North China to the humid climate of South China, in which the climate is highly influenced by Asian Monsoon. More than 70% of precipitation is concentrated in the flood season from June to September, with the most of high intensity rainstorms usually occurring in this period. As a result, the river basin is frequently hit by extraordinary floods induced by extreme rainstorms [42], thus leading to huge economic losses. Changes in extreme rainfall have therefore attracted attention from the central government and local communities.
According to the definition of extreme rainfall (https://public.wmo.int/en/resources/standards-technical-regulations, accessed on 23 January 2022), there are many extreme rainfall indices used in the literature [43,44,45,46]. However, annual precipitation, total precipitation with daily precipitation ≥ 95% quantile value, maximum daily precipitation in a year, and rain days with daily precipitation ≥ 50 mm are the most effective indices linked with river basin floods directly. These indices have been widely applied to investigate changes in rainfall extremes in China, as well as in the other countries of the world [8,9,10,11,24,47]. We therefore employed the four extreme rainfall indices to detect the variation trend of climatic extremes in the Huai River basin.
4.2. GCMs Projections and Uncertainty
In order to investigate future climate change and its potential effects, GCMs are believed to be the most powerful tool to project the future climate [17,18]. However, not all GCMs can be used for a specific area because different GCMs have different regional suitability [19,48]. It is of critical importance to select suitable GCMs to study river basins. Wang et al. (2016) and Su et al. (2020) evaluated the suitability of CMIP5-GCMs and CMIP6-GCMs, and ranked the performance of multiple GCMs that have been applied to China [28,32]. The evaluation results suggested that the GCMs used in this study are more suitable to east of China than other GCMs. Even though the selected GCMs have good suitability to the Huai River basin, Uncertainty is still a big issue in climate change studies as different GCMs project different results, particularly for rainfall [49,50,51].
IPCC issued three scenarios of SRES (Special Report on Emissions Scenarios), RCPs (Representative Concentration Pathways), and SSPs (Shared Socioeconomic Pathways) which have been used for climate projection [52,53]. Most of previous studies of climate change and its impact mainly focus on future variation trends of temperature, precipitation and water resources [54,55,56]. Both this study and previous studies indicate temperature over the Huai River will continue to rise significantly, while precipitation was projected to increase for most of GCMs. Moreover, there exists a difference in the magnitude of projections of temperature and precipitation, even if the same GCMs were adopted. The use of multiple GCMs projections rather a single one is encouraged for the purpose of eliminating uncertainty in climate change studies [40,57]. Quartile analysis and ensemble mean could provide much more useful information for decision making based on multiple projection members [58,59] and was therefore adopted in this study.
4.3. Historical and Future Trend in Extreme Rainfall Indices
IPCC-reported extreme events will likely increase with global warming [2,3,39]. Increases in extreme rainfall have also been observed in most areas of China [8,11,12]. The observation of rainfall and its extremes in the Huai River was also detected to increase in most previous studies [10,42,60]. However, variation in extreme rainfall indices was detected to decrease insignificantly in this study, although temperature maintained a constant rising trend in a same time span. Compared with previous studies, tendency detection of extreme rainfall indices in this study is based on a data series from 1995 to 2014, which is much shorter than that in previous studies. The short data series used is the reason for the difference in trend detection results. Moreover, we compared the mean value of extreme rainfall indices from 1995 to 2014 with those in previous studies, in which a longer data series starting from 1960 was used [60,61], and found the mean values in this study are higher than that in previous studies, which could illustrate a detectable increase in extreme rainfall indices if a longer data series is adopted, and imply consistency in this study and previous studies.
Most previous studies on future extreme rainfall projections were based on scenarios of SRES and RCPs [21,33,34,62], and the projected extreme rainfall will likely increase in the coming decades, which is consistent with this study, although there exists a difference in magnitude of rainfall change. Global warming by 1.5 °C and 2.0 °C are two targets of global communities to limit global temperature rise. Although there are numerous studies on 1.5 °C and 2.0 °C global warming and its impacts [28,30,31,32], there are few studies that focus on the change in extreme rainfall over the Huai River basin under 1.5 °C and 2.0 °C warming. Our study shows that extreme rainfall would likely experience a certain increase, even if the increase in global surface temperature was limited to below 1.5 °C and 2.0 °C. Moreover, extreme rainfall will likely extend to a larger scale area, even to the whole Huai River basin. To cope with such a situation, particularly flooding induced by changes in extreme rainfall, both structural measures (e.g., reservoirs and detention zone construction) and non-structural measures (e.g., building early warning and flood forecasting systems) have been suggested for use in the planning of flood control and Huai River basin management.
5. Conclusions
This study analyzed the historical variation of four extreme rainfall indices during the baseline period of 1995–2014 and investigated the changes in these indices under 1.5 °C and 2.0 °C, relative to that in baseline. We concluded that:
- (1)
- During the baseline period, temperature over the Huai River basin presented a significant rising trend, while the four extreme rainfall indices exhibited insignificant decreasing trends. From 2015 to 2100, temperature will likely continue to rise significantly, and the extreme rainfall indices were projected to increase significantly under all four future climates scenarios, with the exception of Rx1d under scenarios SSP1-2.6 and SSP3-7.0.
- (2)
- The time spans of 1.5 °C and 2.0 °C global warming will likely occur in the 2030s and 2050s. In comparison with the baseline period, AP, R95P, Rx1d and Rr50 over the Huai River basin will likely increase by 4.6%, 5.7%, 6.2% and 13.4% under the warming scenario of 1.5 °C, while they will probably increase by 7.3%, 7.4%, 10.9% and 19.0%, respectively, under 2.0 °C global warming.
- (3)
- The spatial patterns of changes in extreme rainfall i under the 1.5 °C and 2.0 °C warming scenarios are generally similar. For all four extreme rainfall indices, changes tend to decrease from north to south and from west to east, which means flood risk induced by global warming will probably extend to the whole Huai River basin.
Global warming is evident during the last few decades. Although the great efforts made globally might mitigate climate change to some extent, global surface temperature, as well as climate extremes, will likely continue to increase in the coming decades. It is therefore essential to adapt to climate change, particularly for areas sensitive and vulnerable to climate change, such as the Huai River basin.
Author Contributions
Y.W. (Yueyang Wang): data curation, formal analysis, and writing—original draft preparation; Y.W. (Yanjun Wang) and Z.B.: Conceptualization, methodology, and funding acquisition; Y.W. (Yan Wang): writing—review and editing; Q.J. and J.J.: software, supervision, and project administration. All authors have read and agreed to the published version of the manuscript.
Funding
This research was funded by the National Natural Science Foundation of China (Grant nos. 41830863, 51879162, 52121006), the National Key Research and Development Programs of China (2021YFC3200201), and the Belt and Road Special Foundation of the State Key Laboratory of Hydrology-Water Resources and Hydraulic Engineering (2021490211, 2020nkzd01).
Institutional Review Board Statement
Not applicable.
Informed Consent Statement
Not applicable.
Data Availability Statement
The data presented in this study are available on request from the corresponding author.
Conflicts of Interest
The authors declare no conflict of interest.
References
- Ullah, I.; Saleem, F.; Iyakaremye, V.; Yin, J.; Ma, X.; Syed, S.; Hina, S.; Asfaw, T.; Omer, A. Projected changes in socioeconomic exposure to heatwaves in South Asia under changing climate. Earth’s Future 2022, 10, e2021EF002240. [Google Scholar] [CrossRef]
- IPCC. AR5 Climate Change 2013: The Physical Science Basis Contribution of Working Group I to the Fifth Assessment Report of the Intergovernmental Panel on Climate Change; Cambridge University Press: Cambridge, UK, 2013. [Google Scholar]
- IPCC. AR6 Climate Change 2021: The Physical Science Basis. Contribution of Working Group I to the Sixth Assessment Report of the Intergovernmental Panel on Climate Change; Cambridge University Press: Cambridge, UK, 2021. [Google Scholar]
- Gu, X.; Ye, L.; Xin, Q.; Zhang, C.; Zeng, F.; Sofia, D.; Papalexiou, S. Extreme Precipitation in China: A Review on Statistical Methods and Applications. Adv. Water Resour. 2022, 163, 104144. [Google Scholar] [CrossRef]
- Mizutori, M.; Guha, D. The Human Cost of Disasters: An Overview of the Last 20 Years (2000–2019). CRED & UNDRR 2020: 6–7. Available online: https://www.preventionweb.net/publication/human-cost-disasters-overview-last-20-years-2000-2019 (accessed on 23 January 2022).
- He, B. Thoughts and suggestions on the investigation of “7·20” extreme rainstorm disaster of four cities in mountainous area of Zhengzhou in Henan Province in 2021. China Flood Drought Manag. 2022, 32, 37–40, 51. [Google Scholar]
- Ministry of Emergency Management of China (MEM). Annual Report of Natural Hazards in 2021. 2022. Available online: https://www.mem.gov.cn/xw/yjglbgzdt/202201/t20220123_407204.shtml (accessed on 23 January 2022).
- Zhang, Q.; Singh, V.; Li, J.; Jiang, F.; Bai, Y. Spatio-temporal variations of precipitation extremes in Xinjiang, China. J. Hydrol. 2012, 434–435, 7–18. [Google Scholar]
- Song, X.; Zhang, J.; Kong, F. Probability distribution of extreme precipitation in Beijing based on extreme value theory. Sci. Sin. 2018, 48, 639–650. [Google Scholar] [CrossRef][Green Version]
- Wang, H.; Pan, Y.; Chen, Z. Spatial and temporal patterns of temperature and precipitation extremes in the Huai River Basin, China in 1960–2014. Sci. Geogr. Sin. 2017, 37, 1900–1908. [Google Scholar] [CrossRef]
- Zhang, D.; Yan, D.; Wang, Y.; Lu, F.; Wu, D. Changes in extreme precipitation in the Huang-Huai-Hai River basin of China during 1960–2010. Theor. Appl. Climatol. 2015, 120, 195–209. [Google Scholar]
- Zhang, W.; Zhou, T. Significant increases in extreme precipitation and the associations with global warming over the global land monsoon regions. J. Clim. 2019, 32, 8465–8488. [Google Scholar] [CrossRef]
- Li, J.; Yu, R.; Sun, W. Duration and seasonality of the hourly extreme rainfall in the central-eastern part of China. Acta Meteorol. Sin. 2013, 27, 799–807. [Google Scholar] [CrossRef]
- Chen, H.; Sun, J. Changes in climate extreme events in China associated with warming. Int. J. Climatol. 2015, 35, 2735–2751. [Google Scholar] [CrossRef]
- Wang, L.; Yao, Z.; Jiang, L.; Wang, R.; Wu, S.; Lin, Z. Changes in Climate extremes and catastrophic events in the Mongolian Plateau from 1951 to 2012. J. Appl. Meteorol. Climatol. 2016, 55, 1169–1182. [Google Scholar] [CrossRef]
- Wang, H.; Asefa, T.; Erkyihun, S. Inter annual variabilities of the summer and winter extreme daily precipitation in the Southeastern United States. J. Hydrol. 2021, 603, 127013. [Google Scholar] [CrossRef]
- Taylor, K.; Stouffer, R.; Meehl, G. An overview of CMIP5 and the experiment design. Bull. Am. Meteorol. Soc. 2012, 93, 485–498. [Google Scholar] [CrossRef]
- Eyring, V.; Bony, S.; Meehl, G.; Senior, C.; Stevens, B.; Stouffer, R.; Taylor, K. Overview of the Coupled Model Intercomparison Project Phase 6 (CMIP6) experimental design and organization. Geosci. Model Dev. 2016, 9, 1937–1958. [Google Scholar] [CrossRef]
- Hamed, M.; Nashwan, M.; Shahid, S. Intercomparison of historical simulation and future projections of rainfall and temperature by CMIP5 and CMIP6 GCMs over Egypt. Int. J. Climatol. 2021, 42, 4316–4332. [Google Scholar] [CrossRef]
- Fu, G.; Charles, S.; Yu, J.; Liu, C. Decadal climatic variability, trends, and future scenarios for the north china plain. J. Clim. 2008, 22, 2111–2123. [Google Scholar] [CrossRef]
- Du, H.; Xia, J.; Zeng, S.; She, D.; Liu, J. Variations and statistical probability characteristic analysis of extreme precipitation events under climate change in Haihe river basin, china. Hydrol. Processes 2014, 28, 913–925. [Google Scholar] [CrossRef]
- Chen, H. Projected change in extreme rainfall events in China by the end of the 21st century using CMIP5 models. Chin. Sci. Bull. 2013, 58, 1462–1472. [Google Scholar] [CrossRef]
- Gao, X.; Shi, Y.; Zhang, D.; Wu, J.; Giorgi, F.; Ji, Z.; Wang, Y. Uncertainties in monsoon precipitation projections over China: Results from two high-resolution RCM simulations. Clim. Res. 2012, 52, 213–226. [Google Scholar] [CrossRef]
- Gouda, K.; Nahak, S.; Goswami, P. Evaluation of a GCM in seasonal forecasting of extreme rainfall events over continental India. Weather Clim. Extrem. 2018, 21, 10–16. [Google Scholar] [CrossRef]
- Yakaremye, V.; Zeng, G.; Yang, X.; Zhang, G.; Ayugi, B. Increased high-temperature extremes and associated population exposure in africa by the mid-21st century. Sci. Total Environ. 2021, 790, 148162. [Google Scholar] [CrossRef]
- IPCC. Global Warming of 1.5 °C; Cambridge University Press: Cambridge, UK, 2018. [Google Scholar]
- Betts, R.; Alfieri, L.; Bradshaw, C.; Caesar, J.; Feyen, L.; Friedlingstein, P.; Gohar, L.; Koutroulis, A.; Lewis, K.; Morfopoulos, C.; et al. Changes in climate extremes, fresh water availability and vulnerability to food insecurity projected at 1.5 °C and 2 °C global warming with a higher-resolution global climate model. Philos. Trans. R. Soc. A Math. Phys. Eng. Sci. 2018, 376, 20160452. [Google Scholar] [CrossRef]
- Su, B.; Huang, J.; Fischer, T.; Wang, Y.; WKundzewicz, Z.; Zhai, J.; Sun, H.; Wang, A.; Zeng, X.; Wang, G.; et al. Drought losses in China might double between the 1.5 °C and 2 °C warming. Proc. Natl. Acad. Sci. USA 2018, 115, 10600–10605. [Google Scholar] [CrossRef]
- UNFCCC. Paris Agreement. 2015. Available online: https://unfccc.int/sites/default/files/english_paris_agreement.pdf (accessed on 21 May 2019).
- Chen, J. Assessing changes of river discharge under global warming of 1.5 °C and 2 °C in the upper reaches of the Yangtze River Basin: Approach by using multiple GCMs and hydrological models. Quat. Int. 2017, 453, 63–73. [Google Scholar] [CrossRef]
- Zhai, R.; Tao, F.; Xu, Z. Spatial-temporal changes in runoff and terrestrial ecosystem water retention under 1.5 and 2 ℃ warming scenarios across China. Earth Syst. Dyn. 2018, 9, 717–738. [Google Scholar] [CrossRef]
- Wang, Y.; Wang, A.; Zhai, J.; Tao, H.; Jiang, T.; Su, B.; Yang, J.; Wang, G.; Liu, Q.; Gao, C.; et al. Tens of thousands additional deaths annually in cities of China between 1.5 °C and 2.0 °C warming. Nat. Commun. 2019, 10, 3376. [Google Scholar]
- Wang, G.; Zhang, J. Variation of water resources in the Huang-Huai-Hai areas and adaptive strategies to climate change. Quat. Int. 2015, 380–381, 180–186. [Google Scholar] [CrossRef]
- Dai, C.; Qin, X.; Lu, W.; Huang, Y. Assessing adaptation measures on agricultural water productivity under climate change: A case study of Huai River Basin, China. Sci. Total Environ. 2020, 721, 137777. [Google Scholar]
- Bian, G.; Zhang, J.; Chen, J.; Song, M.; He, R.; Liu, C.; Liu, Y.; Bao, Z.; Lin, Q.; Wang, G. Projecting Hydrological Responses to Climate Change Using CMIP6 Climate Scenarios for the Upper Huai River Basin, China. Front. Environ. Sci. 2021, 9, 602. [Google Scholar] [CrossRef]
- Mann, H. Nonparametric tests against trend. Econometrica 1945, 13, 245–259. [Google Scholar]
- Wang, G.; Yan, X.; Zhang, J.; Liu, C.; Jin, J.; Bao, Z.; Liu, Y. Detecting evolution trends in the recorded runoffs from the major rivers in China during 1950–2010. J. Water Clim. Chang. 2013, 4, 252–264. [Google Scholar] [CrossRef]
- Gemmer, M.; Fischer, T.; Jiang, T.; Su, B.; Liu, L. Trends in Precipitation Extremes in the Zhujiang River Basin, South China. J. Clim. 2011, 24, 750–761. [Google Scholar] [CrossRef]
- IPCC. Managing the Risks of Extreme Events and Disasters to Advance Climate Change Adaptation; Cambridge University Press: Cambridge, UK, 2012. [Google Scholar]
- Cannon, A. Selecting GCM Scenarios that Span the Range of Changes in a Multimodel Ensemble: Application to CMIP5 Climate Extremes Indices. J. Clim. 2015, 28, 1260–1267. [Google Scholar] [CrossRef]
- Dong, T.; Dong, W. Evaluation of extreme precipitation over Asia in CMIP6 models. Clim. Dyn. Obs. Theor. Comput. Res. Clim. Syst. 2021, 57, 1751–1769. [Google Scholar] [CrossRef]
- An, G.; Hao, Z. Variation of precipitation and streamflow in the upper and middle Huaihe River Basin, China, from 1959–2009. J. Coast. Res. 2017, 80, 69–79. [Google Scholar] [CrossRef]
- Alexander, L.; Zhang, X.; Peterson, T.; Caesar, J.; Gleason, B.; Klein Tank, A.; Haylock, M.; Collins, D.; Trewin, B.; Rahimzadeh, F. Global observed changes in daily climatic extremes of temperature and precipitation. J. Geophys. Res. 2006, 111, D05109. [Google Scholar] [CrossRef]
- Jones, P.; Horton, E.; Folland, C.; Hulme, M.; Parker, D.; Basnett, T. The use of indices to identify changes in climatic extremes. Weather. Clim. Extremes 1999, 42, 131–149. [Google Scholar] [CrossRef]
- Zhai, P.; Zhang, X.; Wan, H.; Pan, X. Trends in Total Precipitation and Frequency of Daily Precipitation Extremes over China. J. Clim. 2005, 18, 1096–1108. [Google Scholar] [CrossRef]
- Shi, J.; Cui, L.; Wang, J.; Du, H.; Wen, K. Changes in the temperature and precipitation extremes in China during 1961–2015. Quat. Int. 2019, 527, 64–78. [Google Scholar] [CrossRef]
- Peterson, T.; Taylor, M.; Demeritte, R.; Duncombe, D.; Burton, S.; Thompson, F.; Porter, A.; Mercedes, M.; Villegas, E.; Fils, R.; et al. Recent changes in climate extremes in the Caribbean region. J. Geophys. Res. Atmos. 2002, 107, 9–16. [Google Scholar] [CrossRef]
- Wang, L.; Zhang, J.; Shu, Z.; Wang, Y.; Bao, Z.; Liu, C.; Zhou, X.; Wang, G. Evaluation of the ability of CMIP6 global climate models to simulate precipitation in the Yellow River Basin, China. Front. Earth Sci. 2021, 9, 744462190. [Google Scholar] [CrossRef]
- Wang, L.; Ranasinghe, R.; Maskey, S.; van Gelder, P.H.A.J.M.; Vrijling, J.K. Comparison of empirical statistical methods for downscaling daily climate projections from cmip5 GCM: A case study of the Huai River Basin, China 2016. Int. J. Climatol. 2015, 36, 145–164. [Google Scholar] [CrossRef]
- Thompson, J.; Green, A.; Kingston, D.; Gosling, S. Assessment of uncertainty in river flow projections for the mekong river using multiple gcms and hydrological models. J. Hydrol. 2013, 486, 1–30. [Google Scholar] [CrossRef]
- Lee, T.; Galavi, H.; Huang, Y. Uncertainty in climate change impact studies: A review of developments and limitations. Int. J. Clim. Chang. Impacts Responses 2014, 6, 1–10. [Google Scholar]
- IPCC. Special Report on Emissions Scenarios; Cambridge University Press: Cambridge, UK, 2000. [Google Scholar]
- Van Vuuren, D.; Edmonds, J.; Kainuma, M.; Riahi, K.; Thomson, A.; Hibbard, K.; Hurtt, G.; Keam, T.; Krey, V.; Lamarque, J.; et al. Representative concentration pathways: An overview. Clim. Chang. 2011, 109, 5–31. [Google Scholar] [CrossRef]
- IPCC. AR4 Climate Change 2007: Impact, Adaptation and Vulnerability; Cambridge University Press: Cambridge, UK, 2007. [Google Scholar]
- IPCC. AR5 Climate Change 2014: Impact, Adaptation and Vulnerability; Cambridge University Press: Cambridge, UK, 2014. [Google Scholar]
- IPCC. AR6 Climate Change 2022: Impact, Adaptation and Vulnerability; Cambridge University Press: Cambridge, UK, 2022. [Google Scholar]
- Qiao, C.; Ning, Z.; Wang, Y.; Sun, J.; Lin, Q.; Wang, G. Impact of Climate Change on Water Availability in Water Source Areas of the South-to-North Water Diversion Project in China. Front. Earth Sci. 2021, 9, 747429. [Google Scholar] [CrossRef]
- Yang, C.; Yu, Z.; Hao, Z.; Zhang, J.; Zhu, J. Impact of climate change on flood and drought events in Huaihe River Basin, China. Hydrol. Res. 2012, 43, 14–22. [Google Scholar] [CrossRef]
- Wang, J.; Wang, G.; Elmahdi, A.; Bao, Z.; Yang, Q.; Shu, Z.; Song, M. Comparison of hydrological model ensemble forecasting based on multiple members and ensemble methods. Open Geosci. 2021, 13, 401–415. [Google Scholar] [CrossRef]
- Xia, J.; She, D.; Zhang, Y.; Du, H. Spatio-temporal trend and statistical distribution of extreme precipitation events in Huaihe River Basin during 1960–2009. J. Geogr. Sci. 2012, 22, 195–208. [Google Scholar] [CrossRef]
- Jin, H.; Chen, X.; Zhong, R.; Pan, Y.; Zhao, T.; Liu, Z.; Tu, X. Spatiotemporal distribution analysis of extreme precipitation in the Huaihe River Basin based on continuity. Nat. Hazards 2022. [Google Scholar] [CrossRef]
- Chen, C.; Shi, P.; Qu, S. Spatio-temporal trend of extreme precipitation in Huaihe River basin based on the future climate model. J. Xi’an Univ. Technol. 2019, 35, 494–500. [Google Scholar] [CrossRef]
Publisher’s Note: MDPI stays neutral with regard to jurisdictional claims in published maps and institutional affiliations. |
© 2022 by the authors. Licensee MDPI, Basel, Switzerland. This article is an open access article distributed under the terms and conditions of the Creative Commons Attribution (CC BY) license (https://creativecommons.org/licenses/by/4.0/).