Article

2022: An Unprecedentedly Rainy Early Summer in Northeast China

1
Regional Climate Center of Shenyang, Liaoning Provincial Meteorological Administration, Shenyang 110016, China
2
Key Opening Laboratory for Northeast China Cold Vortex Research, China Meteorological Administration, Shenyang 110016, China
3
Laboratory for Climate Studies, National Climate Center, China Meteorological Administration, Beijing 100081, China
4
Collaborative Innovation Centre on Forecast and Evaluation of Meteorological Disasters, Nanjing University of Information Science and Technology, Nanjing 210066, China
5
Hunan Meteorological Observatory, Hunan Provincial Meteorological Administration, Changsha 410118, China
*
Author to whom correspondence should be addressed.
Atmosphere 2022, 13(10), 1630; https://doi.org/10.3390/atmos13101630
Submission received: 7 September 2022 / Revised: 29 September 2022 / Accepted: 30 September 2022 / Published: 7 October 2022

Abstract

:
In the early summer (June) of 2022, the spatial mean precipitation in northeast China (NEC) was 62% higher than normal and broke the historical record since 1951. Based on the precipitation data of 245 meteorological stations in NEC and the National Centers for Environmental Prediction/National Center for Atmospheric Research (NCEP/NCAR) reanalysis, this paper analyzes the role of large-scale circulation and sea-surface temperature (SST) associated with anomalous precipitation over NEC in June using singular value decomposition (SVD), correlation analysis, regression analysis, and composite analysis methods, and further investigates the possible cause of the abnormal precipitation in June 2022. Results show that the northeast China cold vortex (NCCV) accompanying the blocking high in the Okhotsk Sea (BHOS) has been the primary mid-to-high latitude atmospheric circulation pattern affecting NEC precipitation in June since 2001. This circulation pattern is closely related to the tripole SST pattern over the North Atlantic (NAT) in March. In June 2022, the NAT SST anomaly in March stimulates eastward-propagating wave energy, resulting in the downstream anomalous circulation pattern in which the NCCV cooperates with the BHOS in the mid-high latitudes of East Asia. Under this background atmospheric circulation favorable for precipitation, the Kuroshio region SST anomaly in June led to a more northward and stronger anomalous anticyclone in the northwestern Pacific through local air–sea interaction, which provides more sufficient water vapor for NEC, resulting in unprecedented precipitation in June 2022.

1. Introduction

The average precipitation in northeast China (NEC) in the early summer (June) of 2022 was 144.9 mm, which is 60% higher than that of normal years (89.5 mm) and the highest value in available historical records since 1951. Meteorological disasters such as rainstorms, floods, hail, and strong winds have profound societal and economic impacts on NEC.
NEC is in the mid-high latitude monsoon region of East Asia. In early summer, precipitation in NEC is simultaneously affected by atmospheric circulation anomalies in mid-high latitudes, and the associated mechanism is complicated. Previous studies show that early summer precipitation in NEC is mainly affected by the northeast China cold vortex (NCCV) and blocking high in the mid-high latitudes. When the NCCV and blocking high appear simultaneously with sufficient water-vapor transport from the south, NEC tends to have more precipitation in early summer [1,2,3]. The changes in critical circulation systems that affect the NEC climate, such as the NCCV, have been found to be linked to sea-surface temperature anomalies in the North Atlantic. Zuo et al. [4] revealed the possible mechanism of the tripole SST in the North Atlantic affecting the East Asian summer monsoon. Fang et al. [3,5] pointed out that the North Atlantic SST tripole pattern in spring may stimulate a Rossby wave train that propagates downstream along the westerly jet stream through the air–sea interaction, leading to anomalous NCCV and blocking high in early summer, thereby affecting NEC precipitation. Lu et al. [6] and Zhu et al. [7] also found a close relationship between North Atlantic SST and the spring precipitation in NEC.
This paper attempts to analyze the influences of the SST forcing on the atmospheric circulation in the mid-high latitudes in the period of June and understand the causes of the unprecedented precipitation in the NEC in June 2022. The result obtained can provide a scientific basis for operational short-term climate prediction. The remainder of this paper is organized as follows. Section 2 describes the data and methods used in this study. Section 3 is a overview of precipitation in NEC in June 2022. Section 4 analyses the atmospheric circulation and SST factors influencing NEC precipitation in June. Section 5 discusses possible causes of anomalous precipitation in June 2022. Finally, the findings of the present study are summarized and discussed in Section 6.

2. Data and Methods

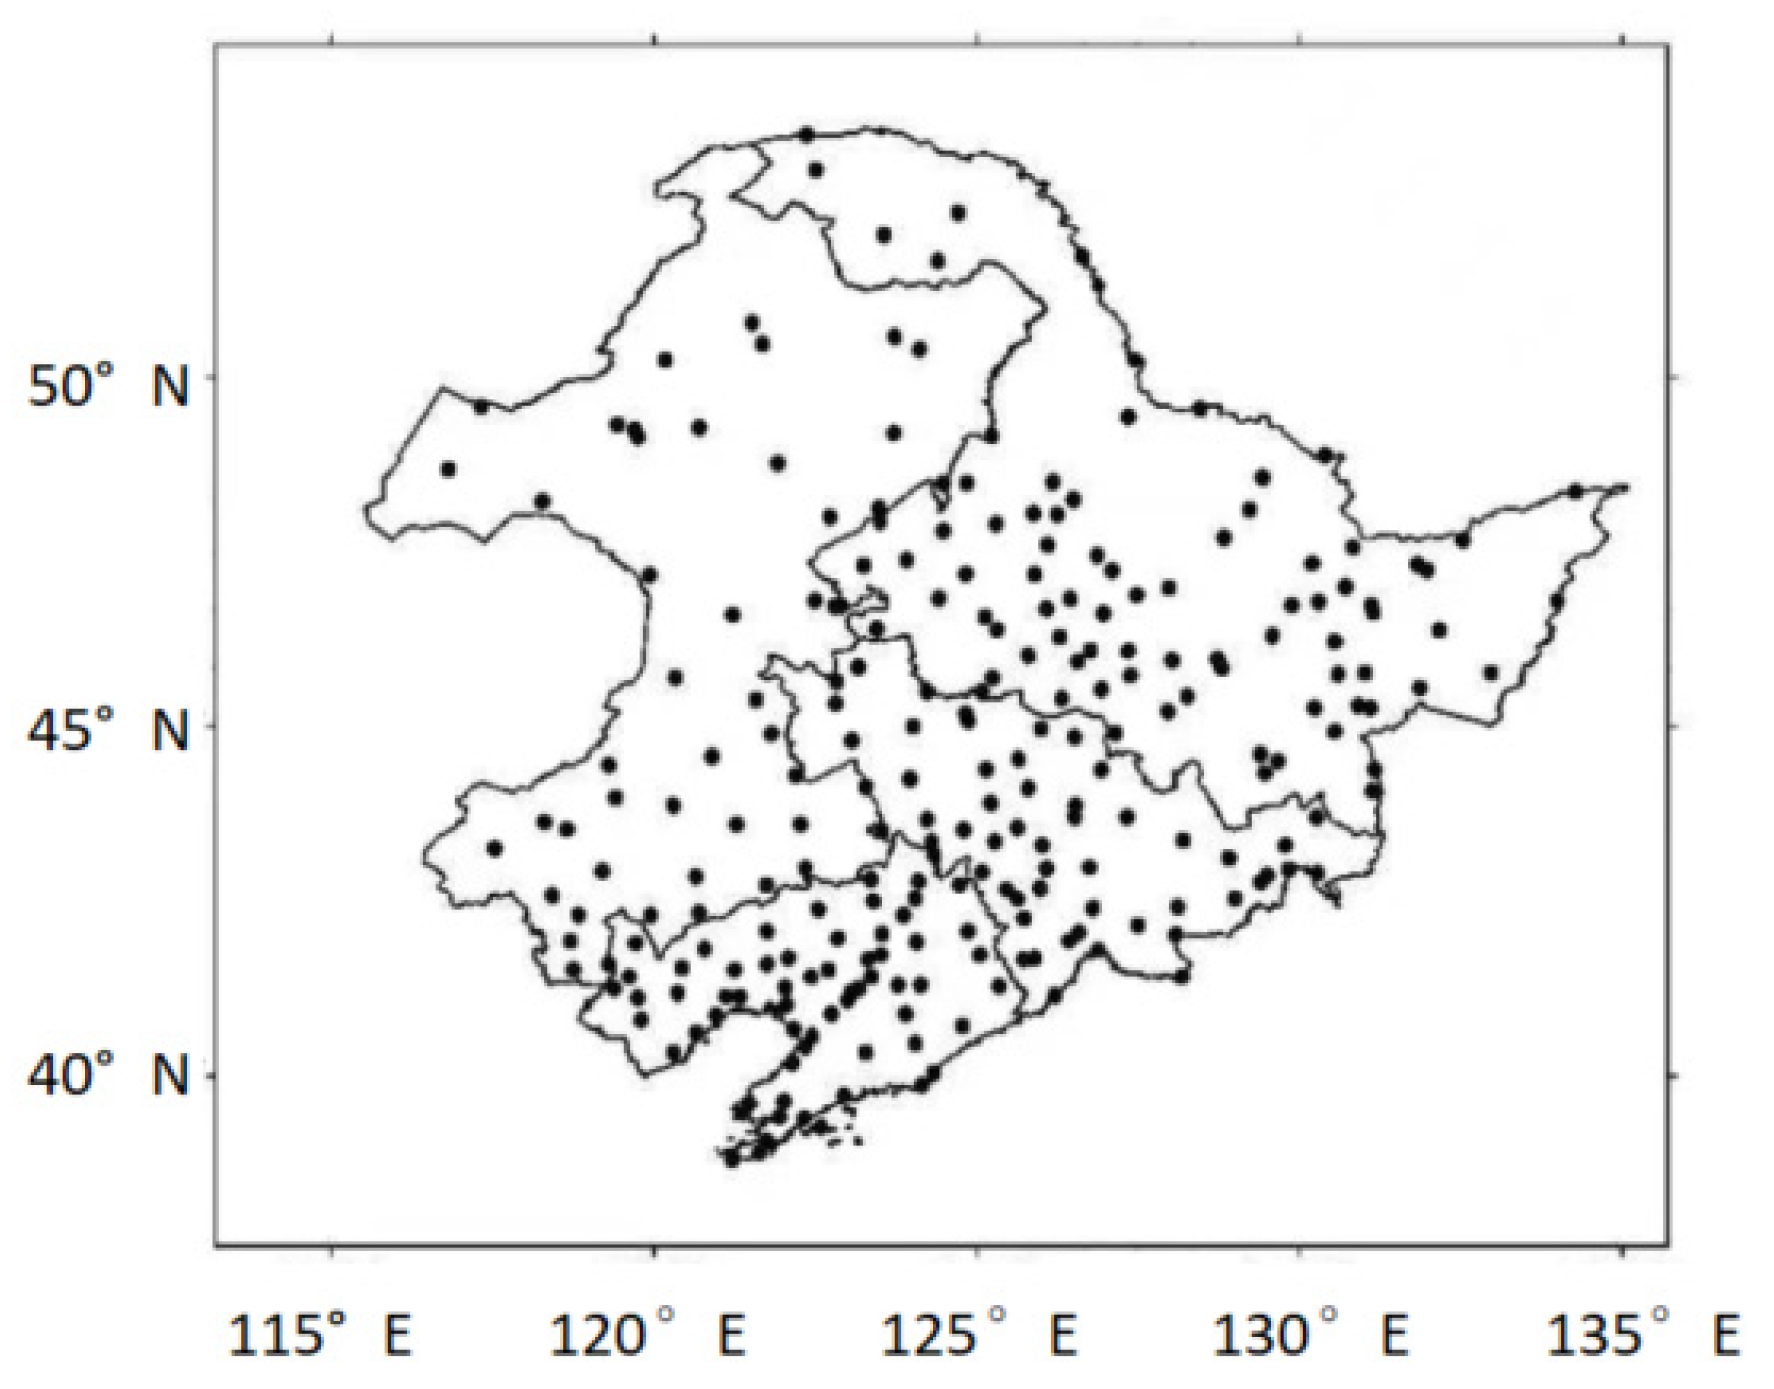
Daily precipitation data from 245 meteorological stations over NEC (Figure 1), including the provinces of Heilongjiang, Jilin, Liaoning, and eastern Inner Mongolia, of the Chinese Meteorological Administration (CMA) from 1961 to 2022 were used to describe the variability in precipitation over NEC. Monthly geopotential height, wind field, vertical pressure velocity, and specific humidity with 2.5° × 2.5° horizontal resolution were obtained from the National Centers for Environmental Prediction/National Center for Atmospheric Research (NCEP/NCAR) reanalysis [8]. Sea-surface temperature with 2° × 2° horizontal resolution was obtained from the National Oceanic and Atmospheric Administration Extended (NOAA) Reconstructed SST version 5 [9].
Statistical methods, including linear correlation analysis, singular value decomposition (SVD), regression analysis, and composite analysis methods, are also used. The statistical significance level is assessed using the two-tailed Student’s t-test.

3. An Unprecedentedly Rainy Early Summer in NEC in 2022

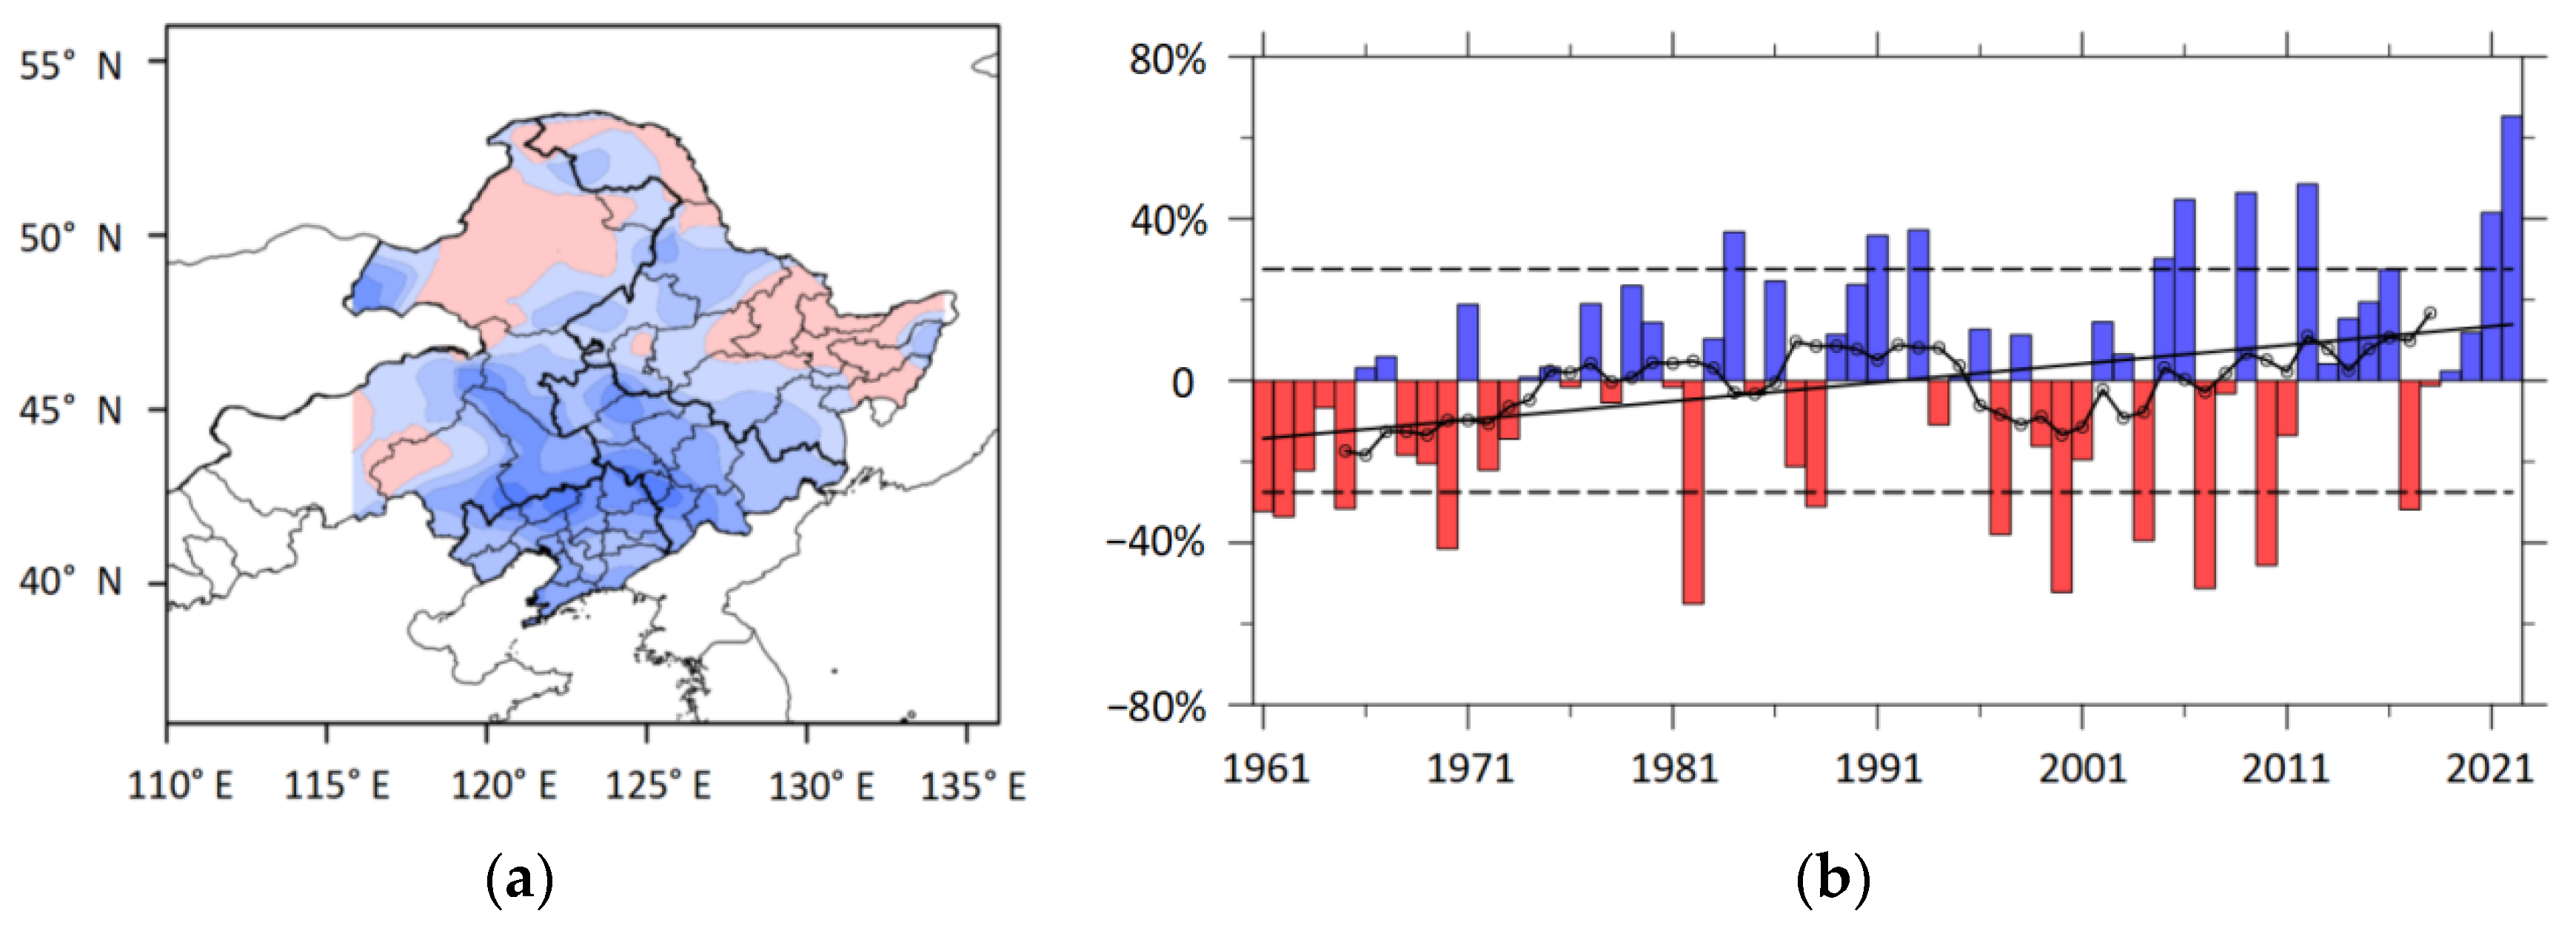
In June 2022, the spatial mean precipitation in NEC is 144.9 mm, which is 62% higher than normal and the highest value in available historical records since 1951. Among them, the average precipitation in June 2022 in Jilin and Liaoning Provinces broke through historical records. Figure 2a shows the spatial distribution of the anomaly percentage of precipitation in June 2022. Except for the northern region of NEC, positive precipitation anomalies generally prevail in the entire NEC, with a maximum precipitation center in the south-central NEC. The precipitation of many stations in June exceeds 350 mm, which is close to or even exceeds their mean total rainfall during the whole summer (including June, July and August). 
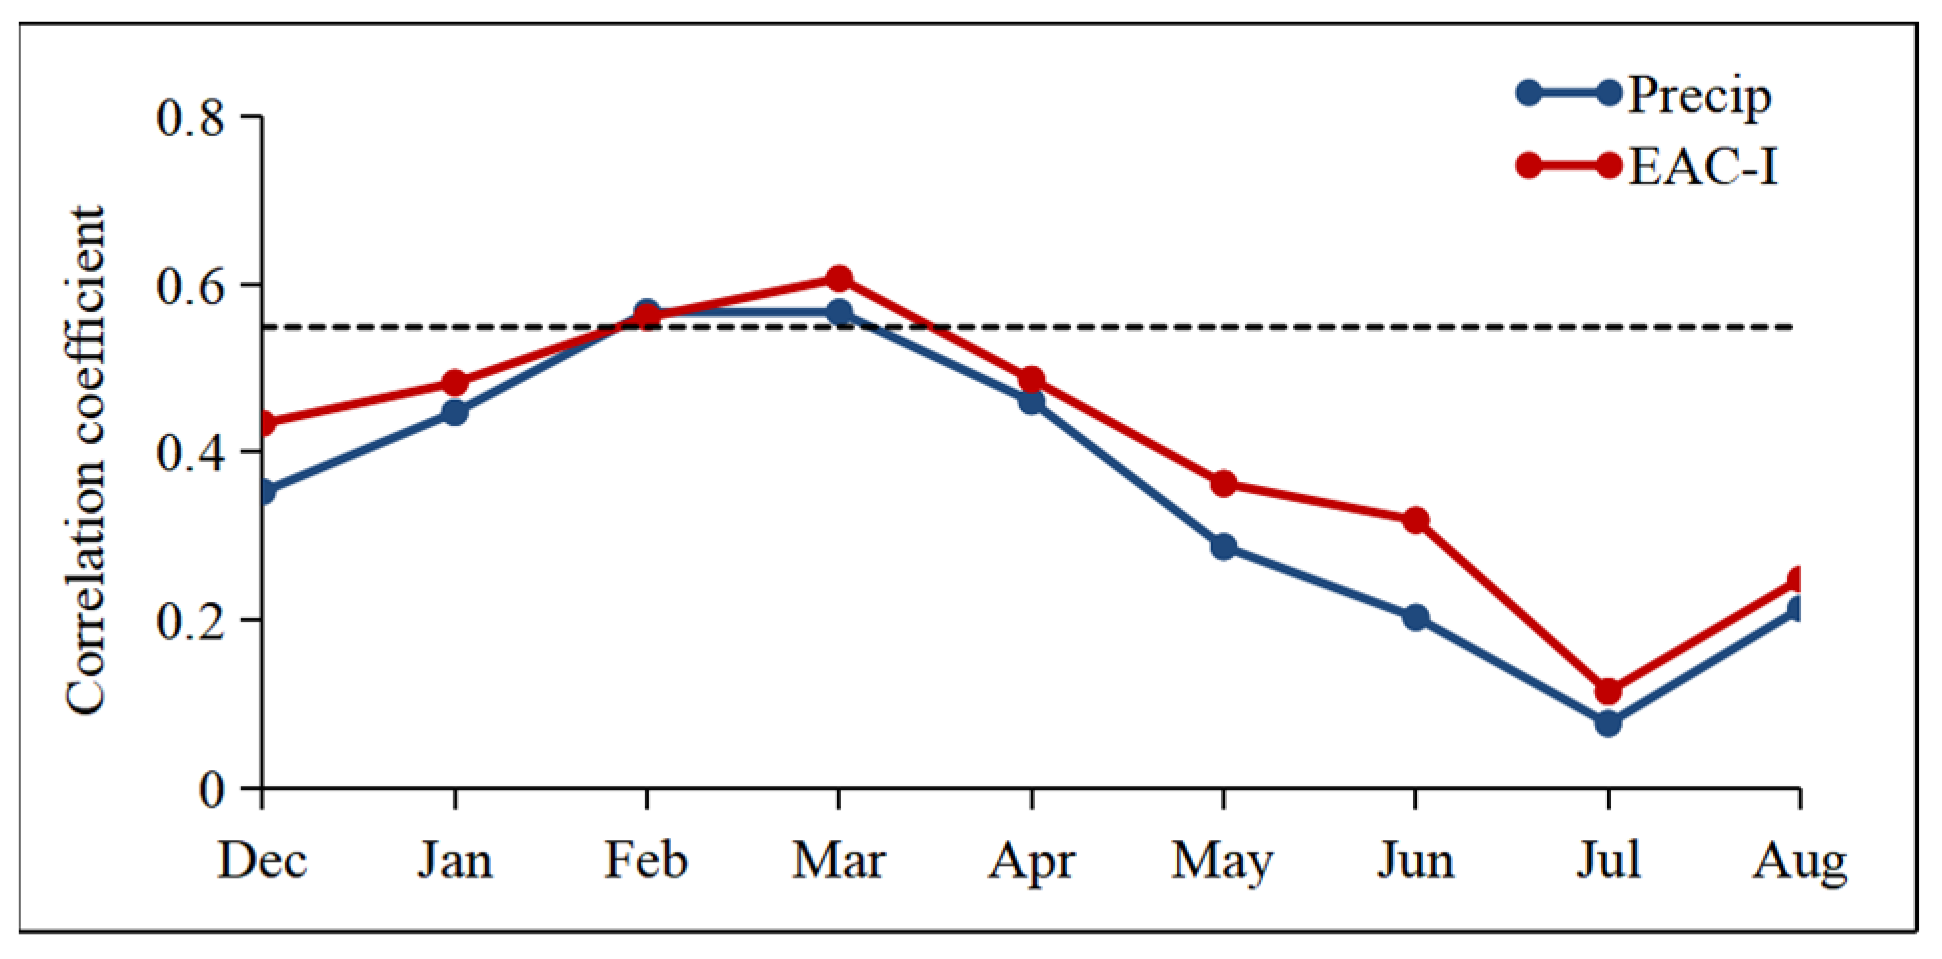
Figure 2b shows the time series of the percentage of NEC precipitation anomalies in June. It can be seen that the precipitation in June has shown a significant (p < 0.05) upward trend since 1961. Notable interdecadal variation in the precipitation in June of NEC can be found in its 9-year sliding mean time series. The values for the rainy years in June is obviously high since 2001, and the top five years for precipitation (2006, 2009, 2012, 2021, and 2022) occur in this period.

4. Factors Influencing the Precipitation in Early Summer in NEC

4.1. Anomalous Large-Scale Circulation

To analyze the large-scale circulation pattern associated with the precipitation anomaly in June in NEC, we adopt SVD analysis using NEC precipitation in June from 2001 to 2021 as the left field and the simultaneous 500 hPa geopotential height in the northern hemisphere Eurasian region as the right field. The leading mode of SVD analysis reveals the highly correlated areas between NEC precipitation and the large-scale geopotential height field in the northern hemisphere, reflecting the spatial structure of their mutual influence to a certain extent.
The leading mode obtained by SVD decomposition can explain 55.6% of the total covariance of NEC precipitation and the 500 hPa geopotential height in June, reflecting the primary relationship between the two fields. In comparison, the second and third mode explain 30.8% and 4.5% of the total covariance, respectively. The decomposition results have passed the significance test using the test of eigenvalue error range [10]. Meanwhile, the correlation coefficients of the left field and right field expansion coefficients for the leading mode and NEC precipitation in June reach 0.87 and 0.71, respectively, which is significant at the 99% confidence level and higher than the other two modes. Therefore, the left and right heterogeneous correlation fields corresponding to the leading mode are selected for further analysis. The first mode shows a regionally consistent positive anomaly in precipitation, similar to the precipitation anomaly in June 2022, with a slightly different meridional position of rainfall maximum (Figure 3a). The corresponding 500 hPa height field in NEC shows a significant negative anomaly (Figure 3b), corresponding to the apparent positive anomaly near the Okhotsk Sea and the subtropical region, consisting of the meridionally distributed positive-negative-positive pattern along the East Asian coast, which is the well-known EAP-type teleconnection wave train [11,12]. The correlation between NEC precipitation and the 500-hPa height field (Figure 3c) also shows the similar circulation characteristics of the NCCV and the blocking high in the Okhotsk Sea (BHOS) as in Figure 3b, which indicates that the configuration of the large-scale circulation is a typical circulation pattern favoring NEC precipitation in June.
To quantitatively analyze the relationship between the 500 hPa height and NEC precipitation in June, the early summer East Asia circulation index (EAC-I, see Table 1) was defined based on the distribution of the anomalous geopotential height in Figure 3b. The correlation coefficient between the EAC-I and the precipitation in June during 2001–2021 is 0.77, passing the 99% significance test. Figure 4 shows the 11-year sliding correlation between EAC-I and precipitation in June. It can be found that their correlation shows an increasing trend with significant correlations at a 90% confidence level after 2001. That is, the influence of the mid-to-high latitude EAC pattern with NCCV accompanying the BHOS on NEC precipitation in June has become more important in the past 20 years.
To further investigate the large-scale circulation configuration related to NEC precipitation in June, six positive years (2005, 2006, 2009, 2012, 2016, and 2021) of NEC precipitation in June 2001–2020 are selected, whose values of anomaly are greater than its standard deviation (Figure 2b). The composite difference of atmospheric circulation between the positive years and the climate average features positive geopotential height anomalies in the mid-high latitudes of the Eurasian continent, a blocking high center in the northern Okhotsk Sea, and negative geopotential height anomalies in NEC, corresponding to a strengthened NCCV (Figure 5a). This mid-high latitude atmospheric circulation pattern is consistent with the spatial distribution shown in Figure 3b,c, while the positive anomaly in the subtropic is statistically insignificant. For the composite difference of zonal winds at 200 hPa (Figure 5b), the subtropical westerly jet strengthens in the positive years. There is a positive vorticity anomaly to the north side of the westerly jet, which corresponds to high-level divergence and reinforces the ascending motion in the NEC. The anomalous vertical upward motion is conducive to forming and maintaining the northeast China cold vortex. The vertical velocity profile also shows that there is a notable deep ascending motion in NEC (35° N–55° N, Figure 5d). It can be seen from the vertically integrated water-vapor flux (Figure 5c) that there is a cyclonic water-vapor flux vector over NEC and an anticyclonic water-vapor flux vector over the Okhotsk Sea that corresponds to the NCCV and the BHOS at 500 hPa. The water vapor is mainly transported from the Sea of Japan and northern Pacific by the southern flank of NCCV and BHOC. Meanwhile, there is also an anticyclonic water-vapor flux vector over the northwestern Pacific with robust northward water-vapor transport to the north, but with less reach the NEC. That is, NEC precipitation in June in typical heavy rainfall years is more likely to be influenced by the westerly circulation system in mid-high latitudes.

4.2. SST Precursor Influencing the Early Summer Precipitation in NEC

Previous studies have shown that the influence of the North Atlantic Tripole (NAT) pattern of spring SST on the precipitation of the NCCV in June has strengthened since 2001 [3]. At the positive NAT phases, it is possible that the NAT SST forcing can emanate a Rossby wave train propagating downstream, leading to a circulation pattern in which the blocking high accompanied by the NCCV in the mid-high latitudes of East Asia, which is also a typical circulation pattern favoring NEC precipitation in June. Figure 6 shows the correlation distribution of the March SST and the June precipitation and EAC-I index in NEC. It can be seen that there is a significant tripole SST pattern in the North Atlantic with negative correlations in the tropical and subpolar gyre regions but positive correlations between them. The tripole SST signal peaks in early March and can last until June (figure omitted). The lead–lag correlations of the North Atlantic tripole SST index (NAT-I, Table 1) between the precipitation and the EAC-I in June are shown in Figure 7. The correlation between precipitation and EAC-I gradually strengthens from the previous winter, turns significant (p < 0.01) in February and March, peaks in March, and then weakens rapidly. Thus, the NAT-I in March is an important predictor for NEC precipitation in June and the associated anomalous circulation pattern.
To further verify the influence of the NAT SST anomaly in March on the key circulation pattern of NEC precipitation in June, Figure 8 shows the regressed 500 hPa wave activity flux and geopotential height anomalies in June against the NAT-I in March. There are distinct zonal wave trains and wave fluxes propagating downstream from the North Atlantic to the North Pacific. A significant negative geopotential height anomaly prevails in NEC and a significant positive anomaly occurs to its north side, corresponding to the strong NCCV and the blocking high, respectively. This is also consistent with the northeast China cold vortex and blocking high being deep systems. Meanwhile, the positive anomalies in the subtropical region denote an anticyclone in the northwestern Pacific. This shows that the NAT SST anomalies in March in its positive phases may induce local atmospheric circulation through diabatic heating, then stimulate the eastward-propagating Rossby wave [4]. This could exert an impact on the downstream atmospheric circulation anomaly in which the NCCV cooperates with the blocking high in mid-high latitudes of East Asia. The active cold air and the abundant water vapor from the northern Pacific in turn results in more precipitation in June in NEC. Therefore, the March NAT SST anomaly is an essential early oceanic forcing signal affecting NEC precipitation in June.

5. Possible Causes of Anomalous NEC Precipitation in June 2022

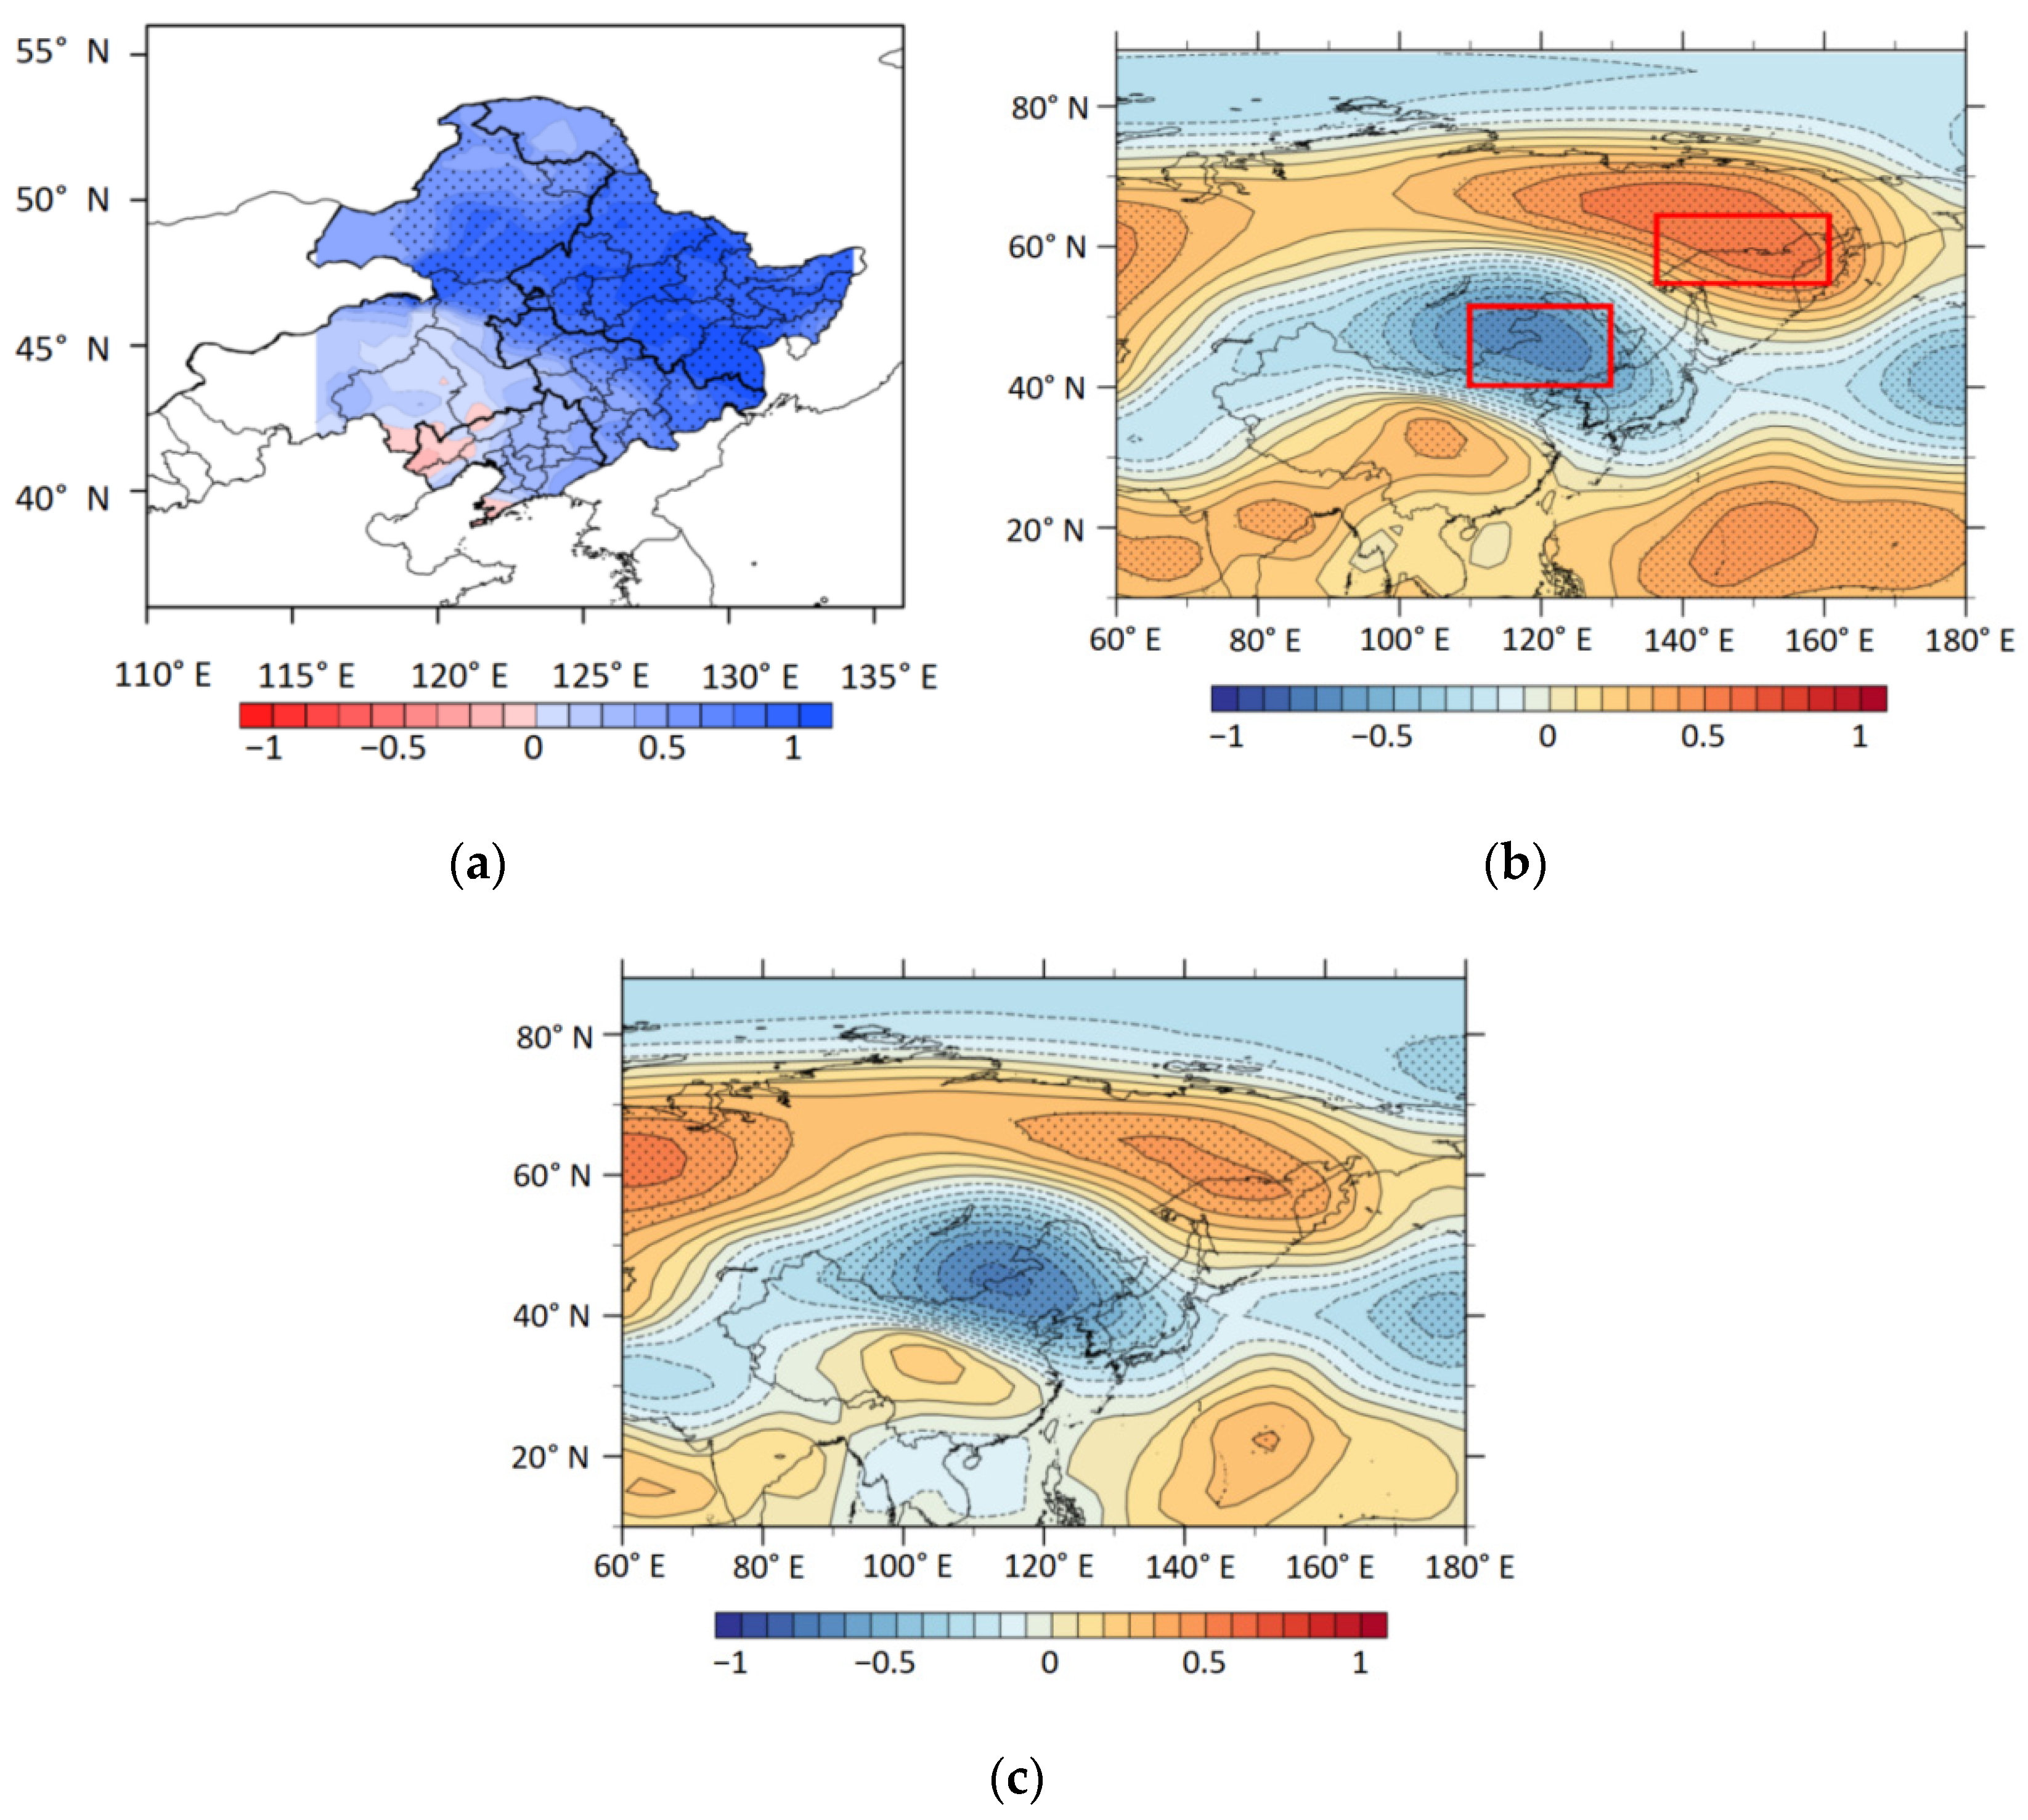
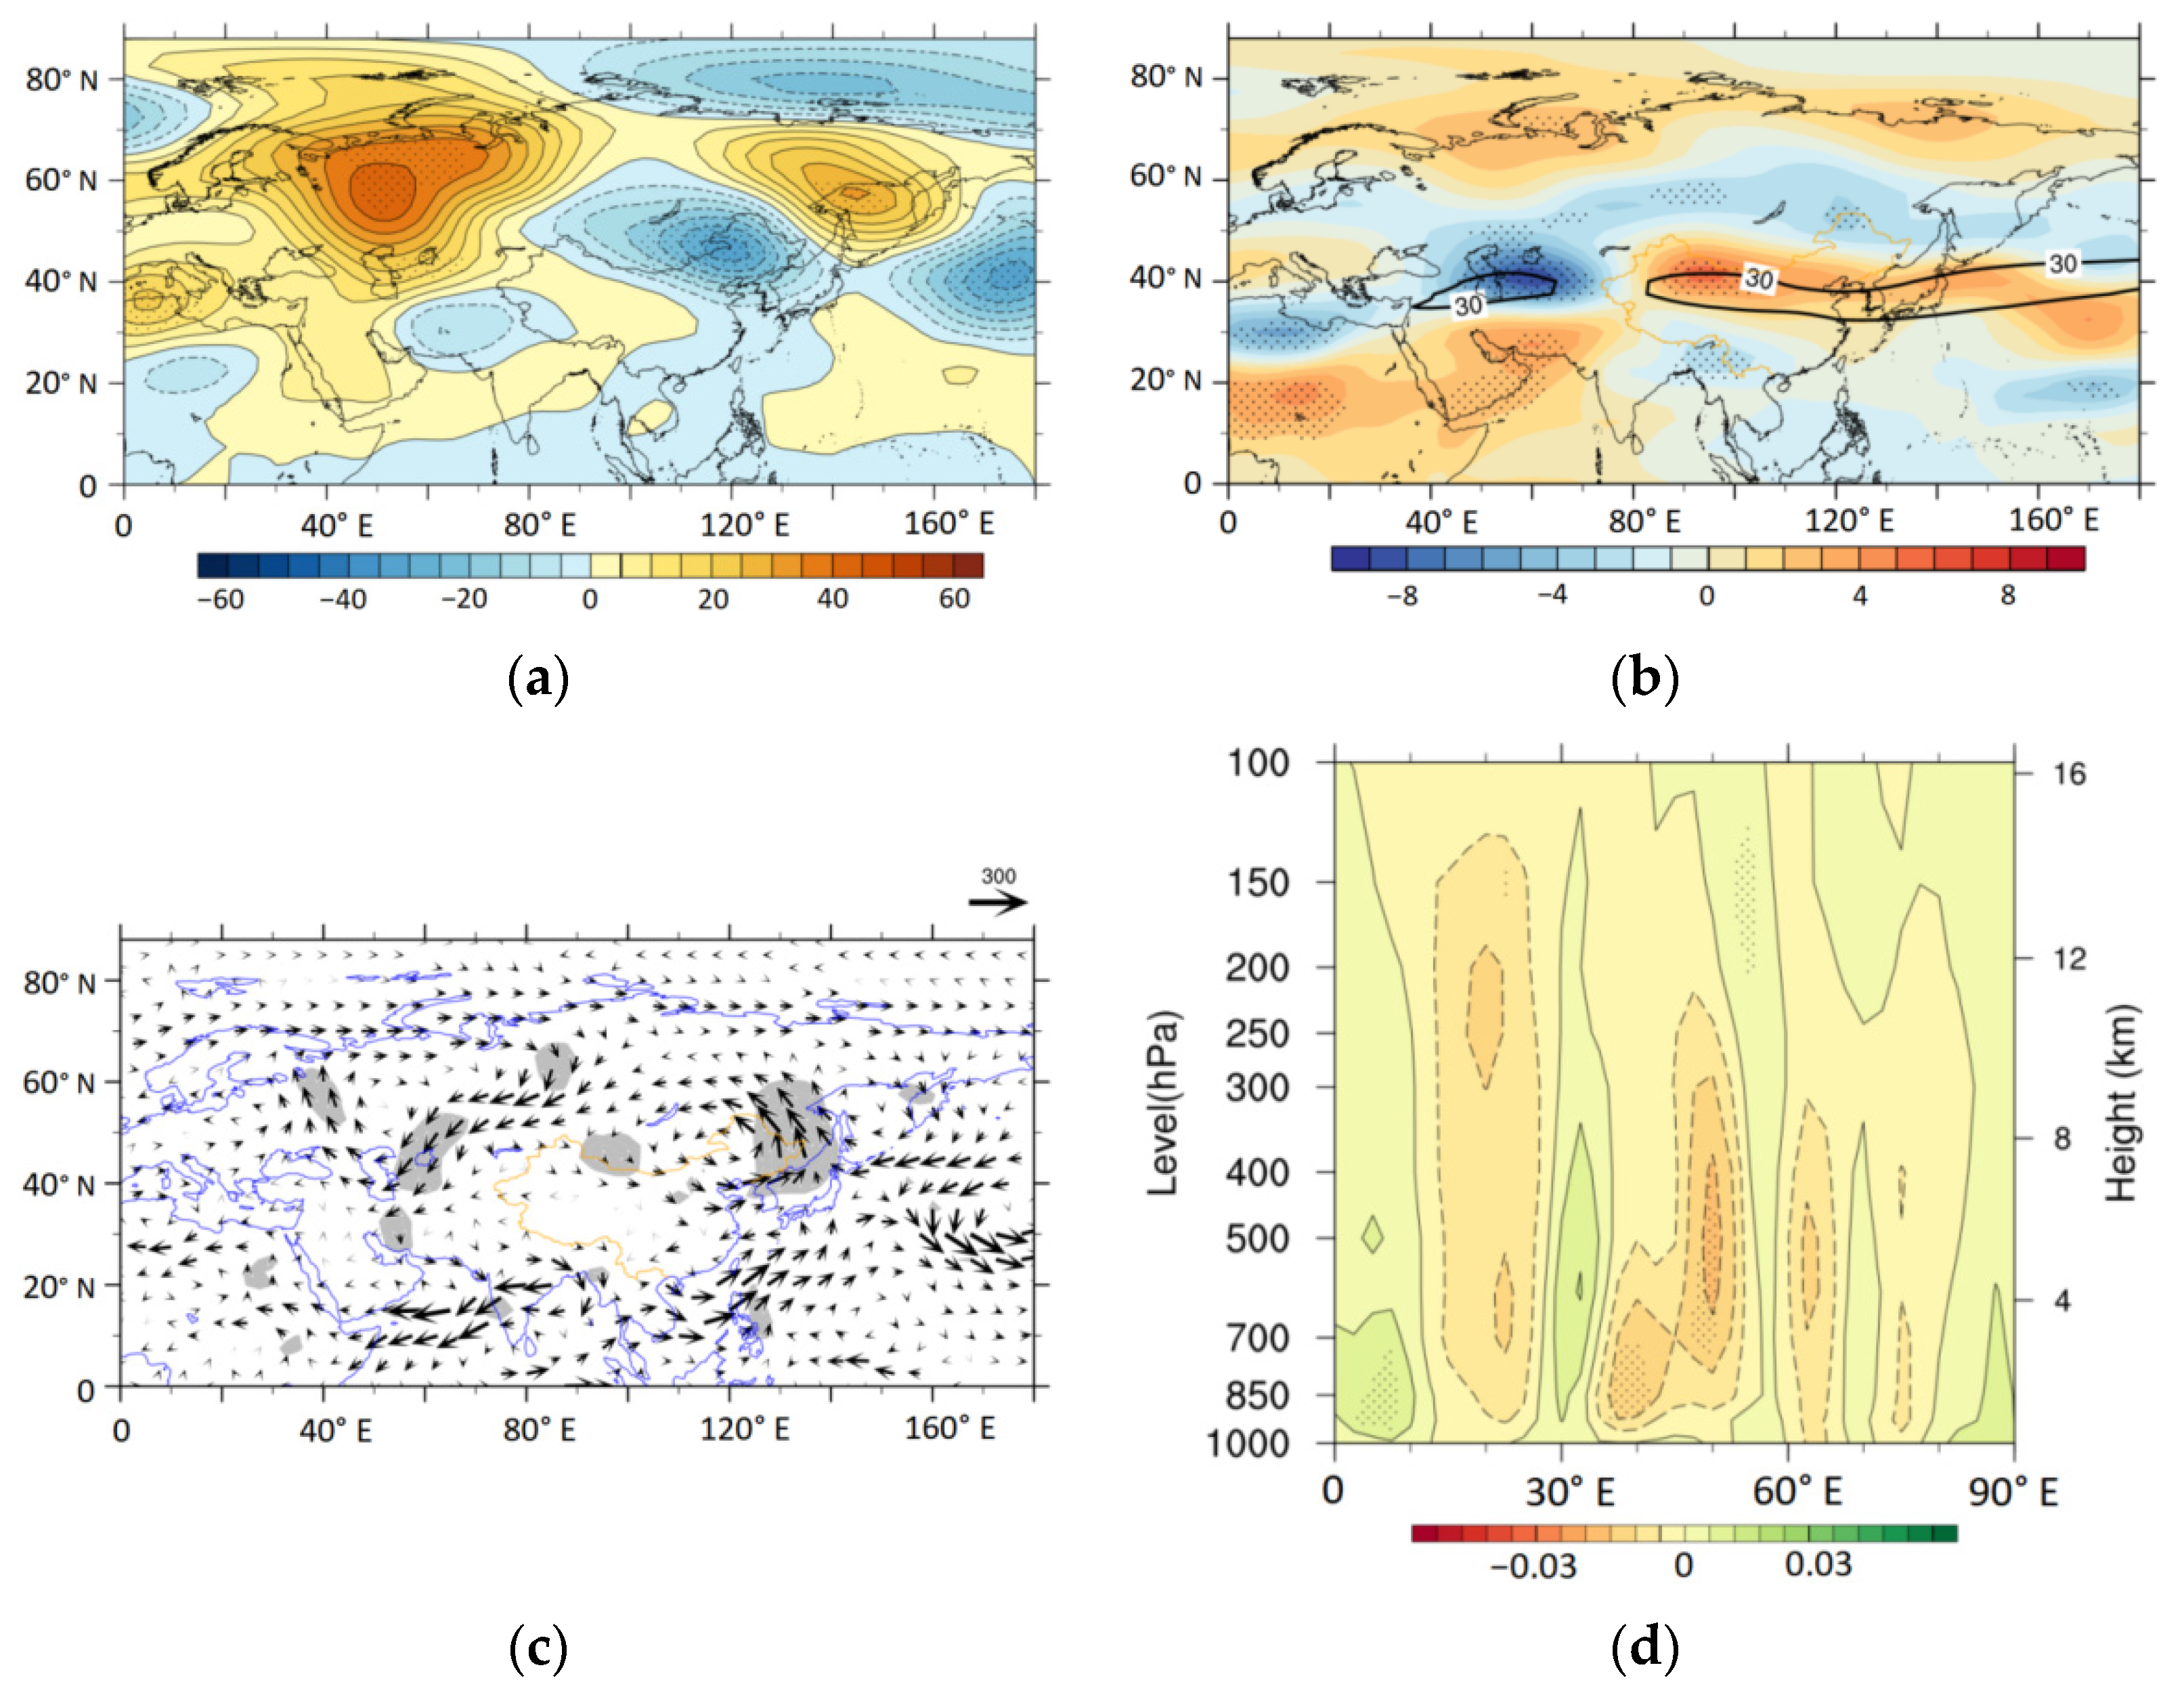
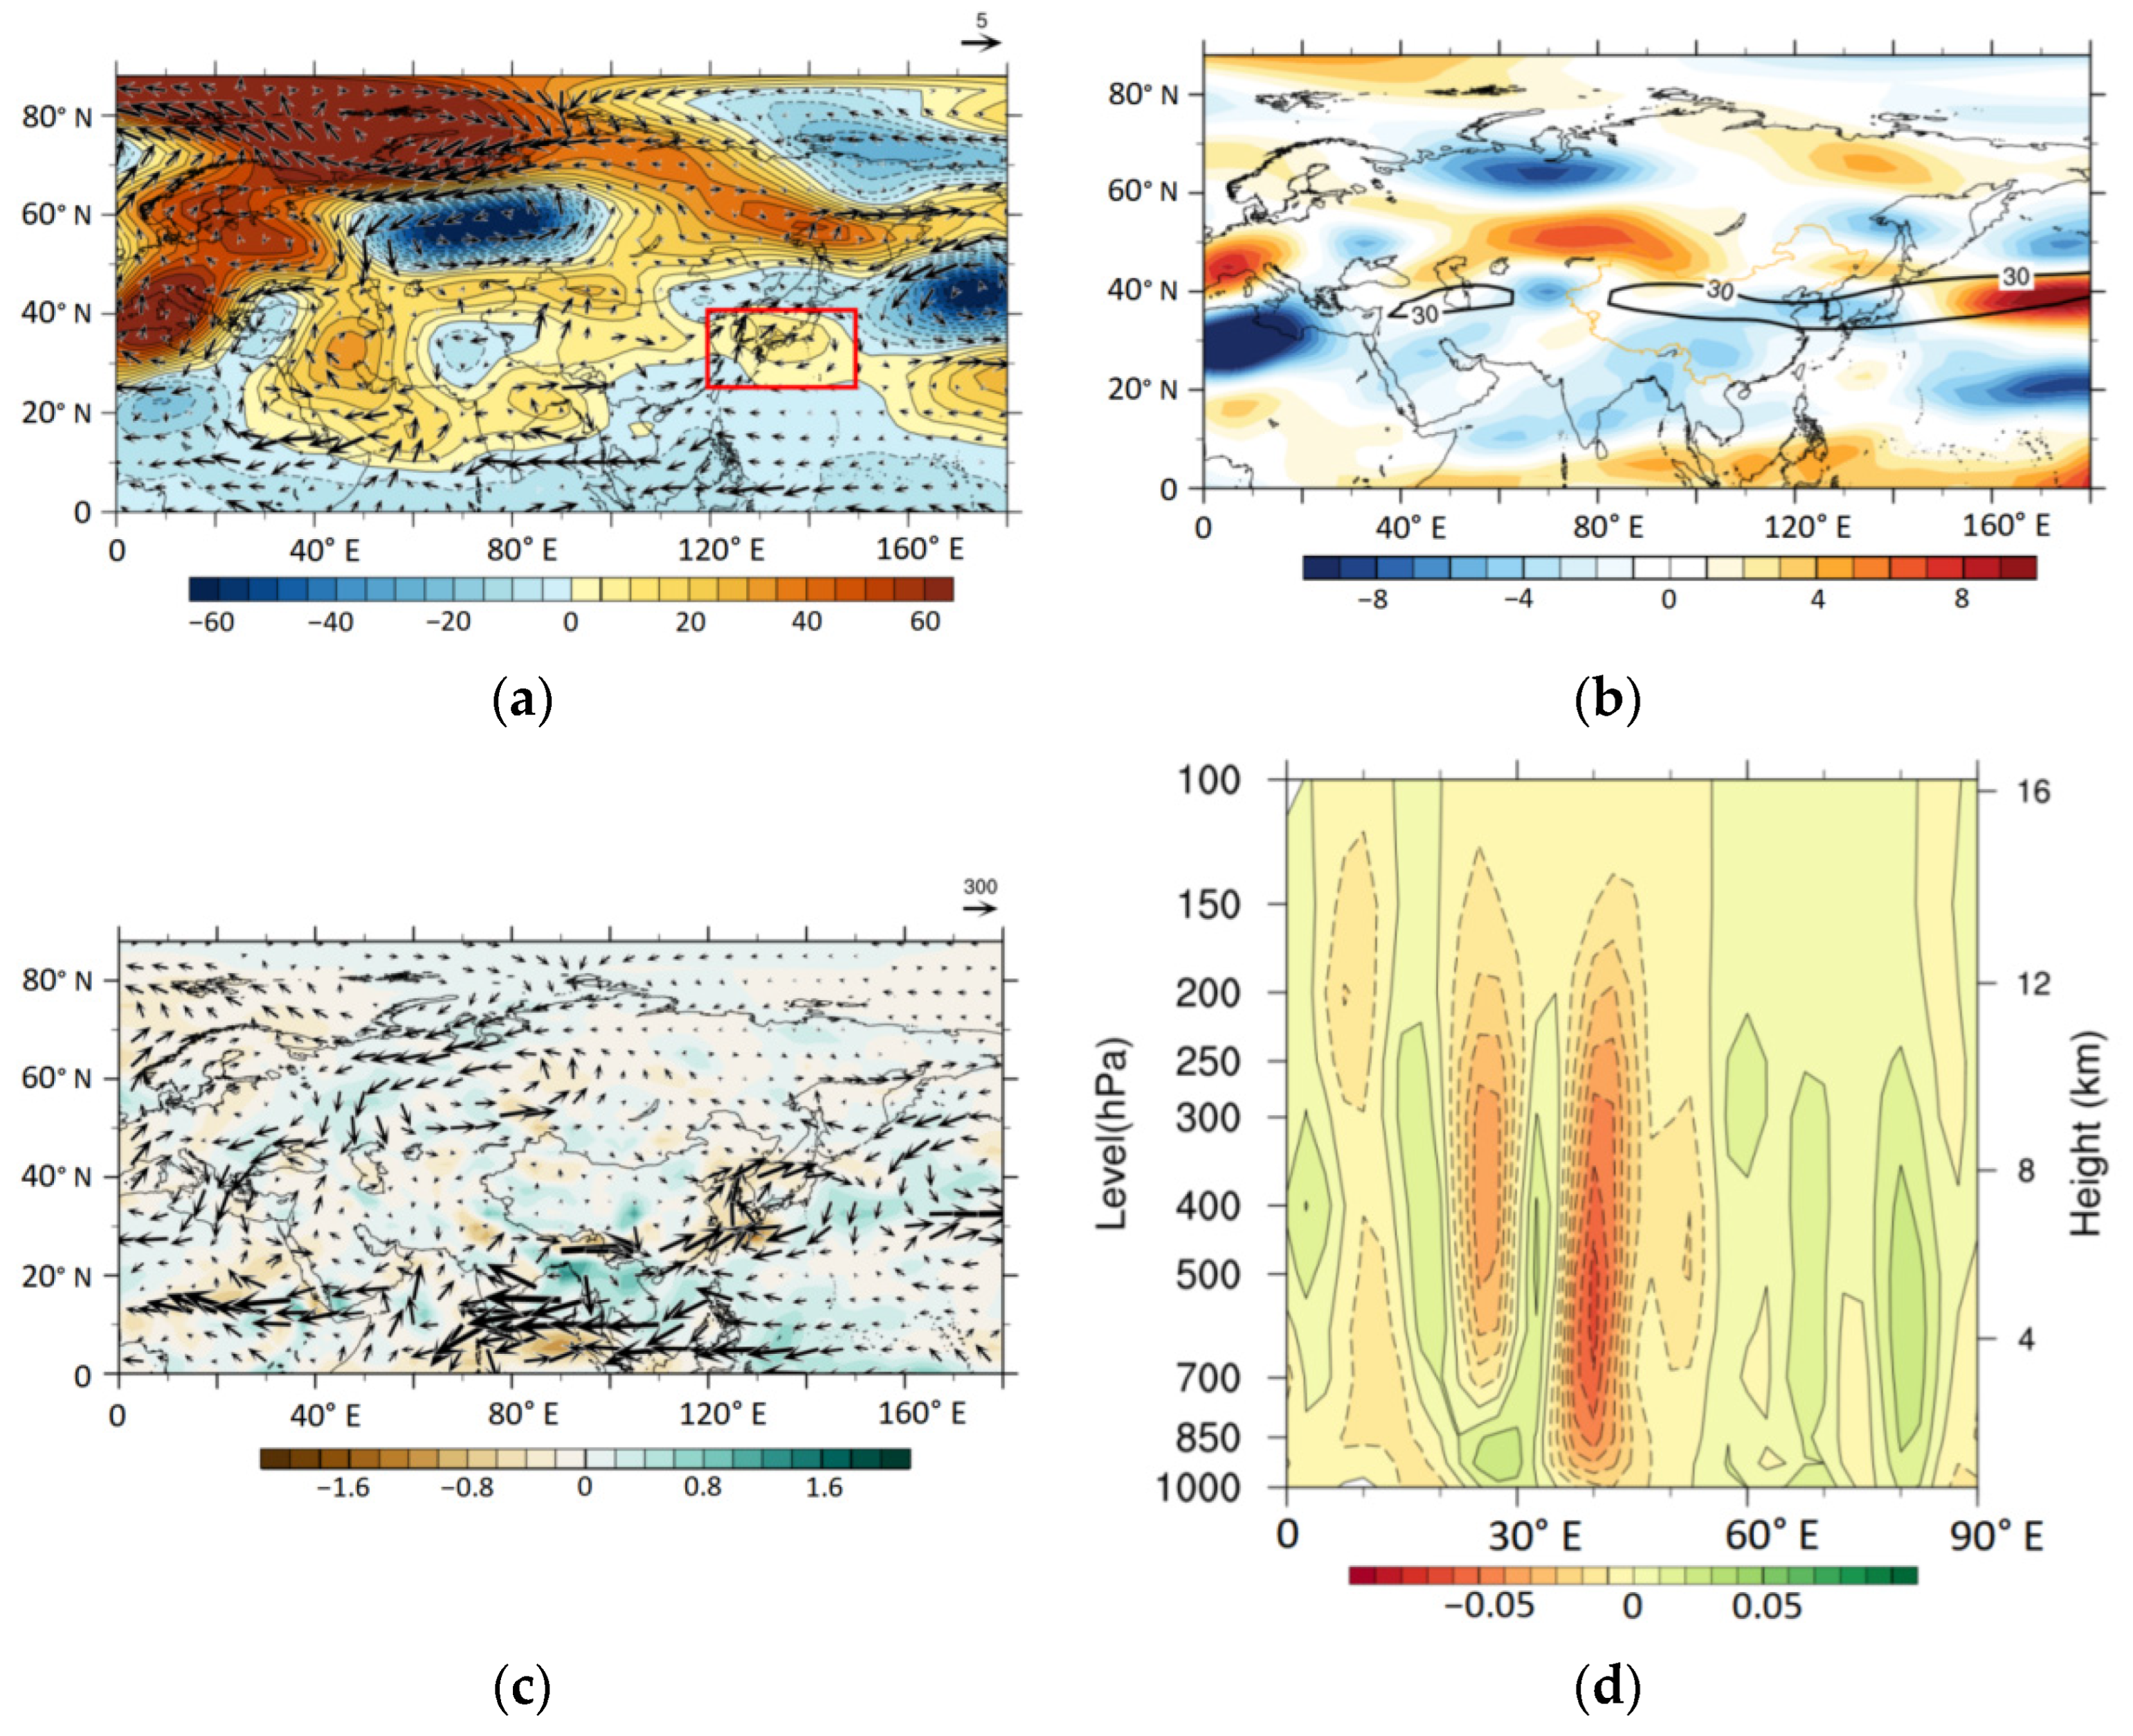
NEC precipitation in June 2022 was more than normal. Based on the analysis above, the cause of the abundant precipitation in June 2022 in NEC is further diagnosed. It can be seen from the 500 hPa geopotential height anomaly field in June 2022 (Figure 9a) that there are obvious zonal wave trains over the mid-high latitudes of Eurasia with negative anomalies in NEC and positive anomalies in the Okhotsk Sea, which corresponds to the NCCV and the BHOS cooperating pattern in mid-high latitude favoring NEC precipitation. However, a positive geopotential height anomaly occurs in southern Japan, which is too strong and too north compared with the typical circulation of heavy rainfall years. The southerly flow to the western flank of the anomalous anticyclonic circulation is conducive to northward water-vapor transport. The anomalous vertically integrated water-vapor flux and divergence (Figure 9c) further suggests that the water vapor for NEC precipitation in June mainly comes from the offshore regions of eastern China and is continuously transported to the southern NEC by the southerly in the western flank of the anomalous anticyclone. However, the westward water-vapor transport from the vicinity of the Okhotsk Sea is relatively weak. NEC is basically controlled by the convergence area of water vapor, but the area with strong convergence is in the southern NEC and thus more precipitation occurs in the south. At the same time, the subtropical westerly jet is strengthened at around 60° E to 110° E and 120° E to 180° E, and a break occurs over NEC, implying that the southwestern NEC is located just to the right side of the upper-level jet entrance area in its eastern segment. As a result, there is an ageostrophic wind divergence at the upper level, which is conducive to the development of ascending motion (Figure 9b). The vertical velocity profile along 120° E also shows that the ascending motion is strong near 40° N in the southern NEC and gradually weakens northward (Figure 9d). With the aid of the favorable dynamic and water-vapor conditions in the mid-lower troposphere, anomalous precipitation occurs in NEC with a maximum center shifting southward.
It is pointed out in 
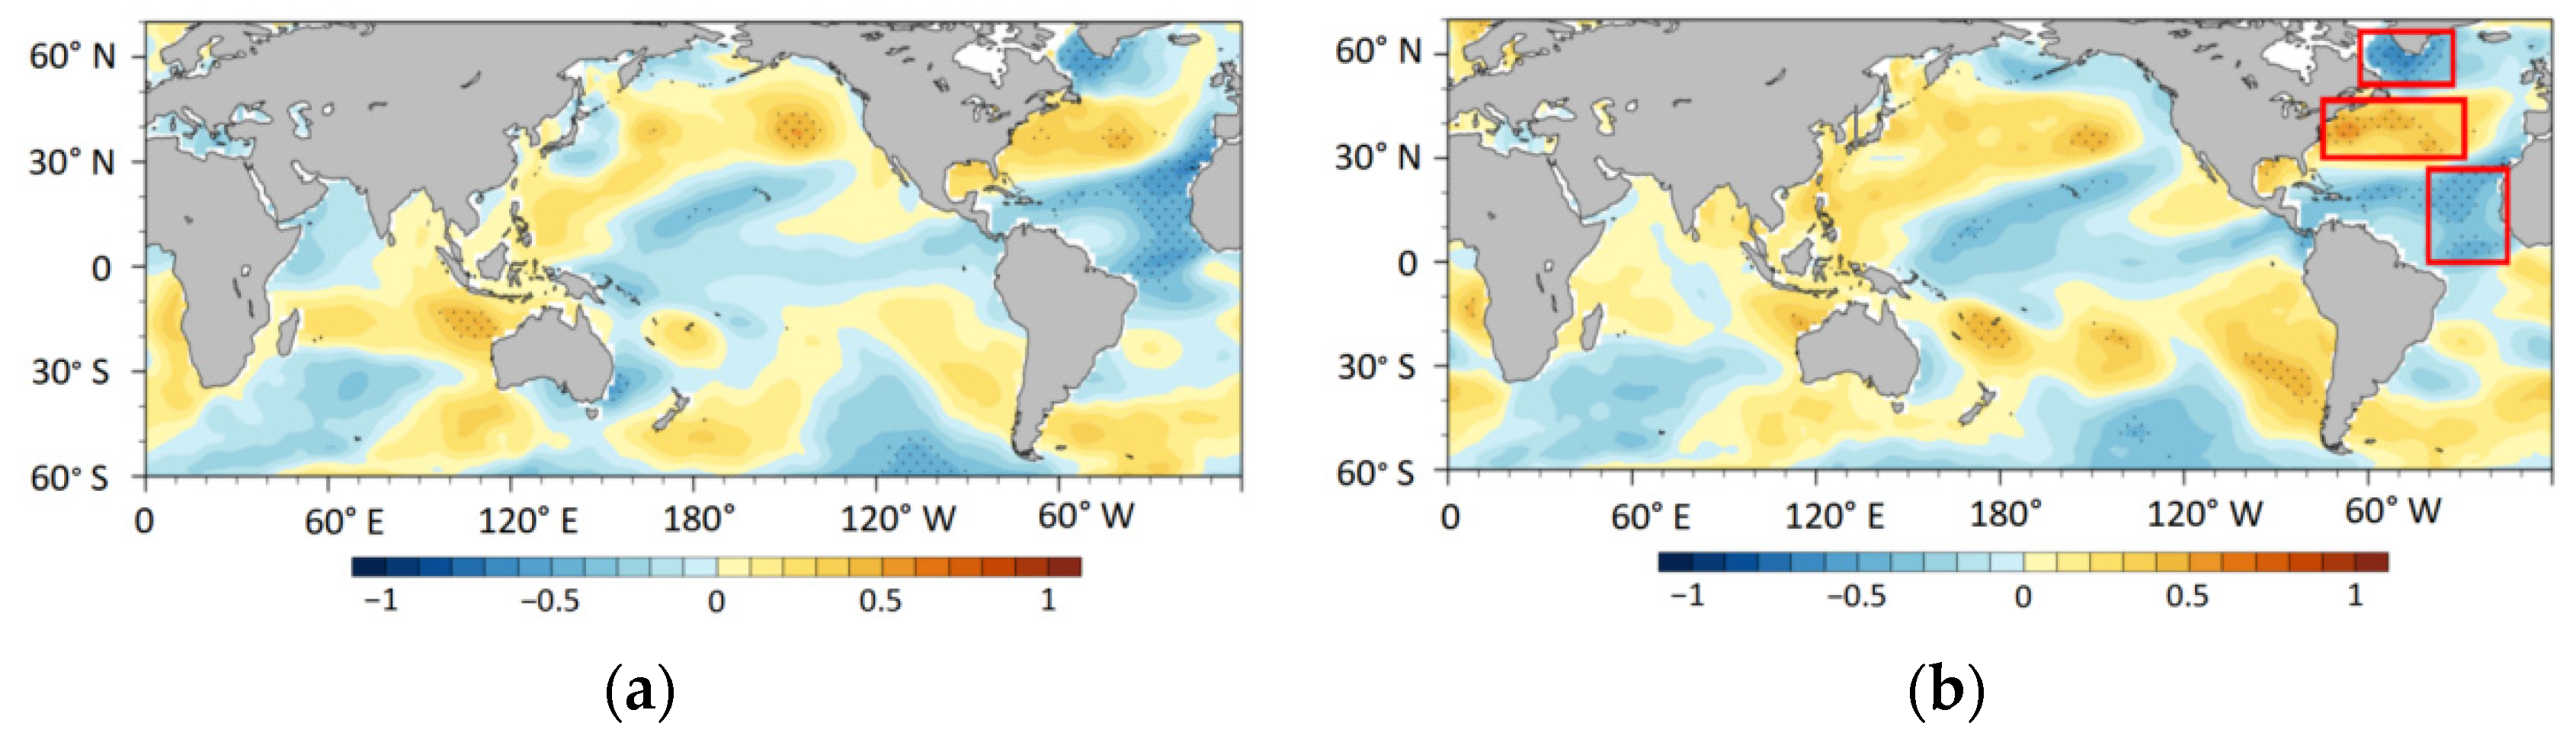
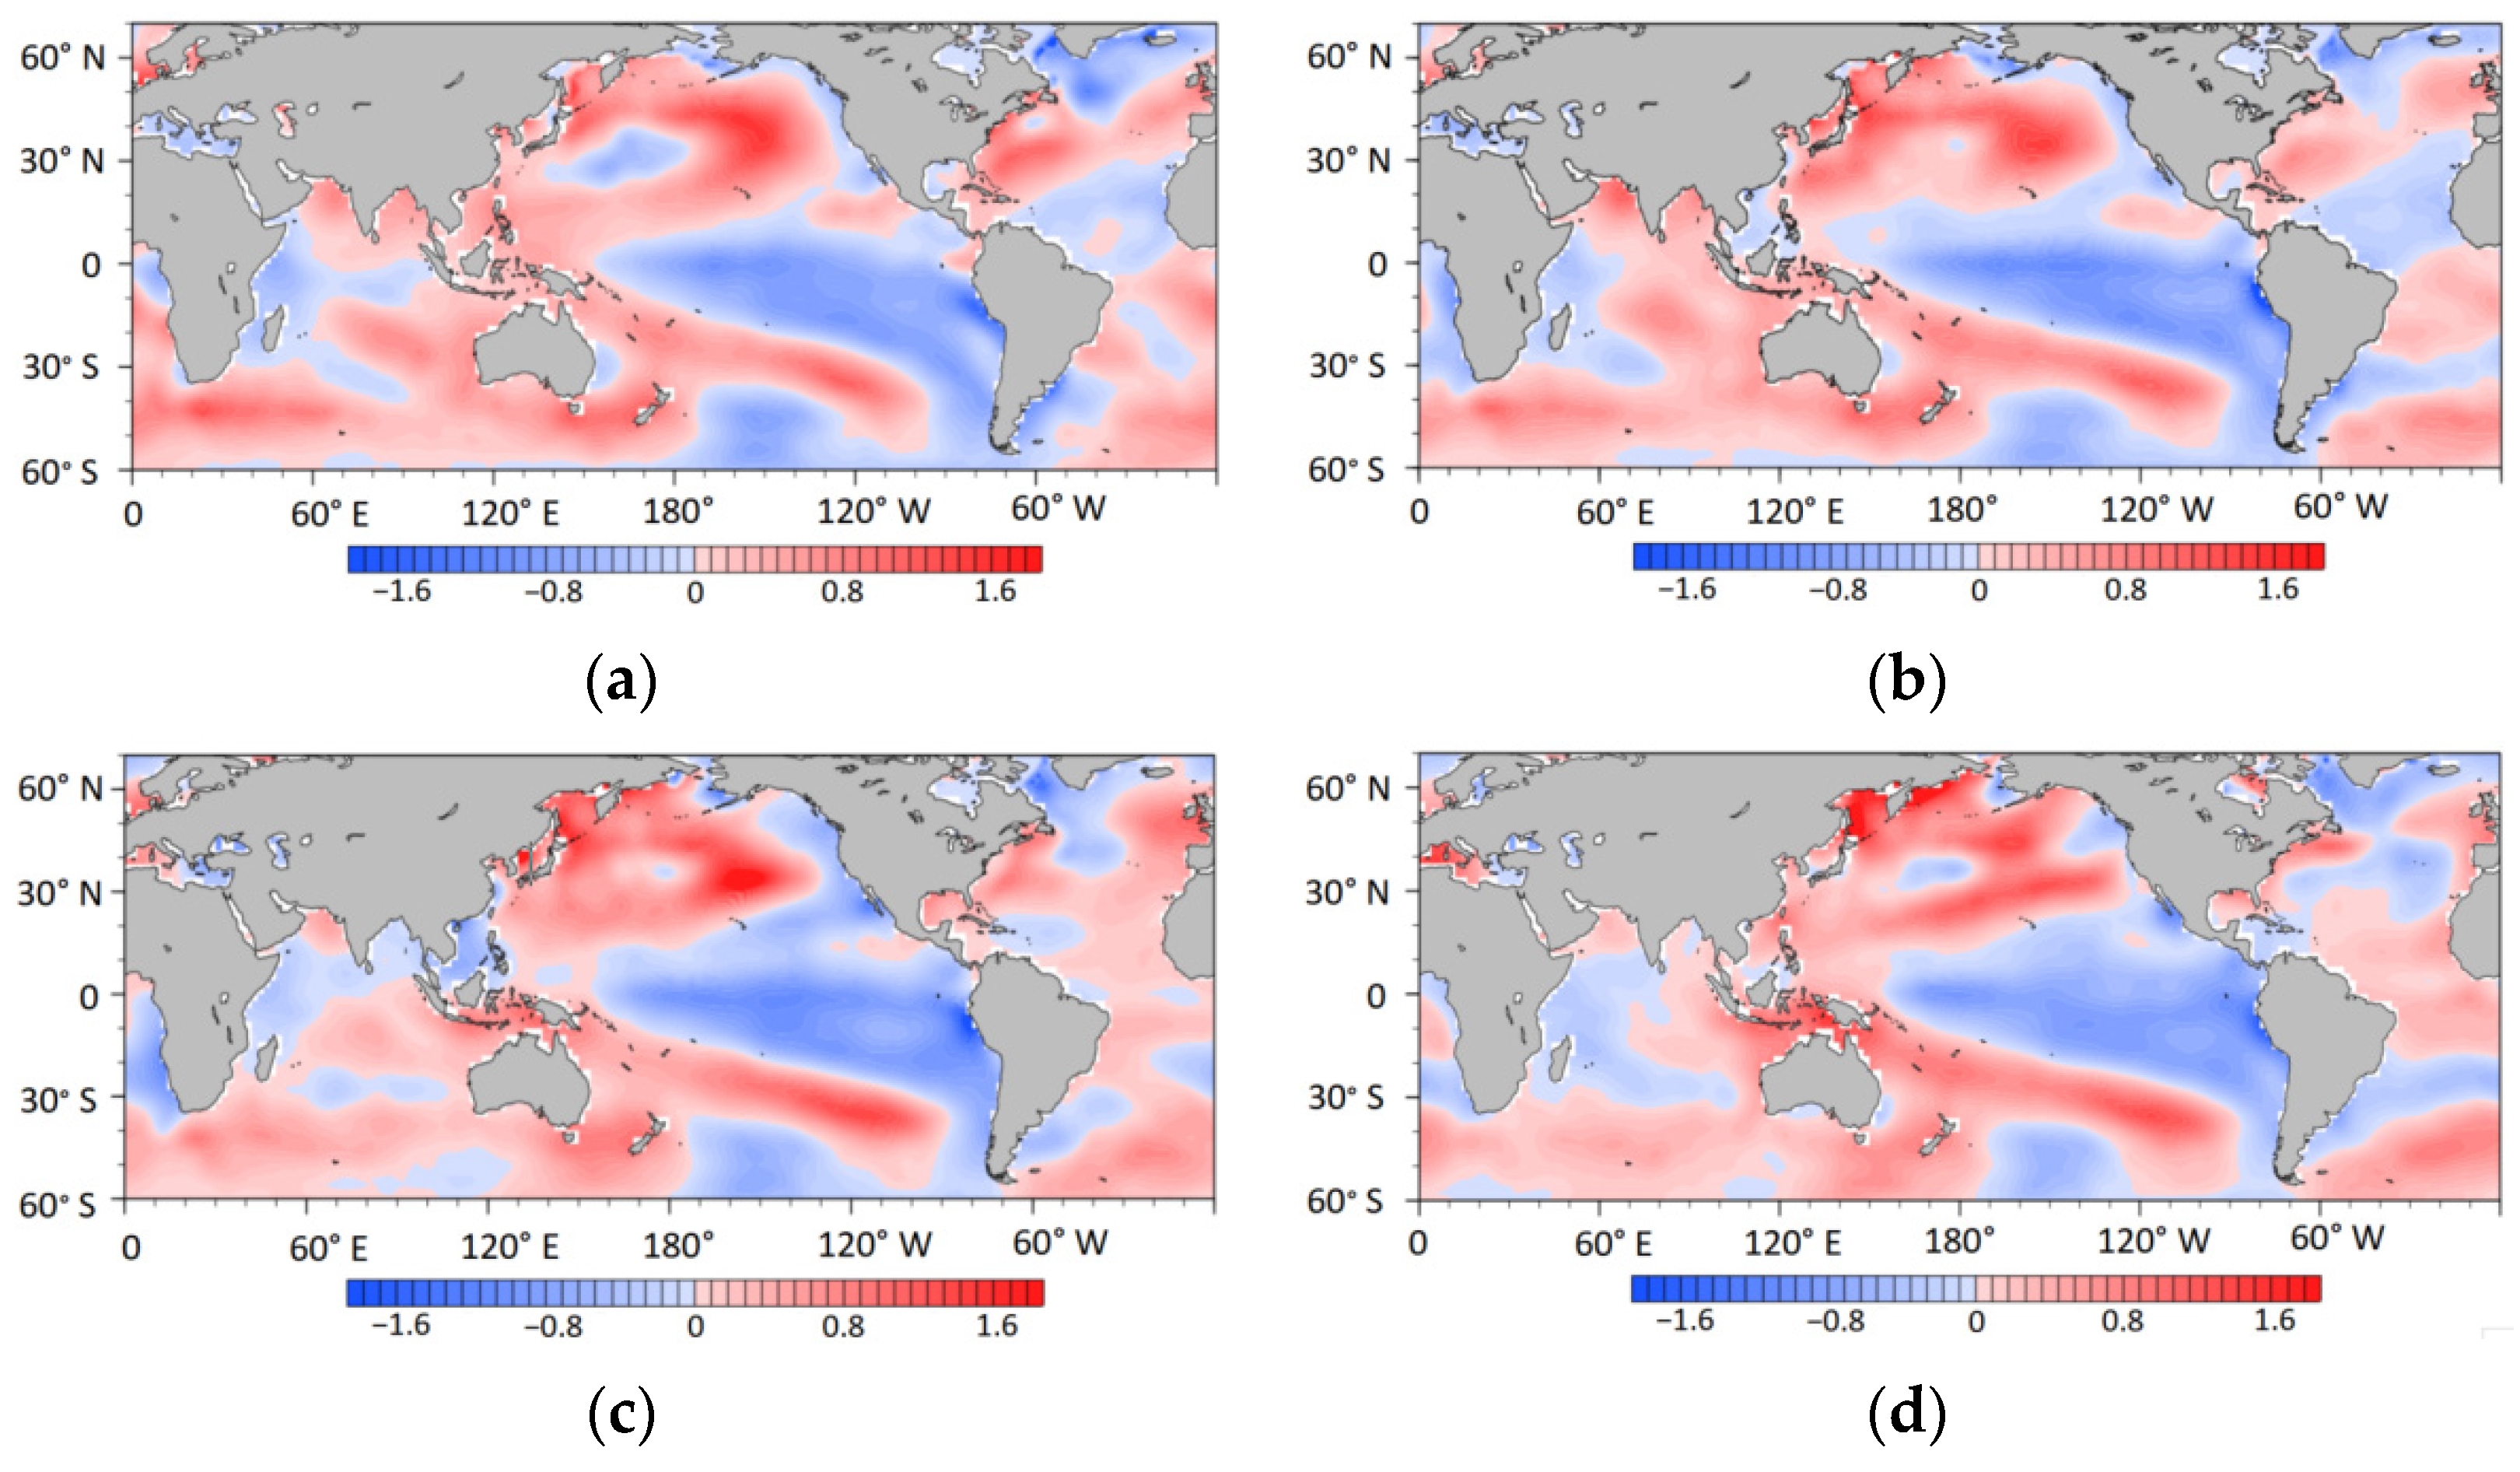
Section 4.2 that the NAT SST anomaly in March is a clear indicator of an NEC precipitation anomaly in June during 2001–2021, which provides a theoretical basis for explaining the unprecedented precipitation in NEC in June 2022 from the perspective of SST forcing. In March 2022, the North Atlantic Ocean showed an obvious tripole SST anomaly (Figure 10a), which is consistent with the correlation distribution of SST between NEC precipitation in June and EAC-I (Figure 6). Although its intensity weakens gradually, the tripole SST distribution can persist to June. This indicates that the NAT SST anomaly in March 2022 may stimulate the Rossby wave propagating eastward from the North Atlantic to the North Pacific through the air–sea interaction mentioned in Section 4.2, generating the anomalous circulation pattern in which the NCCV cooperates with the BHOS in the mid-high latitudes of East Asia. Hence, a background atmospheric circulation pattern favorable for more precipitation in NEC is formed.
It is worth noting that although NAT can excite the circulation pattern favoring NEC precipitation in June, the corresponding anomalous anticyclone in the northwestern Pacific is slightly southward (Figure 8) compared to that which occurred in June 2022 (Figure 9a), which is located at around 30° N. To investigate the reason for the northward deviation of the anomalous anticyclone in June 2022, we further defined a northwest Pacific anomalous anticyclone index (NPA-I, see Table 1) in southern Japan. In 
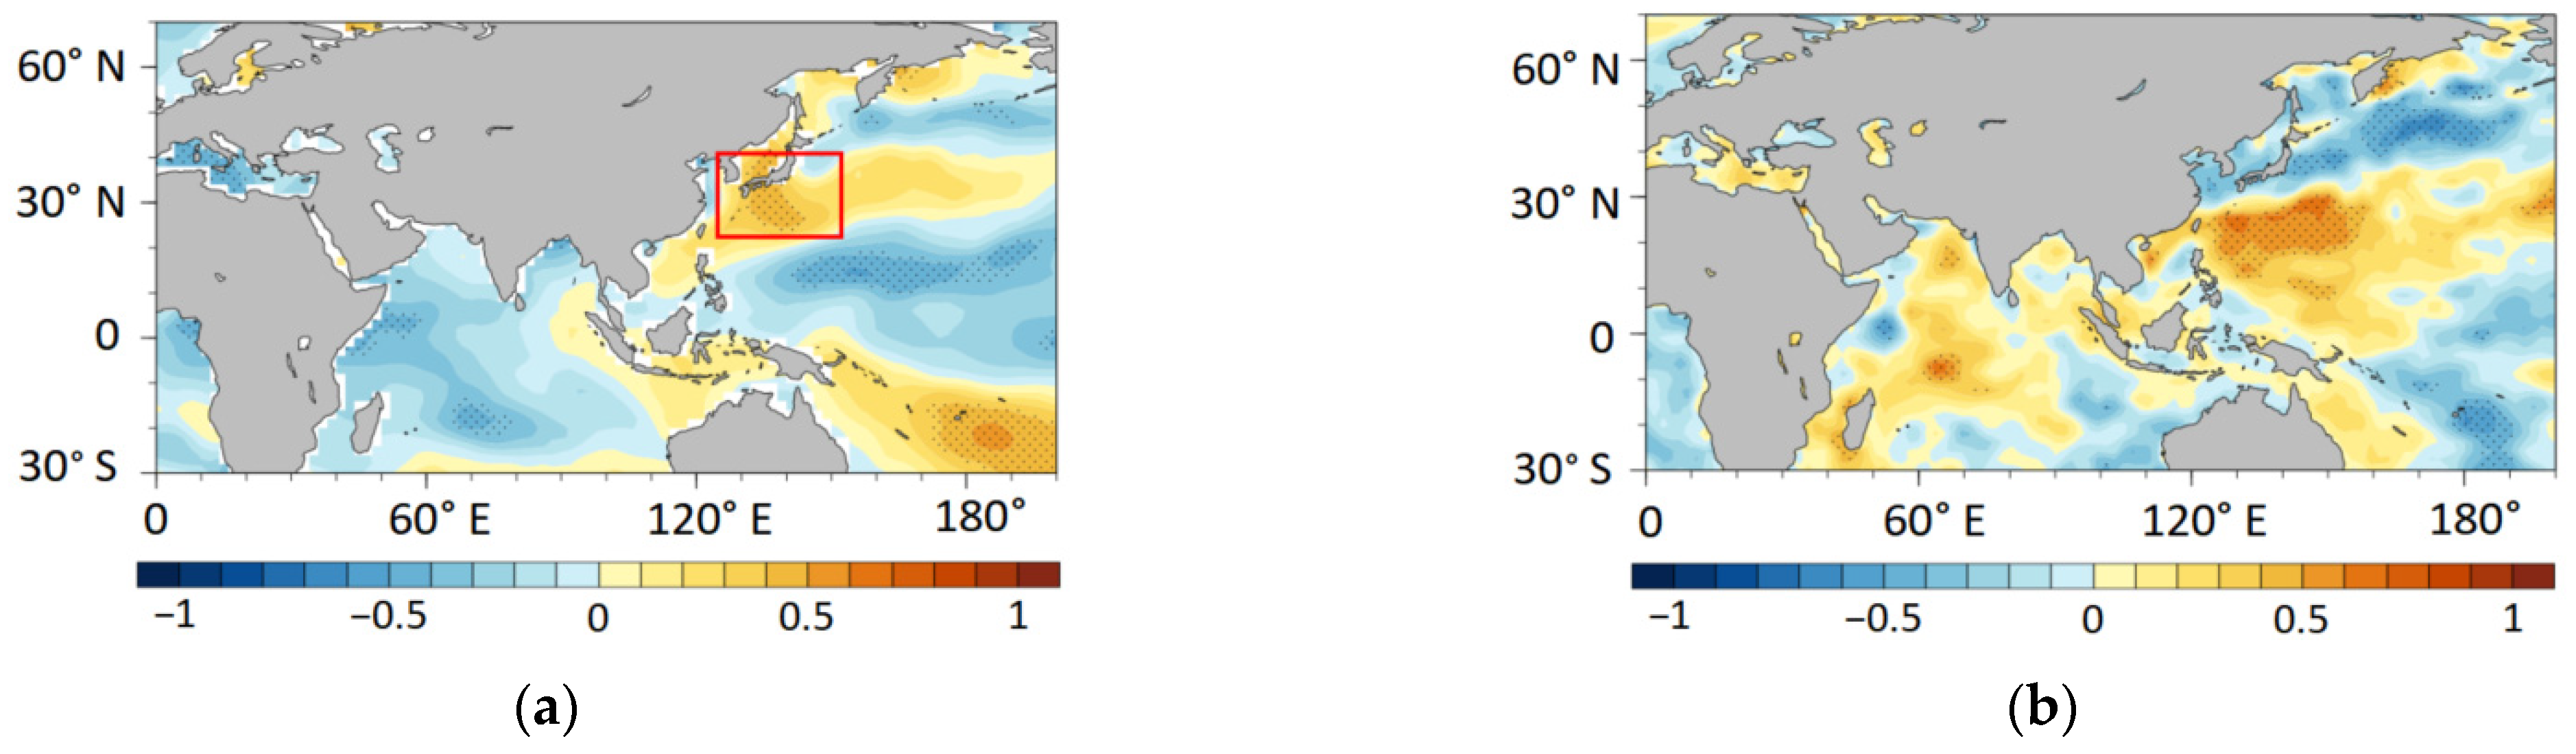
Figure 11a, the correlation between NPA-I and SST shows that the anomalous anticyclone at 500 hPa over southern Japan in June was closely related to the positive SST anomaly in the Kuroshio region (defined in Table 1). In the subtropical region, convection tends to be suppressed. Although there are warm SST anomalies in the Kuroshio region, they cannot stimulate local convective heating, but heat the atmosphere through long-wave radiation, generating a warm high by air-column stretching [13]. A significant positive turbulent heat flux anomaly in the sea to the south of Japan can be seen from the regressed sea-surface turbulent heat flux in June against NWP-I (Figure 11b). The sea-surface turbulent heat flux is the sum of sensible heat flux and latent heat flux. A positive turbulent heat flux anomaly indicates that the ocean transfers heat to the atmosphere, whereas a negative anomaly means that the atmosphere transfers heat to the ocean. The results suggest that the anomalous SST warming in the Kuroshio region in June may increase the geopotential height over the northwestern Pacific by transferring heat to the atmosphere. A Kuroshio Sea temperature index in June (KS-I, see 
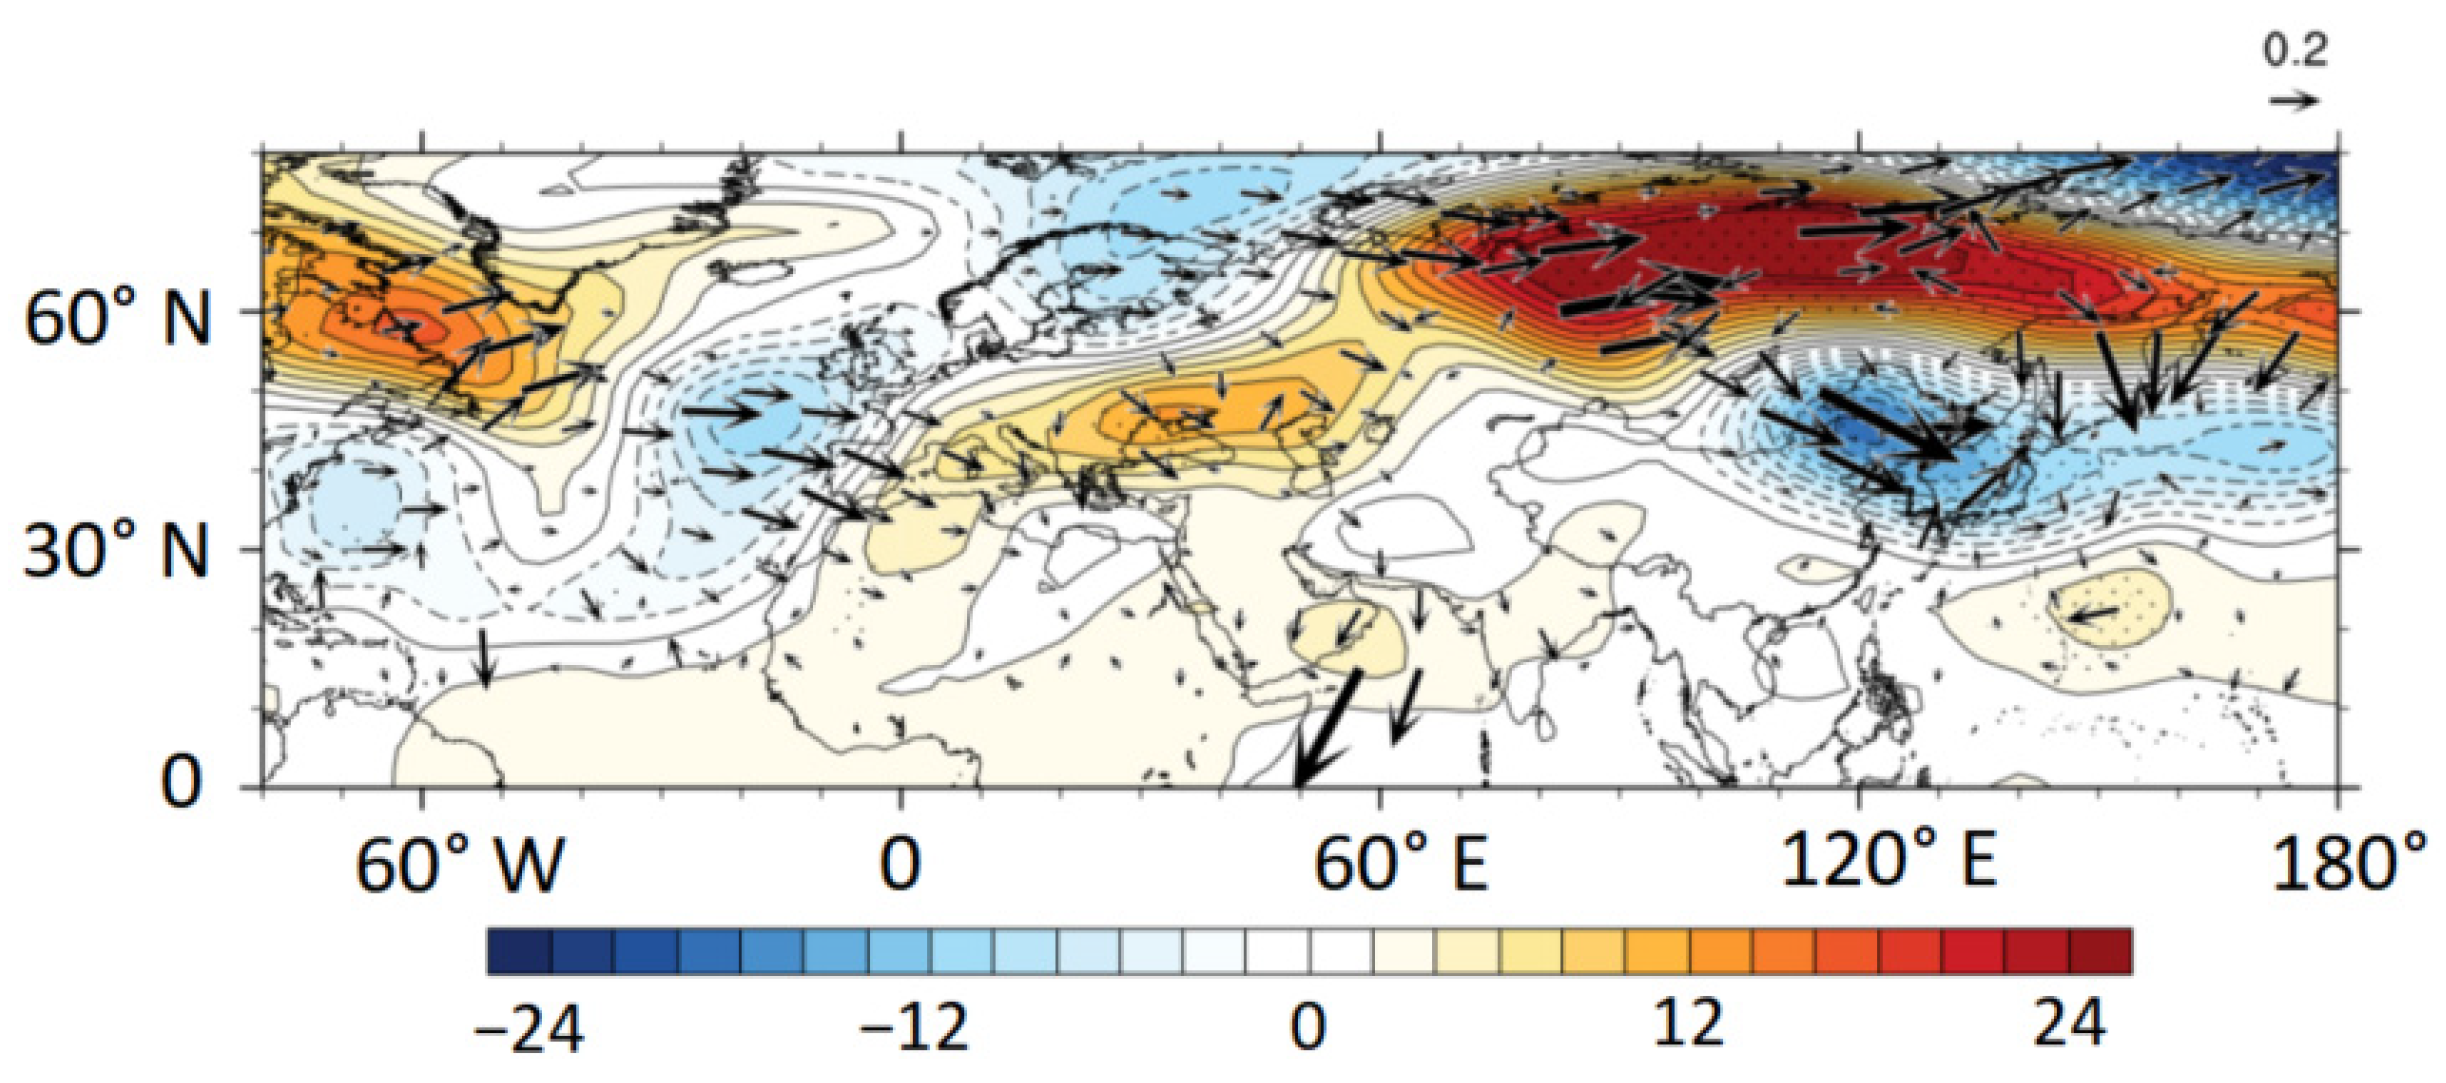
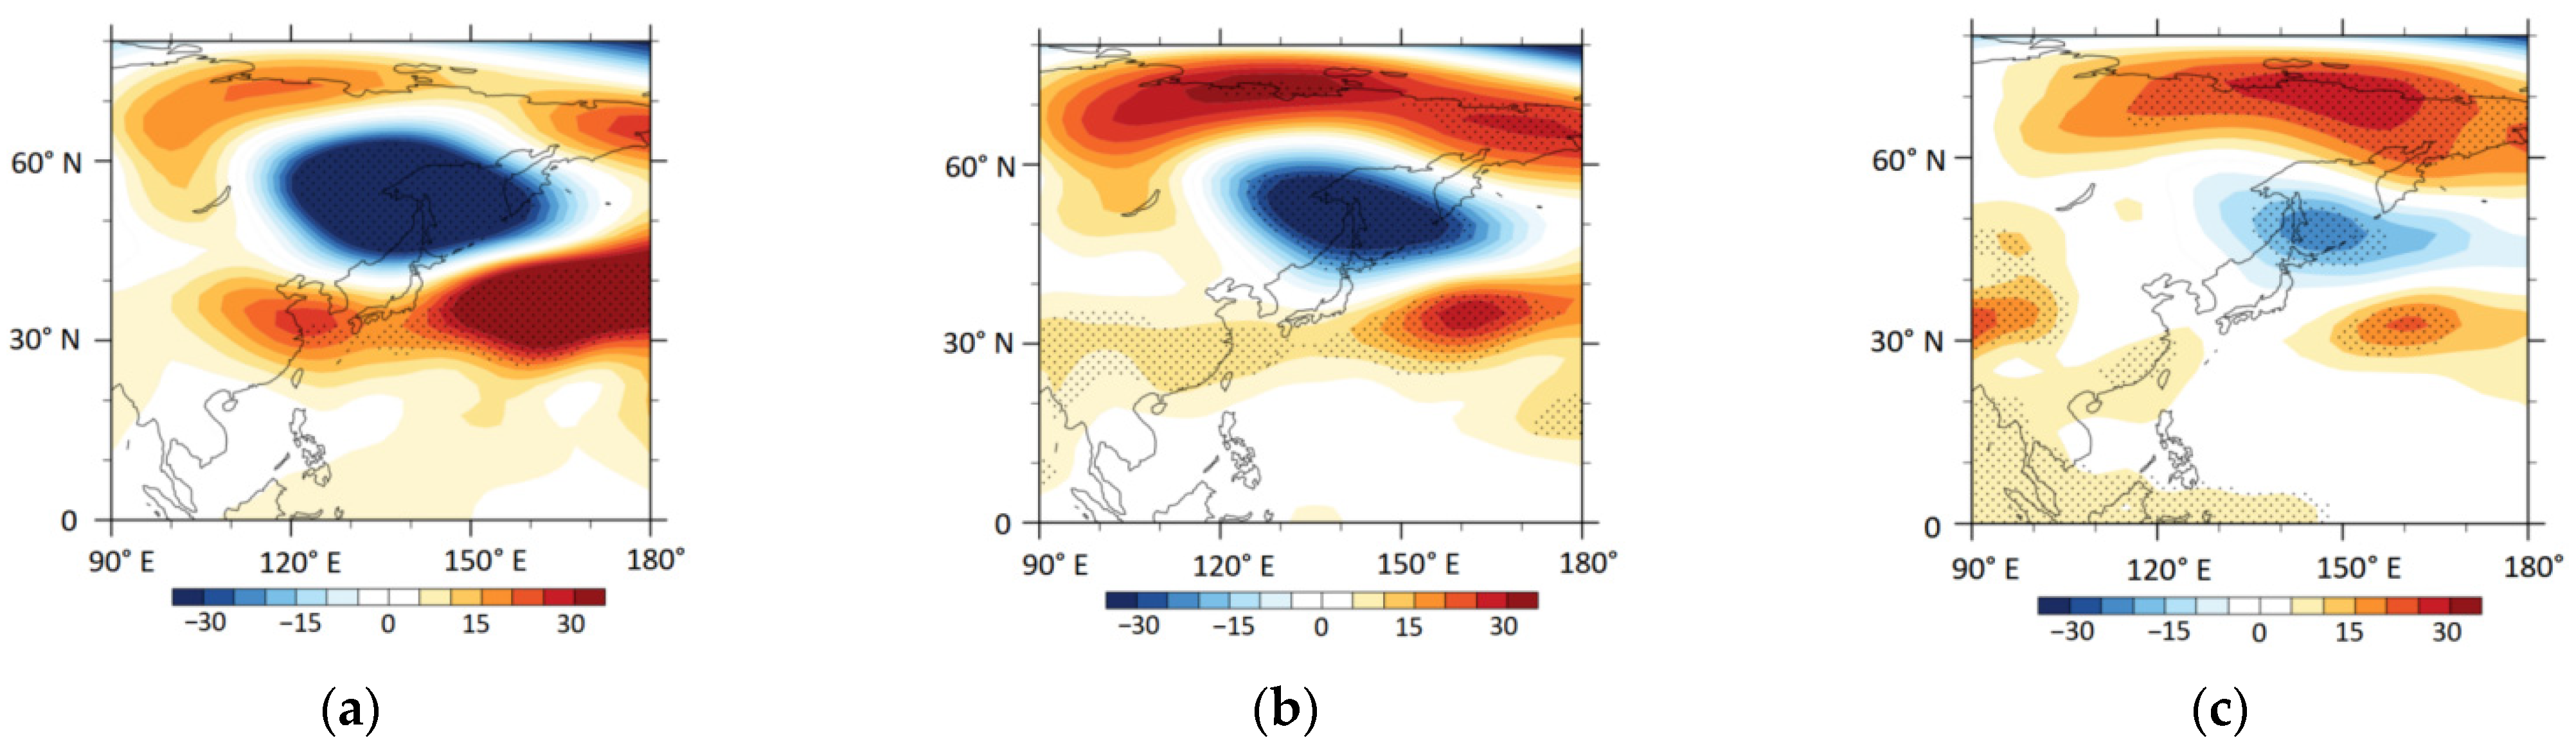
Table 1) was then defined, and the regressed geopotential height at 200, 500, and 850 hPa against the KS-I index is shown in Figure 12. There are significant negative geopotential height anomalies in the three levels to the north of Japan. The geopotential height shows a meridionally distributed positive-negative-positive pattern with a significant positive geopotential height anomaly near 30° N, which is more evident in the mid-upper layers.
In summary, NEC precipitation in June 2022 is more than normal. Statistically, on the one hand, it is modulated by the NAT anomaly in March. The NAT anomaly stimulates the downstream circulation pattern consisting of the NCCV and the BHOS in the mid-high latitude, which is conducive to the frequent convergence of cold and warm air in NEC and favors heavy rainfall. Moreover, the SST anomalies in June in the Kuroshio region, through the local air–sea interaction, can make the anomalous anticyclone in the northwestern Pacific more northward and stronger compared with the typical heavy precipitation circulation pattern, which provides sufficient water vapor from northwestern Pacific for NEC, resulting in the unprecedented precipitation in June 2022.

6. Conclusions and Summary

In June 2022, the spatial mean precipitation in northeastern China (NEC) broke the historical record. Through the statistical analysis of the associated large-scale circulation pattern and SST anomalies, the following conclusions are obtained:
(1) In the past 20 years, the mid-high latitude atmospheric circulation pattern that consists of the NCCV and the BHOS is the primary large-scale circulation factor affecting the precipitation anomaly in June of NEC, which is closely related to the NAT SST anomaly in March. During the years of more NEC precipitation in June, the active NCCV and BHOS provide thermodynamic and water-vapor conditions for the anomalous precipitation.
(2) In June 2022, there were cooperating NCCV and BHOS in the mid-high latitude of East Asia, as well as an anomalous northerly and strengthened northeast Pacific anticyclone. The southerly flow to the western flank of the anomalous anticyclonic circulation was conducive to northward water-vapor transport, while the westward water-vapor transport from the vicinity of the Okhotsk Sea was relatively weak. The subtropical westerly jet over the northwestern Pacific was strong with a break occurring over NEC, which is conducive to the development of an ascending motion. With the aid of the favorable dynamic and water-vapor conditions, anomalous precipitation occurred in NEC.
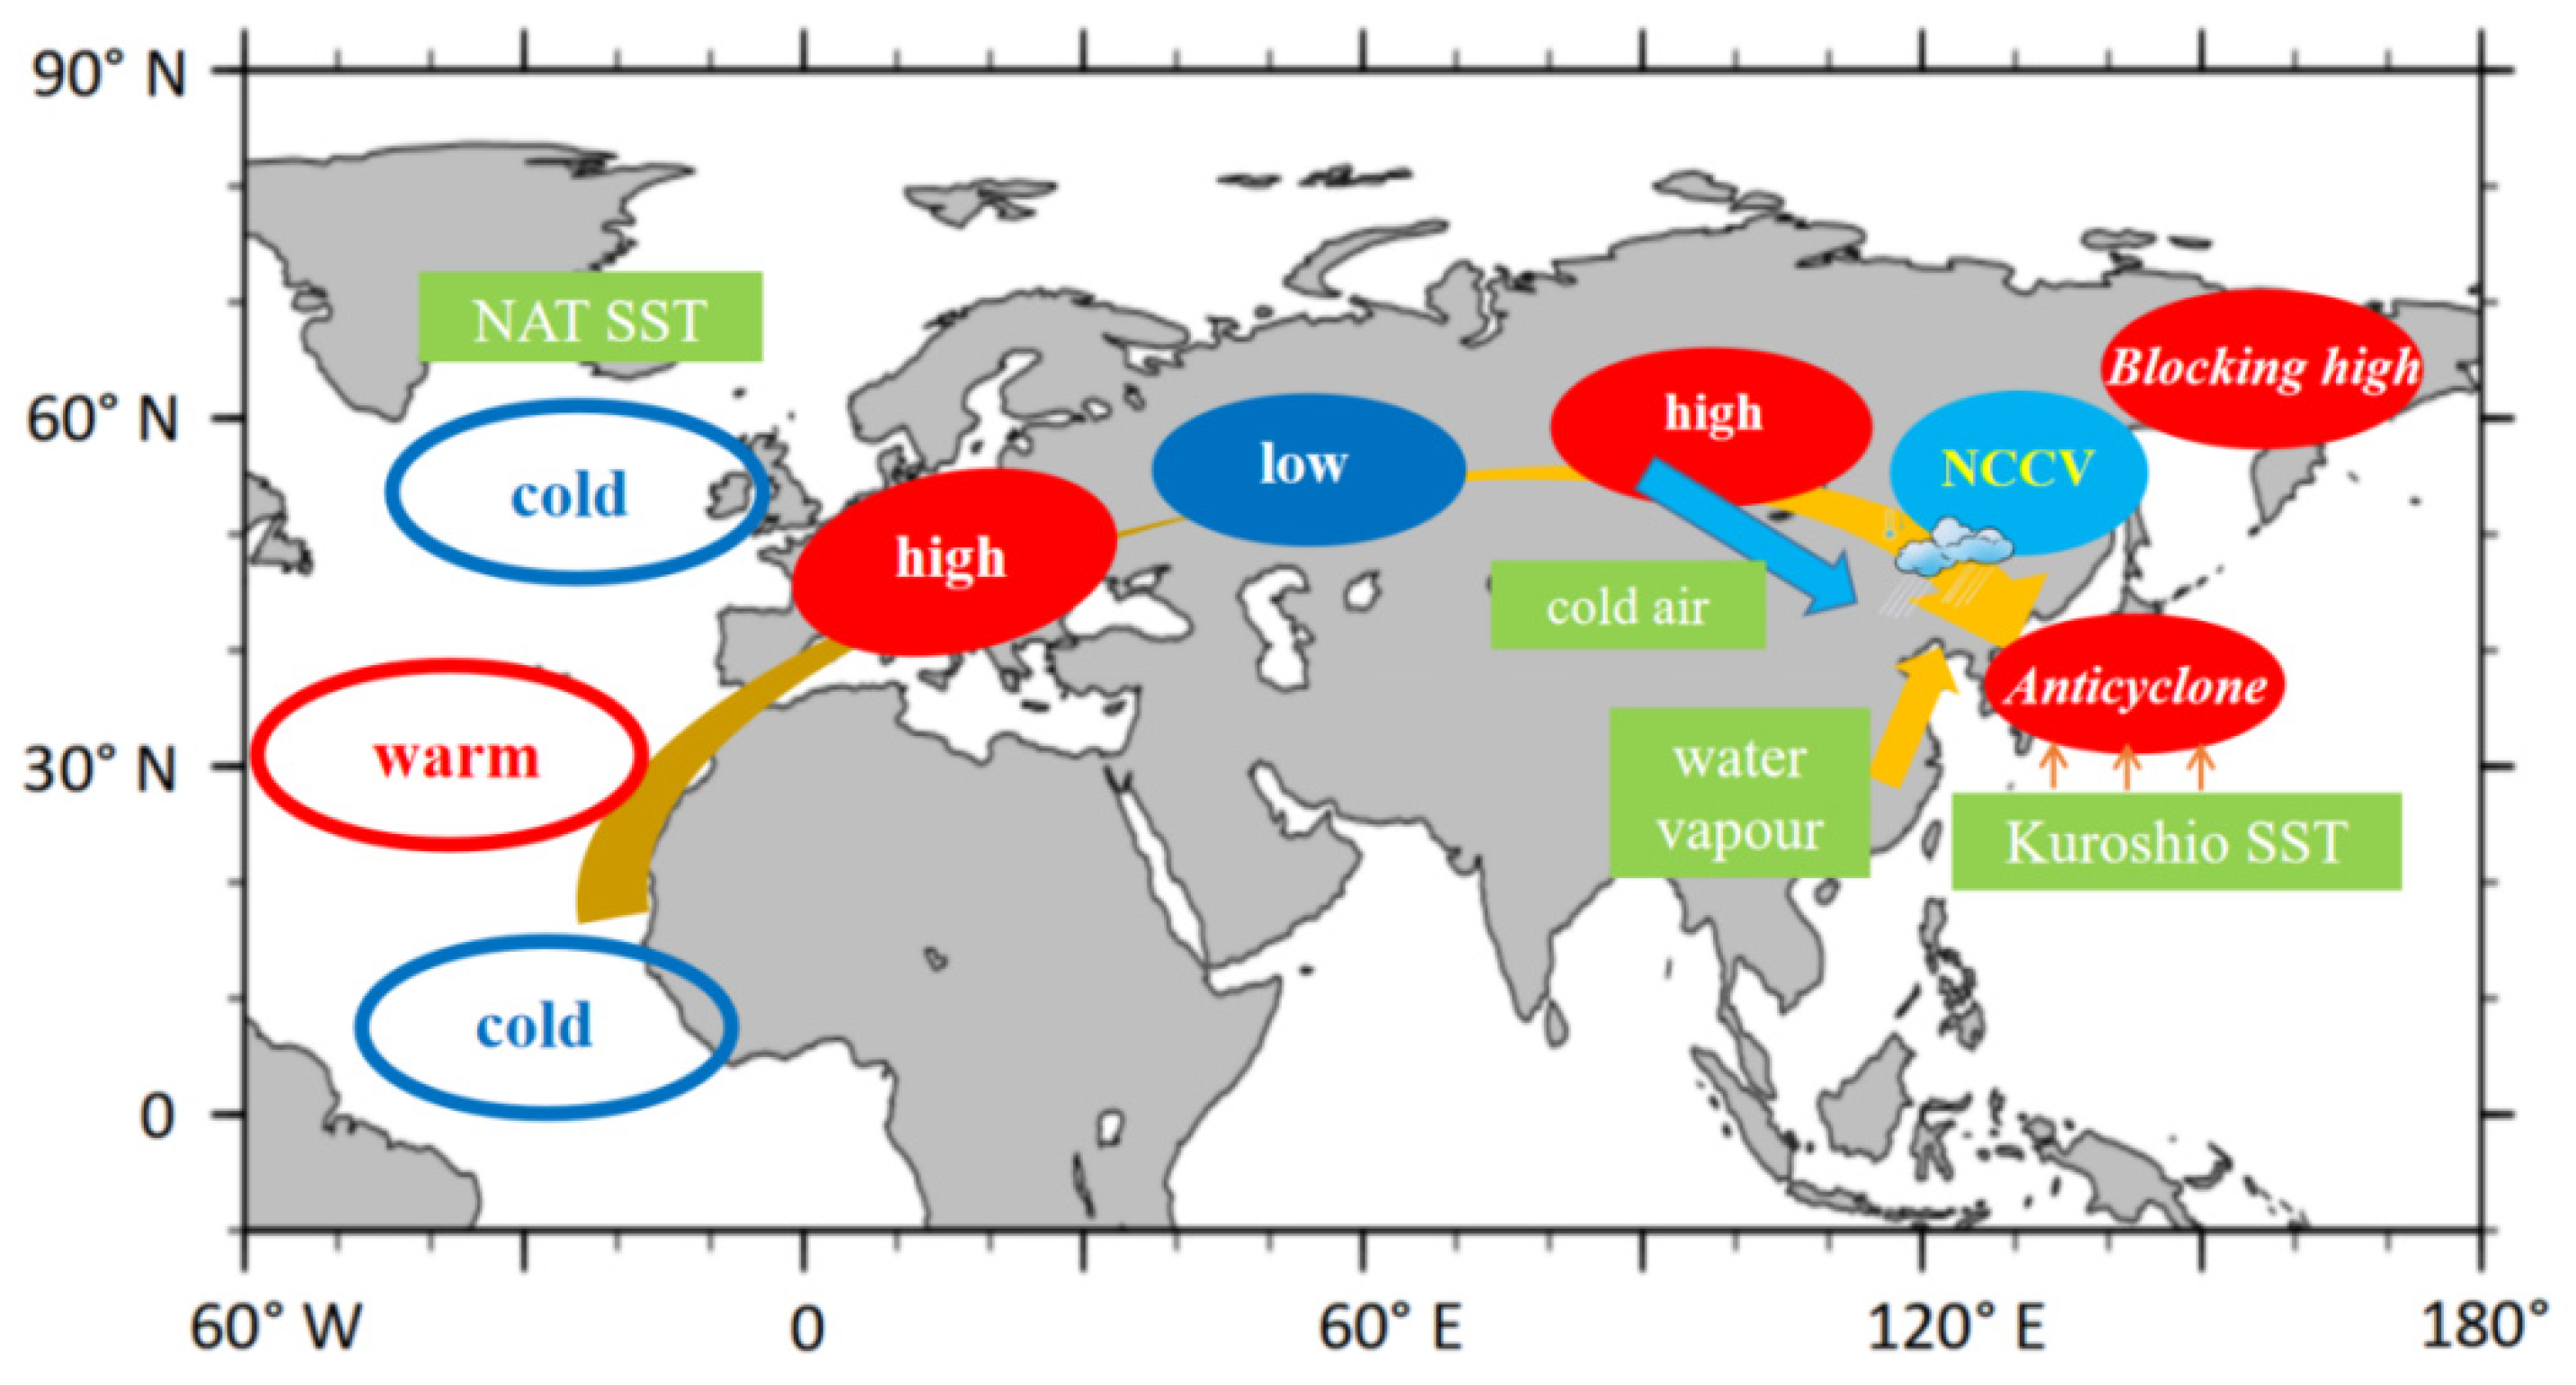
(3) The NAT SST anomaly in March 2022 stimulated eastward-propagating wave energy through air–sea interaction, resulting in the anomalous circulation pattern in which the NCCV cooperated with the BHOS in the mid-high latitudes of East Asia. Based on the background atmospheric circulation favorable for precipitation, the SST warming of the Kuroshio in June lead to a more northward and stronger anomalous anticyclone in the northwestern Pacific, which provided more water vapor for NEC, resulting in unprecedented precipitation in June 2022 (Figure 13).
The results are based on statistical analysis. Fang et al. [3] have conducted a series of numerical experiments related to the conclusion, which can provide further support for the results of this paper. In addition, we noticed that although the configuration of the atmospheric circulation for ten days of June 2022 is basically the same as that of the whole month, there are also specific differences in the atmospheric circulation pattern for every ten days. This paper analyzes the impact mechanism of SST signals on the atmospheric circulation on a monthly time scale; the situation every ten days of June may need to be examined separately. Moreover, here we mainly focus on the influences of previous SST on atmospheric circulation in the mid-high latitudes which may also provide guidance for the long-range prediction of NEC precipitation, while snow cover influences in the Qinghai-Tibet Plateau [14], and Arctic Sea ice [15,16] may also play an important role. The synergistic effects of different signals deserve further analysis.

Author Contributions

Conceptualization, Y.F.; methodology, Y.L.; validation, Y.F.; formal analysis, J.W.; investigation, Z.K.; resources, C.Z.; data curation, Y.F.; writing—original draft preparation, Y.L. and Y.F; writing—review and editing, Y.L. and Y.F.; visualization, Y.L. and K.T.; supervision, J.W. and Z.K.; project administration, C.Z.; funding acquisition, Y.F. and C.Z. All authors have read and agreed to the published version of the manuscript.

Funding

This research was funded by the National Natural Science Foundation of China (Grant Nos. 42005037); Special Project of Innovative Development, CMA (CXFZ2022J008, CXFZ2021J022, CXFZ2021Z011 and CXFZ2021J028); and Research Project of the Institute of Atmospheric Environment, CMA (2021SYIAEKFMS08 and 2020SYIAE08).

Institutional Review Board Statement

Not applicable.

Informed Consent Statement

Not applicable.

Conflicts of Interest

The authors declare no conflict of interest.

References

  1. Shen, B.Z.; Lin, Z.D.; Lu, R.Y.; Lian, Y. Circulation anomalies associated with interannual variation of early- and late-summer precipitation in Northeast China. Sci. China Earth Sci. 2011, 41, 402–412. (In Chinese) [Google Scholar] [CrossRef]
  2. Liu, G.; Feng, G.L.; Qin, Y.L.; Zeng, Y.X.; Yang, X.; Yao, S. “Cumulative effect” of cold vortex precipitation in Northeast China in early summer. Chin. J. Atmos. Sci. 2017, 41, 202–212. (In Chinese) [Google Scholar] [CrossRef]
  3. Fang, Y.H.; Chen, K.Q.; Chen, H.S.; Xu, S.-Q.; Geng, X.; Li, T.-Y.; Teng, F.-D.; Zhou, X.-Y.; Wang, Y.-G. The Remote Responses of Early Summer Cold Vortex Precipitation in Northeastern China Compared with the Previous Sea Surface Temperatures. Atmos. Res. 2018, 214, 399–409. [Google Scholar] [CrossRef]
  4. Zuo, J.Q.; Li, W.J.; Sun, C.H.; Xu, L.; Ren, H.-L. Impact of the North Atlantic Sea Surface Temperature Tripole on the East Asian Summer Monsoon. Adv. Atmos. Sci. 2013, 30, 1173–1186. [Google Scholar] [CrossRef]
  5. Fang, Y.H.; Lin, Y.T.; Ren, H.L.; Zhao, C.-Y.; Zhou, F.; Li, Q.; Gu, C.-L. Possible Relationships between the Interannual Anomalies of the South-North Positions of the Northeastern China Cold Vortexes and the Sea Surface Temperatures (SSTs) during the Early Summer Periods. Front. Earth Sci. 2020, 8, 557014. [Google Scholar] [CrossRef]
  6. Lu, R.; Zhu, Z.W.; Li, T.; Zhang, H. Interannual and interdecadal variabilities of spring rainfall over Northeast China and their associated sea surface temperature anomaly forcings. J. Clim. 2020, 33, 1423–1435. [Google Scholar] [CrossRef]
  7. Zhu, Z.W.; Lu, R.; Fu, S.S.; Chen, H. Alternation of the Atmospheric Teleconnections Associated with the Northeast China Spring Rainfall during a Recent 60-Year Period. Adv. Atmos. Sci. 2022, in press. [CrossRef]
  8. Kalnay, E.; Kanamitsu, M.; Kistler, R.; Collins, W.; Deaven, D.; Gandin, L.; Iredell, M.; Saha, S.; White, G.; Woollen, J.; et al. The NCEP/NCAR 40-Year Reanalysis Project. Bull. Am. Meteor. Soc. 1996, 77, 437–472. [Google Scholar] [CrossRef]
  9. Huang, B.Y.; Peter, W.; Thorne, W.P.; Banzon, V.F.; Boyer, T.; Chepurin, G.; Lawrimore, J.H.; Menne, M.J.; Smith, T.M.; Vose, R.S.; et al. NOAA Extended Reconstructed Sea Surface Temperature (ERSST), Version 5; NOAA National Centers for Environmental Information: Asheville, NC, USA, 2017. [Google Scholar] [CrossRef]
  10. North, G.R.; Bell, T.; Cahalan, R.; Moeng, F.J. Sampling errors in the estimation of empirical orthogonal function. Mon. Wea. Rev. 1982, 110, 699–706. [Google Scholar] [CrossRef]
  11. Kosaka, Y.; Nakamura, H. A comparative study on the dynamics of the Pacific-Japan teleconnection pattern based on reanalysis anticyclone. Part I Pac. Jpn. Pattern J. Clim. 2008, 23, 5085–5108. [Google Scholar] [CrossRef] [Green Version]
  12. Wang, L.J.; Wang, C.; Guo, D. Evolution mechanism of synoptic-scale EAP teleconnection pattern and its relationship to summer precipitation in China. Atmos. Res. 2018, 214, 150–162. [Google Scholar] [CrossRef]
  13. Zhu, Z.W.; Lu, R.; Yan, H.; Li, W.K.; Li, T.; He, J.H. Dynamic Origin of the Interannual Variability of West China Autumn Rainfall. J. Clim. 2020, 33, 9643–9652. [Google Scholar] [CrossRef]
  14. Wu, J.; Liu, Y.; Li, Y.S. The extreme Northeast China Cold Vortex activities in the late spring of 2021 and possible causes involved. Adv. Clim. Chang. Res. 2023; in press. [Google Scholar] [CrossRef]
  15. Lin, Y.T.; Fang, Y.H.; Zhao, C.Y.; Gong, Z.Q.; Yang, S.Q.; Yu, Y.Q. The coordinated influence of Indian Ocean sea surface temperature and Arctic sea ice on anomalous Northeast China cold vortex activities with different paths during late summer. Adv. Atmos. Sci. 2022, in press. [CrossRef]
  16. Ma, S.M.; Zhu, C.W. The cooling over Northeast Asia in June over the most recent decade: A possible response to declining Bering Sea sea ice in March. Geophys. Res. Lett. 2022, 49, e2022GL097773. [Google Scholar] [CrossRef]
Figure 1. The geographical distribution of 245 stations (black dots) in Northeast China (NEC).
Atmosphere 13 01630 g001
Figure 2. (a) spatial distribution of anomaly percentage of precipitation (shadings, %) in June 2022, (b) time series of percentage of precipitation anomalies (bars, %) in June in NEC during 1961–2022, the black dot line denotes the 9-year sliding mean, the black dash line denotes the standard deviation (27.52%), and the black solid line denotes the linear trend of the original time series.
Atmosphere 13 01630 g002
Figure 3. The heterogeneous correlation-coefficient spatial patterns of the leading SVD mode of (a) precipitation in NEC (b) 500 hPa geopotential height in June during 2001–2021. (c) Correlation coefficients between NEC precipitation index and 500 hPa geopotential height in June during 2001–2021; dots denote significant correlations at 90% confidence level. Red boxes in (b) indicate the regions defining the East Asian Circulation Index (EAC-I).
Atmosphere 13 01630 g003
Figure 4. An 11-year sliding correlation between NEC precipitation and EAC-I in June during 1961–2021. The dashed line denotes the 90% confidence level.
Atmosphere 13 01630 g004
Figure 5. The composite differences in (a) 500 hPa geopotential height (shading, gpm), (b) 200 hPa zonal wind (shading, m s−1), (c) vertically integrated water-vapor flux (vector, kg m−1 s−1), (d) pressure vertical velocity (shading, Pa s−1) in the pressure–latitude cross-section along 120° E. Dots and grey shading denote the significant composite differences at 90% confidence level. The black contours in (b) denote the region where the climate mean zonal wind speed greater than 30 m s−1.
Atmosphere 13 01630 g005
Figure 6. Correlation coefficients between SST in March and (a) NEC precipitation and (b) EAC-I in June during 2001–2021. Dots denote significant correlations at 90% confidence level, and the three red boxes (b) indicate the regions defining the NAT-I.
Atmosphere 13 01630 g006
Figure 7. The lead–lag correlation of the March NAT-I between NEC precipitation (blue line) and EAC-I (red line) in June during 2001–2021. The dashed line denotes the 99% confidence level.
Atmosphere 13 01630 g007
Figure 8. Regressed wave activity flux (vector, m2 s−2) and 500 hPa geopotential height (shading, gpm) in June against the NAT-I in March during 2001–2021. Dots denote the correlations that are significant at 90% confidence level. Only the part with the regression coefficient of wave-activity flux greater than 0.05 is shown.
Atmosphere 13 01630 g008
Figure 9. The anomalies in (a) 500 hPa geopotential height (shading, gpm), (b) 200 hPa zonal wind (shading, m s−1), (c) vertically integrated water-vapor flux (vector, kg m−1 s−1), (d) pressure vertical velocity (shading, Pa s−1) in the pressure–latitude cross-section along 120° E in June 2022. The black contours in (b) denote the region where the climate mean zonal wind speed are greater than 30 m s−1.
Atmosphere 13 01630 g009
Figure 10. SST anomalies (℃) in (a) March, (b) April, (c) May, and (d) June 2022.
Atmosphere 13 01630 g010
Figure 11. Correlation coefficients between NWP-I and (a) SST, (b) sea-surface turbulent heat flux in June during 2001–2021. Dots denote the significant correlations at 90% confidence level, and the red boxes (a) represent the region defining the KS-I.
Atmosphere 13 01630 g011
Figure 12. Regressed geopotential height anomalies (gpm) at (a) 200 hPa, (b) 500 hPa, and (c) 850 hPa against the KS-I in June during 2001–2020. The dots denote the anomalies that are significant at 90% confidence level.
Atmosphere 13 01630 g012
Figure 13. Schematic diagram summarizing the factors leading to the extreme precipitation in June 2022.
Atmosphere 13 01630 g013
Table 1. Definitions of the circulation and SST indexes.
IndexesDefinitions
East Asian Circulation Index (EAC-I)The differences between the average 500 hPa geopotential heights over 135° E–160° E, 55° N–65° N and 110° E–130° E, 40° N–50° N in June
Northwest Pacific Anticyclone Index (NPA-I)The average geopotential heights over 120° E–150° E and 26° N–42° N in June
North Atlantic Triple Index (NAT-I)The differences between the average SSTs in the high latitude region (60° W–30° W, 50° N–66° N) and low latitude region (42° W–16° W, 0° N–30° N), and middle latitude region (78° W–30° W, 30° N–46° N) in March
Kuroshio SST Index (KS-I)The average SST in the Kuroshio region (126° E–160° E, 20° N–40° N) in June
Publisher’s Note: MDPI stays neutral with regard to jurisdictional claims in published maps and institutional affiliations.

