Article

Analysis of the Radon Concentration in Selected Rooms of Buildings in Poznan County

by
Joanna Aleksandra Kubiak
1 and
Małgorzata Basińska
2,*
1
Doctoral School of the Poznan University of Technology, 60-965 Poznan, Poland
2
Institute of Environmental Engineering and Building Installations, Poznan University of Technology, 60-965 Poznan, Poland
*
Author to whom correspondence should be addressed.
Atmosphere 2022, 13(10), 1664; https://doi.org/10.3390/atmos13101664
Submission received: 29 August 2022 / Revised: 7 October 2022 / Accepted: 10 October 2022 / Published: 12 October 2022
(This article belongs to the Special Issue Feature Papers in Air Quality)

Abstract

:
This article presents the results of the research carried out in selected rooms of buildings located in Poznan. According to the measurements, the highest average radon concentration in the buildings in Poznan County was at the level of 130 ± 32 Bqm−3. The lowest mean concentration was 31 ± 8 Bqm−3 and was measured in a seven-year-old educational institution. Based on the performed measurements, non-uniformity of the correlation between the radon concentration and temperature and humidity was observed. For all the measurement sites where volatile organic compounds were counted, a positive correlation with radon was observed (rxy = 0.31, p < 0.001). A negative correlation was obtained (rxy = −0.15, p < 0.001) between the concentration of radon and the concentration of carbon dioxide. Based on the analysis of the research conducted, it was found that the concentration of radon in a given room depends on many factors, such as temperature, humidity, and room usage profile.

1. Introduction

Radon is a colorless, odorless radioactive gas that is derived from the uranium series. The half-life of this element is 3.83 days. The amount of radon emission depends on the geology of the area. The possibility for isotopes to transport in the soil depends on soil porosity, moisture, and permeability [1]. In the outdoor environment, recorded radon concentrations, based on many years of measurements, are much lower than those recorded indoors [2]. Measurements of outdoor radon concentration can be used to analyze atmospheric processes, but its concentration is low in comparison to radon in buildings [2]. Indoor radon concentrations may pose a health hazard to people staying in the room [3,4].
Radon infiltrates buildings through leaks in the casing, through decomposition in building materials, and because of the “chimney effect” [5,6]. The chimney effect is the movement of gas under the influence of a pressure difference caused by a temperature difference. This effect introduces the air of the soil, which contains a large amount of radon, into the building. As much as 75% of the radon accumulated in buildings is assumed to be caused by this phenomenon [5].
Building materials are another source of radon in rooms. Research conducted in Poland [7] has shown that the materials that are distinguished by their relatively large emanation of radon are concrete and granite. However, the ground on which the building is located remains the largest source of radon. Radon enters houses through gaps in the building materials and the pressure differences.
Table 1 shows the sources of radon, along with the approximate influence on the radon profile in the building.
If people are exposed to ionizing radiation, including radon radiation, a risk assessment method must be implemented. To define the effect of ionizing radiation, radiation doses are introduced. The absorbed dose determines the amount of energy transferred by radiation to a given object per unit mass and is expressed in Gray. The effective dose, in addition to the absorbed dose, considers the type of tissue and the type of radiation, which we express in Sv. Any ionizing radiation can damage cells in the body at the DNA level. The body’s ability to repair radiation damage is limited. A higher dose and a longer exposure to a given dose will cause more damage to the body [8]. The effects of radiation exposure are classified as stochastic and deterministic. Changes in DNA at the level of individual cells cause the stochastic effects of radiation. Stochastic effects may reveal themselves with a significant delay and in the next generations. Deterministic effects are caused by irreversible changes at the organ level as a large number of cells are damaged. A dose above 1 Gy taken for several hours causes symptoms of acute radiation sickness. The radiation dose limit that causes negative effects on the human body is still a matter of scientific debate. Recent studies indicate that long-term exposure to relatively small doses of radiation, in the order of a few milli sieverts, may contribute to the development of neoplastic diseases [9,10]. It should be emphasized that the most sensitive organisms are those whose organs are still developing. Thus children are particularly exposed to ionizing radiation.
To prevent radiation, according to the ALARA (As Low As Reasonably Achievable) principle, limit values have been established for radon concentrations in buildings to mitigate the effects of exposure to natural radiation. The WHO recommends a threshold for the radon concentration threshold at 100 Bqm−3 [11]. In Poland, this threshold has been set at the level of 300 Bqm−3. However, there are studies that indicate the need to lower the threshold to 50 Bqm−3 [12]. To reduce the radon concentration in the building, rooms should be aired. However, this treatment may not eliminate the concentration of radon to a satisfactory degree, which is why other solutions are often necessary, such as sealing the building, mounting mechanical ventilation or the use of radon wells [13]. Radon and other air pollutants are related [14,15]. However, this topic requires further research.
The aim of this study is to determine the variability of radon concentrations in selected rooms presented in the article and to investigate the correlation of radon with other pollutants. The buildings had different user profiles, different ways of delivering air for ventilation purposes and different locations.

2. Materials and Methods

2.1. Site

Indoor air quality (IAQ) tests were carried out in selected buildings, considering their location and the method of ventilation. Measurements were made in three buildings. Building A, built in 2014, is located in the eastern part of Poznań on the campus of Poznan University of Technology. The measuring device was installed on the second floor of the building, in an office room, at a height of approximately 1.5 m above the floor of the room. The building is supplied with heat using heat pumps, supported by the district heating network. Building B, built in 2005, is located in a small town in Poznań County. The exterior walls of the building are made of ceramic blocks. The house is heated with natural gas. Two measuring devices were installed in the building in separate rooms marked B1 and B2. Room B1 is an intransitive room, room B2 is an interconnecting room. Both meters were mounted approximately 1.5 m above the floor of the room. Building C is a nursery. The walls of the building were erected in the early twentieth century. The exterior walls of the building are made of concrete. The district heating network is the source of heat. The meters were installed in two rooms on the ground floor, C1 at a height of 2.5 m and C2 at a height of 1.5 m above the floor of the room. Table 2 includes the characteristics of individual rooms and the geological condition [16].

2.2. Measuring Devices

Ethera meters were used to measure air quality. Table 3 contains information regarding the measurement modules used on the device. The measurement set included two independent measuring devices that measured: Air temperature, humidity, atmospheric pressure, radon concentration, TVOC concentration, carbon dioxide concentration and weight quantity of PM2.5 and PM10 dusts. In the case of devices to measure the internal environment, it was also possible to measure the PM1 and PM4 fractions. Radon was measured in the device using a pulsed ionization chamber.
To compare the results obtained, a local measuring station located 500 m from building B was used, namely the SYNGEOS dust meter [18]. The meter is owned by the Poznań Metropolis Association.

2.3. Time of Measurements

Measurements of air quality parameters, supplemented with measurements of radon concentration, were carried out during the period 15 October 2021 to 26 March 2022. The measurement period for individual measurement sites is presented in Table 4. Measurements were made continuously at a 10-min frequency.

2.4. Methods

The R computing environment, which is a free environment for data analysis, was used to analyze the variability of the radon concentration and its correlation with other IAQ parameters in the rooms. To assess the variability of radon, the arithmetic mean, the median of the measurements from the given measurement period and the standard deviation for the mean were calculated.
Individual results for the radon concentration and other air parameters were presented using a box diagram. The median n the box diagram was marked with a horizontal (or vertical) line in the box and the mean was marked with a plus. The minimum and maximum were successively defined as the first quartile minus 1.5IQR (interquartile range) and the third quartile added 1.5∙IQR. Measurement points smaller than the minimum and maximum were marked as points.
The variability of the radon profile was determined using the R environment. The variation in radon during the week was presented using graphs made in the R environment. The graphs show the mean value for hours per week with a 95% confidence interval. The R environment function—“chart. Correlation”—to analyze the correlation was used. Correlations were calculated using the Pearson correlation coefficient—rxy—for which the relationship was presented in Formula (1).
r xy = c o v ( X , Y ) σ X σ Y
where cov(X,Y) is the covariance between the variables x and y; and σX, σY is standard deviation of the data set x and y consecutively.
The interpretations of the correlation coefficient were adopted in accordance with Table 5.
The distribution of measurements with correlations was presented by means of a matrix. The significance test of the correlation coefficient was based on the alternative hypothesis that the correlation between the sets was not 0. The null hypothesis was assumed as rxy = 0. Before the test was performed, the probability of rejecting the true null hypothesis was determined. This probability was determined by the value of α, which was the significance level. The lower the value of α, the higher the probability that the null hypothesis must be rejected because it is false. In the data analysis, the ranges of the p-parameter were assumed according to Table 6.

3. Research Results

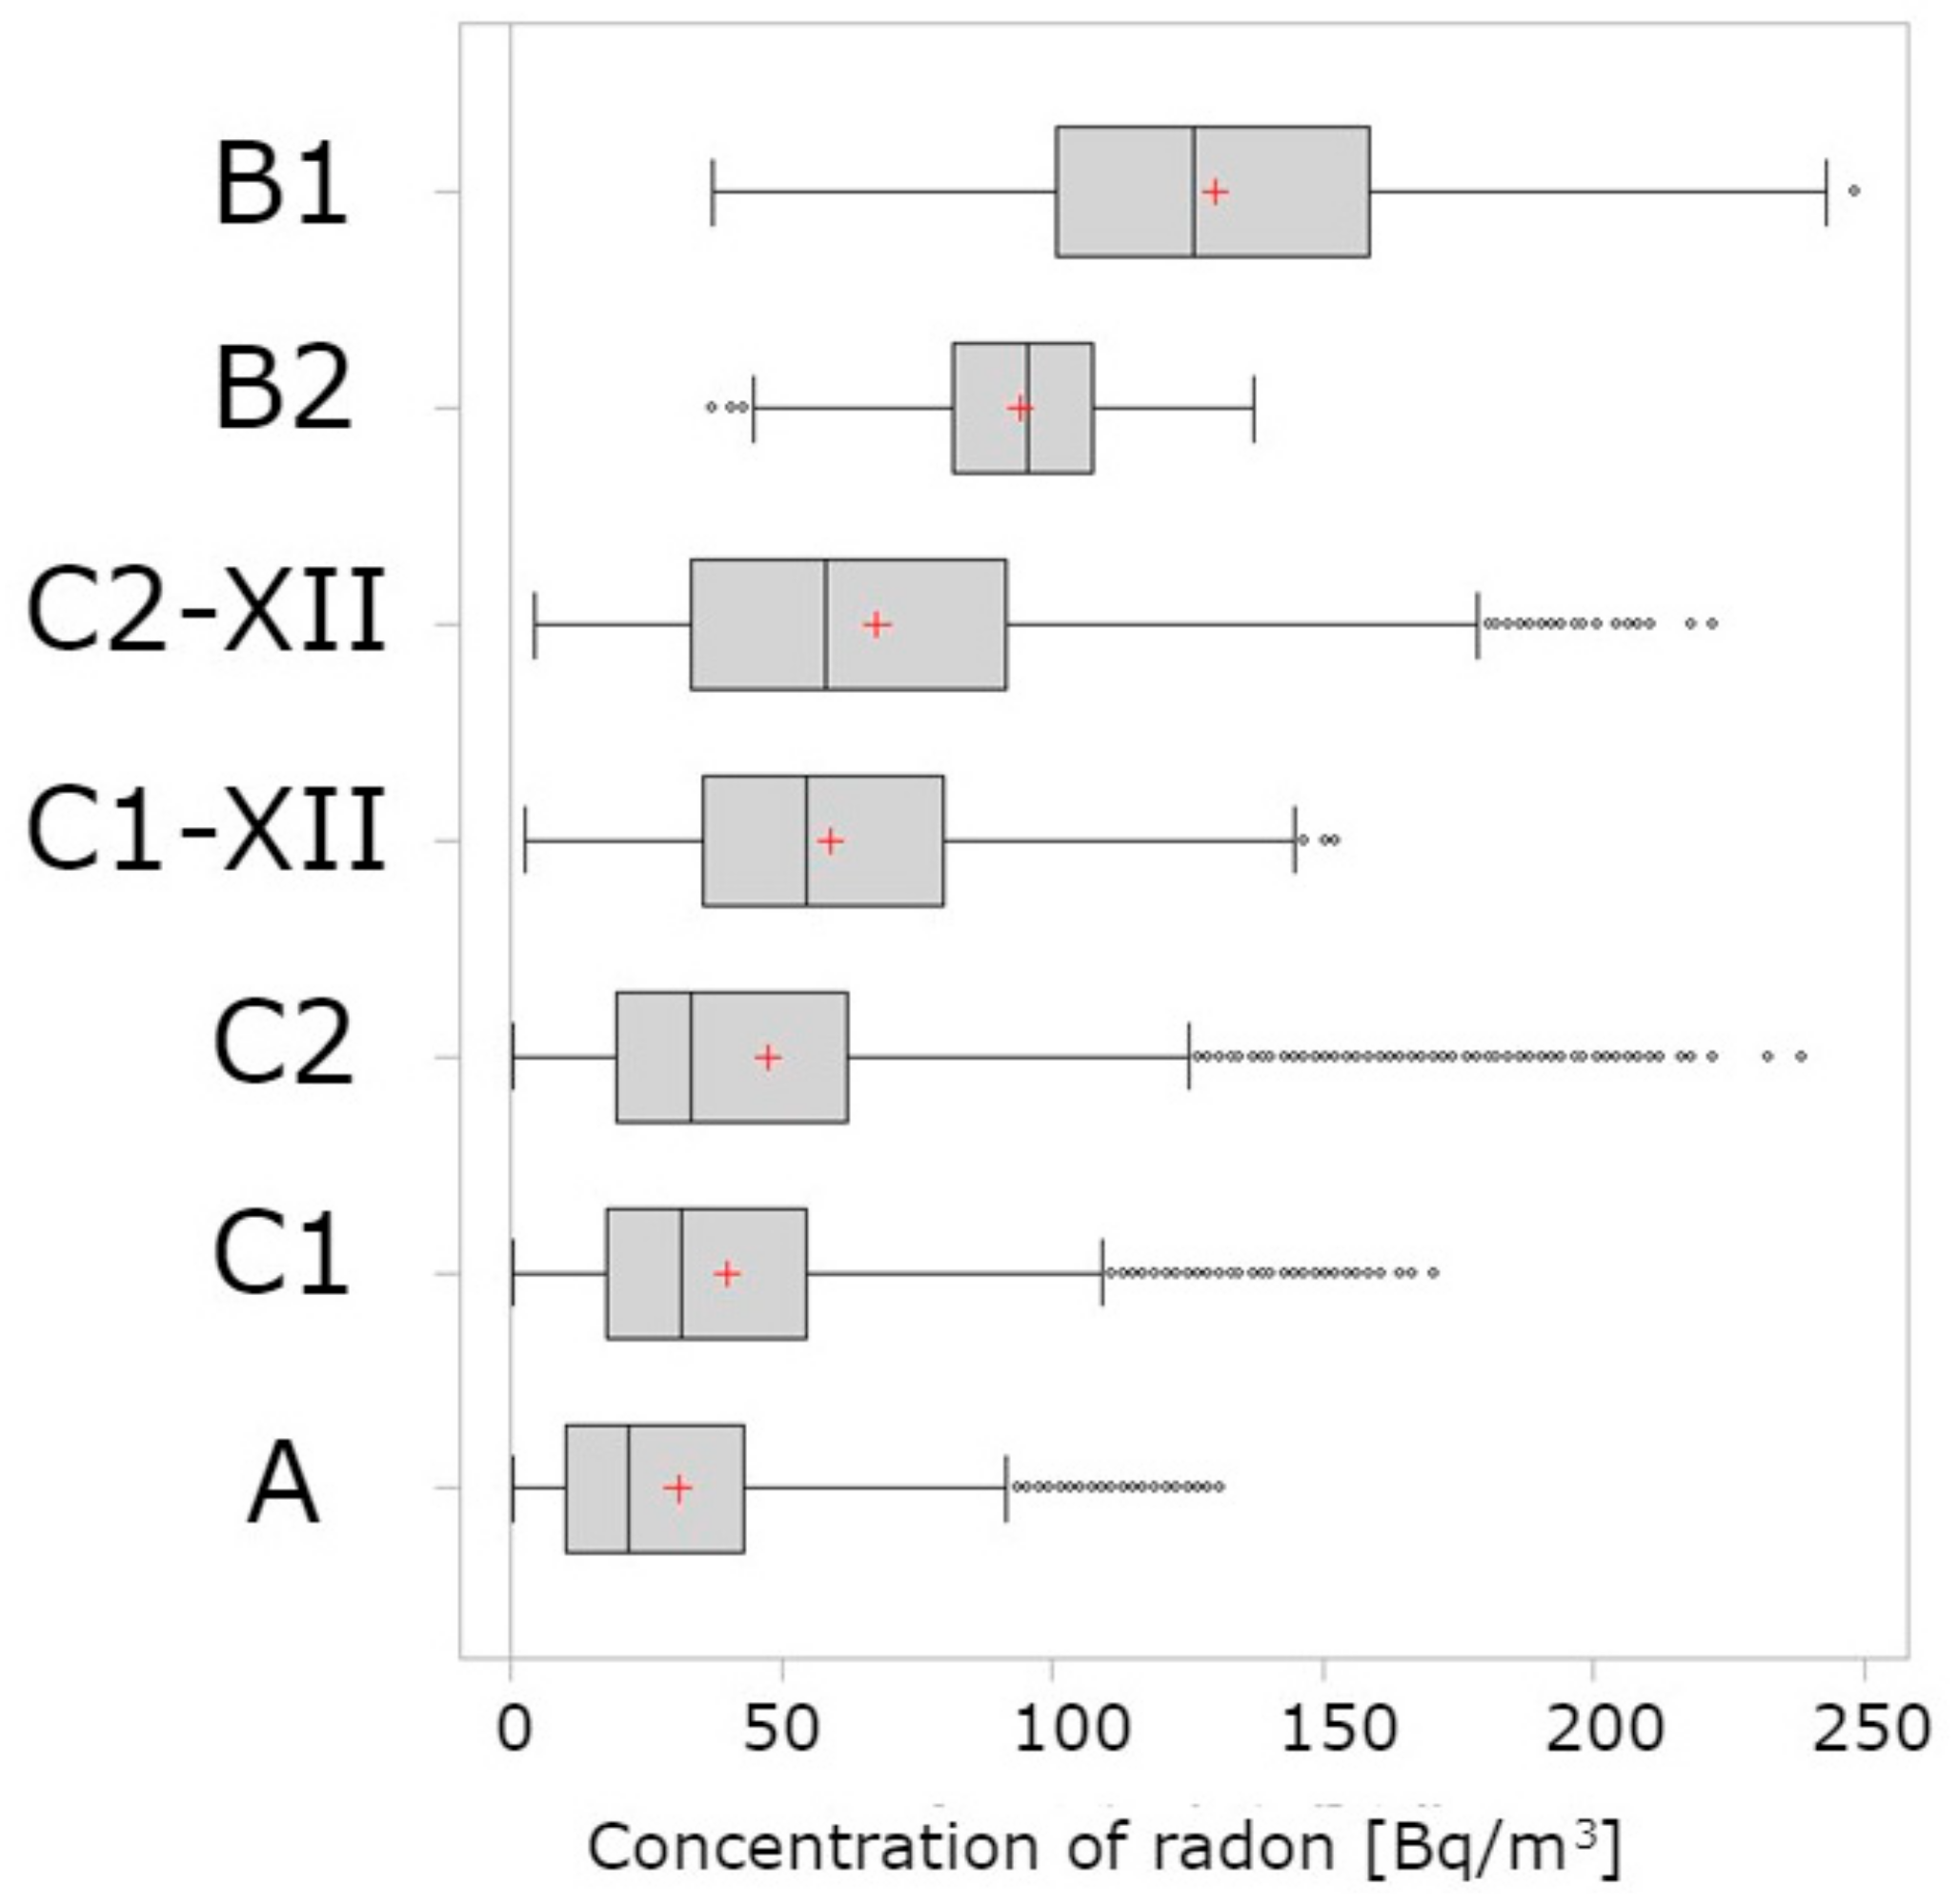
3.1. Average Radon Concentration

The average radon concentration for the buildings analyzed was calculated for the given measurement periods and measurement points. The results are shown in Figure 1 and show a box plot of radon concentration. The results were sorted in descending order according to the average radon concentration.
Based on the analyzes shown in Figure 1, it was found that:
  • For building B, for room B1, the highest value of the average radon concentration was obtained at the concentration level of 130 ± 32 Bqm3, at the median of 126 Bqm−3. For room B2, the mean value was obtained, respectively, as 93 ± 23 Bqm−3 and a median of 95 Bqm−3.
  • In building C in December, the average concentration was 59 ± 15 Bqm−3 and 67 ± 17 Bqm−3, respectively for rooms C2 and C1. In February, the recorded average radon concentration was 50% lower than in December. For the entire measurement period for the C1 rooms, the mean value was obtained at the level of 40 ± 10 Bqm−3 and median of 31 Bqm−3, and for room C2 45 ± 11 Bqm−3, the median was 32 Bqm−3.
  • The lowest radon concentration was recorded in a building with an operating supply and exhaust ventilation with a controlled concentration of carbon dioxide in the room. The average concentration recorded in building A was at the level of 31 ± 8 Bqm−3 and a median of 21 Bqm−3.
  • The monthly variability of the radon concentration was observed.

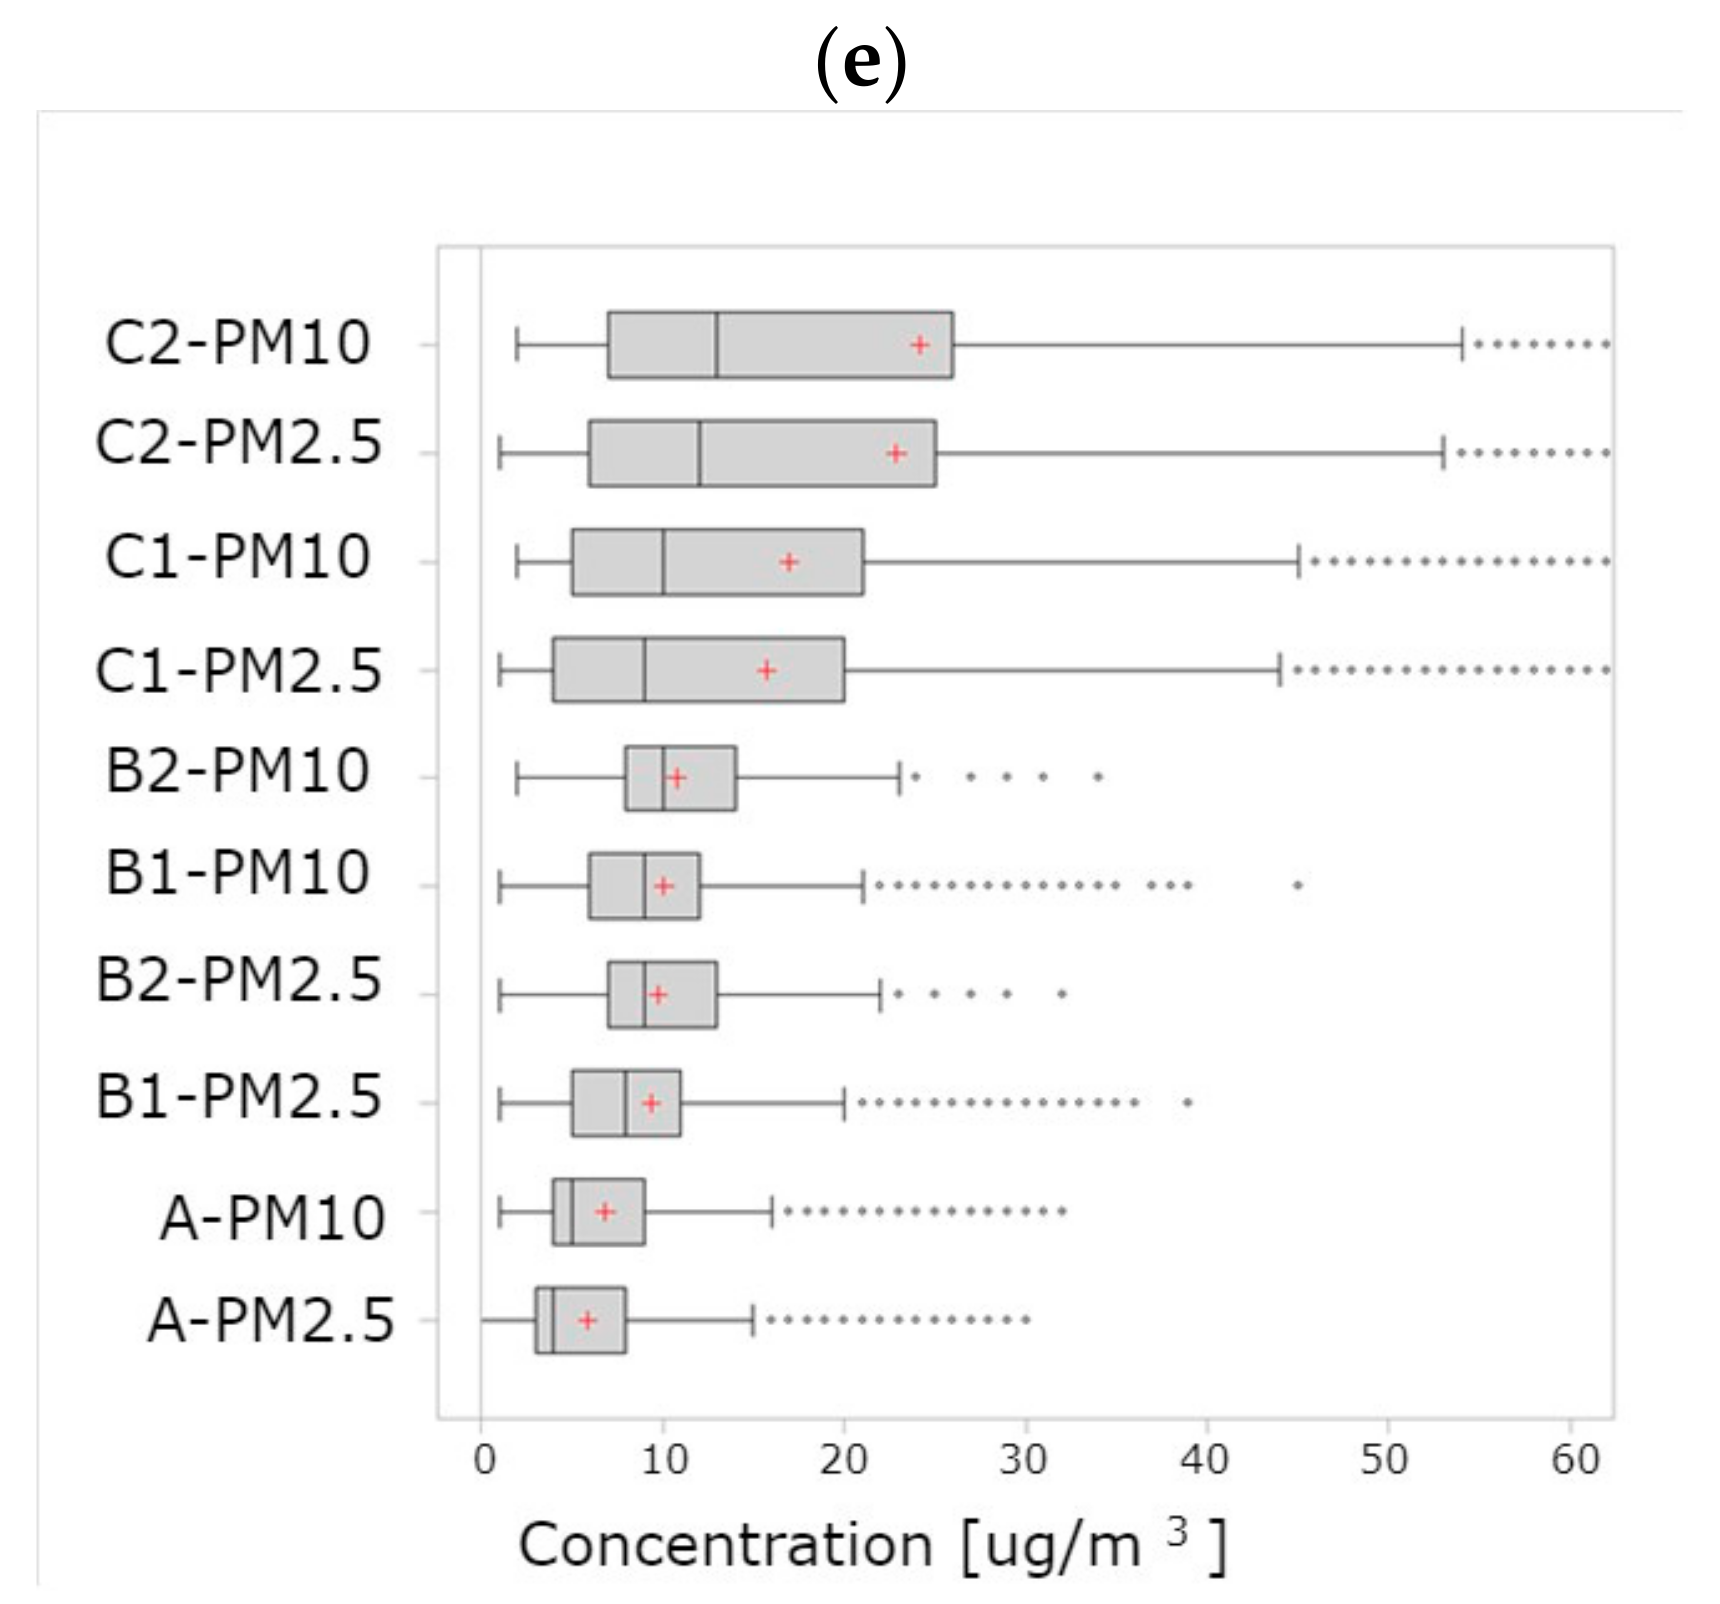
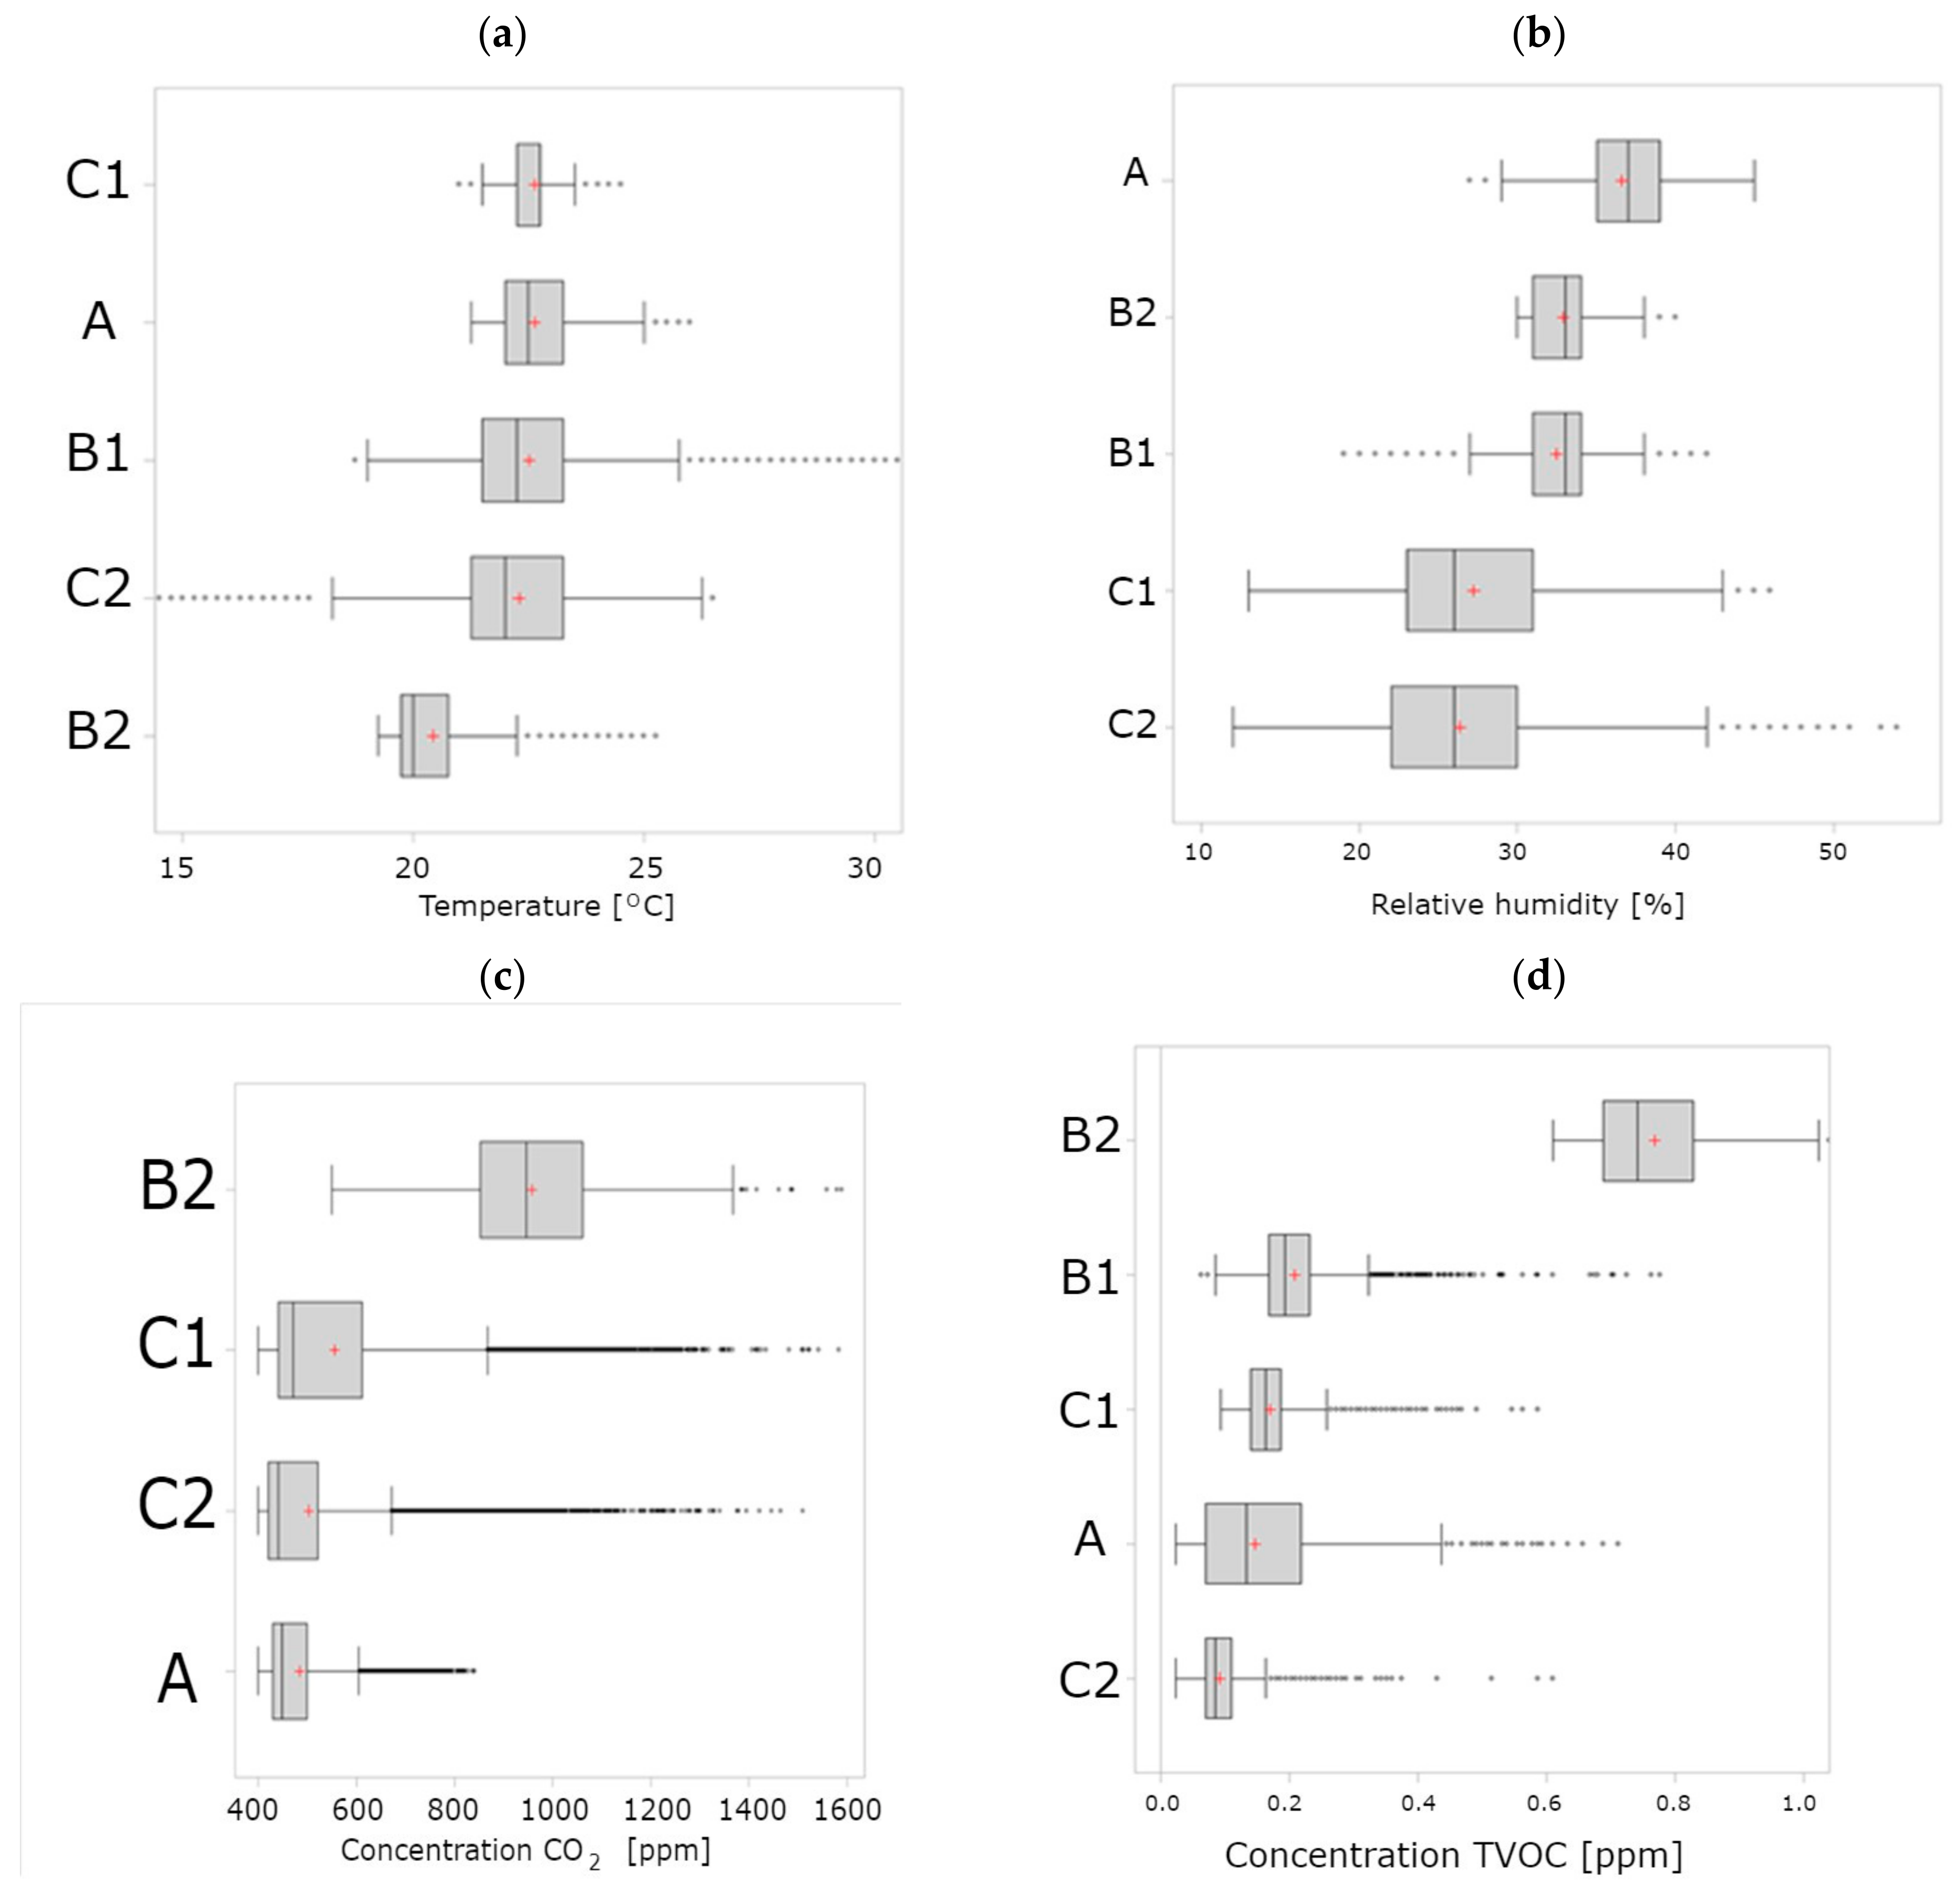
3.2. Concentrations of Indoor Air Quality Parameters

To illustrate the physical and chemical correlation of indoor air quality parameters, the statistical values of the remaining IAQ parameters analyzed in Figure 2 are presented.
Based on the drawings (Figure 2), it can be seen that the average temperature in most rooms, maintained by heating systems, was similar to 22 °C; room B2 stood out, with a lower average temperature of about 20.5 °C. The smallest temperature fluctuations occurred in room C1. The highest relative humidity, at the level of 37%, was in room A. The highest average value of carbon dioxide concentration, at a level of 950 ppm, was in room B2. In the remaining analyzed rooms, a similar average concentration was recorded, at the level of 500–600 ppm. Dust concentration was the highest in room C2 and the lowest in room A. The highest recorded dust concentration in room C was influenced by its by its function, the nursery. As presented in the publication [21], opening windows in buildings located in a polluted external environment leads to an increase in dust concentration in the room. Building A has an efficient supply and exhaust ventilation system that effectively cleans the air from suspended dust. The largest fluctuations in dust concentration occurred in rooms C1 and C2. The VOC concentration was the highest in room B2, with an average of almost 0.8 ppm. The remaining rooms showed an average of 0.1–0.2 ppm.

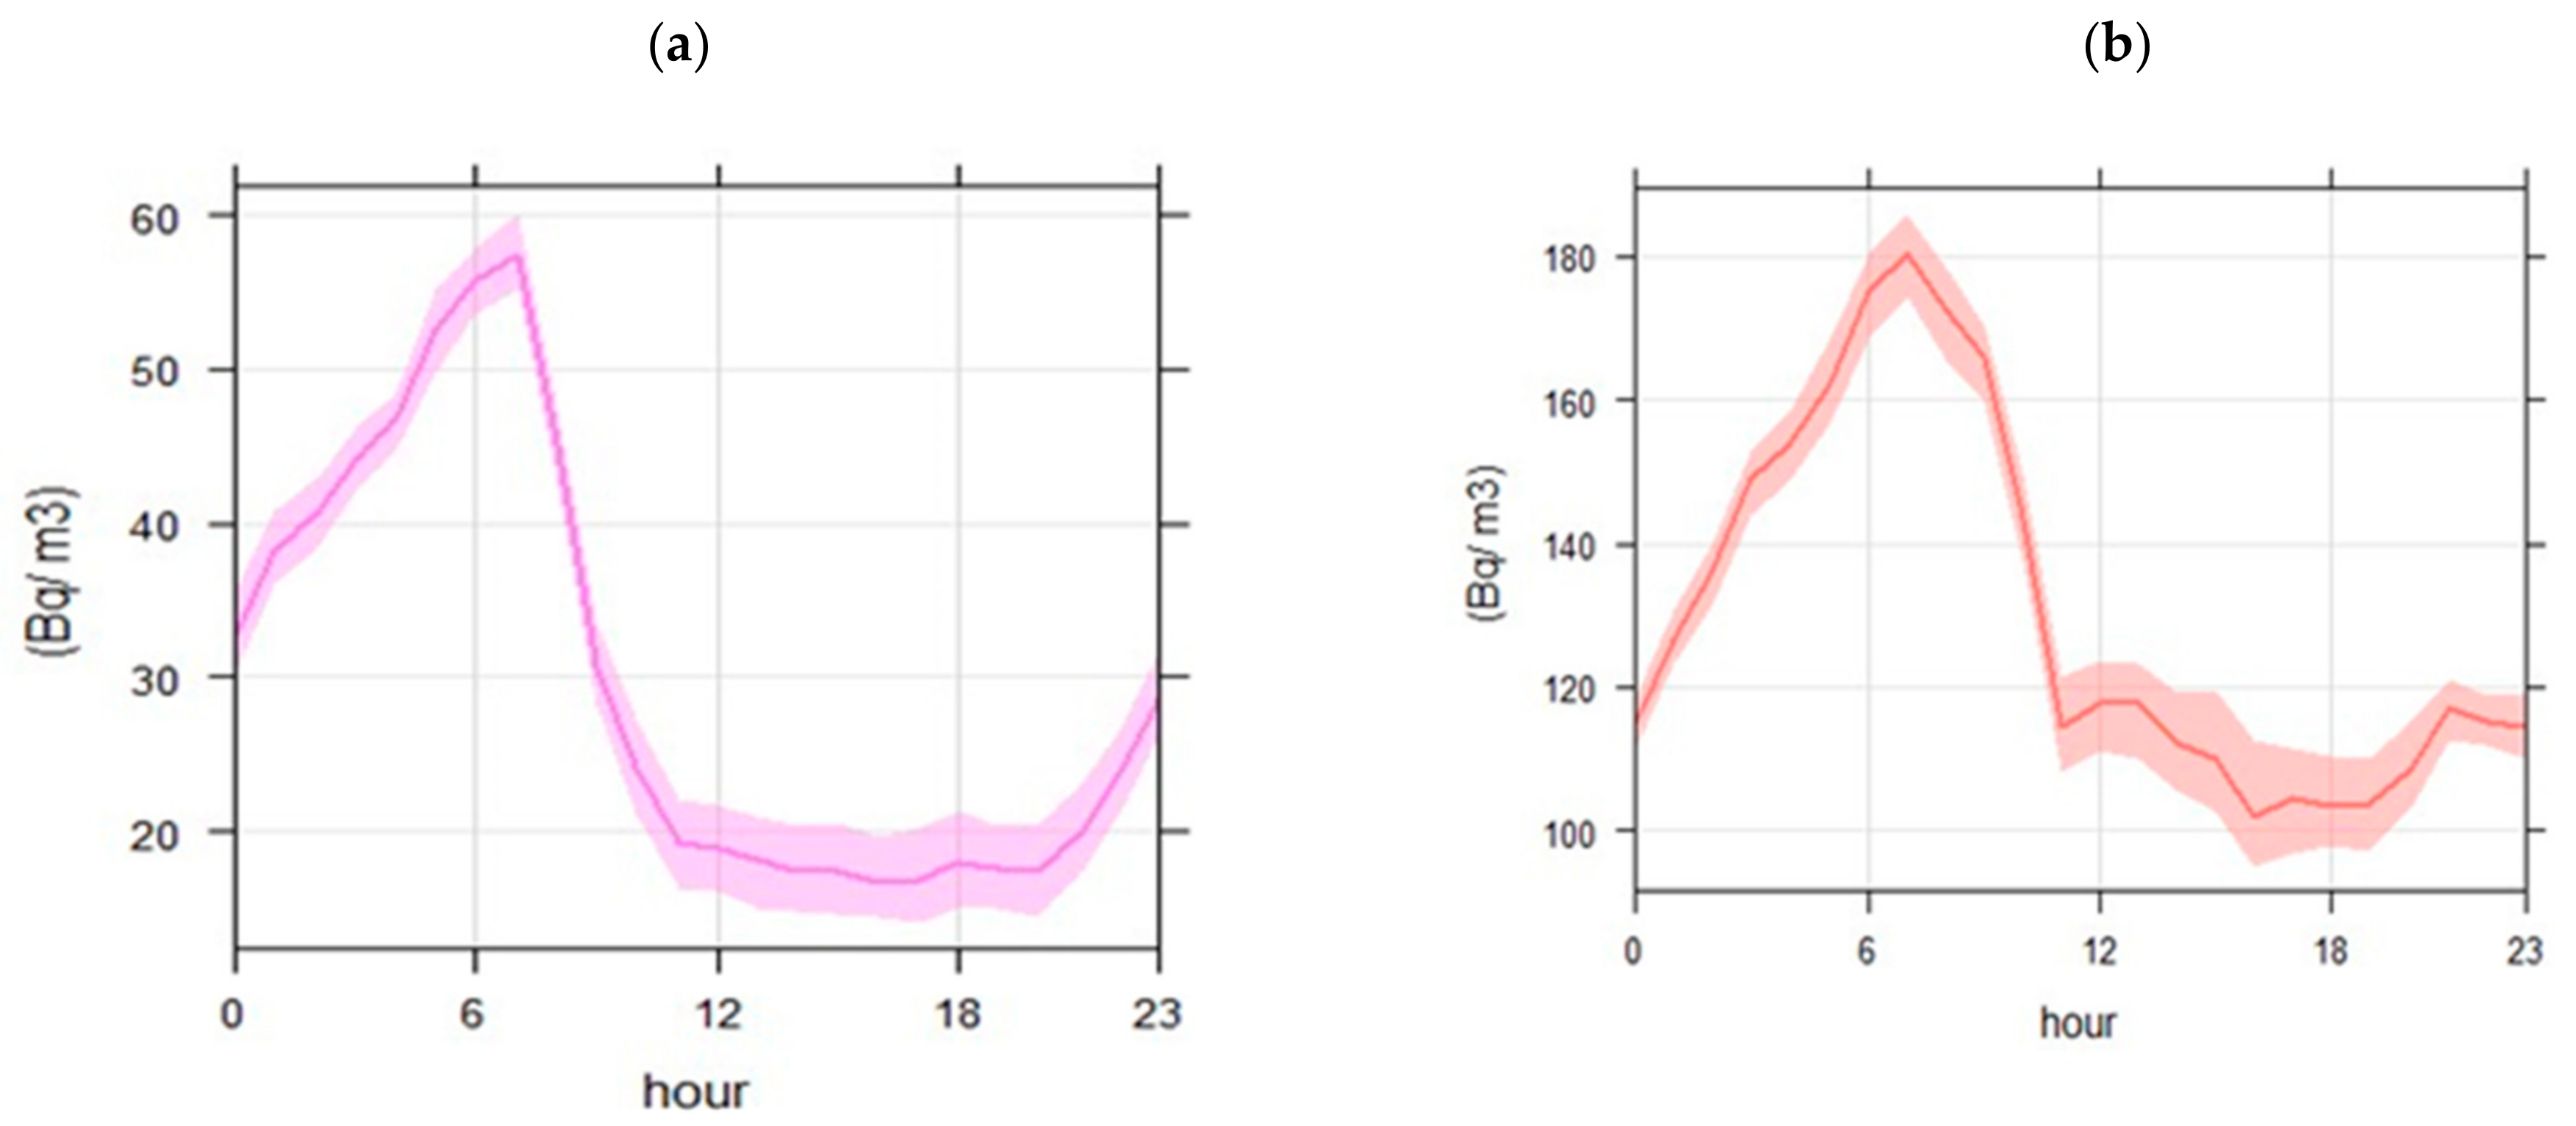
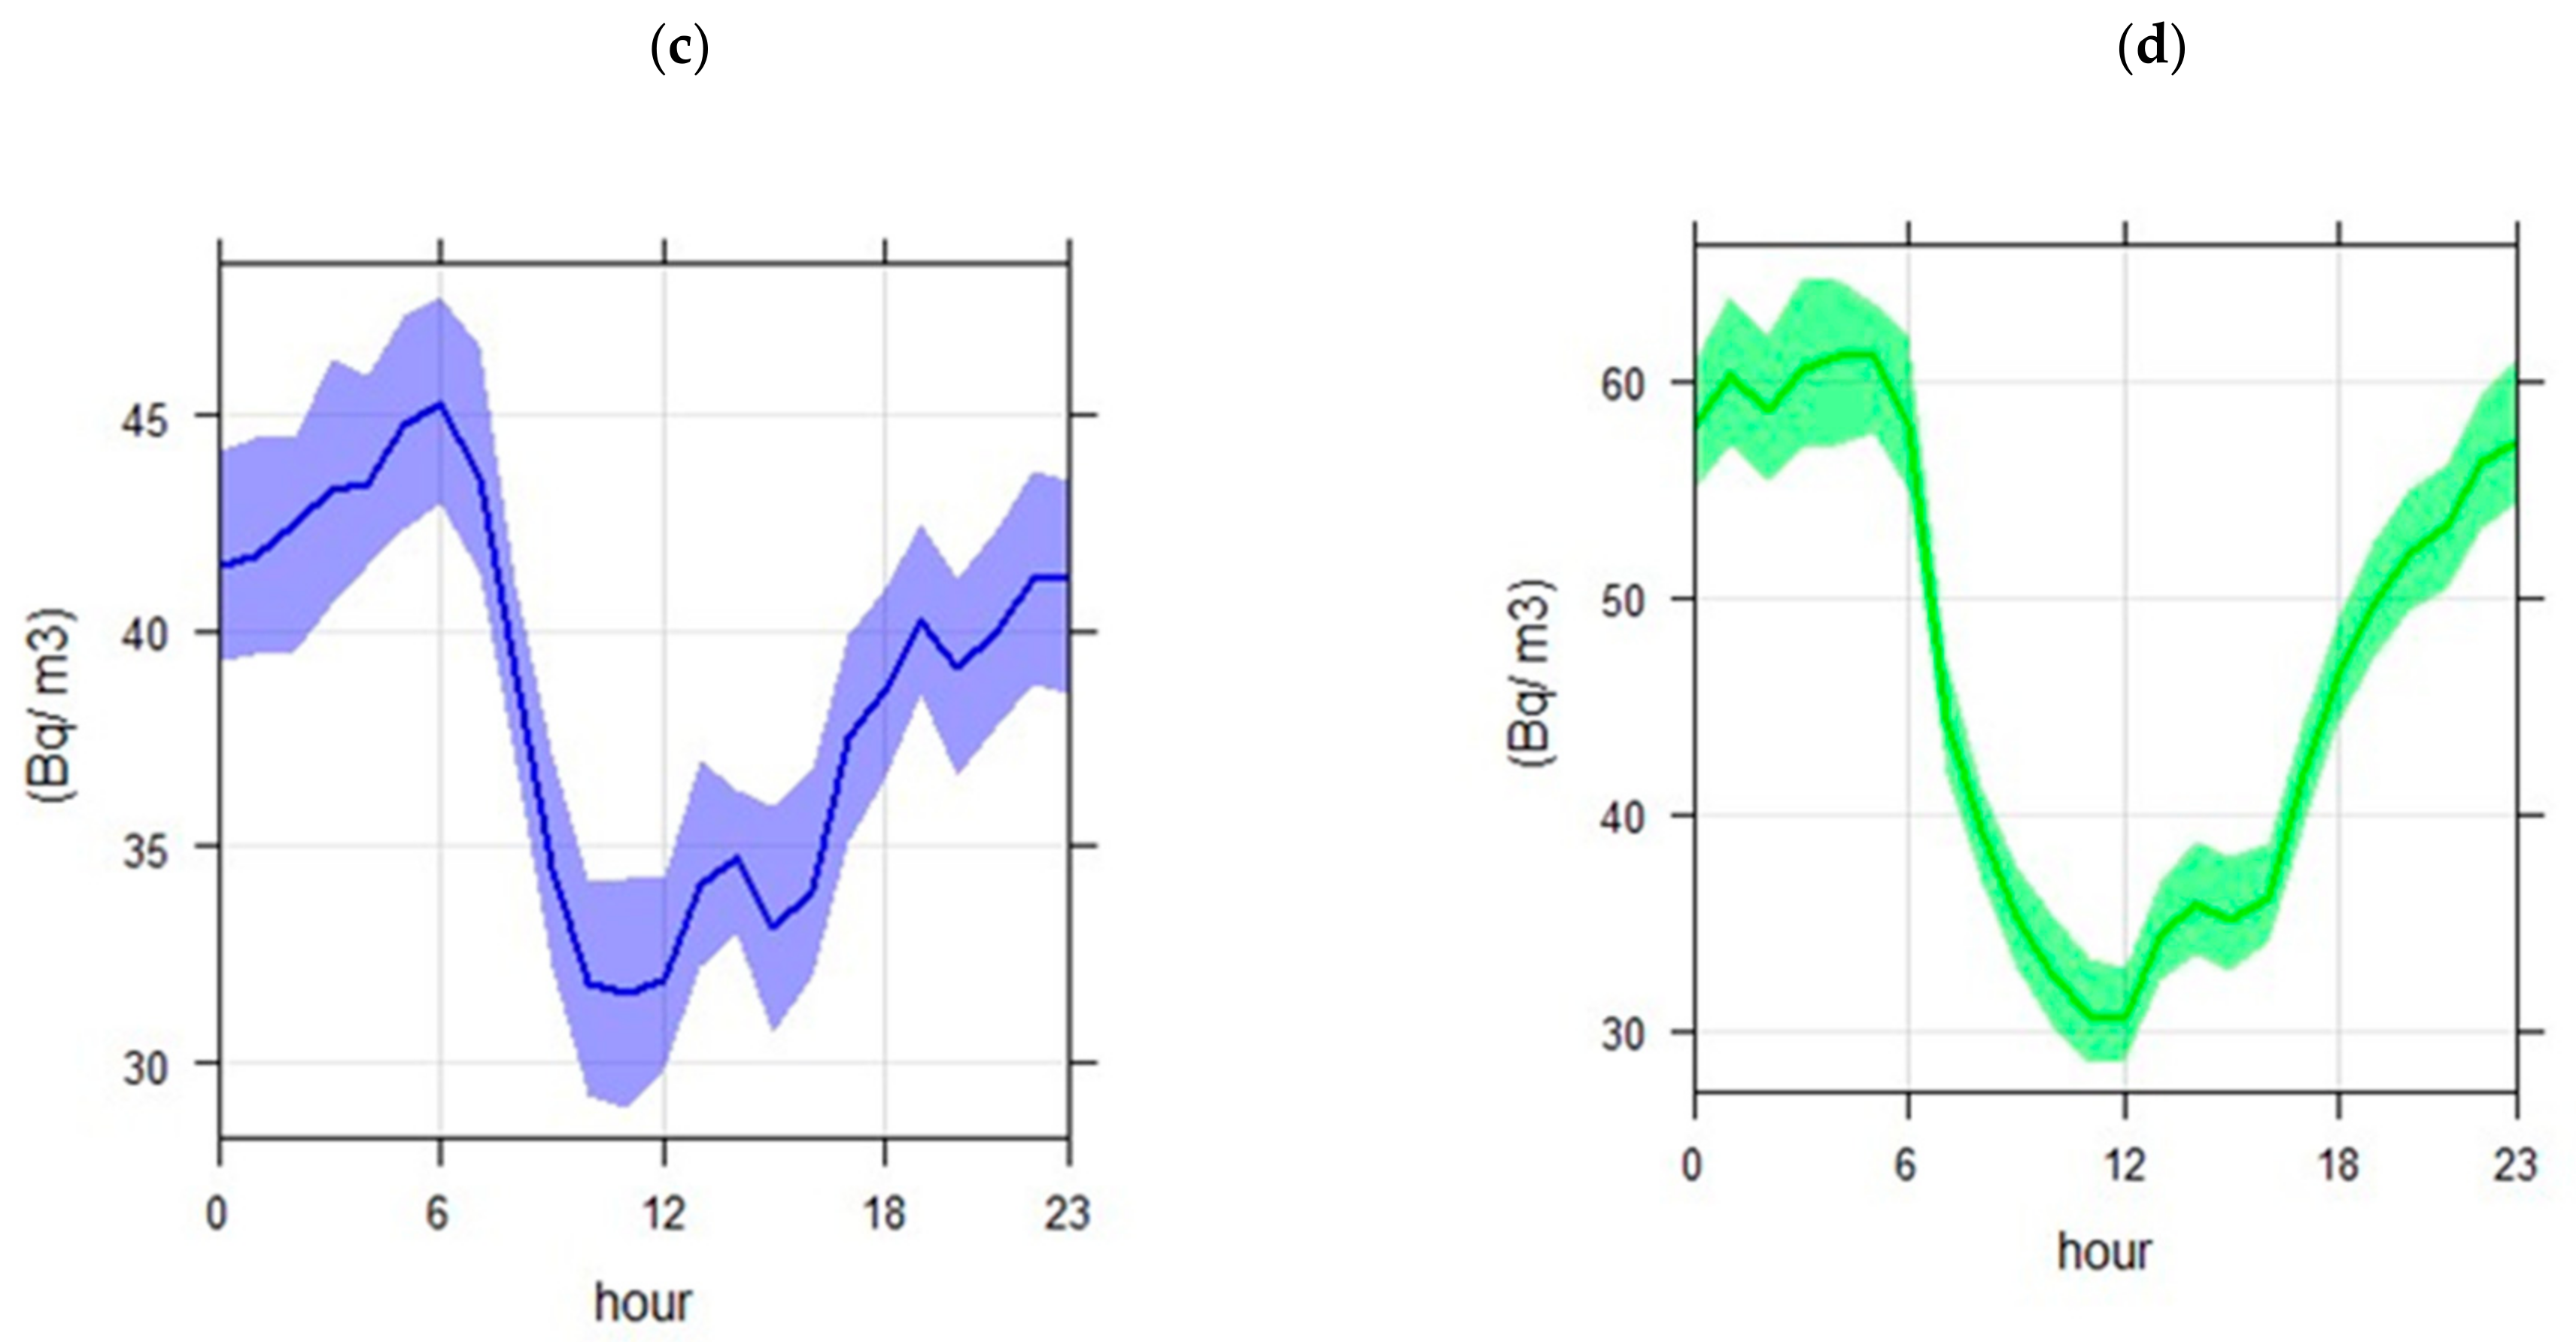
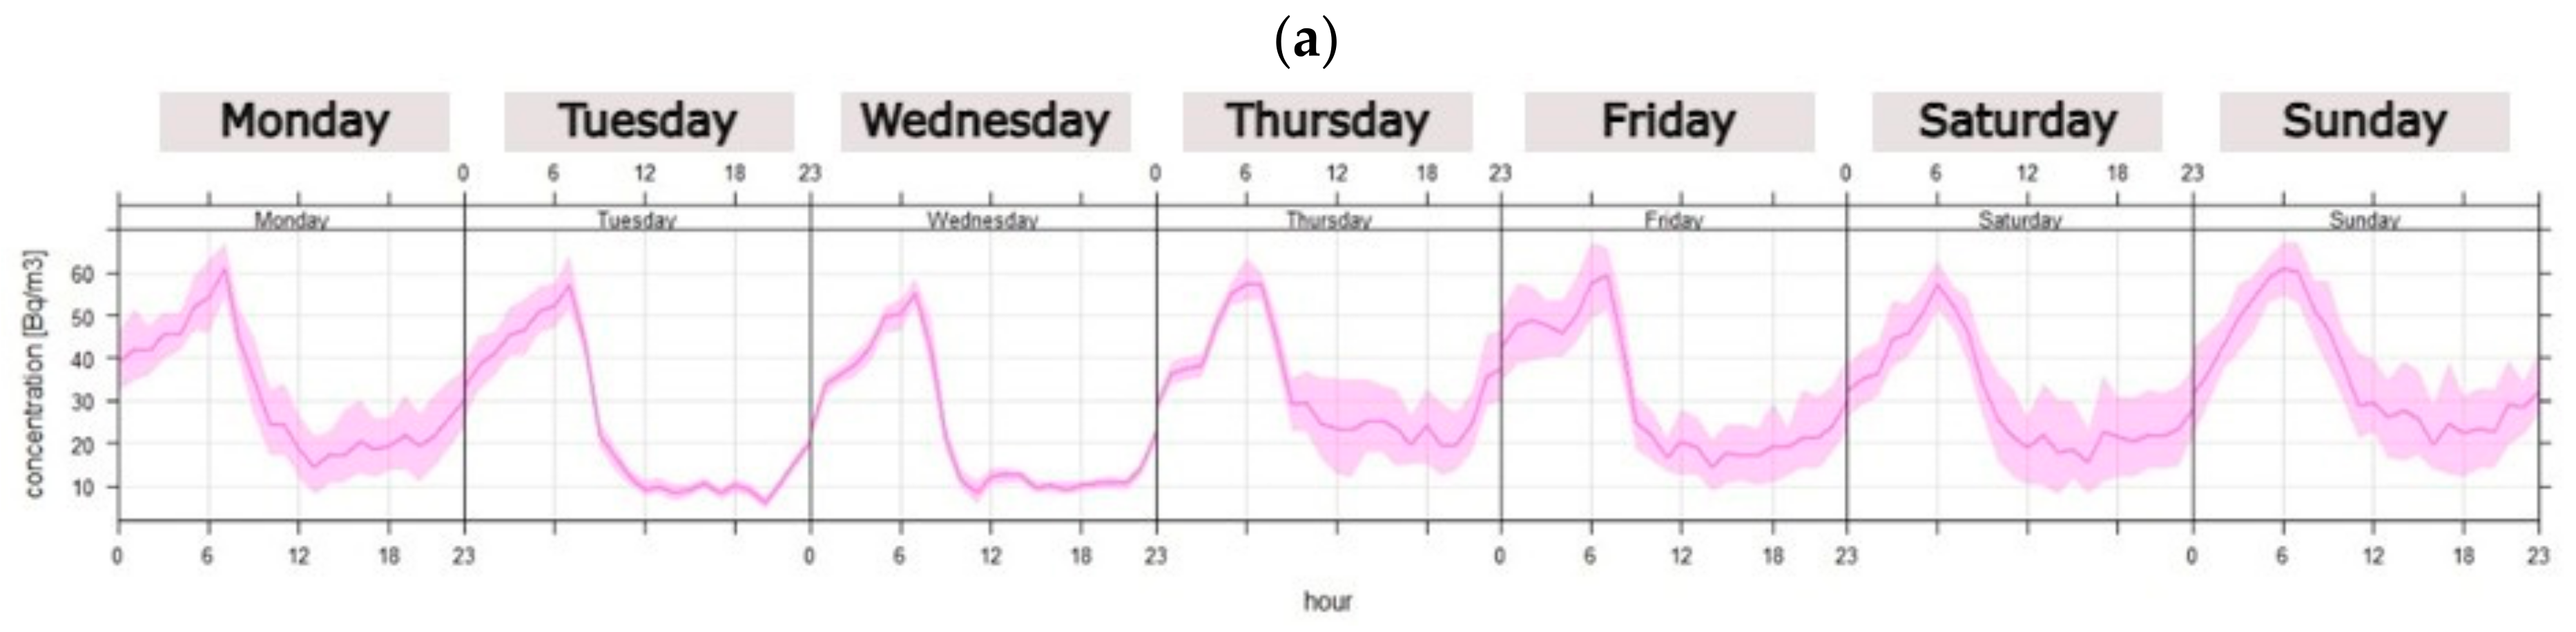
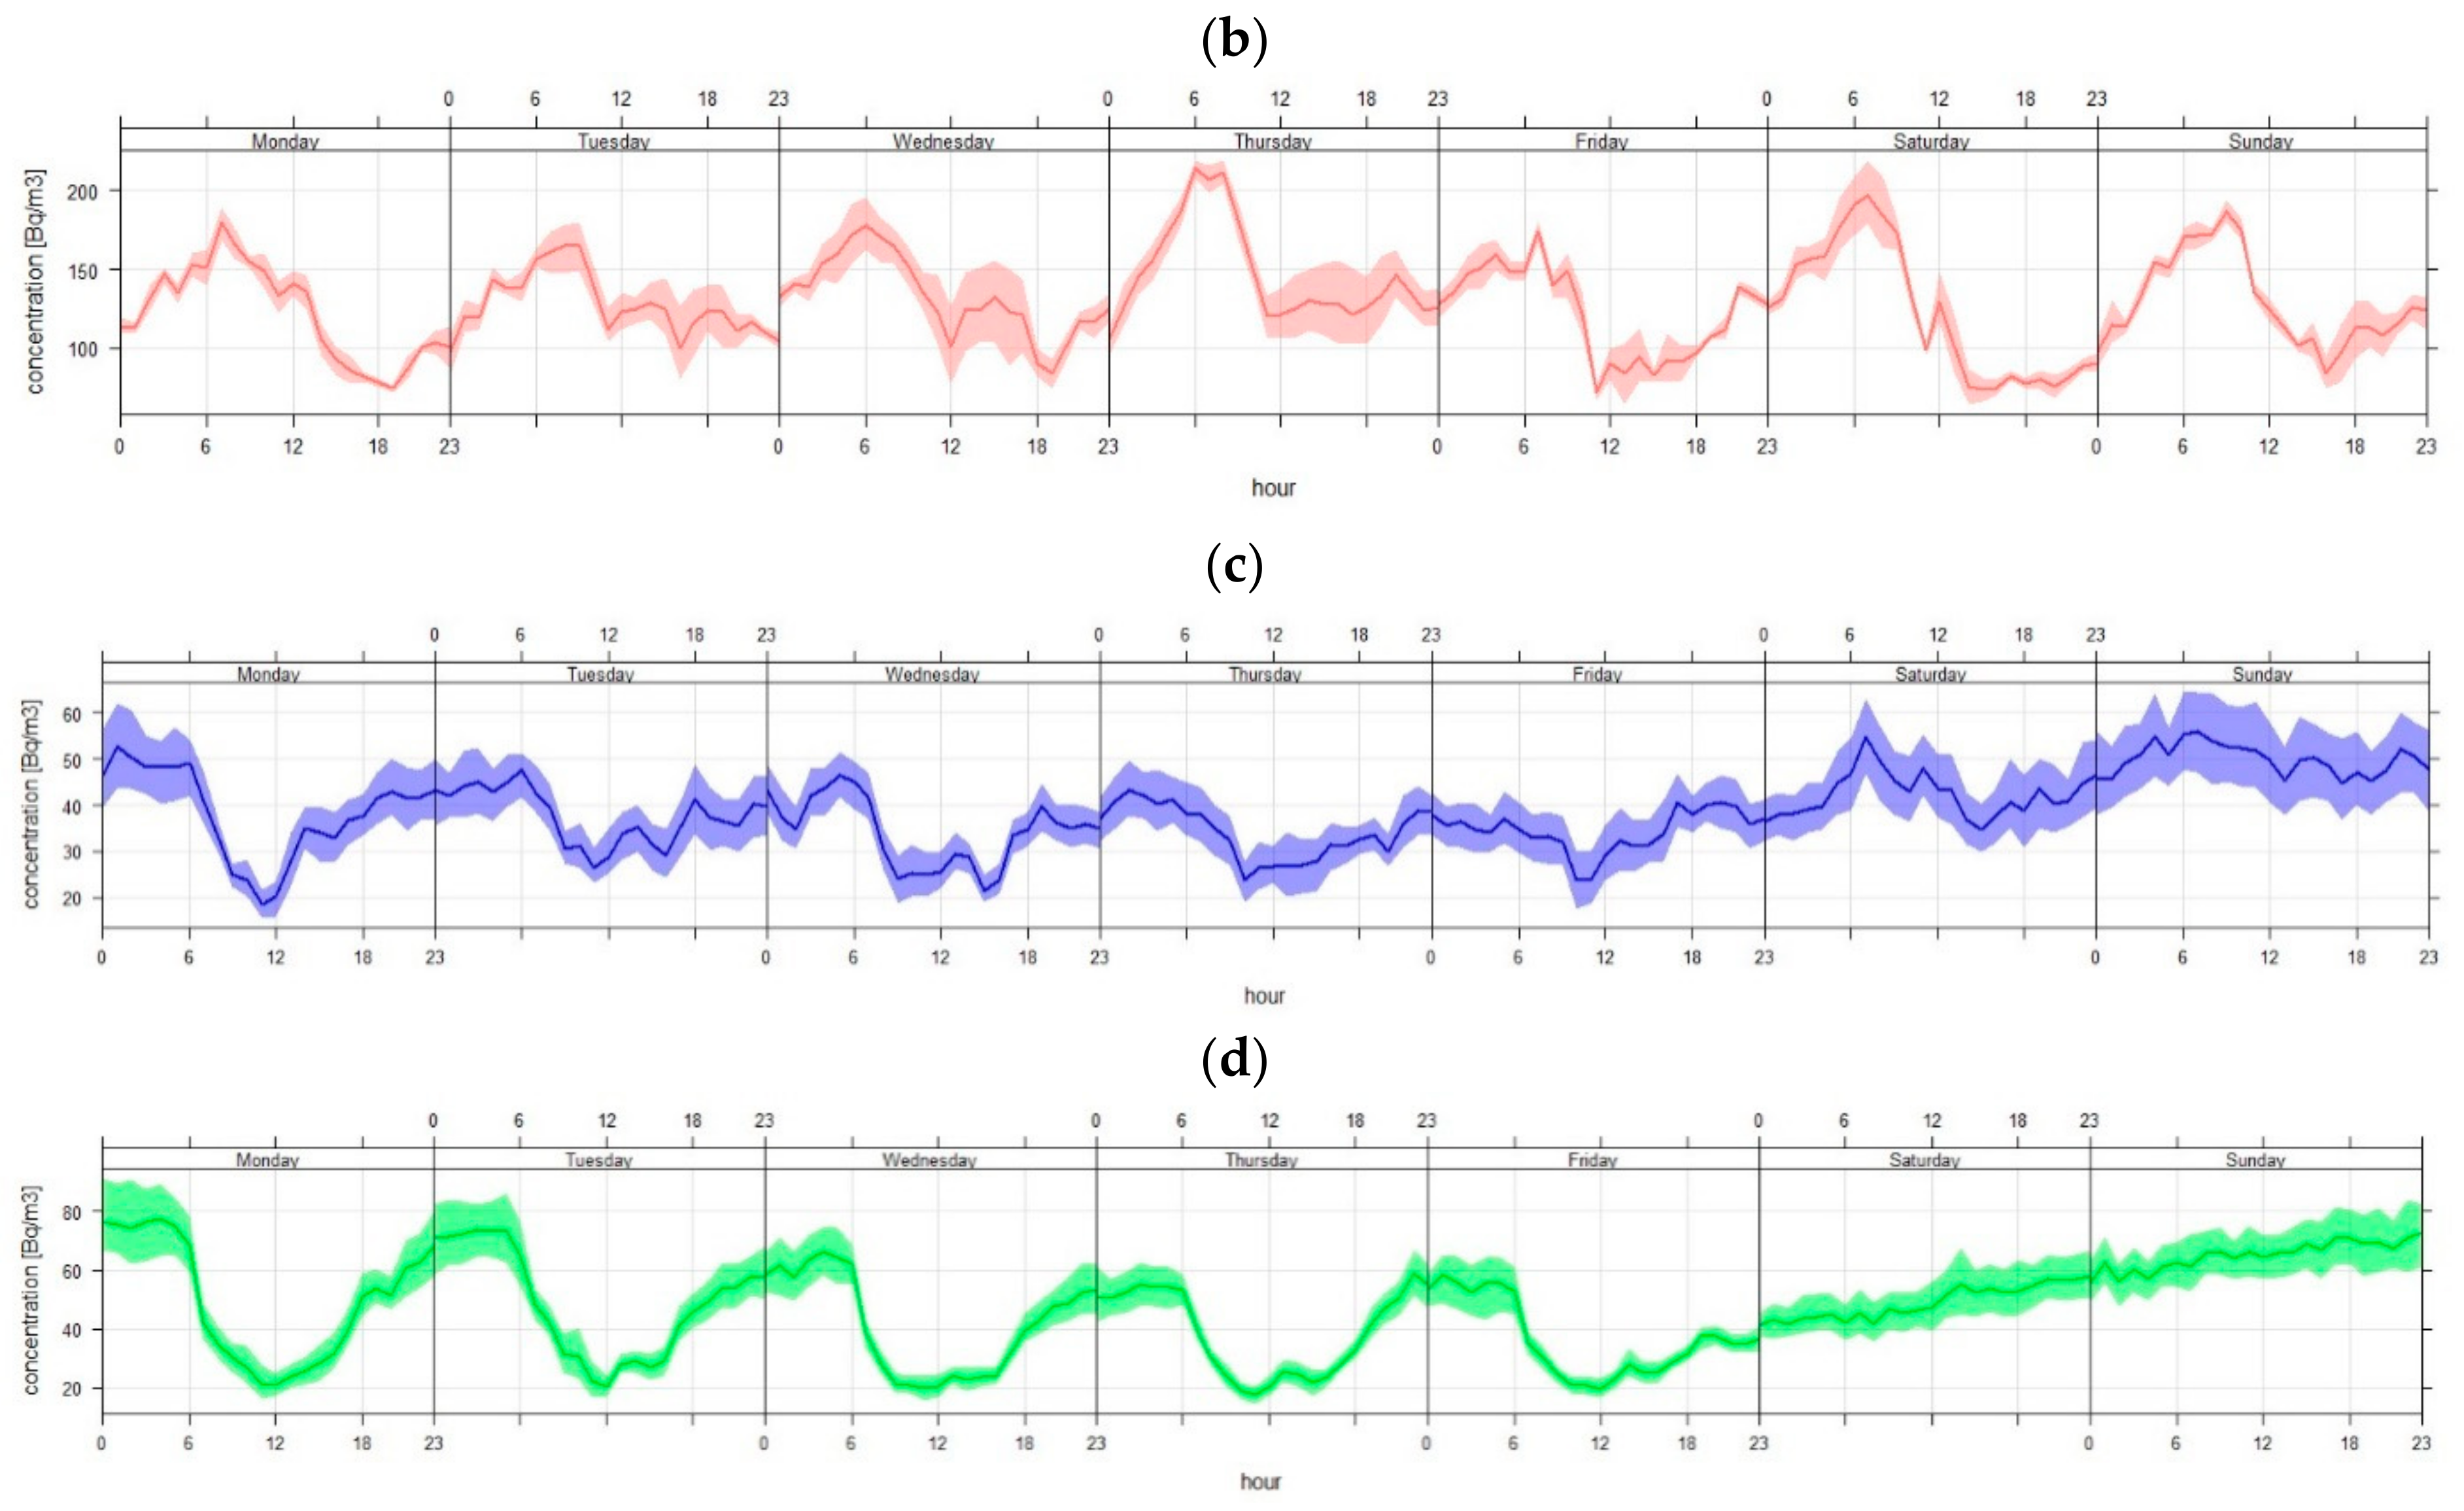
3.3. Variation in Time of the Radon Concentration Profile

To illustrate the variability of the radon concentration profile over time, the radon concentration was determined for each hour of the day by assigning the arithmetic mean value for the measurements at the same hours of the day (Figure 3).
For the measurement points, the diurnal variation profiles are similar in shape. The flattest course of variation was characteristic of room C1 in building C. The maximum radon concentration fell shortly before the users started to be active in a given room, which was in the morning. The lowest average concentrations were recorded in the afternoon. During the night, the radon concentration increased, compared to the minimum, by about 60% for building C (C1, C2), by 90% for building B (B1) and by 240% for building A. In rooms A and C2, a sudden drop in the recorded average radon concentrations was observed in the early morning hours, which is related to people’s morning activity. Table 7 shows the hours of the maximum and minimum radon concentrations in the analyzed rooms. The concentration maxima were related to user activity.
The variability of radon during the week at individual measurement points was presented in the figure below (Figure 4).
On the basis of the chart, two types of volatility have been distinguished. Two of the four rooms analyzed had a similar distribution to the concentrations during the week (A, B1); the other two rooms showed higher average concentrations during the weekend (C1, C2). Additionally, radon accumulation was noticeable on Saturday and Sunday. Rooms C1 and C2 were not used on weekends; room A had mechanical ventilation and room B was used throughout the week.

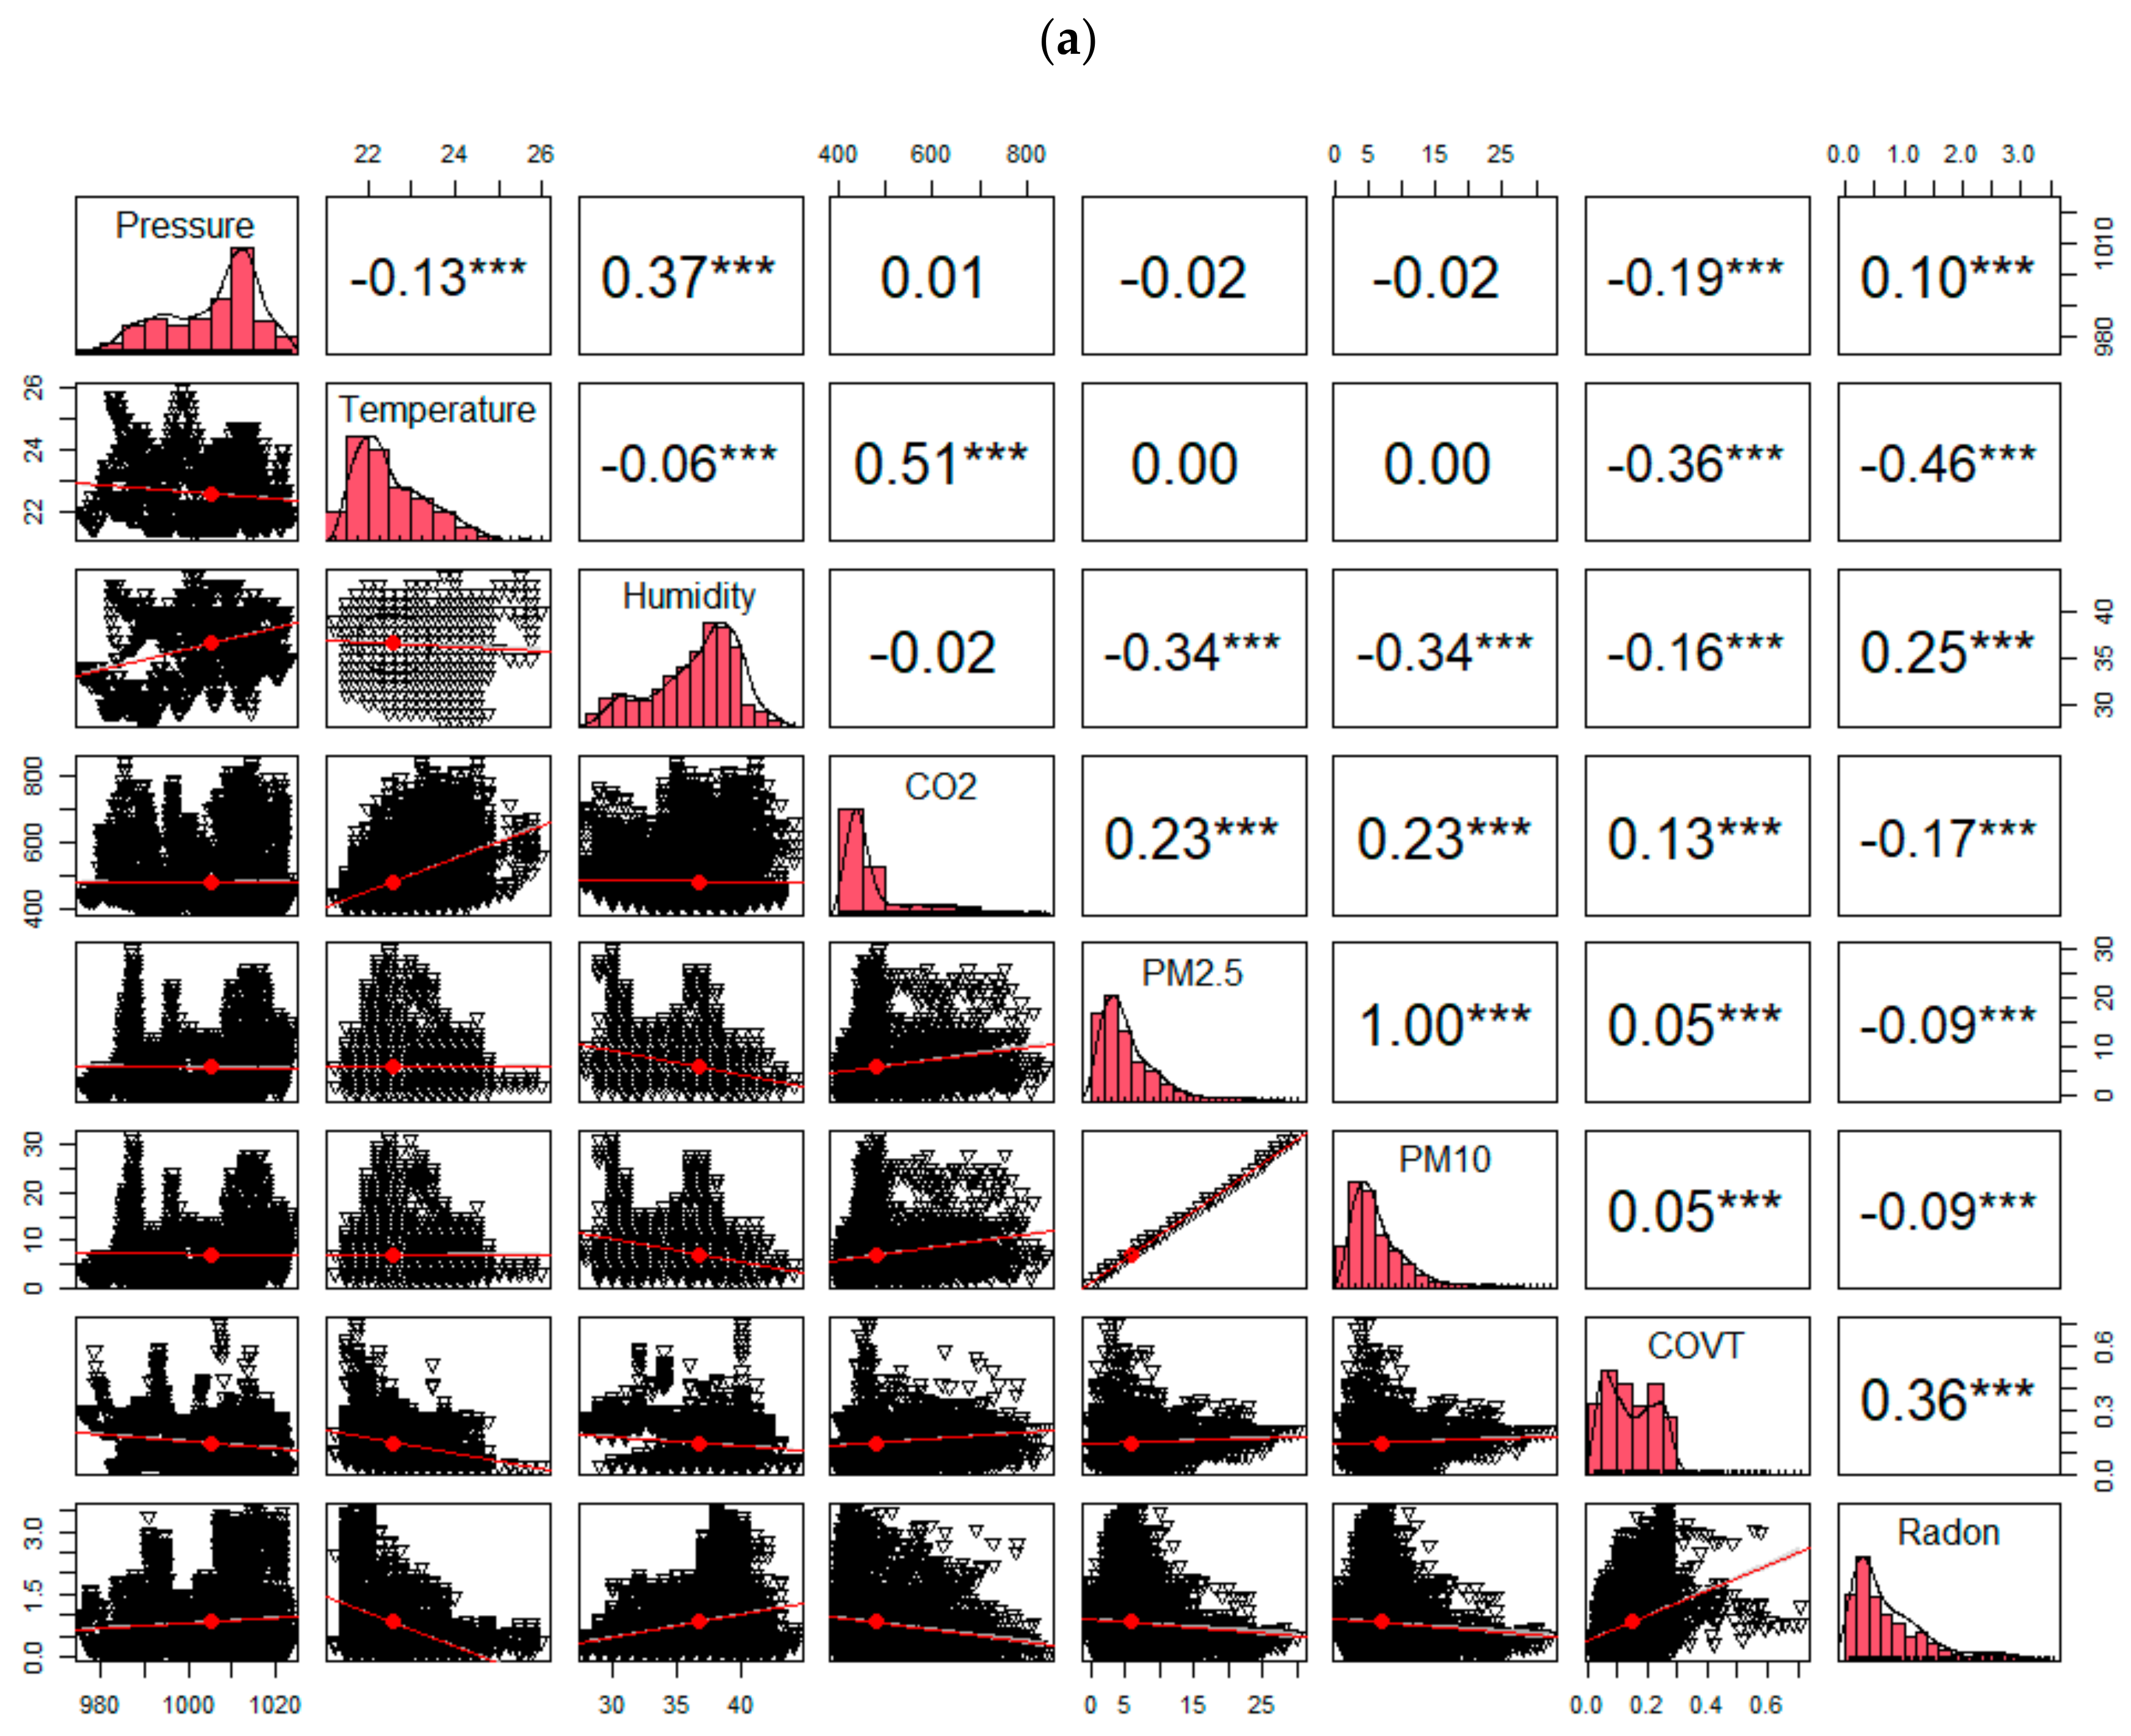
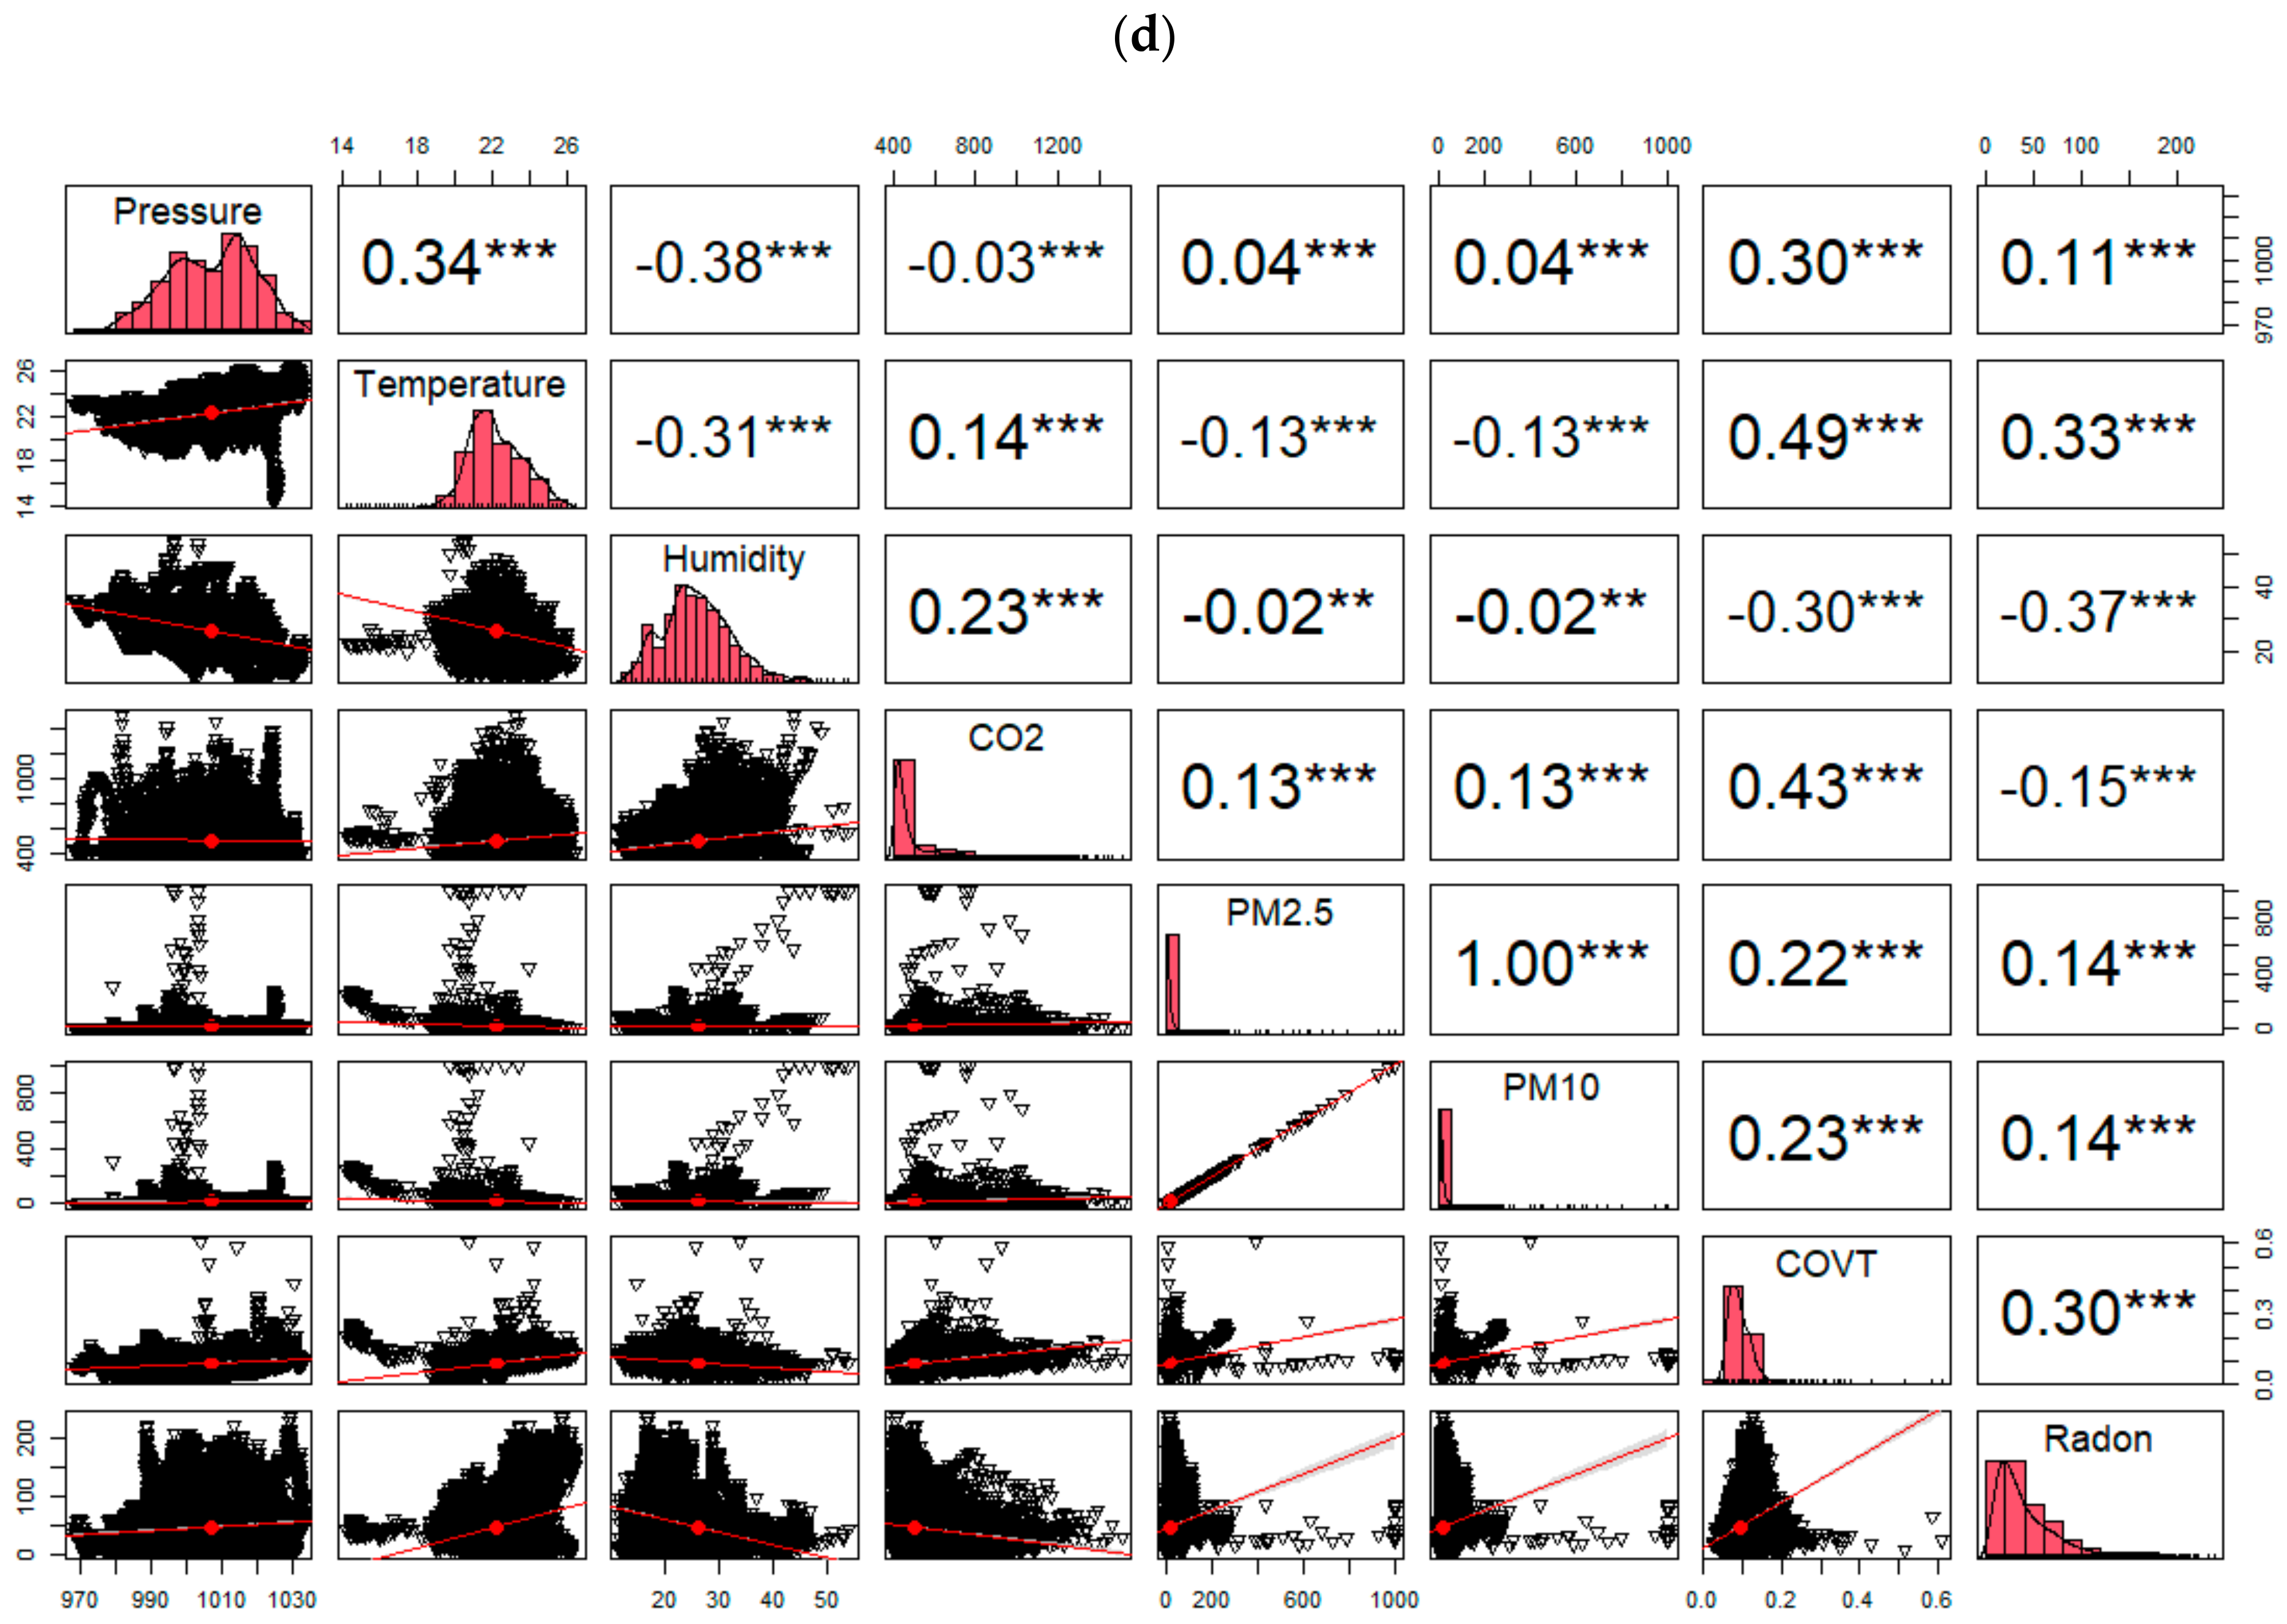
3.4. Correlations of Radon Concentration with Other Measured Parameters

In the rooms, apart from the concentration of radioactive radon, the IAQ was influenced by physical and chemical parameters, including air temperature, humidity, atmospheric pressure, radon concentration, TVOC concentration, carbon dioxide concentration and the weight quantity of dusts with PM2.5 and PM10 fractions. With the help of the R environment, correlation diagrams of individual variables were made, which included, in turn, pressure, temperature, humidity, CO2, PM2.5, PM10, and radon. The analysis of the correlation of the radon concentration was carried out for rooms: A1, B1, C1 and C2.
The correlation analysis did not show a statistically significant relationship between indoor air pressure and radon concentration. The influence of temperature in building C on radon concentration was shown by positive correlation coefficients at the level of, respectively, 0.19, p < 0.001 for room C1 and 0.33, p < 0.001 for room C2. In the case of buildings A and B, a negative correlation was observed at the level of, respectively, −0.46, p < 0.001 and −0.18, p < 0.001. The correlation analysis for relative humidity showed a similar relationship because, for rooms in building C, negative correlation values were successively obtained for rooms C1 and C2, at the level of −0.39, p < 0.001 and −0.37, p < 0.001. For buildings A and B, a positive correlation was observed at the level of, respectively, 0.25, p < 0.001 and 0.26, p < 0.001. With the correlation with the CO2 concentration, a negative correlation was observed at the level of −0.17, p < 0.001 to −0.09, p < 0.001 in all the buildings. For dust, a statistically significant positive correlation was only observed for room C1, which was at the level of approximately 0.32, p < 0.001. For room C2, this value was within the limits of 0.14, p < 0.001. For building B, a negative correlation was observed between the radon and dust at the level of −0.18, p < 0.001. For building A, the correlation for dust was close to zero. Spearman’s correlation values for dusts in rooms C1 and C2 were at the level of 0.50. For all the measurement sites where TVOC was measured, a positive correlation was observed at the level of approximately 0.31, p < 0.001. Figure 5 shows the correlations for the measured points analyzed and the IAQ parameters. The strength of the correlation was showed in accordance with the markings presented in Table 6.

3.5. Variation in Time of the Radon Concentration Profile

3.5.1. Rooms B1 and B2

Furthermore, for building B, the measurements carried out in rooms B1 and B2, (while room B2 is a corridor leading to room B1) showed that the coefficient was determined according to Formula 3 (Table 8).
Based on this, it was shown that the correlation for dusts is positive and moderate, but significant, while for radon, the correlation value was lower than the correlation for dusts, but also shows a positive tendency. The negligible correlation value for VOCs shows the local sources of these pollutants.

3.5.2. Building B Outdoor Environment

Correlations were calculated for the average measurements of external and internal dust for a given day at the location of building B. For the correlation analysis, measurement data from the local SYNGEOS measurement station were used [18]. Table 9 contains the calculated correlation values.
A moderate positive correlation was observed for the average daily values of dust concentration inside and outside the building.

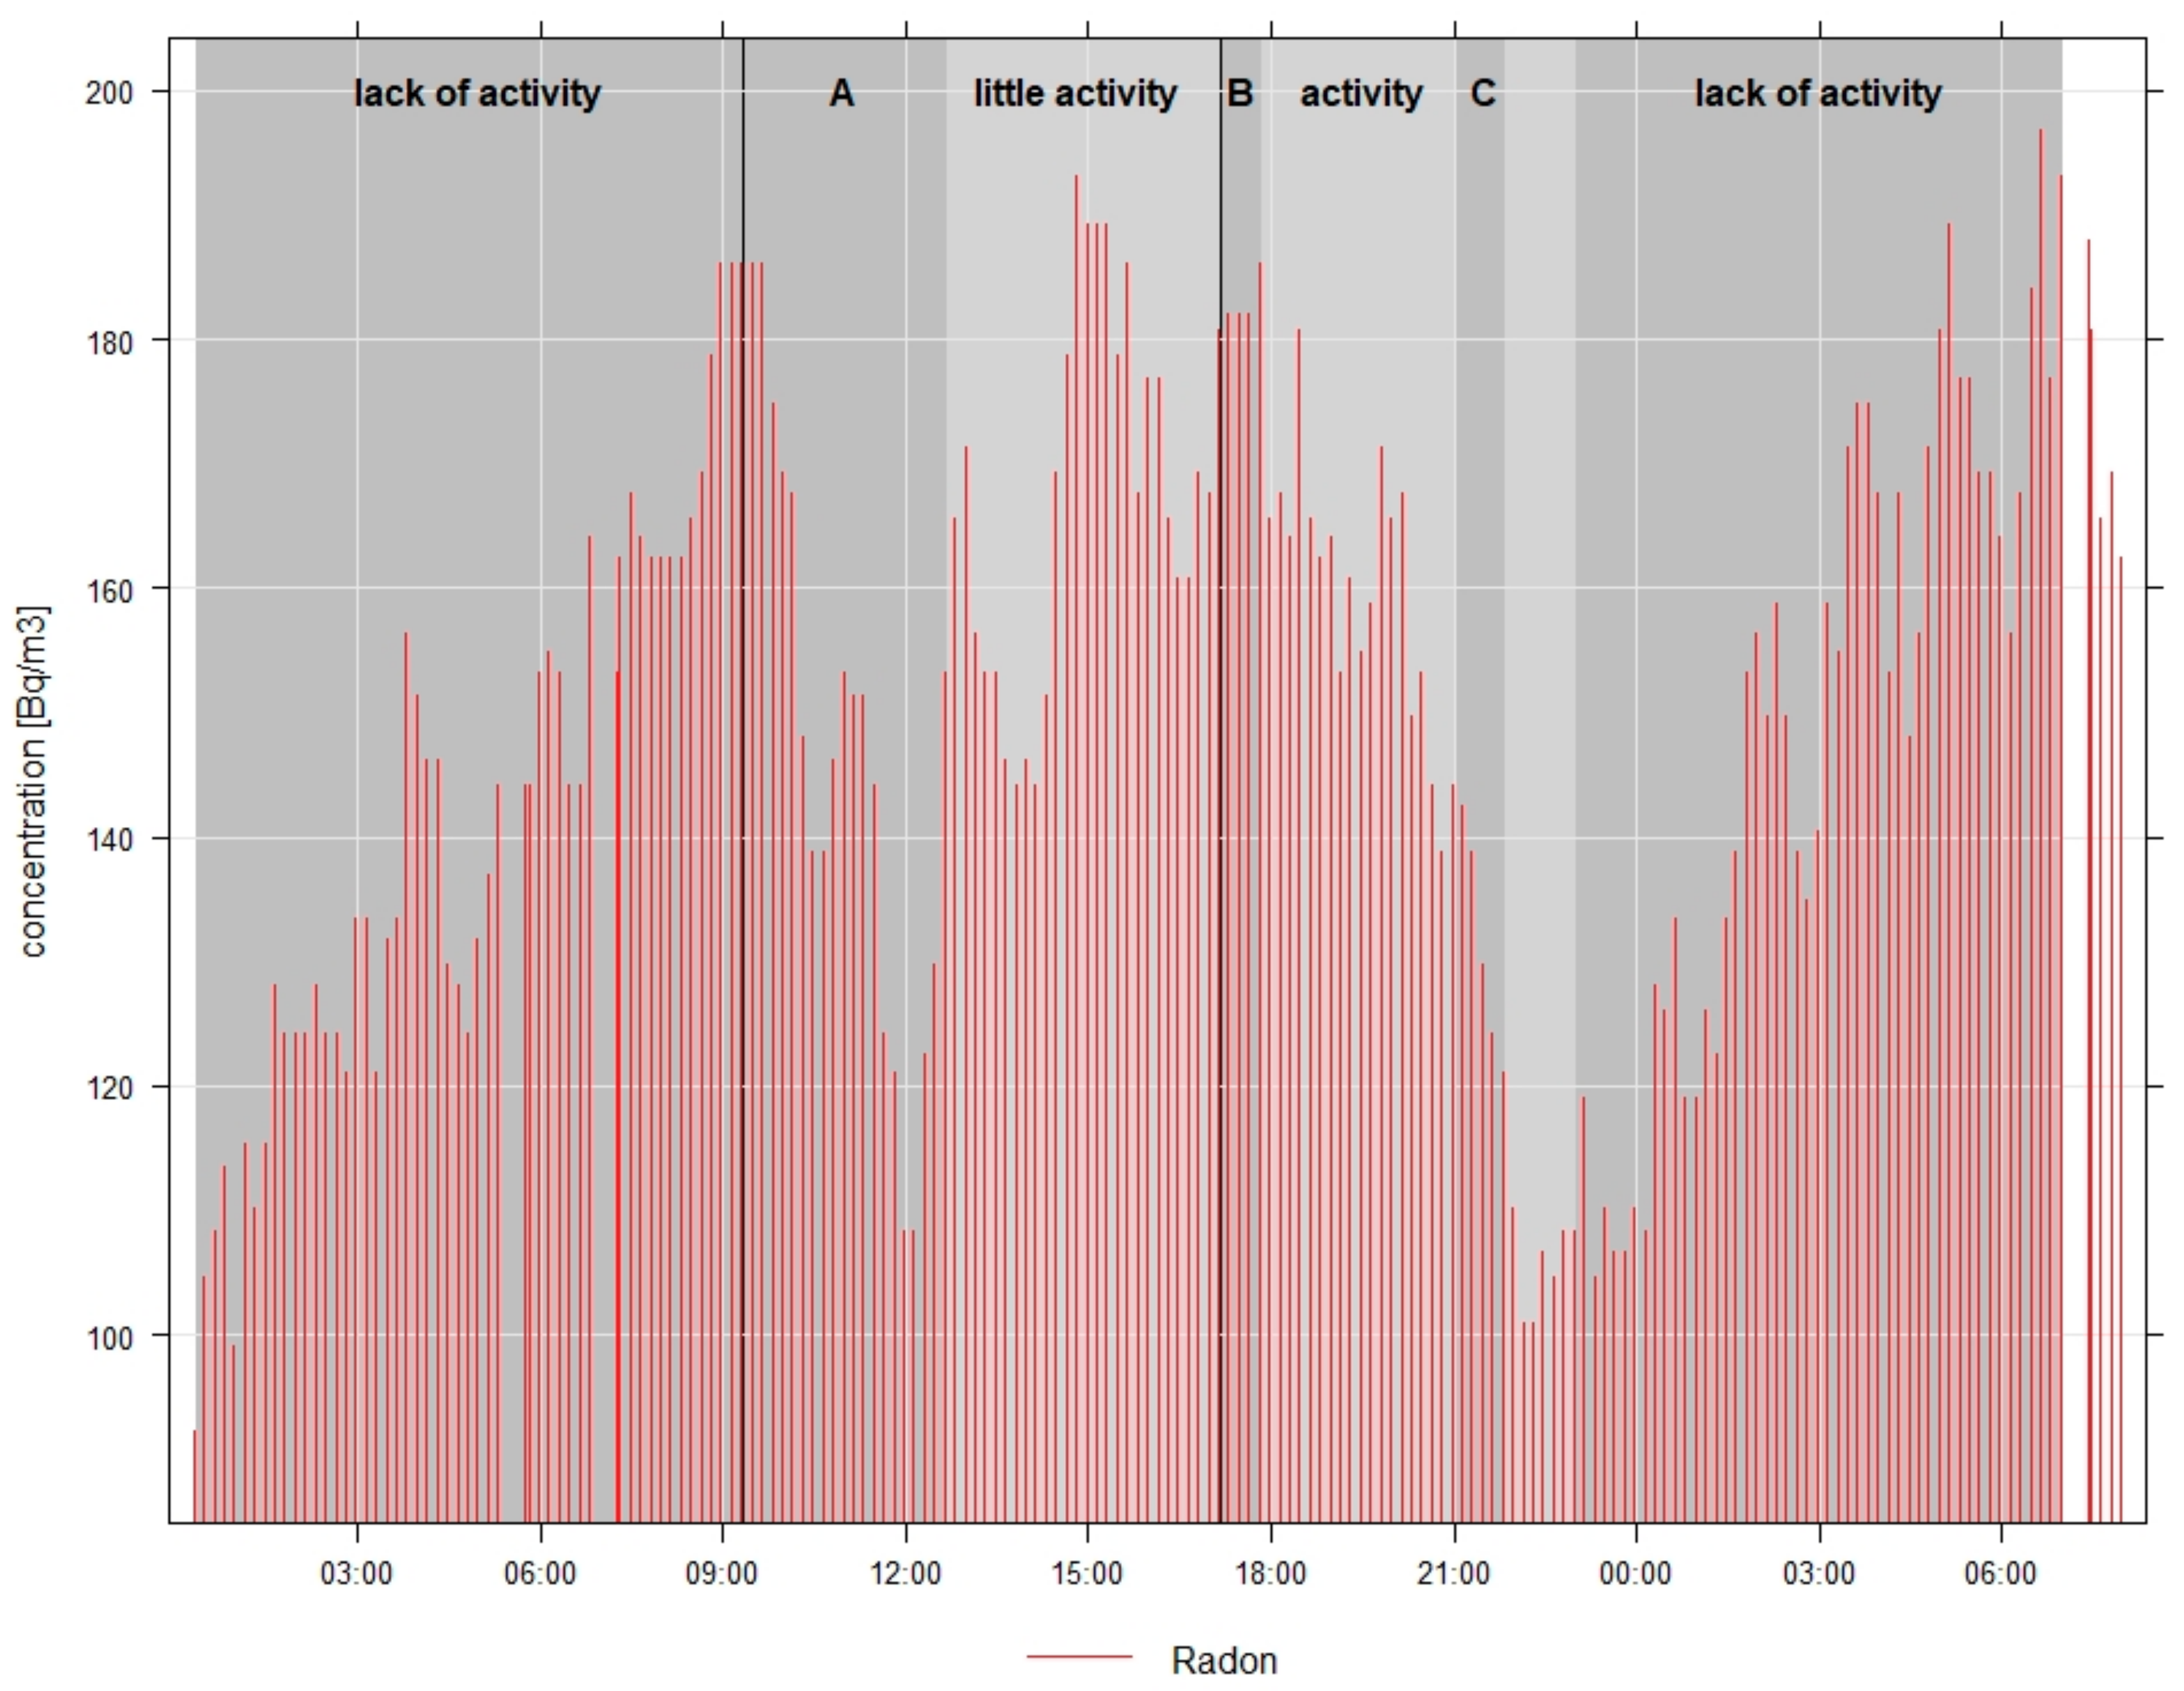
3.6. Influence of Users on the Concentration of Radon in the Room

To assess the impact on changes in radon concentration in the room, we used the measurements taken in building B. The diagram in the behaviors in the following (Figure 6) shows the plot with the radon concentration presented for one selected measurement day. On the graph for point A, the room user started to stay in the room. At point B, the air was changed by opening the window. At point C, there was a draft in the room.
During the inactivity of users, the radon concentration culminates much more often. When airing the room, especially with the door and window open, the radon was removed from the room, then a drop of over 60% was observed. The open door aided the lack of a peak in radon concentration. The decrease in radon concentration occurred just after the user started to be active.

4. Discussion

Based on the obtained measurements, there can be observed a variety of IAQ parameters depending on the location of the building. The highest concentration of radon was recorded in room B1, with the average level being 130 ± 32 Bqm−3, and the value exceeded the WHO-set threshold. The limit threshold for radon concentration should be reduced to 50 Bqm−3 to minimize lung cancer [12]. In building B (B1, B2), the highest concentration of carbon dioxide and volatile organic compounds was recorded. The lowest value of the average radon activity was recorded in building A, at the level of 31 ± 8 Bqm−3. The building showing the lowest radon concentration had the highest level of relative humidity and was the only building that had supply and exhaust ventilation. The radon concentration in room C2 was at the average level of 50 Bqm−3, in December, the average values for the rooms in building C were established at the level of 59 ± 15 Bqm−3 and 67 ± 17 Bqm−3, respectively, in room C2 and C1. Both December averages exceeded the threshold suggested by the researchers, namely 50 Bqm−3 [12]. In the south of Poland, an average concentration of 220 ± 33 Bqm−3 [22] was recorded. When comparing the research conducted in Poznań County with the research from the south of Poland [22,23], the mean arithmetic concentration of radon was at a lower level. In previous publications [24], the authors showed that houses with better technical solutions, particularly well-functioning mechanical ventilation, had lower levels of radon concentration. This rule was confirmed in the tests carried out because the building with the lowest average radon concentration was the newest and the only one with mechanical ventilation.
Radon concentration profiles in the individual rooms analyzed in this study showed significant similarities. The infiltration of radon depends on the parameters of buildings. Therefore, a correlation with humidity and temperature can be expected. In the studies conducted by Xie et al., a negative correlation was observed between the radon concentration and humidity [25]. In our measurements, no negative correlation was observed in any of the rooms. A positive correlation was observed in rooms A and B1. For rooms C1 and C2, a negative correlation was obtained at a statistically significant level rxy = −0.37, p < 0.001. The literature shows that there is no correlation with radon concentration in the case of temperature measurements [25]. However, in the conducted research, the correlation for temperature was obtained at a statistically significant level although, depending on the room, it differs in value and sign. The highest correlation value for temperature was obtained for building A at a statistically significant level rxy = 0.46, p < 0.001. Previous publications did not show a trend between internal pressure and radon concentration; this property was also considered in our research [25]. When the radon concentration was correlated with the carbon dioxide concentration, a negative correlation was observed in all of the rooms where measurements were made, at the level of −0.17 to −0.11, p < 0.001. An earlier study observed a negative correlation for the concentrations of radon and carbon dioxide [26]. The concentration of carbon dioxide is related to the presence of people in the room; therefore, the correlation of radon and carbon dioxide is expected. The correlation for dusts is also site-dependent. For dusts, a statistically significant positive correlation was observed in room C1, at the level rxy =0.32, p < 0.001. For building A, the correlation for dust was close to zero.
The user profile, especially the opening of windows and doors, contributes to reducing the concentration of radon in a room. Other scientists have observed that the phenomenon of the influence of people arriving at the building on air pollution in a given room is observed by other scientists [27]. With the formation of a draft, radon was most effectively removed from the room. During cleaning works, which caused dust to rise, a trend towards a decrease in radon concentration was noticed. The impact of opening windows and the inactivity of users on the shaping of radon concentration was noticed in previous publications [22,28,29]. The calculated correlation values for the measurements in building B, which took place in the corridor and the room, indicate a positive correlation between the radon measurements in the adjacent rooms. The positive correlation for dusts is much higher than for the radioactive isotope.
IAQ measurements were made over short periods during the COVID-19 pandemic. Further air quality research is planned, with a particular emphasis on user roles and construction types. The effective doses are expected to be calculated from the source of natural radiation, which is radon.

5. Conclusions

The correlations obtained were not unequivocal during the analyses performed and were not always in agreement with the results obtained earlier by other authors. This fact indicates that many factors affect the level of radon concentration in the rooms. The radon concentration profile was different depended on the function of the room. The building with the worst air quality, in terms of carbon dioxide concentration and TVOC, and the highest average humidity and the highest average radon concentration was also noted. For all measurement sites where TVOC was calculated, a positive correlation was observed at the level of approximately 0.31, p < 0.001. The correlation for carbon dioxide concentration was at the level of −0.15, p < 0.001. The outside air affected the indoor air quality in the building.

Author Contributions

Conceptualization, J.A.K. and M.B.; Data curation, J.A.K.; Formal analysis, M.B. and J.A.K. Funding acquisition, M.B.; Investigation, J.A.K. and M.B.; Methodology, J.A.K. and M.B.; Project administration, M.B.; Resources, M.B., Supervision, M.B.; Visualization, J.A.K.; Writing—original draft, J.A.K. and M.B.; Writing—review & editing, J.A.K. and M.B. All authors have read and agreed to the published version of the manuscript.

Funding

This research was funded by the Poznan University of Technology, grant number 3016/SIGR/3335 and 0713/SBAD/0958.

Institutional Review Board Statement

Not applicable.

Informed Consent Statement

Not applicable.

Acknowledgments

The authors would like to acknowledge the Directorate and Staff of the nurseries for the opportunity to conduct the research.

Conflicts of Interest

The authors declare no conflict of interest.

References

  1. Curado, A.; Lopes, I.S. On the relation of geology, natural ventilation and indoor radon concentration: The northern Portugal case study. Antão Comun. Geológicas 2020, 107, 31–41. [Google Scholar] [CrossRef]
  2. Kubiak, A.K.; Zimnoch, M. Assessment of the nocturnal boundary layer height based on long-term atmospheric radon measurements. Front. Earth Sci. 2022, 10, 955791. [Google Scholar] [CrossRef]
  3. World Health Organization. WHO Housing and Health Guidelines; World Health Organization: Geneva, Switzerland, 2018. [Google Scholar]
  4. Kang, J.K.; Seo, S.; Jin, Y.W. Health effects of radon exposure. Yonsei Med. J. 2019, 60, 597–603. [Google Scholar] [CrossRef] [PubMed]
  5. Mamont-Cieśla, K. Radon—Promieniotwórczy Gaz w Środowisku Człowieka, Centralne Laboratorium Ochrony Radiologicznej. Available online: https://www.clor.waw.pl/images/pliki/Pomiar_Radonu/Radon-1a_Kalina_radon.pdf (accessed on 22 March 2022).
  6. Arvela, H. Seasonal variation in radon concentration of 3000 dwelling with model comparison. Radiat. Prot. Dosim. 1995, 59, 33–42. [Google Scholar]
  7. Rubin, A.J. Radon exhalation from buildings material. In Proceedings of the XVII Szkoła Jesienna PTBR—Radon-występowanie i konsekwencje—Zakopane’97, Siedlce, Poland, 22–26 September 1997. [Google Scholar]
  8. Gorączko, W. Podstawy ochrony radiologicznej. In Radiochemia i Ochrona Radiologiczna; Wydaw; Politechniki Poznańskiej: Poznań, Poland, 2003; Volume 3, pp. 65–130. [Google Scholar]
  9. Abbott, A. Researchers pin down risks of low-dose radiation. Nature 2015, 523, 17–18. [Google Scholar] [CrossRef]
  10. Yasser, F.A.; Cucinotta, F.A.; Ning-Ang, L.; Zhou, G. Cancer Risk of Low Dose Ionizing Radiation. Front. Phys. 2020, 100, 13761–13766. [Google Scholar] [CrossRef]
  11. World Health Organization. WHO Handbook on Indoor Radon a Public Health Perspective; World Health Organization: Geneva, Switzerland, 2009. [Google Scholar]
  12. Branion-Calles, M.C.; Nelson, T.A.; Henderson, S.B. Evaluation of different radon guideline values based on characterization of ecological risk and visualization of lung cancer mortality trends in British Columbia, Canada. BMC Public Health 2015, 15, 1144. [Google Scholar] [CrossRef] [PubMed]
  13. Korzeniowska-Rejmer, E. Radon w Gruncie i Techniki Redukcji Jego Stężenia w Obiektach Budowlanych; Wydawnictwo Politechniki Krakowskiej: Kraków, Poland, 2008. [Google Scholar]
  14. Istrate, M.-A.; Catalina, T.; Cucosb, A.; Dicu, T. Experimental measurements of VOC and Radon in two Romanian classrooms. Energy Procedia 2016, 85, 288–294. [Google Scholar] [CrossRef] [Green Version]
  15. Maroni, M. Health Effects of Indoor Air Pollutants and their Mitigation and Control. Radiat. Prot. Dosim. 1998, 78, 27–32. [Google Scholar] [CrossRef]
  16. Geological Maps. Available online: https://geolog.pgi.gov.pl/#name=3tjqgffirm (accessed on 5 October 2022).
  17. Manufacturer of Meters. Available online: https://www.instrumentchoice.com.au/mini-xt-radon (accessed on 3 April 2022).
  18. Data Page. Available online: https://syngeos.pl/ (accessed on 3 April 2022).
  19. Dolny, E.; Sienkiewicz, K. Podstawy Statystyki; Toruńska Szkoła Zarządzania: Toruń, Polska, 2000; Volume 4, pp. 113–164. [Google Scholar]
  20. R Core Team. R, A Language and Environment for Statistical Computing; R Foundation for Statistical Computing: Vienna, Austria, 2018; Available online: https://www.R-project.org/ (accessed on 22 March 2022).
  21. Basińska, M.; Michałkiewicz, M.; Ratajczak, K.; Fuc, P.; Siedlecki, M. The Way of Usage and Location in a Big City Agglomeration as Impact Factors of the Nurseries. Energies 2021, 14, 7534. [Google Scholar] [CrossRef]
  22. Kozak, K.; Mazur, J.; Kochowska, E.; Grządziel, D.; Hovhannisyan, H.; Haber, R.; Zdziarski, T. Pomiary Radonu w Budynkach na Terenie Kotliny Jeleniogórskiej w Ramach Projektu UE pt. “Radon-Jak z Nim Żyć?”; Raport Nr 2017/AP; Instytut Fizyki Jądrowej: Kraków, Poland, 2008. [Google Scholar]
  23. Pachocki, K.A.; Gorzkowski, B.; Różycki, Z.; Wilejczyk, E.; Smoter, J. Radon w budynkach mieszkalnych Świeradowa zdroju i Czerniawy Zdroju (Radon in residential buildings in Świeradów Zdrój and Czerniawa Zdrój). Rocz. Państwowego Zakładu Hig. 2000, 51, 291–298. [Google Scholar]
  24. Mullerova, M.; Kozak, K.; Kovacs, T.; Csordas, A.; Grzadziel, D.; Holy, K.; Mazur, J.; Moravcsik, A.; Neznal, M.; Neznal, M.; et al. Preliminary results of indoor radon survey in v4 countries. Radiat. Prot. Dosim. 2014, 160, 210–213. [Google Scholar] [CrossRef] [PubMed]
  25. Xie, D.; Liao, M.; Kearfott, K.J. Influence of Environmental Factors on Indoor Radon Concentration Levels in the Basement and Ground Floor of a Building—A Case Study. Radiat. Meas. 2015, 82, 52–58. [Google Scholar] [CrossRef] [Green Version]
  26. Polednik, B.; Kozak, K.; Mazur, J.; Dudzin, M.; Grządziel, D. Radon and its decay products in an air-conditioned auditorium in correlation with indoor air parameters. Indoor Built Environ. 2016, 26, 621–630. [Google Scholar] [CrossRef]
  27. Basińska, M.; Michałkiewicz, M.; Ratajczak, K. Impact of physical and microbiological parameters on proper indoor air quality in nursery. Environ. Int. 2019, 132, 105098. [Google Scholar] [CrossRef]
  28. Podstawczyńska, A. Interrelationship of Indoor Radon Concentration and Meteorological Parameters in Łódź (Central Poland) Case Study—Preliminary Results; University of Lodz: Łódź, Poland, 2015. [Google Scholar]
  29. Podstawczyńska, A. Wyniki rocznego monitoringu stężenia radonu w powietrzu budynku mieszkalnego w Łodzi na tle warunków meteorologicznych. Acta Geogr. Lodz. 2016, 104, 137–146. [Google Scholar]
Figure 1. Box plot of radon concentrations in individual measurement sites.
Atmosphere 13 01664 g001
Figure 2. Box plot for IAQ; (a) Indoor temperature; (b) relative humidity; (c) carbon dioxide; (d) concentration of volatile organic compounds; and (e) dust concentration—fraction: PM2.5 and PM10.
Atmosphere 13 01664 g002aAtmosphere 13 01664 g002b
Figure 3. Daily dependence of radon for various measurement sites: (a) A, (b) B, (c) C1 and (d) C2.
Atmosphere 13 01664 g003aAtmosphere 13 01664 g003b
Figure 4. Differentiation of radon during the week (Monday to Sunday) for rooms (a) A, (b) B1, (c) C1 and (d) C2.
Atmosphere 13 01664 g004aAtmosphere 13 01664 g004b
Figure 5. Correlations of IAQ parameters for air in the rooms: (a) A, (b) B1, (c) C1 and (d) C2.
Atmosphere 13 01664 g005aAtmosphere 13 01664 g005bAtmosphere 13 01664 g005c
Figure 6. User influence on the radon concentration in building B1—day 08 March 2022–9 March 2022.
Atmosphere 13 01664 g006
Table 1. Radon source in a typical single-family house, assuming one air change per hour [5].
SourcePercentage Share
Substrate as a result of diffusion3
Substrate as a result of chimney effect75
Building materials12
Atmospheric air9
Weather0.4
Natural gas0.6
Table 2. The characteristics of individual rooms and the geological condition.
RoomLocationArea [m2]Height [m]Deep MappingQuaternaryAdditional Information
A2st floor26.33.0Upper Jurassicglacial till their weathered material, and glacial sand and gravel;
North Polish glaciations
urbanized area
B1Ground floor12.02.8Lower Jurassicfaults within a 2 km radius, rural area
B2Ground floor8.02.8
C1Ground floor53.63.6Upper Jurassicsands, gravel, river bogs, peat and silt; Holoceneurbanized area
C2Ground floor53.63.6
Table 3. Characteristics of the measuring devices [17].
MeasurementDetection MethodMeasuring RangeResolutionAccuracy
RadonPulsed ionization chamber4–3700 Bqm−32 Bqm−310% of reading value at 370 Bqm−3
40% of reading value lower than 370 Bqm−3
25% for the average of the measurements for the measurements below 370 Bqm−3
Carbon dioxideNon Dispersive Infrared spectrometry0–5000 ppm1 ppm3% of reading value at 50 ppm
DustLaser-based light scattering that allows PM 1/2.5 measurement and PM 4/10 estimation0–1000 ugm−31 ugm−310% of reading value
TVOCMetal oxide semi-conductor0–128 ppm0.01 ppm30% of reading value
TemperatureTemperature detector on circuits CMOS−55–125 °C0.08 °C0.5 °C
HumidityCapacitive moisture meter0–95%0.08%3% of reading value
PressureTemperature detector on circuits CMOS260–1260 hPa0.02 hPa2 hPa
Table 4. Characteristics of the studied classrooms.
BuildingRoomBeginningEnd
AA15 October 20212 December 2021
BB18 March 202225 March 2022
B210 March 202215 March 2022
CC14 December 202110 March 2022
C24 December 202126 March 2022
C1-XII4 December 202131 December 2021
C2-XII4 December 202131 December 2021
Table 5. Interpretation of the Pearson correlation coefficient [19].
Value rxyInterpretation
rxy = 0no lineral correlation
rxy = 1full correlation
rxy < 0negative correlation
rxy > 0positive correlation
rxy < 0.2very weak correlation
0.2 < rxy < 0.4correlation weak, but clear
0.4 < rxy < 0.7significant correlation
0.7 < rxy < 0.9strong correlation
0.9 < rxyvery strong correlation
Table 6. The adopted markings of the p-value [20].
p-ValueExpression Mark
[0, 0.001]***
(0.001, 0,01]**
(0.01, 0.05]*
(0.05, 0.1].
(0.1, 1]lack
Table 7. Hours of maximum and minimum radon concentration.
RoomMaximumMinimum
A7:00–8:0015:00–16:00
B18:0016:00–18:00
C15:00–6:0011:00–12:00
C24:00–5:0011:00–12:00
Table 8. Correlation frequency of 10-min for measurements in the corridor (B1) and the room (B2).
PressureTemperatureHumidityTVOCPM2.5PM10Radon
1
−0.054−0.0790.0250.590.570.34
p < 0.001p < 0.001p < 0.1p < 0.025p < 0.001p < 0.001p < 0.001
Table 9. Correlations for the averages from dust measurements outside and inside the building.
PM2.5PM10
0.600.61
p < 0.1p < 0.1
Publisher’s Note: MDPI stays neutral with regard to jurisdictional claims in published maps and institutional affiliations.

