Abstract
Agricultural activities lead to the production of large quantities of pruning and residual biomass, the correct disposal of which is a topic of great interest. Unfortunately, although it is an environmentally unacceptable practice, disposal often takes place with uncontrolled combustion in field (open burning). Disposal using biomass boilers produces energy from controlled combustion and the use of abatement systems reduces emissions that are inevitably generated in the combustion processes of solid fuel (CO, CO2, NOx, SO2, PM, etc.). Among the pollutants produced in combustion processes, Persistent Organic Pollutants (POPs) are one of the most relevant groups of chemicals that must be monitored for their effect on human health and the environment. This paper reports the data obtained for the emissive characterization of POPs of three different wood biomass prunings (Olive, Citrus and Grapevine) focusing on VOCs, PAHs, PCBs, PCDD/Fs. Emissions samplings were performed at the stack during combustion in a 30 kWth boiler equipped with a multicyclone filter bag for PM abatement in an isokinetic mode in accordance with the CEN and ISO standards methods. Through this work, a complete emission profile of VOCs, PAHs, PCBs, and PCDD/Fs of three different biomass types is provided for the first time, showing that the use of biomass boilers produces quantities of pollutants below the regulatory limits and still lower than those produced by open burning phenomena. Citrus has shown, regarding the other two essences, elevated concentrations in terms of Σ PAH = 174.247 ng/m3, while Olive gave higher results in terms of PCBs and PCDD/Fs (respectively, 39.769 and 3390.63 TEQ pg/Nm3). This is probably due to the high concentration of iron in this biomass (711.44 mg/kg), which during combustion is a catalyst (together with copper) of PCDD/Fs.
1. Introduction
The growing global energy needs and the objective of reducing energy costs and enhancing waste by-products in a global circular economy view are some of the main reasons why we should move away from fossil fuels and replace them with biofuels. Wood biomass resources are emerging as a promising renewable and sustainable solution, and the combustion of prunings represents an excellent technique of energy conversion of the residual biomass. One of the main advantages is that biomass combustion is considered carbon neutral because the CO2 released during the combustion process is largely balanced by that absorbed by growing plants [1,2]. Combustion of prunings in biomass boilers is also an excellent method not only to obtain energy from waste products, but also to avoid improper disposal such as open burning phenomena. In fact, open crop residue burning is one of the major sources of air pollutants harmful to both the environment and human health [3,4,5,6]. Boilers produce combustion that reduces the atmospheric impact compared to open burning, thanks to abatement systems. In particular, biomass boilers may be equipped with mechanical abatement systems (for example, cyclonic, multicyclone filters, bag filters, etc.) for the reduction of PM [7] and chemical–physical abatement systems (for example adsorption systems, catalytic systems, etc.) for the reduction of organic pollutants [8]. Other combustion parameters such as fuel homogeneity, oxygen content control, etc., contribute to conduct combustion in an adequate condition that reduces pollutant formation, although any combustion phenomenon of solid or liquid fuels inevitably leads to the formation of micro and macro pollutants [9]. Macropollutants are compounds that are usually associated with combustion processes, and their presence and concentration in the atmosphere is alarming beyond the reference thresholds for air quality [10]. Among these compounds are CO2, CO, NOx, SO2, black carbon and PM, which are directly hazardous to the environment and/or human health (primary pollutants) or precursors of the formation of other atmospheric pollutants (secondary pollutants) [11,12,13]. Differently from macropollutants, micropollutants are dangerous for humans and the environment even at low concentrations, and their formation occurs following the rearrangement of molecules during phenomena of incomplete combustion of organic matrices. The main organic micropollutants are called POPs (Persistent Organic Pollutants), identified in the Stockholm Convention (2001) and characterized due to their persistence, bioaccumulation, long-range transport and toxicity [12]. The main organic micropollutants are VOCs (volatile organic compounds), PAHs (polycyclic aromatic hydrocarbons), PCBs (polychlorinated biphenyls), PCDDs (polychlorinated dibenzo-p-dioxins) and PCDFs (polychlorinated dibenzofurans). Their principal characteristics and effects are described here:
- -
- VOCs include a large amount of different organic compounds such as CFCs, alkanes, alkenes, aldehydes, ketones, aromatic compounds, etc., and they can have different effects on humans and the environment depending on their chemical characteristics. According to Tsai [14], they can be precursors to the presence of nitrogen oxides (NOx) of photochemical smog under sunlight radiation. Several VOCs can have a high ozone depletion potential (such as CFCs and halons), can be considered greenhouse gases (such as CFCs), or they can be directly dangerous to human health (such as chlorinated compounds, benzene, etc.) [15];
- -
- PAHs are produced during combustion of carbon materials at high temperatures (300–1200 °C) [16] and are toxic compounds with chemical structures containing hydrogen and carbon with two or more fused aromatic rings. PAHs can be polar or non-polar compounds. Polar PAHs are direct mutagens and carcinogens that induce oxidative stresses and cause more serious health risks than non-polar PAHs [17,18]. Some parent PAHs are transformed into polar PAHs by reactions with atmospheric oxidants [17] such as VOCs. About 65–90% of non-polar PAHs and polar PAHs in the ambient air adsorbed atmospheric particulate matter (PM) [16], which acts as a carrier for the transport of these pollutants in the breathing apparatus;
- -
- PCBs and PCDD/Fs are characterized by a semi-volatile behavior and high fat solubility that leads them to bioaccumulation phenomena. The structure of these chemicals is formed by two benzene rings modified with chlorine and connected directly (PCBs) or with an etheric bond (PCDD/Fs), which makes them highly stable compounds and which means that they can be transported in the atmosphere for long distances from the production source [19]. PCBs and in particular dioxin-like PCBs (dl-PCB) have toxicity similar to PCDD/Fs, although PCB levels are generally higher by orders of magnitude in the environment than PCDD/Fs because of the high production volume [20,21,22]. In 2011, Black et al. [23] highlighted that many studies reported PCDD/F release from metropolitan waste incinerators, but there were few studies published on emissions of PCDD/Fs from biomass combustion.
In recent years, the number of papers on POPs emitted from biomass has increased (es. [24,25,26]), although there are no papers, to the knowledge of the authors, of a complete characterization of the organic pollutants emitted (VOCs, PAHs, PCBs, PCDD/Fs). The several papers in the literature related to biomass combustion are often focused only on the evaluation of the individual classes of pollutants, such as the PCDD/PCDFs and dl-PCBs [23], or only the VOCs [5], and very often on open burning phenomena (therefore difficult to reproduce), while in the proposed work we evaluated all the main organic pollutants of the same plant by comparing 3 different types of pruning. The purpose of this paper is to compare the emissions produced by a biomass boiler fed with three different types of residues (Citrus, Grapevine, Olive). In this paper, we show the results of organic micropollutants (VOCs, PAHs, PCBs, PCDD/Fs); emissions related to macropollutants (CO, CO2, NOx, SO2) were published in a previous work [12].
2. Materials and Methods
Figure 1 shows the 30 kWth biomass boiler (CSA 30–100 GM, D’Alessandro Termomeccanica, Miglianico, CH, Italy) with a multicyclonic dust abatement system located at ARSAC (Regional Company for the Development of Calabrian Agriculture) situated throughout the Calabrian territory (Southern Italy) has been used to burn fruit tree biomass pruning (Citrus, Grapevine, Olive). Prunings were collected in November 2019 by several experimental farms. Such biomass was not treated in order to understand the real energy behavior of pruning. Biomass harvest techniques, the methods used for characterization, the other sampling techniques, and the characteristics of the boiler were described in a previous work [10]. The analyses were carried out at the LASER-B of CREA-IT and at CNR-IIA laboratories.
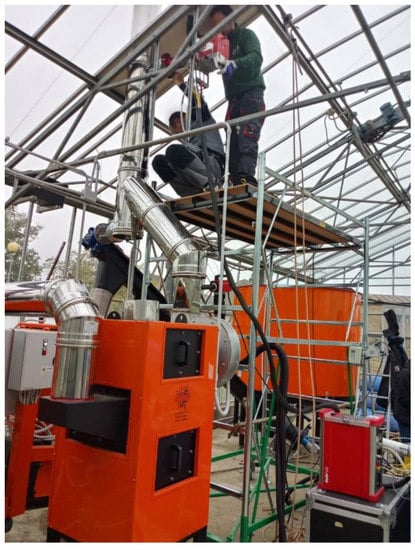
Figure 1.
Isokinetic sampling of organic pollutants at the stack.
Emission Sampling
Each biomass was burned on a different day to allow the boiler to cool and clean. For each experiment, the fuel mass flow was calculated by dividing the amount of fuel burned by the time of the combustion test. Sampling was carried out by means of a flange on the exhaust chimney after the multicyclone filter that allowed the removal of the flying ash with an abatement efficiency of more than 50% for 50 μm diameter powders. Emission sampling was carried out according to an internal method, which provides for the adaptation of technical standards UNI EN 1948-1:2006 (for dioxins and furans), UNI EN 1948-4:2014 (for similar dioxin PCBs) and ISO 11338-1:2003 (for PAHs) according to the filter/condenser method.
The instrument apparatus for sampling, outlined in Figure 2, consists of:
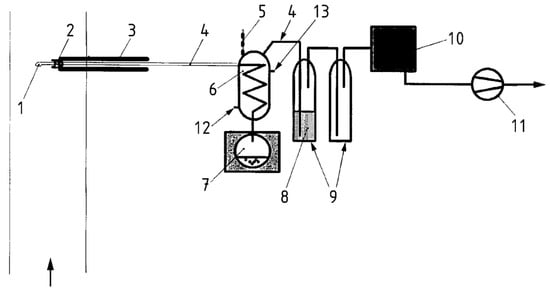
Figure 2.
Diagram of the emission sampling line. 1. Nozzle; 2. Thimble filter; 3. Heated probe; 4. Glass connections; 5. Temperature control; 6. Condenser; 7. Condensate flask; 8. Diethylene glycol; 9. Solid adsorbent; 10. Drying tower; 11. Suction device; 12. Cooled water inlet; 13. Cooled water outlet.
- -
- a heated titanium probe;
- -
- a heated filtration apparatus (thimble filled with quartz wool);
- -
- a water condensation system;
- -
- incondensable vapor collection system (XAD-2 resin).
Before starting the sampling phase, the fumes’ density was calculated and the flue gas velocity profile was studied inside the duct, in order to evaluate the parameters required by the sampling system to obtain an isokinetic collection of the samples. Before each sampling, each filter was spiked with reference labelled standard solutions for the verification of sampling efficiency.
Table 1 shows the main parameters of stack fumes monitored and calculated during sampling with the isokinetic probe.

Table 1.
Sampling conditions at stack.
After each sampling test, the probe was washed with polar and non-polar solvents (acetone and dichloromethane). After the leak test, the filter, XAD-2 and the probe washings were collected as “blank” and analyzed with the same procedure as for the analysis of the samples. For each essence combustion, samples of varying duration according to the conditions of the combustion process were taken in order to determine the organic micropollutants. The sampled matrices (Filter, Condensate Water and Adsorbent Xad-2) were extracted and concentrated for subsequent purification and determinations. Specifically, the solid matrices (Filters and Xad-2) were extracted in Soxhlet by toluene in the presence of sodium sulphate, for a period of 36 h, while the condensates were extracted with 1/10 by volume of the total volume of dichloromethane three times and the extract was added to the washing solvents of the sampling train and then merged into the Soxhlet for the extraction of solid matrices. At the end of this phase, the extract was increased to a small volume (about 10 mL); the efficiency of the extraction, purification and enrichment phases was assessed by the addition of PCDD/F and dl-PCB labelled standards. An aliquot (1/10) of the extract was used for the analysis of PAHs, the remaining portion for the determination of PCDD/PCDFs and dl-PCBs. The aliquot for analysis of PAHs, after addition of internal standards labelled with deuterated compounds, was purified on silica and alumina packaged microcolumns. The alkane fraction was separated by hexane elution; the fraction containing the PAHs was then collected by elution with a mixture of dichloromethane:hexane (1:1) and analyzed in gas chromatography coupled to mass spectrometry (GC/MS), in Single Ion Monitoring (SIM) mode. The aliquot for analysis of PCDD/Fs and PCBs was transferred quantitatively to a multilayer chromatographic column containing anhydrous Na2SO4, silica, acidic silica and silica containing AgNO3; the sample was eluted with hexane and subsequently concentrated. The eluate was then transferred to a glass microcolumn containing alumina. The PCB-containing fraction was collected by eluting with a mixture of 4% methylene chloride hexane; the fraction containing PCDDs and PCDFs was subsequently collected, eluting with a mixture of hexane: methylene chloride (1:1). The solutions containing PCDDs and PCDFs were concentrated and taken with mixtures of internal standards, useful for the calculation of the recovery; they were then subjected to analysis by gas chromatography and high-resolution mass spectrometry (GC/MS) in MS/MS mode. VOCs were sampled using the UNI CEN/TS 13649 method (2015). The samples were produced without the aid of a heated dilution probe but using a cooled probe in which an adsorbent trap was placed downstream followed in series by a backup trap. Not knowing the compounds’ concentrations, several traps with variable flows and times were sampled. The traps used during sampling were thermally desorbed by TD-100xr (Markes Int. Ltd, Bridgend, UK ) with a flow of 50 mL/min up to a temperature of 350 °C for 10 min in splitless mode. The focusing trap was maintained at the temperature of −22 °C. The GC-MS analysis was performed in splitless mode in GC/MS Agilent (GC 7890A and MS/MS 7000) according to the operative parameters in Table 2.
Table 2.
Operative parameters optimized for VOC analysis.
3. Results and Discussions
3.1. Biomass Characterization
The characterization of biomass was carried out in a previous work [10] and is reported in Table 3 for completeness.
Table 3.
Biomass physical–chemical characterization [10].
Analyses in ICP-MS were also carried out to determine the metal content in the three different biomass. The results are shown in Table 4:
Table 4.
Metals concentration in biomass.
High concentrations of macro elements (Na, Ca, Mg, K) were observed, often with concentrations that exceeded 1 g/kg, which is common to all biomass as they are the substances mainly present in soils and irrigation water. Concentrations of Fe varied widely among the three different biomass (from 2.91 to 25.74 up to 711.44 mg/kg), and this is a particularly important value as this metal, as well as the Cu, at combustion temperatures, is a catalyst in the formation of PCBs and PCCD/Fs.
3.2. VOC
Results of the VOCs emitted are reported in Table 5, in which 31 different analytes were identified. Emissive profiles show a wide variety of compounds, including several classes of compounds (alkanes, alkenes, aromatic, halogenated, etc.). The only compounds determined in the emissions in all three cases are the following: Propene, Benzene, Toluene and Xylenes. These VOCs are in fact the most commonly emitted by any combustion process. Particularly high are the concentrations of VOC emitted by Grapevine with compounds such as Trichloromethane, Bromochloromethane, Benzene and 1,2-dibromoethane that exceed 100 ug/Nm3. This is probably due to the fact that the use of Grapevine has led to more alternating steps of combustion—smoking phase — than other biomass. Differently from other organic micropollutants, which are generated principally in combustion, VOCs are generated both in combustion and also in large part during the smoking phase (when the combustion has stopped, but the residual heat generates emissive fumes from the matrix). This alternation burning–smoking phase occurred because despite performing the same process of chipping for all biomass to obtain uniform wood shavings, the Grapevine had more irregular and filamentous particles, perhaps because of the wood and bark nature. These characteristics have made it more difficult for the boiler to have constant combustion and may have affected the burning conditions and the data acquisition.
Table 5.
VOC concentrations.
3.3. PAHs
20 PAHs analytes were identified in gaseous emissions at the stack. As shown in the following Table 6, concentrations vary greatly between different essences. In particular, large concentrations are noted especially in the case of citrus.
Table 6.
PAHs emission concentrations (ng/Nm3) of Olive, Citrus and Grapevine samples.
Italian Legislative Decree 183/2017, in accordance with EU Directive 2015/2193, establishes the emission limit at 0.1 mg/Nm3 for the sum of the concentrations of the following PAHs: Dibenzo(a.e)pyrene, Dibenzo(a,h)pyrene, Benzo(a)pyrene, Dibenzo(a,i)pyrene, Dibenzo(a,l)pyrene, Dibenzo(a,h)anthracene, Benzo(a)anthracene, Benzo(b)fluoranthene, Indeno (1,2,3-cd) pyrene (1), Benzo(j)fluoranthene, Benzo(k)fluoranthene, Dibenzo(a,h)acridine, and Dibenzo(a,j)acridine. Although acridines have not been calculated, concentrations are below 2 orders of magnitude. Specifically, 0.008395 mg/Nm3 for the Olive, 0.004818 for Citrus and 0.00063 for the Grapevine. The Grapevine PAHs data cannot be considered analytically reliable and was therefore excluded from the following comparisons. The % R SS (percentage recovery of the sampling standard) was in fact lower than 30%, while the % R ES (percentage recovery of the Extraction standard) was between 60 and 83%. The % R ES validated the processing step in the laboratory while the % R SS identified the problem in the sampling phase. The combustion parameters were, however, within the norm (reported in the previous paper [12]), confirmed by VOC data comparable to other essences value (see Table 5). If we consider the total PAHs, the Citrus type has produced almost three times that of the Olive, but compared to the regulated and more toxic compounds, the Olive sample had a greater impact in terms of emissions. This is mainly due to the large concentrations of Indeno(1,2,3-c,d)pyrene and Dibenzo(a,h)anthracene produced. The major contribution of the samplings (Olive and Citrus) is given by naphthalene, a compound which, however, has little impact given its low toxicity [27].
3.4. PCBs and PCDD/Fs
Table 7 and Table 8 show the total concentration of both PCDD/Fs and PCBs, expressed as Toxicity EQuivalent (TEQ pg/Nm3) to 2,3,7,8 Tetra Chloro-p-dibenzodioxin based on WHO 2006 toxic equivalency factors (TEF). The Olive pruning is the one that produces the greatest quantities of PCBs. It is thought that it could mainly be due to the catalytic effect of the higher concentration of Cu and Fe in this biomass (Table 4). In fact, copper is the main catalyst in the formation of organo–chlorine compounds during combustions, according to the Deacon synthesis.
Table 7.
PCB amounts in pg and concentrations in Toxicity Equivalent (TEQ ng/Nm3) of Olive, Citrus and Grapevine samples.
Table 8.
PCDD/F amounts in pg and concentrations in Toxicity Equivalent (TEQ ng/Nm3) of Olive, Citrus and Grapevine samples.
Regarding PCBs and PCDD/Fs, as mentioned above in reference to Italian Legislative Decree 183/2017 in accordance with EU Directive 2015/2193, the limit of the sum of the concentrations of PCBs is 0.5 mg/Nm3, while for PCDD/Fs it is 0.01 mg/Nm3. These values are widely respected in all cases. From Table 7, it emerges that for PCBs in all three essences considered, the greatest contribution in TEQ is attributable to 3,3′,4,4′,5-PentaCB; this is a consequence of the fact that the compound has higher TEF than the others.
As can be seen from the distribution trend normalized to 100% in pg (Table 7), the emissions of PCBs follow a characteristic trend, with a prevalence of 3,3′,4,4′,5-PentaCB, 2,3′,4,4′,5-PentaCB followed by 3,3′,4,4′,5,5′-HexaCB and 3,3′,4,4′-TetraCB.
A different argument must be made for PCDD/Fs where the distribution trend of the emitted compounds is completely distinct between the essences (Table 8).
For both Olive and Citrus samples, some compounds prevailed in pg over the total, finding a correspondence also on the scale in TEQ 2,3,4,7,8-Penta CDF, 2,3,7,8-Tetra CDF and the 1,2,3,7,8-PentaCDF. According to the toxicity scale, these are also the ones that make the greatest contribution to the total.
4. Conclusions
The use of biomass pruning in energy conversion systems for combustion is a technique for the production of renewable energy and the disposal of agroforestry residues. The comparison between 3 different types of biomass (Olive, Citrus, Grapevine) showed that there are deep differences between one biomass and another in terms of emissions of organic micropollutants. The work shows how important it is to know the chemical–physical characteristics of the incoming biomass, as the presence of metals catalyzing the formation of organic pollutants, the presence of a high ash content, high humidity, etc., are factors contributing to poor combustion conditions and therefore to an inevitable increase in the formation of air pollutant compounds. We identified 31 VOCs in the 3 different emissions with only Propene, Benzene, Toluene and Xylenes common to all biomass. The Grapevine produced VOCs with higher concentrations compared to the other two biomass.
As regards the analysis of PAH, the sample collected during the grapevine combustion was discarded from the comments since I%R of the sampling standards invalidated the quantitative analyses. For PAHs, it was observed that Citrus led to the production of quantities of a higher order of magnitude than the other two species. Analysis of PAHs indicated a high production of semi-volatile organic compounds for emissions from combustion of Citrus residues, about three times as high as Olive residues. The major contribution is attributable to naphthalene, which, however, on the toxicity scale does not have a great impact and instead is attributable to Indeno(123-cd)pyrene. With regard to PCDD/Fs, although greater total quantities (pg) in emissions from Olive wood were detected compared to that of Citrus, the latter had a greater impact on the toxicity given by the contribution of Hexa furans and dioxins.
The distribution of PCBs shows in all three essences that the greatest contribution in TEQ is attributable to 3,3′,4,4′,5-PentaCB, with Olive that produces greater amounts. In particular, with regard to PCB and PCDD/F, the concentrations (expressed as pg/Nm3) have a trend that increases with the Fe concentration in biomass. In fact, Fe in Olive, Citrus and Grapevine is respectively 711.44; 25.74 and 2.91 mg/kg, while PCBs + PCDD/F (in TEF pg/Nm3) are 39.769 + 3390.63 for the Olive, 18.788 + 2039.24 for Citrus and 9.451 + 61.39 for the Grapevine. In fact, Fe [28] is indicated as a catalyst in the formation of these compounds during combustion, as well as Cu, whose concentration is very similar in all three essences studied. It should be noted, however, that in all the tests carried out, the regulatory limits were never exceeded, which shows that the use of a homogenous fuel and the use of biomass boilers equipped with appropriate abatement systems is an optimal solution for the disposal and production of renewable energy in harmony with the environment. Biomass, if not properly disposed of, often meets the practice of open burning or combustion in the open field, or risks giving rise to fires. This practice is environmentally damaging because it produces a greater number of pollutants than combustion in a boiler [23] and also releases to the ground ash that is rich in terms of heavy metals and that can contaminate the soil [29].
Author Contributions
Conceptualization, E.G. and E.P.; data curation, E.P., E.G. and M.C. (Marina Cerasa); sampling and formal analysis, M.C. (Monica Carnevale), M.P., E.P., A.P., B.V., M.C. (Marina Cerasa) and S.F.P.; funding acquisition, F.G. and A.R.P.; investigation, M.C. (Monica Carnevale), M.C. (Marina Cerasa) and M.P.; methodology, E.G.; project administration, F.G. and A.R.P.; resources, F.G., R.B., A.R.P.; visualization, R.B., S.F.P.; writing—original draft, E.P. and A.P.; writing—review and editing, E.G. and M.S. All authors have read and agreed to the published version of the manuscript.
Funding
This work was supported by the Italian Ministry of Agricultural, Food and Forestry Policies (MiPAAF) under the AGROENER (D.D. n. 26329, 01/04/2016), FAESI (D.M. 4056, 24/07/08) and sub-project ‘Tecnologie digitali integrate per il rafforzamento sostenibile di produzioni e trasformazioni agroalimentari (AgroFiliere)’ (AgriDigit programme) (DM 36503.7305.2018 of 20/12/2018).
Institutional Review Board Statement
Not applicable.
Informed Consent Statement
Not applicable.
Conflicts of Interest
The authors declare no conflict of interest.
Nomenclature
| CFC | Chlorofluorocarbons |
| CO | Carbon Monoxide |
| CO2 | Carbon Dioxide |
| GC-MS | Gas Chromatography—Mass Spectrometery |
| kWth | Kilowatt-thermal. |
| GC/MS | Gas Chromatography/Mass Spectrometry |
| NOx | Nitorgen Monoxide and Nitrogen Dioxide |
| PAHs | Polycyclic Aromatic Hydrocarbons |
| PCBs | Polychlorinated Biphenyls |
| PCDD/Fs | Polychlorinated Dibenzo-p-Dioxins and Polychlorinated Dibenzofurans |
| PM | Particular Matter |
| POPs | Persistent Organic Pollutants |
| SIM | Selected Ion Monitoring |
| SO2 | Sulphur Dioxide |
| TEF | Toxic Equivalency Factors |
| TEQ | Toxic Equivalence |
| VOCs | Volatile Organic Compounds |
| XAD-2 | Adsorbent Resin for Semivolatiles Sampling |
| Nm3 | Normal cubic meter |
References
- Demirbas, A. Combustion characteristics of different biomass fuels. Prog. Energy Combust. Sci. 2004, 30, 219–230. [Google Scholar] [CrossRef]
- Rafael, S.; Tarelho, L.; Monteiro, A.; Sá, E.; Miranda, A.I.; Borrego, C.; Lopes, M. Impact of forest biomass residues to the energy supply chain on regional air quality. Sci. Total Environ. 2015, 505, 640–648. [Google Scholar] [CrossRef] [PubMed]
- Demirbas, A. Hazardous emissions from combustion of biomass. Energy Sources A Recover. Util. Environ. Eff. 2008, 30, 170–178. [Google Scholar] [CrossRef]
- Estrellan, C.R.; Iino, F. Toxic emissions from open burning. Chemosphere 2010, 80, 193–207. [Google Scholar] [CrossRef]
- Paris, E.; Gallucci, F.; Carnevale, M.; Khalid, A.; Paolini, V.; Guerriero, E. Evaluation of the VOCs emitted by the combustion of rice straw. Eur. Biomass Conf. Exhib. Proc. 2019, 1663–1666. [Google Scholar]
- Gadde, B.; Bonnet, S.; Menke, C.; Garivait, S. Air pollutant emissions from rice straw open field burning in India, Thailand and the Philippines. Environ. Pollut. 2009, 157, 1554–1558. [Google Scholar] [CrossRef]
- Boman, C.; Pettersson, E.; Westerholm, R.; Boström, D.; Nordin, A. Stove Performance and Emission Characteristics in Residential Wood Log and Pellet Combustion, Part 1: Pellet Stoves. Energy Fuels 2011, 25, 307–314. [Google Scholar] [CrossRef]
- Pařízek, T.; Bébar, L.; Stehlík, P. Persistent pollutants emission abatement in waste-to-energy systems. Clean Technol. Environ. Policy 2008, 10, 147–153. [Google Scholar] [CrossRef]
- Vincenti, B.; Paris, E.; Carnevale, M.; Palma, A.; Guerriero, E.; Borello, D.; Paolini, V.; Gallucci, F. Saccharides as Particulate Matter Tracers of Biomass Burning: A Review. Int. J. Environ. Res. Public Health 2022, 19, 4387. [Google Scholar] [CrossRef]
- Canter, L.W. Macro Air Pollution Effects. Air Pollut. 2019, 1–6. [Google Scholar] [CrossRef]
- Nazaroff, W.W.; Weschler, C.J. Cleaning products and air fresheners: Exposure to primary and secondary air pollutants. Atmos. Environ. 2004, 38, 2841–2865. [Google Scholar] [CrossRef]
- Proto, A.R.; Palma, A.; Paris, E.; Papandrea, S.F.; Vincenti, B.; Carnevale, M.; Guerriero, E.; Bonofiglio, R.; Gallucci, F. Assessment of wood chip combustion and emission behavior of different agricultural biomasses. Fuel 2021, 289, 119758. [Google Scholar] [CrossRef]
- Anderson, R.R.; Martello, D.V.; Lucas, L.J.; Davidson, C.I.; Modey, W.K.; Eatough, D.J. Apportionment of Ambient Primary and Secondary Pollutants during a 2001 Summer Study in Pittsburgh Using U.S. Environmental Protection Agency UNMIX. J. Air Waste Manag. Assoc. 2006, 56, 1301–1319. [Google Scholar] [CrossRef][Green Version]
- Tsai, W.T. Fate of chloromethanes in the atmospheric environment: Implications for human health, ozone formation and depletion, and global warming impacts. Toxics 2017, 5, 23. [Google Scholar] [CrossRef]
- Ciccioli, P.; Brancaleoni, E.; Frattoni, M.; Cecinato, A.; Pinciarelli, L. Determination of volatile organic compounds (VOC) emitted from biomass burning of Mediterranean vegetation species by GC-MS. Anal. Lett. 2001, 34, 937–955. [Google Scholar] [CrossRef]
- Famiyeh, L.; Chen, K.; Xu, J.; Sun, Y.; Guo, Q.; Wang, C.; Lv, J.; Tang, Y.T.; Yu, H.; Snape, C.; et al. A review on analysis methods, source identification, and cancer risk evaluation of atmospheric polycyclic aromatic hydrocarbons. Sci. Total Environ. 2021, 789, 147741. [Google Scholar] [CrossRef]
- Drotikova, T.; Ali, A.M.; Halse, A.K.; Reinardy, H.C.; Kallenborn, R. Polycyclic aromatic hydrocarbons (PAHs) and oxy- and nitro-PAHs in ambient air of the Arctic town Longyearbyen, Svalbard. Atmos. Chem. Phys. 2020, 20, 9997–10014. [Google Scholar] [CrossRef]
- Elzein, A.; Dunmore, R.E.; Ward, M.W.; Hamilton, J.F.; Lewis, A.C. Variability of polycyclic aromatic hydrocarbons and their oxidative derivatives in wintertime Beijing, China. Atmos. Chem. Phys. 2019, 19, 8741–8758. [Google Scholar] [CrossRef]
- Li, X.; Su, X. Assessment of the Polychlorinated Biphenyl (PCB) Occurrence in Copper Sulfates and the Influential Role of PCB Levels on Grapes. PLoS ONE 2015, 10, e0144896. [Google Scholar] [CrossRef]
- Chen, J.; Zhao, H.; Gao, L.; Henkelmann, B.; Schramm, K.-W. Atmospheric PCDD/F and PCB levels implicated by pine (Cedrus deodara) needles at Dalian, China. Environ. Pollut. 2006, 144, 510–515. [Google Scholar] [CrossRef]
- Schmid, P.; Gujer, E.; Zennegg, M.; Bucheli, T.D.; Desaules, A. Correlation of PCDD/F and PCB concentrations in soil samples from the Swiss soil monitoring network (NABO) to specific parameters of the observation sites. Chemosphere 2005, 58, 227–234. [Google Scholar] [CrossRef]
- Okay, O.S.; Karacik, B.; Başak, S.; Henkelmann, B.; Bernhöft, S.; Schramm, K.-W. PCB and PCDD/F in sediments and mussels of the Istanbul strait (Turkey). Chemosphere 2009, 76, 159–166. [Google Scholar] [CrossRef]
- Black, R.R.; Meyer, C.P.M.; Touati, A.; Gullett, B.K.; Fiedler, H.; Mueller, J.F. Emission factors for PCDD/PCDF and dl-PCB from open burning of biomass. Environ. Int. 2012, 38, 62–66. [Google Scholar] [CrossRef]
- Paris, E.; Carnevale, M.; Vincenti, B.; Palma, A.; Guerriero, E.; Borello, D.; Gallucci, F. Evaluation of VOCs Emitted from Biomass Combustion in a Small CHP Plant: Difference between Dry and Wet Poplar Woodchips. Molecules 2022, 27, 955. [Google Scholar] [CrossRef] [PubMed]
- Lai, Y.-C.; Tsai, C.-H.; Chen, Y.-L.; Chang-Chien, G.-P. Distribution and Sources of Atmospheric Polycyclic Aromatic Hydrocarbons at an Industrial Region in Kaohsiung, Taiwan. Aerosol Air Qual. Res. 2017, 17, 776–787. [Google Scholar] [CrossRef]
- Saral, A.; Gunes, G.; Demir, S. Atmospheric PCDD/PCDF emission inventory for Turkey. Atmos. Pollut. Res. 2014, 5, 24–33. [Google Scholar] [CrossRef]
- International Agency for Research on Cancer. IARC Monographs on the Evaluation Carcinogenic Risks to Humans: Silica; International Agency for Research on Cancer: Lyon, France, 2002; pp. 96:i–ix+1–390. [Google Scholar]
- Guerriero, E.; Bianchini, M.; Gigliucci, P.F.; Guarnieri, A.; Mosca, S.; Rossetti, G.; Varde, M.; Rotatori, M. Influence of Process Changes on PCDD/Fs Produced in an Iron Ore Sintering Plant. Environ. Eng. Sci. 2008, 26, 71–80. [Google Scholar] [CrossRef]
- Freire, M.; Lopes, H.; Tarelho, L.A.C. Critical aspects of biomass ashes utilization in soils: Composition, leachability, PAH and PCDD/F. Waste Manag. 2015, 46, 304–315. [Google Scholar] [CrossRef]


Publisher’s Note: MDPI stays neutral with regard to jurisdictional claims in published maps and institutional affiliations. |
© 2022 by the authors. Licensee MDPI, Basel, Switzerland. This article is an open access article distributed under the terms and conditions of the Creative Commons Attribution (CC BY) license (https://creativecommons.org/licenses/by/4.0/).