Abstract
Compared to the zenith hydrostatic delay (ZHD) obtained from the Saastamonien model based on in-situ measured meteorological (IMM) data and radiosonde-derived weighted mean temperature (), the ZHD and deviations of the GPT3 model have shown obvious periodic trends. This article analyzed the seasonal variations of GPT3-ZHD and GPT3- during the 2016–2020 period in the Yangtze River Delta region, and the new improved ZHD and models were established by the multi-order Fourier function. The precision of the improved-ZHD model was verified using IMM-ZHD products from 7 GNSS stations during the 2016–2020 period. Furthermore, the precisions of improved and precipitable water vapor (PWV) were verified by radiosonde-derived and PWV in the 2016–2019 period. Compared with the IMM-ZHD and GNSS-PWV products, the mean Bias and RMS of GPT3-ZHD are −0.5 mm and 2.1 mm, while those of GPT3-PWV are 2.7 mm and 11.1 mm. Compared to the radiosonde-derived , the mean Bias and RMS of GPT3- are −0.8 K and 3.2 K. The mean Bias and RMS of the improved-ZHD model from 2019 to 2020 are −0.1 mm and 0.5 mm, respectively, decreasing by 0.4 mm and 1.6 mm compared to the GPT3-ZHD, while those of the improved- are −0.6 K and 2.7 K, respectively, decreasing by 0.2 K and 0.5 K compared to GPT3-. The mean Bias and RMS of PWV calculated by GNSS-ZTD, improved-ZHD, and improved- are 0.5 mm and 0.6 mm, respectively, compared to the GNSS-PWV, decreasing by 2.2 mm and 10.5 mm compared to the GPT3-PWV. It indicates that the improved ZHD and models can be used to obtain the high-precision PWV. It can be applied effectively in the retrieval of high-precision PWV in real-time in the Yangtze River Delta region.
1. Introduction
Sufficient atmospheric water vapor is one of the necessary conditions for precipitation formation, and water vapor detection plays an important role in weather forecasting, disaster monitoring and global climate change monitoring [1]. GNSS precipitable water vapor (GNSS-PWV) can be used to reflect the atmospheric water vapor variations in GNSS meteorology. It has the potential to forecast severe weather phenomena [2,3,4] and examine the effects of climate change [5,6]. Previous studies [3,7,8,9,10] have shown that there will be severe rainstorms in the downward trend process after GNSS-PWV reaches its peak value. Benevides et al. [11] proposed that the accuracy of weather forecasting could be improved after analyzing 3D distribution variations of PWV [12,13,14,15,16].
The inversion process of GNSS-PWV requires the zenith wet delay (ZWD) and the water vapor conversion coefficient (). ZWD can be obtained by subtracting the zenith hydrostatic delay (ZHD) from the zenith total delay (ZTD) [17]. ZHD is the main delay for the GNSS signals transmitted in the neutral atmosphere, accounting for more than 90% of ZTD. It means that the precision of ZHD will indirectly affect the precision of ZWD. The weighted mean temperature () is one of the important parameters to calculate for the conversion of ZWD to PWV [18]. The ZHD and play a crucial role in obtaining high-precision real-time GNSS-PWV [19,20].
Currently, the commonly used ZHD models can be divided into two categories. One is the empirical models based on the measured meteorological parameters, including the Saastamonien [21], Hopfield [22], and Black [23] models. For example, the Saastamonien model uses meteorological sensors to measure surface pressure and can calculate the ZHD at a millimeter level. However, it is difficult to obtain the measured meteorological parameters in real time at any place in the world, which limits the application of tropospheric delay models that need measured meteorological parameters with respect to GNSS meteorology. In this case, the use of atmospheric data to establish regional or global real-time tropospheric delay models has been widely concerned, such as UNB3m [24], EGNOS [1] and GPT [25,26,27,28]. ERA-Interim [29] and ERA5 [30] are also used to interpolate surface meteorological parameters at the GNSS stations. At the same time, a series of studies have achieved fruitful results in this research area. Ghaffari Razin and Voosoghi [31] use Bernese GNSS software and Saastamoinen model to calculate the ZTD and ZHD, then the ZWD obtained by subtracting the ZHD from the ZTD is modeled by two different machine learning methods, which can obtain PWV with high accuracy. A site-specific ZHD model was established by collecting an atmospheric vertical profile from radiosondes stations. It provides an error about 0.19 mm, which can be used to accurately estimate PWV [32]. Yang, et al. [33] analyzed the global performance of the three most commonly used ZHD models, the best temperature and pressure models were established by evaluating the influence of different modeling factors and the meteorological parameters estimated by the above-mentioned models. Based on the ERA5 reanalysis data of the European Centre for Medium-Range Weather Forecasts (ECMWF), Mateus, et al. [34] developed a one-hour global air pressure and temperature model (HGPT) to provide pressure, temperature, ZHD, and . Climate studies, GNSS meteorology and other atmospheric research can significantly benefit from it.
The is a necessary parameter to calculate the K value and plays a key role in atmospheric water vapor conversion. Among various calculation methods, the accuracy of radiosonde-derived is the highest, but it is difficult to popularize due to the spatiotemporal limitation of radiosondes [35,36,37]. Therefore, Bevis used the ground surface temperature () from the profiles of vapor partial pressure and dewpoint temperature of North American radiosondes over a two-year period to establish a global mean temperature model in 1992 ( = 0.72 0.2) [38]. However, due to the influence of location, time, and other factors, the regional accuracy of Bevis model is inconsistent. In general, the systematic deviation is greater than 4.0 K, and even greater than 8.0 K in some areas [39,40]. When encountering bad weather, it may even lead to a significant deviation of GNSS-PWV [41,42]. Considering the linear relationship between and , many scholars have established different regional models (RTM) based on local radiosondes [40,42,43,44]. The RTM established in Hong Kong can control the deviation within 4.0 K, which is superior to the Bevis model [45]. Singh, et al. [46] have found that the site specific model is better than the developed regional model and global model at New Delhi and Patiala. Elhaty, et al. [47] use radiosonde profiles from four stations situated in Egypt during 2015–2016 and Bevis linear regression method to develop a new model. Several RTMs using one factor () have been established in China [45,48,49,50]. Li and Mao [48] deeply studied the monthly coefficient of RTM in eastern China. Guo, et al. [51] established a good annual single factor RTM model based on sounding data in the Yangtze River Delta region. Based on the above research, the researchers established many multi-factor RTM models [52,53,54]. Considering the influence of pressure () and water vapor pressure () on , Gong [52] analyzed the relationship between meteorological elements using the data of 123 radiosonde stations in China, and established multi-factor models in different climatic regions, effectively improving the accuracy of single factor models. However, the models established by Wang, Song, Dai, and Cao [53] show that there is little difference in accuracy between the single factor model and the multi-factor model in Hong Kong. According to the above linear regression models, the precision of non-linear RTM between and proposed and established by Yao, et al. [55], which is slightly better than that of linear RTM. Zhu, et al. [56] established a non-linear model for China with elevation corrections, which provides a significant correction effect for in the vertical direction. Lan, Zhang, and Geng [39] adopt the sliding average method to calculate the correlation coefficient between of the ECMWF and from the “GGOS Atmosphere”. Compared to the - relation of Bevis model, the Grid model shows higher precision. Most researchers will analyze its precision comparing the PWV calculated by different ZHD and models [57,58].
As mentioned above, when GNSS stations lack meteorological instruments, GPT series models are usually used to obtain real-time meteorological parameters. Boehm, Heinkelmann and Schuh [25] first proposed GPT in 2007, which can provide the pressure and temperature at any geographical location on the earth surface. Lagler, Schindelegger, Böhm, Krásná, and Nilsson [28] developed the GPT2 by combining the GPT with global mapping function (GMF), which can provide more meteorological parameters. Böhm, Möller, Schindelegger, Pain and Weber [26] introduced the vertical gradient of water vapor pressure and to establish GPT2w on the basis of GPT2 in 2015. The GPT3 model is the latest version of the GPT series models, it can provide not only parameters from GPT2w, but also empirical gradient grids and is one of the most accurate and widely used tropospheric delay models [27]. Many studies have shown that the GPT3 model can provide high-precision ZTD and horizontal gradient information on a global scale, however, due to the limitation of terrain and other conditions, the GPT3 model based on European Centre for Medium-Range Weather Forecasts (ECMWF) data cannot be perfectly applied to any area [59,60,61]. Therefore, in a specific time and area, the precision of GPT3 model may not meet the requirements of some high-precision GNSS-PWV applications
Based on the GNSS products and radiosondes data in the Yangtze River Delta region during the 2016–2020 period, this paper analyzed the seasonal variations of the and ZHD of GPT3 model in the Section 2, and then the Fourier function was used to establish the improved ZHD and models in the Section 3. Meanwhile, the precisions of these improved ZHD and models were verified by comparing them with the GNSS and radiosondes products in the Section 3. The Section 4 is the conclusion.
2. Data Sources and Methodology
2.1. Data Sources
Data from seven GNSS stations in the Yangtze River Delta region from 2016 to 2020 [62], mainly including parameters such as altitude, pressure, temperature, ZTD, ZHD and PWV (time resolution is one hour) were used to analyze the precision of corresponding parameters from the GPT3 model. Among them, the deviation between GPT3-ZHD and IMM-ZHD during the 2016–2018 period was used to establish the improved-ZHD model based on the Fourier function, and IMM-ZHD from 2016 to 2020 was used to verify the precision of the improved-ZHD model.
Data from seven radiosonde stations in the Yangtze River Delta region from 2016 to 2019 were obtained from Wyoming State University (http://weather.uwyo.edu/upperair/sounding.html, accessed on 15 April 2022), and it include meteorological parameters such as pressure, temperature and elevation (time resolution is 12 h). The PWV and can be obtained by the integration method, and used as a reference to analyze the precision of GPT3- and its inversion precision of PWV. The deviation of the GPT3- and the radiosonde-derived obtained by the integration method during the 2016–2018 period was used to establish an improved model based on the Fourier function, and the data from 2016 to 2019 were used to verify the precision of the improved model. Figure 1 is the location information of 7 GNSS stations and seven radiosonde stations.
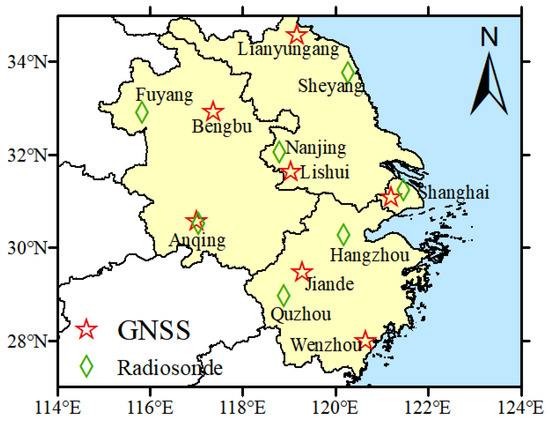
Figure 1.
Distribution map of GNSS and radiosonde stations in the Yangtze River Delta region.
2.2. Methodology
2.2.1. Tm Calculation
The is calculated by the numerical integration method using the radiosondes selected in Figure 1. The radiosonde-derived has high calculation precision and is easy to realize [63]. It will be used as the reference or true value to evaluate the precision of GPT3-.
where, z is the elevation of the layer (km), e is the surface water vapor pressure (hPa), and is the surface dew point temperature (°C).
2.2.2. GNSS-PWV and GPT3-PWV Calculations
GNSS has the advantages of all-weather, continuous and global coverage, it can provide high-precision ZTD except for navigation and positioning. According to the multi-frequency GNSS observations, the GNSS-ZTD time series can be obtained using precise point positioning (PPP) [64]. Firstly, the real-time clock error of satellites can be obtained by the data of GNSS reference stations and IGU orbit from IGS, then, then the time series of real-time ZTD will be calculated by the PPP routine of RTKLib on the basis of the real-time clock error of satellites and IGU products [3].
GNSS-ZTD consists of IMM-ZHD and GNSS-ZWD (), and the IMM-ZHD can be calculated by the model based on the latitude, air pressure and elevation of the sites [21], the formula is as follows.
where, is the pressure of the station (hPa), is the latitude of the station ( is the elevation of the station (km). ZWD obtained by ZTD minus ZHD and the GNSS-PWV is determined by the following expression.
where, is the atmospheric water vapor conversion coefficient, is the gas constant of the water vapor ratio, ; and are the atmospheric refractive index constants; ; ; ; The is obtained from the measured meteorological data according to Equation (1).
GPT3-PWV and GNSS-PWV adopt the same calculation method as Equation (3), but the difference is that and ZWD for GPT3-PWV are obtained from the GPT3 model, which is more convenient.
2.2.3. Fourier Function
The Fourier function is a special triangular series proposed by Fourier, a French mathematician. Its characteristics and advantages are that complex functions can be transformed into linear combinations of simple trigonometric functions, which can accurately approximate any complex function, achieving the purpose of studying complex functions when given the appropriate orders, coefficients, and frequency [65]. The basic formula is as follows.
where, is the orders, is the frequency, and and are the coefficients.
2.2.4. Statistical Method
The mean Bias and the root mean square (RMS) are used to evaluate the precision of the meteorological parameters and improved models as follows.
where, and represent parameter value of the models and truth, respectively, and the is the number of samples.
3. Results and Discussions
The GPT series model (http://ggosatm.hg.tuwien.ac.at/DELAY/, accessed on 10 January 2022) is one of the popular open-source tropospheric delay models by adding empirical meteorological parameters. It only needs to provide the approximate coordinates of the station (Latitude, Longitude, Height) and day of year (DOY), and the values of meteorological parameter at any location all over the world can be obtained. The GPT3 model, as the latest model of the GPT series, has added gradients in two directions (N for north and E for east), and is completely consistent with the Vienna mapping function (VMF3), which can meet various purposes for meteorological and climate research. Its formula is as follows.
where, r(t) are the values of the meteorological parameters at the grid point; is the mean value; , the amplitudes of the annual cycle; and , the amplitudes of the semi-annual cycle. Coefficients can be obtained by combining external grid files with bilinear interpolation.
The GPT3 model uses the Saastamonien model to calculate ZHD as shown in Equation (1). The s model [66] is used to calculate the ZWD. The GPT3 model also provides some empirical meteorological parameters that are inconvenient to measure directly. These meteorological parameters can be used to calculate GPT3-ZWD; the calculation formula of GPT3-PWV is the same as Equation (2).
3.1. The Improved ZHD Model
The comparison of GPT3-ZHD and IMM-ZHD of four GNSS stations at Anqing, Bengbu, Lishui and Lianyungang from 2016 to 2020 is shown in Figure 2. It can be seen that ZHD shows obvious seasonal periodical changes, and the overall trend of the two types of ZHD is similar. The ZHD value reaches the valley value in June, while it reaches its peak value in December. Affected by location and altitude, the peak value (or valley value) of ZHD at each station generally has a millimeter to centimeter deviation.
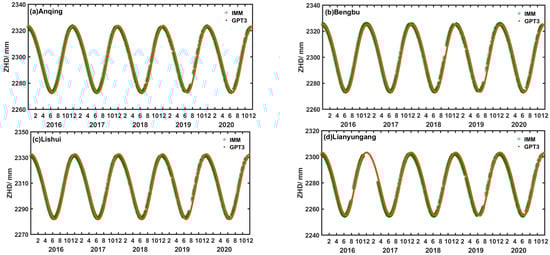
Figure 2.
The seasonal variations of ZHD in Anqing (a), Bengbu (b), Lishui (c), and Lianyungang (d) during 2016–2020.
3.1.1. The Establishment of an Improved ZHD Model
Based on the analysis of GPT3-ZHD, experiments and analysis show that the Fourier function can be effectively used for model fitting. It will perform different fitting effects for the deviation of GPT3-ZHD by using different orders of the Fourier function. By comparison, the accuracy of the third order Fourier is much better than that of the first order, which is close to the fourth order, and the coefficient of the third order is simpler than that of the fourth order, so we chose the third order. Therefore, the third-order Fourier function is adopted to establish an improved ZHD model in this paper. Its calculation formula is as follows.
where, , , , , , , , , represent the coefficients, is the day of year, and is the deviation fitting curves based on the third-order Fourier function.
The GPT3-ZHD deviations of the 7 GNSS stations in the Yangtze River Delta region from 2016 to 2018 were used in Equation (7). It can obtain the model coefficients of the third-order Fourier function as shown in Table 1, which is a numerical description of the distribution characteristics of the GPT3-ZHD deviation. Figure 3 is the fitting curve of the ZHD deviation, it can be seen that the deviation distribution of GPT3-ZHD at seven stations is relatively small and the difference is mainly within 2 mm. The fitting curve agrees well with the deviation of each GNSS station, and the fitting deviation is mostly within 0.5 mm.

Table 1.
The Fourier coefficients of the GPT3-ZHD bias in the Yangtze River Delta region during 2016–2018.
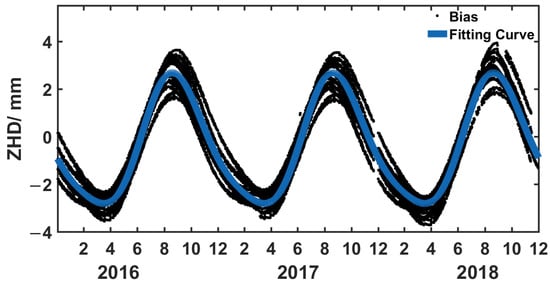
Figure 3.
Bias and fitting curves of the GPT3-ZHD bias in the Yangtze River Delta region during 2016–2018.
3.1.2. Precision Analysis
The improved ZHD model established in the previous section can be used to predict the ZHD value (improved-ZHD) at GNSS stations from 2016 to 2020. Moreover, the article analyzed the precision of the improved ZHD model using the IMM-ZHD as the true value, and verified the weakening effect of the seasonal periodic deviation in Figure 4. It is clear that the periodic deviation of improved-ZHD at most stations has been greatly decreased, but the periodic fluctuation of improved-ZHD at Bengbu Station still has a small amplitude, which is related to the large gap between its GPT3-ZHD deviation and the overall trend of the deviation distribution. In general, most of the deviations of the improved ZHD model are maintained within 0.5 mm, and the precision of the improved-ZHD is greatly improved compared to the GPT3 model.
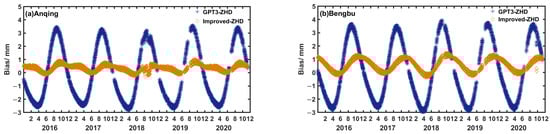
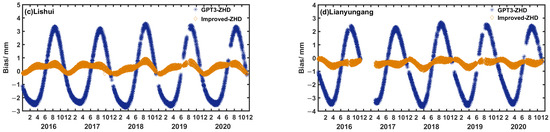
Figure 4.
The bias of improved-ZHD and GPT3-ZHD at Anqing (a), Bengbu (b), Lishui (c), and Lianyungang (d) during the 2016–2020 period.
Table 2 shows the precision statistics of the improved ZHD model from 2016 to 2020. It can be seen from the table that the Bias and RMS of the improved ZHD model based on the Fourier function from 2019 to 2020 are −0.1 mm and 0.5 mm, respectively, which are 0.7 mm and 1.6 mm better than that of GPT3-ZHD, respectively. The overall precision of the improved-ZHD is significantly improved and relatively stable at each station. Therefore, the improved ZHD model has a higher precision and applicability than the GPT3 model in the Yangtze River Delta region.
Table 2.
The precision of improved ZHD in the Yangtze River Delta region during the 2016–2020 period (mm).
3.2. The Improved Model
Comparisons between the GPT3- and the radiosonde-derived (as a true value) at the four radiosondes in Anqing, Sheyang, Fuyang and Nanjing from 2016 to 2019 are shown in Figure 5. It can be seen that the show obvious seasonal periodic changes and the overall change trends of the two types are similar, which are lower in spring and winter and higher in summer and autumn.
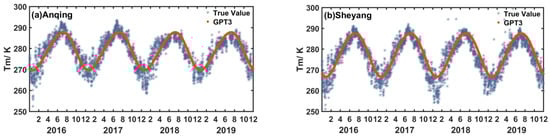
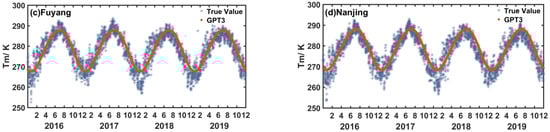
Figure 5.
Variations of the GPT3-Tm in Anqing (a), Sheyang (b), Fuyang (c), and Nanjing (d) during the 2016–2019 period.
3.2.1. The Establishment of an Improved Model
Based on the analysis of GPT3-, the deviations of GPT3- from seven radiosondes in the Yangtze River Delta region from 2016 to 2018 are substituted into Equation (7), and the coefficients of third order Fourier function model of GPT3- deviations can be obtained as shown in Table 3.
Table 3.
Fourier coefficients of the GPT3- bias in the Yangtze River Delta region during the 2016–2018 period.
The bias distribution of GPT3- of the seven radiosondes is shown in Figure 6. It can be seen that the deviations of nearly all radiosondes are maintained within 10 K, but the deviation distribution is relatively discrete and exhibits obvious periodicity. A fitted curve has also been shown in the figure. It can describe the deviations distribution of GPT3- well.
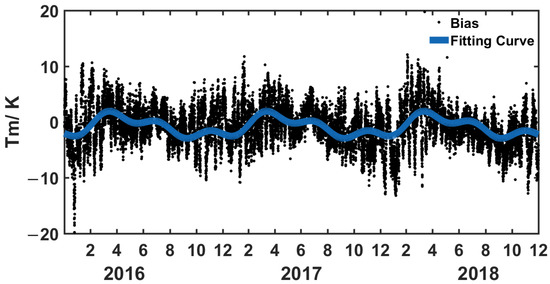
Figure 6.
The bias and fitting curve of the GPT3- in the Yangtze River Delta region during the 2016–2018 period.
3.2.2. Precision Analysis
The improved model established in the previous section can be used to predict the at seven radiosonde stations from 2016 to 2019. Furthermore, the article analyzed the precision of the improved model using the radiosonde-derived as true value, and verified the weakening effect of the seasonal periodic deviation of GPT3- in Figure 7. It is clearly shown that the improved- and GPT3- are generally similar, and their deviations are both within 10 K compared to the radiosonde-derived . However, the deviations of improved- are more concentrated, indicating that the improvement effect is more obvious.
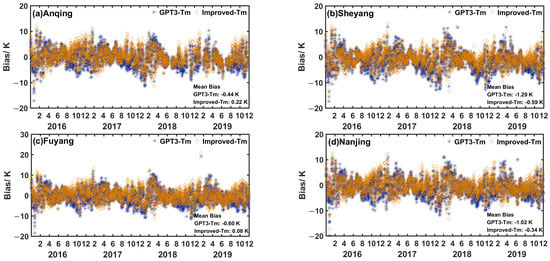
Figure 7.
The bias of GPT3- and improved- in Anqing (a), Sheyang (b), Fuyang (c) and Nanjing (d) during the 2016–2019 period.
Table 4 is the precision statistics of the improved- and the GPT3- from 2016 to 2019. It can be seen that the mean Bias and RMS of improved- are −0.6 K and 2.7 K in 2019, respectively, which are improved by 0.8 K and 0.4 K, respectively, compared to that of GPT3-. Although the improvement of RMS is small, the bias of each station decreases steadily. Therefore, the improved model in the paper has a higher and more stable precision than the GPT3 model in the Yangtze River Delta region.
Table 4.
Precision of the GPT3- and the improved- in the Yangtze River Delta during the 2016–2019 period (K).
3.3. The PWV Based on Improved ZHD and Models
The time series variation of GPT3-PWV and GNSS-PWV in Anqing (a), Bengbu (b), Lishui (c), and Lianyungang (d) during the 2016–2020 period is shown in Figure 8. Both GPT3-PWV and GNSS-PWV have obvious seasonal periodic changes, due to the influence of the subtropical monsoon in the Yangtze River Delta region, where rain and heat are in the same period, so the PWV is lower in spring and winter and higher in summer and autumn.
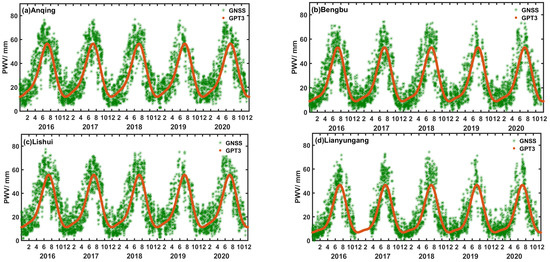
Figure 8.
Time series variation of GPT3-PWV and GNSS-PWV in Anqing (a), Bengbu (b), Lishui (c), and Lianyungang (d) during 2016–2020.
GNSS-ZTD, improved-ZHD, and improved- can be used integrated to calculate the improved-PWV at seven GNSS stations in the Yangtze River Delta region from 2016 to 2020 in the paper, the precision improvement of improved-PWV calculated as follows.
where, and come from the improved and ZHD models based on Fourier functions in Section 3.1 and Section 3.2. are obtained from GNSS, other parameters are the same as Equation (2).
The bias of GPT3-PWV and improved-PWV in Anqing (a), Bengbu (b), Lishui (c) and Lianyungang (d) during the 2016–2020 period is shown in Figure 9. The improved-PWV has greatly eliminated the seasonal periodic deviation of GPT3-PWV, indicating that the differences between the improved-PWV and GNSS-PWV are small and are highly consistent with each other.
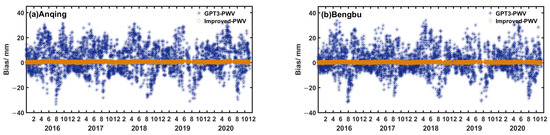
Figure 9.
The bias of GPT3-PWV and improved-PWV in Anqing (a), Bengbu (b), Lishui (c), and Lianyungang (d) during the 2016–2020 period.
The precision statistics of GPT3-PWV and improved-PWV are shown in Table 5. It can be seen that the mean Bias and RMS of improved-PWV are 0.5 mm and 0.6 mm, respectively, which are 2.2 mm and 10.5 mm higher than that of GPT3-PWV, and the precision of GPT3-PWV is greatly improved. The precision of improved-PWV is very close to that of GNSS-PWV, and it can be used for real-time high-precision inversion of PWV in the Yangtze River Delta region.
Table 5.
Precision of GPT3-PWV and improved-PWV in the Yangtze River Delta during 2016–2020 (mm).
In order to further verify the inversion precision of improved-PWV, Anqing and Shanghai that have co-located radiosondes and GNSS stations are selected to compare improved-PWV and GNSS-PWV with radiosonde-derived PWV from 2016 to 2019. The bias of GNSS-PWV and improved-PWV is shown in Figure 10. The vacancy in the Figure 10b is caused by the lack of radiosonde and GNSS data after March 2019 in Shanghai station.
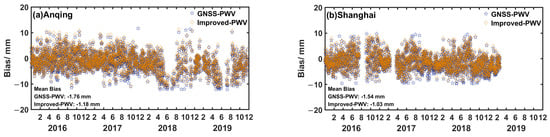
Figure 10.
The bias of GNSS-PWV and improved-PWV in Anqing (a) and Shanghai (b) during the 2016–2019 period.
The deviation distribution of the improved-PWV and GNSS-PWV is in good agreement, and most deviations of the PWV are kept within 10 mm, indicating that the precision of the improved-PWV and GNSS-PWV are equivalent.
Table 6 shows the precision statistics of improved-PWV and GNSS-PWV. Compared with the radiosonde-derived PWV, the mean Bias and RMS of the improved-PWV are −1.1 mm and 3.7 mm, respectively, which are 0.5 mm and 0.3 mm better than that of the GNSS-PWV, and the precision is slightly improved. It can be seen that the precision of PWV based on improved ZHD and models is slightly better than that of GNSS-PWV, and they are roughly equivalent on the whole, which is further verified and demonstrated that the improved ZHD and models can be used to obtain real-time high-precision PWV comparable to the GNSS-PWV precision.
Table 6.
Precision of the GNSS-PWV and the improved-PWV at the co-located GNSS and radiosonde stations in Anqing and Shanghai during the 2016–2019 period (mm).
4. Conclusions
The precision of the GPT3 model (ZHD, and PWV) in the Yangtze River Delta region was first analyzed with reference to GNSS and radiosondes products. Aiming at the problem that the ZHD and from GPT3 model have obvious seasonal periodic deviations, the third-order Fourier function was used to establish improved ZHD and models, and their precision were analyzed and verified. The main research conclusions are as follows.
The mean biases of the GPT3-ZHD, and PWV are −0.5 mm, −0.8 K, and 2.7 mm, respectively, and the mean RMS of those are 2.1 mm, 3.2 K, and 11.1 mm, respectively. Compared to the reference values of the GNSS products and radiosondes, the ZHD and PWV deviations have obvious seasonal variations. Specifically, the deviation of ZHD is negative in spring and winter, but positive in summer and autumn, and the deviation of PWV is smaller in spring and winter, but larger in summer and autumn.
Compare with the GPT3 model, the mean Bias and RMS of the improved-ZHD based on Fourier function from 2019 to 2020 are −0.1 mm and 0.5 mm, respectively, improved by 0.7 mm and 1.6 mm, while the mean Bias and RMS of the improved- in 2019 are −0.6 K and 2.7 K, respectively, which are 0.8 K and 0.5 K better than GPT3-. The precision of two models is improved slightly.
The mean Bias and RMS of the improved-PWV based on GNSS-ZTD and the improved ZHD and models are 0.5 mm and 0.6 mm, respectively, which are 2.2 mm and 10.5 mm better than that of GPT3-PWV, and the overall precision is improved greatly. Compared to the radiosonde-derived PWV, the mean Bias and RMS are −1.1 mm and 3.7 mm, respectively, which are 0.5 mm and 0.3 mm higher than that of the GNSS-PWV, and the precision of the two methods performs similarly. Therefore, the improved ZHD and models based on GPT3 and Fourier function established in the Yangtze River Delta region can be used for real-time high-precision PWV inversion.
Author Contributions
Conceptualization, L.L. and Y.G.; methodology, L.L.; software, S.X.; validation, S.X. and H.L.; formal analysis, Q.H.; investigation, Y.G.; resources, L.L.; data curation, S.X. and H.L.; writing—original draft preparation, L.L. and Y.G.; writing—review and editing, L.L. and Q.H.; visualization, Q.H. and H.Y.; supervision, L.L. and H.Y.; project administration, L.L. and H.Y.; funding acquisition, L.L. All authors have read and agreed to the published version of the manuscript.
Funding
This research was supported in part by the Strategic Priority Research Program of the Chinese Academy of Sciences (CAS) under Grant XDA17010304, the China Natural Science Funds under Grant 41904033, the CAS Pioneer Hundred Talents Program, the Natural Science Foundation of Hunan Province under Grant 2016JJ3061.
Institutional Review Board Statement
Not applicable.
Informed Consent Statement
Not applicable.
Data Availability Statement
Not applicable.
Acknowledgments
The authors would like to express their sincere gratitude to the University of Wyoming and Jiangsu Institute of Meteorological Sciences for the provision of radiosonde and GNSS observations. We also thank the reviewers for their constructive comments and suggestions, which resulted in a significant improvement in the quality of the paper.
Conflicts of Interest
The authors declare no conflict of interest.
References
- Baker, H.C.; Dodson, A.H.; Penna, N.T.; Higgins, M.; Offiler, D. Ground-based GPS water vapour estimation: Potential for meteorological forecasting. J. Atmos. Sol. Terr. Phys. 2001, 63, 1305–1314. [Google Scholar] [CrossRef]
- Iwabuchi, T.; Rocken, C.; Lukes, Z.; Mervart, L.; Johnson, J.; Kanzaki, M. PPP and Network True Real-time 30 sec Estimation of ZTD in Dense and Giant Regional GPS Network and the Application of ZTD for Nowcasting of Heavy Rainfall. In Proceedings of the ION GNSS 19th International Technical Meeting of the Satellite Division, Fort Worth, TX, USA, 26–29 September 2006; pp. 1902–1909. [Google Scholar]
- Li, L.; Kuang, C.-L.; Zhu, J.-J.; Chen, W.; Chen, Y.-Q.; Long, S.-C.; Li, H.-Y. Rainstorm nowcasting based on GPS real-time precise point positioning technology. Chin. J. Geophys. 2012, 55, 1129–1136. [Google Scholar]
- Li, H.; Wang, X.; Wu, S.; Zhang, K.; Chen, X.; Qiu, C.; Zhang, S.; Zhang, J.; Xie, M.; Li, L. Development of an Improved Model for Prediction of Short-Term Heavy Precipitation Based on GNSS-Derived PWV. Remote Sens. 2020, 12, 4101. [Google Scholar] [CrossRef]
- Bianchi, C.E.; Mendoza, L.P.O.; Fernández, L.I.; Natali, M.P.; Meza, A.M.; Moirano, J.F. Multi-year GNSS monitoring of atmospheric IWV over Central and South America for climate studies. Ann. Geophys. 2016, 34, 623–639. [Google Scholar] [CrossRef]
- Kruczyk, M. Long Series of GNSS Integrated Precipitable Water as a Climate Change Indicator. Rep. Geod. Geoinform. 2015, 99, 1–18. [Google Scholar] [CrossRef]
- Wang, B.; Zhao, L.; Bai, X. The Characteristics Investigation of Ground-Based GPS/PWV During the “7.21” Extreme Rainfall Event in Beijing. In China Satellite Navigation Conference (CSNC) 2015 Proceedings: Volume II; Sun, J., Liu, J., Fan, S., Lu, X., Eds.; Lecture Notes in Electrical Engineering; Springer: Berlin/Heidelberg, Germany, 2015; Volume 341, pp. 563–574. [Google Scholar]
- Simeonov, T.; Sidorov, D.; Teferle, F.N.; Milev, G.; Guerova, G. Evaluation of IWV from the numerical weather prediction WRF model with PPP GNSS processing for Bulgaria. Atmos. Meas. Tech. Discuss. 2016, 1–15. [Google Scholar] [CrossRef]
- Li, H.; Wang, X.; Choy, S.; Wu, S.; Jiang, C.; Zhang, J.; Qiu, C.; Li, L.; Zhang, K. A New Cumulative Anomaly-based Model for the Detection of Heavy Precipitation Using GNSS-derived Tropospheric Products. IEEE Trans. Geosci. Remote Sens. 2021, 60, 4105718. [Google Scholar] [CrossRef]
- Li, H.; Wang, X.; Choy, S.; Jiang, C.; Wu, S.; Zhang, J.; Qiu, C.; Zhou, K.; Li, L.; Fu, E.; et al. Detecting heavy rainfall using anomaly-based percentile thresholds of predictors derived from GNSS-PWV. Atmos. Res. 2022, 265, 105912. [Google Scholar] [CrossRef]
- Benevides, P.; Catalao, J.; Miranda, P.M.A. On the inclusion of GPS precipitable water vapour in the nowcasting of rainfall. Nat. Hazards Earth Syst. Sci. 2015, 15, 2605–2616. [Google Scholar] [CrossRef]
- Jiang, P.; Ye, S.; Chen, D.; Liu, Y.; Xia, P. Retrieving Precipitable Water Vapor Data Using GPS Zenith Delays and Global Reanalysis Data in China. Remote Sens. 2016, 8, 389. [Google Scholar] [CrossRef]
- Wang, H.; He, J.; Wei, M.; Zhang, Z. Synthesis Analysis of One Severe Convection Precipitation Event in Jiangsu Using Ground-Based GPS Technology. Atmosphere 2015, 6, 908–927. [Google Scholar] [CrossRef]
- Song, D.-S.; Grejner-Brzezinska, D.A. Remote sensing of atmospheric water vapor variation from GPS measurements during a severe weather event. Earth Planets Space 2009, 61, 1117–1125. [Google Scholar] [CrossRef]
- Manning, T.; Zhang, K.; Rohm, W.; Choy, S.; Hurter, F. Detecting Severe Weather using GPS Tomography: An Australian Case Study. J. Glob. Position. Syst. 2012, 11, 58–70. [Google Scholar] [CrossRef]
- Zhang, K.; Manning, T.; Wu, S.; Rohm, W.; Silcock, D.; Choy, S. Capturing the Signature of Severe Weather Events in Australia Using GPS Measurements. IEEE J. Sel. Top. Appl. Earth Obs. Remote Sens. 2015, 8, 1839–1847. [Google Scholar] [CrossRef]
- Huang, L.; Zhu, G.; Liu, L.; Chen, H.; Jiang, W. A global grid model for the correction of the vertical zenith total delay based on a sliding window algorithm. GPS Solut. 2021, 25, 98. [Google Scholar] [CrossRef]
- Huang, L.; Peng, H.; Liu, L.; Xiong, S.; Xie, S.; Chen, J.; Li, J.; He, H. GNSS Precipitable Water Vapor Retrieval with the Aid of NWM Data for China. Earth Space Sci. 2021, 8, e2020EA001550. [Google Scholar] [CrossRef]
- Wang, X.; Zhang, K.; Wu, S.; Fan, S.; Cheng, Y. Water vapor-weighted mean temperature and its impact on the determination of precipitable water vapor and its linear trend. J. Geophys. Res. Atmos. 2016, 121, 833–852. [Google Scholar] [CrossRef]
- Li, L.; Wu, S.; Zhang, K.; Wang, X.; Li, W.; Shen, Z.; Zhu, D.; He, Q.; Wan, M. A new zenith hydrostatic delay model for real-time retrievals of GNSS-PWV. Atmos. Meas. Tech. 2021, 14, 6379–6394. [Google Scholar] [CrossRef]
- Saastamoinen, J. Contributions to the theory of atmospheric refraction. Bull. Géodésique 1972, 105, 279–298. [Google Scholar] [CrossRef]
- Hopfield, H.S. Tropospheric Effect on Electromagnetically Measured Range: Prediction from Surface Weather Data. Radio Sci. 1971, 6, 357–367. [Google Scholar] [CrossRef]
- Black, H.D.; Eisner, A. Correcting satellite Doppler data for tropospheric effects. J. Geophys. Res. Atmos. 1984, 89, 2616–2626. [Google Scholar] [CrossRef]
- Leandro, R.F.; Langley, R.B.; Santos, M.C. UNB3m_pack: A neutral atmosphere delay package for radiometric space techniques. GPS Solut. 2008, 12, 65–70. [Google Scholar] [CrossRef]
- Boehm, J.; Heinkelmann, R.; Schuh, H. Short Note: A global model of pressure and temperature for geodetic applications. J. Geod. 2007, 81, 679–683. [Google Scholar] [CrossRef]
- Böhm, J.; Möller, G.; Schindelegger, M.; Pain, G.; Weber, R. Development of an improved empirical model for slant delays in the troposphere (GPT2w). GPS Solut. 2015, 19, 433–441. [Google Scholar] [CrossRef]
- Daniel, L.; Johannes, B. VMF3/GPT3: Refined discrete and empirical troposphere mapping functions. J. Geod. 2018, 92, 349–360. [Google Scholar]
- Lagler, K.; Schindelegger, M.; Böhm, J.; Krásná, H.; Nilsson, T. GPT2: Empirical slant delay model for radio space geodetic techniques. Geophys. Res. Lett. 2013, 40, 1069–1073. [Google Scholar] [CrossRef]
- Wang, X.; Zhang, K.; Wu, S.; He, C.; Cheng, Y.; Li, X. Determination of zenith hydrostatic delay and its impact on GNSS-derived integrated water vapor. Atmos. Meas. Tech. 2017, 10, 2807–2820. [Google Scholar] [CrossRef]
- Zhang, W.; Zhang, H.; Liang, H.; Lou, Y.; Cai, Y.; Cao, Y.; Zhou, Y.; Liu, W. On the suitability of ERA5 in hourly GPS precipitable water vapor retrieval over China. J. Geod. 2019, 93, 1897–1909. [Google Scholar] [CrossRef]
- Ghaffari Razin, M.-R.; Voosoghi, B. Modeling of precipitable water vapor from GPS observations using machine learning and tomography methods. Adv. Space Res. 2022, 69, 2671–2681. [Google Scholar] [CrossRef]
- Singh, D.; Ghosh, J.; Kashyap, D. Development of a site-specific ZHD model using radiosonde data. Acta Geod. Geophys. Hung. 2012, 47, 90–100. [Google Scholar] [CrossRef]
- Yang, F.; Meng, X.; Guo, J.; Shi, J.; An, X.; He, Q.; Zhou, L. The Influence of Different Modelling Factors on Global Temperature and Pressure Models and Their Performance in Different Zenith Hydrostatic Delay (ZHD) Models. Remote Sens. 2019, 12, 35. [Google Scholar] [CrossRef]
- Mateus, P.; Catalão, J.; Mendes, V.B.; Nico, G. An ERA5-Based Hourly Global Pressure and Temperature (HGPT) Model. Remote Sens. 2020, 12, 1098. [Google Scholar] [CrossRef]
- Bevis, M.; Businger, S.; Chiswell, S.; Herring, T.A.; Anthes, R.A.; Rocken, C.; Ware, R.H. GPS meteorology: Mapping zenith wet delays onto precipitable water. J. Appl. Meteorol. 1994, 33, 379–386. [Google Scholar] [CrossRef]
- Hagemann, S.; Bengtsson, L.; Gendt, G. On the determination of atmospheric water vapor from GPS measurements. J. Geophys. Res. Atmos. 2003, 108, 4678. [Google Scholar] [CrossRef]
- Huang, L.; Peng, H.; Liu, L.; Li, C.; Kang, C.; Xie, S. An empirical atmospheric weighted mean temperature model considering the lapse rate function for China. Acta Geod. Cartogr. Sin. 2020, 49, 432–442. [Google Scholar] [CrossRef]
- Bevis, M.; Businger, S.; Herring, T.A.; Rocken, C.; Anthes, R.A.; Ware, R.H. GPS meteorology: Remote sensing of atmospheric water vapor using the global positioning system. J. Geophys. Res. Atmos. 1992, 97, 15787–15801. [Google Scholar]
- Lan, Z.; Zhang, B.; Geng, Y. Establishment and analysis of global gridded Tm − Ts relationship model. Geod. Geodyn. 2016, 7, 101–102. [Google Scholar] [CrossRef]
- Mircheva, B.R. Terrestrial Water Storage Anomaly during the 2007 Heat Wave in Bulgaria. Master’s Thesis, Sofia University, Palo Alto, CA, USA, April 2016. [Google Scholar]
- Basili, P.; Bonafoni, S.; Ferrara, R.; Ciotti, P.; Fionda, E.; Arnbrosini, R. Atmospheric water vapor retrieval by means of both a GPS network and a microwave radiometer during an experimental campaign in Cagliari, Italy, in 1999. IEEE Trans. Geosci. Remote Sens. 2001, 39, 2436–2443. [Google Scholar] [CrossRef]
- Jiang, P.; Ye, S.R.; Liu, Y.Y.; Zhang, J.J.; Xia, P.F. Near real-time water vapor tomography using ground-based GPS and meteorological data: Long-term experiment in Hong Kong. Ann. Geophys. 2014, 32, 911–923. [Google Scholar] [CrossRef]
- Song, D.-S.; Boutiouta, S. Determination of Algerian Weighted Mean Temperature Model for forthcoming GNSS Meteorology Application in Algeria. J. Korean Soc. Surv. Geod. Photogramm. Cartogr. 2012, 30, 615–622. [Google Scholar] [CrossRef]
- Isioye, O.A.; Combrinck, L.; Botai, J. Modelling weighted mean temperature in the West African region: Implications for GNSS meteorology. Meteorol. Appl. 2016, 23, 614–632. [Google Scholar] [CrossRef]
- Liu, Y.; Chen, Y.; Liu, J. Determination of weighted mean tropospheric temperature using ground meteorological measurements. Geo-Spat. Inf. Sci. 2001, 4, 14–18. [Google Scholar] [CrossRef]
- Singh, D.; Ghosh, J.K.; Kashyap, D. Weighted mean temperature model for extra tropical region of India. J. Atmos. Sol.-Terr. Phys. 2014, 107, 48–53. [Google Scholar] [CrossRef]
- Elhaty, N.M.; Abdelfatah, M.A.; Mousa, A.E.; El-Fiky, G.S. GNSS meteorology in Egypt: Modeling weighted mean temperature from radiosonde data. Alex. Eng. J. 2019, 58, 443–450. [Google Scholar] [CrossRef]
- Li, J.; Mao, J. The approach to remote sensing of water vapor based on GPS and linear regression Tm in eastern region of China. J. Meteorol. Res. 1998, 12, 450–458. [Google Scholar]
- Yu, S.; Liu, L. Validation and Analysis of the Water-Vapor-Weighted Mean Temperature from Tm-Ts Relationship. Geomat. Inf. Sci. Wuhan Univ. 2009, 34, 741–744. [Google Scholar]
- Wang, Y.; Liu, L.; Hao, X.; Xiao, J.; Wang, H.; Xu, H. The application study of the GPS meteorology network in Wuhan region. Acta Geod. Cartogr. Sin. 2007, 36, 142–145. [Google Scholar]
- Guo, B.; Li, L.; Xie, W. Modelling of weighted mean temperature using radiosonde data in Yangtze River Delta region. J. Navig. Position. 2019, 7, 61–67. [Google Scholar]
- Gong, S. The Spatial and Temporal Variations of Weighted Mean Atmospheric Temperature and Its Models in China. J. Appl. Meteorol. Sci. 2013, 24, 332–334. [Google Scholar]
- Wang, X.; Song, L.; Dai, Z.; Cao, Y. Feature analysis of weighted mean temperature Tm in Hong Kong. J. Nanjing Univ. Inf. Sci. 2011, 3, 47–52. [Google Scholar]
- Yao, Y.; Zhang, B.; Xu, C.; Yan, F. Improved one/multi-parameter models that consider seasonal and geographic variations for estimating weighted mean temperature in ground-based GPS meteorology. J. Geod. 2013, 88, 273–282. [Google Scholar] [CrossRef]
- Yao, Y.; Liu, J.; Zhang, B.; He, C. Nonlinear Relationships Between the Surface Temperature and the Weighted Mean Temperature. Geomat. Inf. Sci. Wuhan Univ. 2015, 40, 112–116. [Google Scholar]
- Zhu, H.; Chen, K.; Huang, G. A Weighted Mean Temperature Model with Nonlinear Elevation Correction Using China as an Example. Remote Sens. 2021, 13, 3887. [Google Scholar] [CrossRef]
- Ma, Y.; Chen, P.; Liu, T.; Xu, G.; Lu, Z. Development and Assessment of an ALLSSA-Based Atmospheric Weighted Mean Temperature Model with High Time Resolution for GNSS Precipitable Water Retrieval. Earth Space Sci. 2022, 9, e2021EA002089. [Google Scholar] [CrossRef]
- Feng, P.; Li, F.; Yan, J.; Zhang, F.; JeanPierre, B. Assessment of the Accuracy of the Saastamoinen Model and VMF1/VMF3 Mapping Functions with Respect to Ray-Tracing from Radiosonde Data in the Framework of GNSS Meteorology. Remote Sens. 2020, 12, 3337. [Google Scholar] [CrossRef]
- Yang, F.; Guo, J.; Zhang, C.; Li, Y.; Li, J. A Regional Zenith Tropospheric Delay (ZTD) Model Based on GPT3 and ANN. Remote Sens. 2021, 13, 838. [Google Scholar] [CrossRef]
- Ding, J.; Chen, J. Assessment of Empirical Troposphere Model GPT3 Based on NGL’s Global Troposphere Products. Sensors 2020, 20, 3631. [Google Scholar] [CrossRef]
- Li, S.; Xu, T.; Xu, Y.; Jiang, N.; Bastos, L. Forecasting GNSS Zenith Troposphere Delay by Improving GPT3 Model with Machine Learning in Antarctica. Atmosphere 2022, 13, 78. [Google Scholar] [CrossRef]
- Yu, J.; Tan, K.; Zhang, C.; Zhao, B.; Wang, D.; Li, Q. Present-day crustal movement of the Chinese mainland based on Global Navigation Satellite System data from 1998 to 2018. Adv. Space Res. 2019, 63, 840–856. [Google Scholar] [CrossRef]
- Li, L.; Yuan, L.; Qimin, H.; Xiaoming, W. Weighted Mean Temperature Modelling Using Regional Radiosonde Observations for the Yangtze River Delta Region in China. Remote Sens. 2022, 14, 1909. [Google Scholar] [CrossRef]
- Wang, K.; Khodabandeh, A.; Teunissen, P.J.G. MSE-impact of PPP-RTK ZTD estimation strategies. Adv. Space Res. 2018, 61, 2955–2971. [Google Scholar] [CrossRef]
- Salcedo, A.C.; Recio, J.B. Fourier analysis of meteorological data to obtain a typical annual time function. Sol. Energy 1984, 32, 479–488. [Google Scholar] [CrossRef]
- Askne, J.; Nordius, H. Estimation of tropospheric delay for microwaves from surface weather data. Radio Sci. 1987, 22, 379–386. [Google Scholar] [CrossRef]


Publisher’s Note: MDPI stays neutral with regard to jurisdictional claims in published maps and institutional affiliations. |
© 2022 by the authors. Licensee MDPI, Basel, Switzerland. This article is an open access article distributed under the terms and conditions of the Creative Commons Attribution (CC BY) license (https://creativecommons.org/licenses/by/4.0/).