Article

Spatiotemporal Characteristics and Influencing Factors of Sunshine Duration in China from 1970 to 2019

1
School of Electrical & Information Engineering, Anhui University of Science and Technology, Huainan 232001, China
2
Advanced Laser Technology Laboratory of AnHui Province, Hefei 230031, China
3
School of Internet, Anhui University, Hefei 230039, China
*
Author to whom correspondence should be addressed.
Atmosphere 2022, 13(12), 2015; https://doi.org/10.3390/atmos13122015
Submission received: 26 October 2022 / Revised: 28 November 2022 / Accepted: 28 November 2022 / Published: 30 November 2022

Abstract

:
In order to alleviate global warming and the energy crisis, it is of great significance to develop and utilize solar energy resources. Sunshine duration (SD) is considered to be the best substitute for solar radiation and a key factor in evaluating solar energy resources. Therefore, the spatial and temporal characteristics of SD and the reasons for its changes have received extensive attention and discussion. Based on the data of 415 meteorological stations from 1970 to 2019, this paper uses linear trend analysis, Mann–Kendall mutation analysis, the Hurst index, empirical orthogonal decomposition, correlation analysis and partial correlation analysis to analyze the spatiotemporal characteristics of SD and its relationship with influencing factors. The results show that the annual SD in China shows a downward trend, with a climate trend rate of −37.93 h/10a, and a significant decline from 1982 to 2019. The seasonal SD shows a downward trend, and the downward trend is most obvious in summer. The annual and seasonal SD will still show a downward trend in the future. The spatial distribution of SD not only has an overall consistent distribution but also takes the Yellow River from Ningxia to Shandong as the boundary, showing a north–south opposite distribution. Annual SD has a significant positive correlation, a significant negative correlation, a positive correlation and a negative correlation with wind speed, precipitation, temperature and relative humidity, respectively, and it is most closely related to wind speed and precipitation. In addition, the change in SD may also be related to human activities.

1. Introduction

In recent years, under the background of the global energy shortage and climate warming, the development and utilization of renewable energy represented by photovoltaic power generation has received extensive attention [1,2,3]. Photovoltaic power generation is considered to be one of the most effective ways to alleviate the energy shortage and climate warming [4,5,6]. Solar radiation is the main driving factor of human production and life, plant photosynthesis and evapotranspiration, and it is also the main influencing factor of photovoltaic power generation [7,8]. However, due to the high cost of using and maintaining radiation-measuring instruments, the current research on solar radiation mainly uses models such as empirical [9] and machine learning [10] models for estimation and analysis. In addition, due to the updating of measuring equipment in 1990 and the termination of some stations, radiation stations in China are unevenly distributed and sparse and have a short time span, making long-term solar radiation data lacking or unavailable in most areas [11]. Therefore, it is difficult to accurately study the long-term variation characteristics of solar radiation in China by only relying on the radiation data provided by a small number of national radiation sites and models.
Due to the long observation time, good continuity, high spatial density and high reliability, SD is considered to be the best substitute for solar radiation [12]. It is also an important factor in the formation of the climate, which is closely related to the production and life of human beings and the growth and development of animals and plants [13]. Therefore, studying the temporal and spatial distribution characteristics of SD and its causes has important theoretical significance and reference value for agricultural production, solar resource utilization and global climate change analysis.
In recent decades, many experts at home and abroad have conducted relevant research on the trend of SD and its causes and effects [14,15,16,17,18,19,20,21,22,23,24,25,26,27,28,29,30,31]. From their research, we can see that SD values have generally decreased in many countries and regions (such as Western Europe [14,15,16], the United States [17], Japan [18] and China [19,20,21,22,23]), and some have increased [24]. The reasons for their changes have been analyzed, which may be related to climatic factors [14,15,16,17,18,19,20,21,22,23,24,25], special climatic phenomena [26,27] and human activities [16,28,29]. In addition, Chinese experts also found that SD changes can affect the probability of human disease occurrence [30,31]. Therefore, studying the changing characteristics of SD and its causes is of great significance for understanding climate change and natural disasters as well as human health.
In addition, many experts have conducted related research on SD in China. However, it is only limited to some specific areas of China [20,21,22,23], or, even if the whole area is studied, the time scale of the study is also far away [19], so it cannot better represent the latest climate characteristics of China. Therefore, the purpose of this paper is to use the daily data of 415 meteorological stations to analyze the latest spatiotemporal characteristics of SD in China and to explore the possible reasons that affect its changes. The obtained results can provide references for the development and utilization of solar energy resources, the rational distribution of agricultural production and the study of climate change.

2. Materials and Methods

2.1. Materials

The daily sunshine duration, temperature, relative humidity, precipitation and wind speed (10 m wind speed, observation frequency 10 min/time) data of 415 meteorological observation sites are provided by the Meteorological Data Center of the China Meteorological Administration (http://data.cma.cn/ (accessed on 25 October 2022)). All observation data are subject to strict quality inspection and control, and the missing and abnormal data are eliminated, but some missing data will be replaced by the average value of the same year, the same station and the same month, which makes the accuracy and reliability of the data very high.

2.2. Research Methods

2.2.1. Change Trend and Significance Test

The linear trend method is the most commonly used method to analyze the amplitude change of meteorological parameters in time series. This method uses the least square method to establish a linear regression equation to analyze the multi-year change trend of meteorological elements [32,33]. The slope of the equation represents the change trend, positive values represent the increase trend, negative values represent the decrease trend and being multiplied by 10 represents the climate trend rate. The Mann–Kendall (M–K) mutation test is adopted for the significance of the change trend, which can be used to judge whether or when a climate mutation occurs in the climate series and also to find the mutation point [34]. The advantage is that the sample does not need to conform to a certain distribution and is not affected by a few outliers.

2.2.2. Hurst Index

The Hurst index (H) can be used to determine the persistence or anti-persistence strength of the change trend of the time series [35]. It is calculated based on the rescaled range (R/S) analysis method.
For time series SD(t), t = 1, 2, 3, 4, …, n, for any positive integer t ≥ 1, its mean sequence is:
S D ¯ ( τ ) = 1 τ t = 1 τ S D ( τ ) ( τ = 1 , 2 , , n )
X ( t , τ ) = t = 1 t ( S D ( t ) S D ¯ ( τ ) ) ( 1 t τ )
R ( τ ) = m a x 1 t τ X ( t , τ ) m i n 1 t τ X ( t , τ ) ( τ = 1 , 2 , , n )
S ( τ ) = 1 τ t = 1 τ ( S D ( t ) S D ¯ ( τ ) ) 2 1 2 ( τ = 1 , 2 , , n )
When R ( τ ) / S ( τ ) R / S has the relationship of R / S τ H , this means that the time series SD has a Hurst phenomenon. H is called the Hurst exponent, and its value can be obtained by least square fitting in the double logarithmic coordinate system ( log R / S n = a + H × log n ) [36]. Generally, the H value is divided into three cases. When H = 0.5, there is no correlation between the changes before and after the time series. When 0 < H < 0.50, it indicates that the future change trend of the time series is opposite to the past, that is, the process has anti-persistence—the closer it is to 0, the stronger the anti-persistence. When 0.50 < H < 1.00, it indicates that the future change trend of the time series is consistent with the past, that is, the process is continuous, and the closer it is to 1, the stronger the persistence.

2.2.3. Empirical Orthogonal Function Decomposition

The empirical orthogonal function (EOF) decomposition is an important method to analyze the characteristics of temporal and spatial changes in meteorology [37,38]. It can decompose the variable field to obtain the space function part that does not change with time and the time function part that only changes with time. The main temporal and spatial variation characteristics of the variable field are reflected by those with large variance contribution rates. The space function part is composed of multiple mutually independent and orthogonal space modes, which are also called eigenvectors. The time function part is composed of the projection of the space mode on time, which is represented by the time coefficient. In this study, after using EOF decomposition, the original variable field information is concentrated in the first few modes, and then those spatial modes that pass the North significance test are used for subsequent analysis.

2.2.4. Correlation Analysis and Partial Correlation Analysis

For correlation analysis, the correlation between meteorological elements is analyzed by calculating the Pearson correlation coefficient [39]. Assuming two sets of meteorological elements X1, X2, …, Xn and Y1, Y2, …, Yn, the Formula for calculating the correlation coefficient r is as follows:
r = i = 1 n ( X i X ¯ ) ( Y i X ¯ ) i = 1 n ( X i X ¯ ) 2 i = 1 n ( Y i Y ¯ ) 2 ( i = 1 , 2 , 3 , , n )
where Xi and Yi are the i-th values of meteorological elements X and Y, respectively, and X ¯ and Y ¯ are the average values of meteorological elements X and Y. When r > 0, meteorological factors X and Y are positively correlated; when r < 0, meteorological factors X and Y are negatively correlated.
On the basis of the previous correlation analysis, partial correlation analysis can exclude the mutual interference of other influencing factors and analyze the correlation of meteorological elements [40]. Therefore, in this study, partial correlation analysis was used to explore the effects of temperature, relative humidity, precipitation and wind speed on the SD, respectively. The calculation formula of the partial correlation analysis is as follows:
R X Y , Z = r X Y r X Z r Y Z ( 1 r X Z 2 ) ( 1 r Y Z 2 )
where rXY is the correlation coefficient between X and Y; rXZ is the correlation coefficient between X and Z; rYZ is the correlation coefficient between Y and Z; RXY,Z is the partial correlation coefficient between X and Y under the condition of constant Z and so on.

3. Results

3.1. Temporal Variation Characteristics of Sunshine Duration

3.1.1. Characteristics of Inter-Annual Variation

The inter-annual variation characteristics and mutation test of the annual SD were analyzed using linear trend analysis and the M–K mutation test, respectively. To explore whether the trend of annual and seasonal SD will continue in the future, the Hurst index is used. It can be seen from Figure 1a that, from the perspective of the inter-annual variation trend, the overall annual SD in China has shown a significant downward trend in the past 50 years, with a climate trend rate of −37.93 h/10a, passing the significance test (p < 0.001). Because the slope (H value) of the annual SD fitting is 0.964, which is between 0.5 and 1 and close to 1, therefore, the future trend of the annual SD is consistent with the previous changes, and the trend is strong (Figure 1b). In other words, the annual SD in China will still show a decreasing trend in the future. The annual SD was 2212.7 h in China from 1970 to 2019, the highest was 2406.6 h in 1978 and the lowest was 2095.9 h in 2012. The UF and UB are the positive and reverse sequence curves of each other, but UB is usually selected as the main analysis object. Therefore, it can be seen from Figure 1c that the UF curve is below 0 from 1970 to 2019 and above the p = 0.05 significance level from 1982 to 2019, which indicates that the annual SD shows a decreasing trend from 1970 to 2019 and a significant decreasing trend from 1982 to 2019. In addition, although the curves of UF and UB have multiple intersections around 1985, the intersections are not within the p = 0.05 significance level line (failed to pass the 0.05 significance test), which indicates that, although there is no obvious mutation in the annual SD, there was a suspected mutation point around 1985.

3.1.2. Characteristics of Seasonal Variation

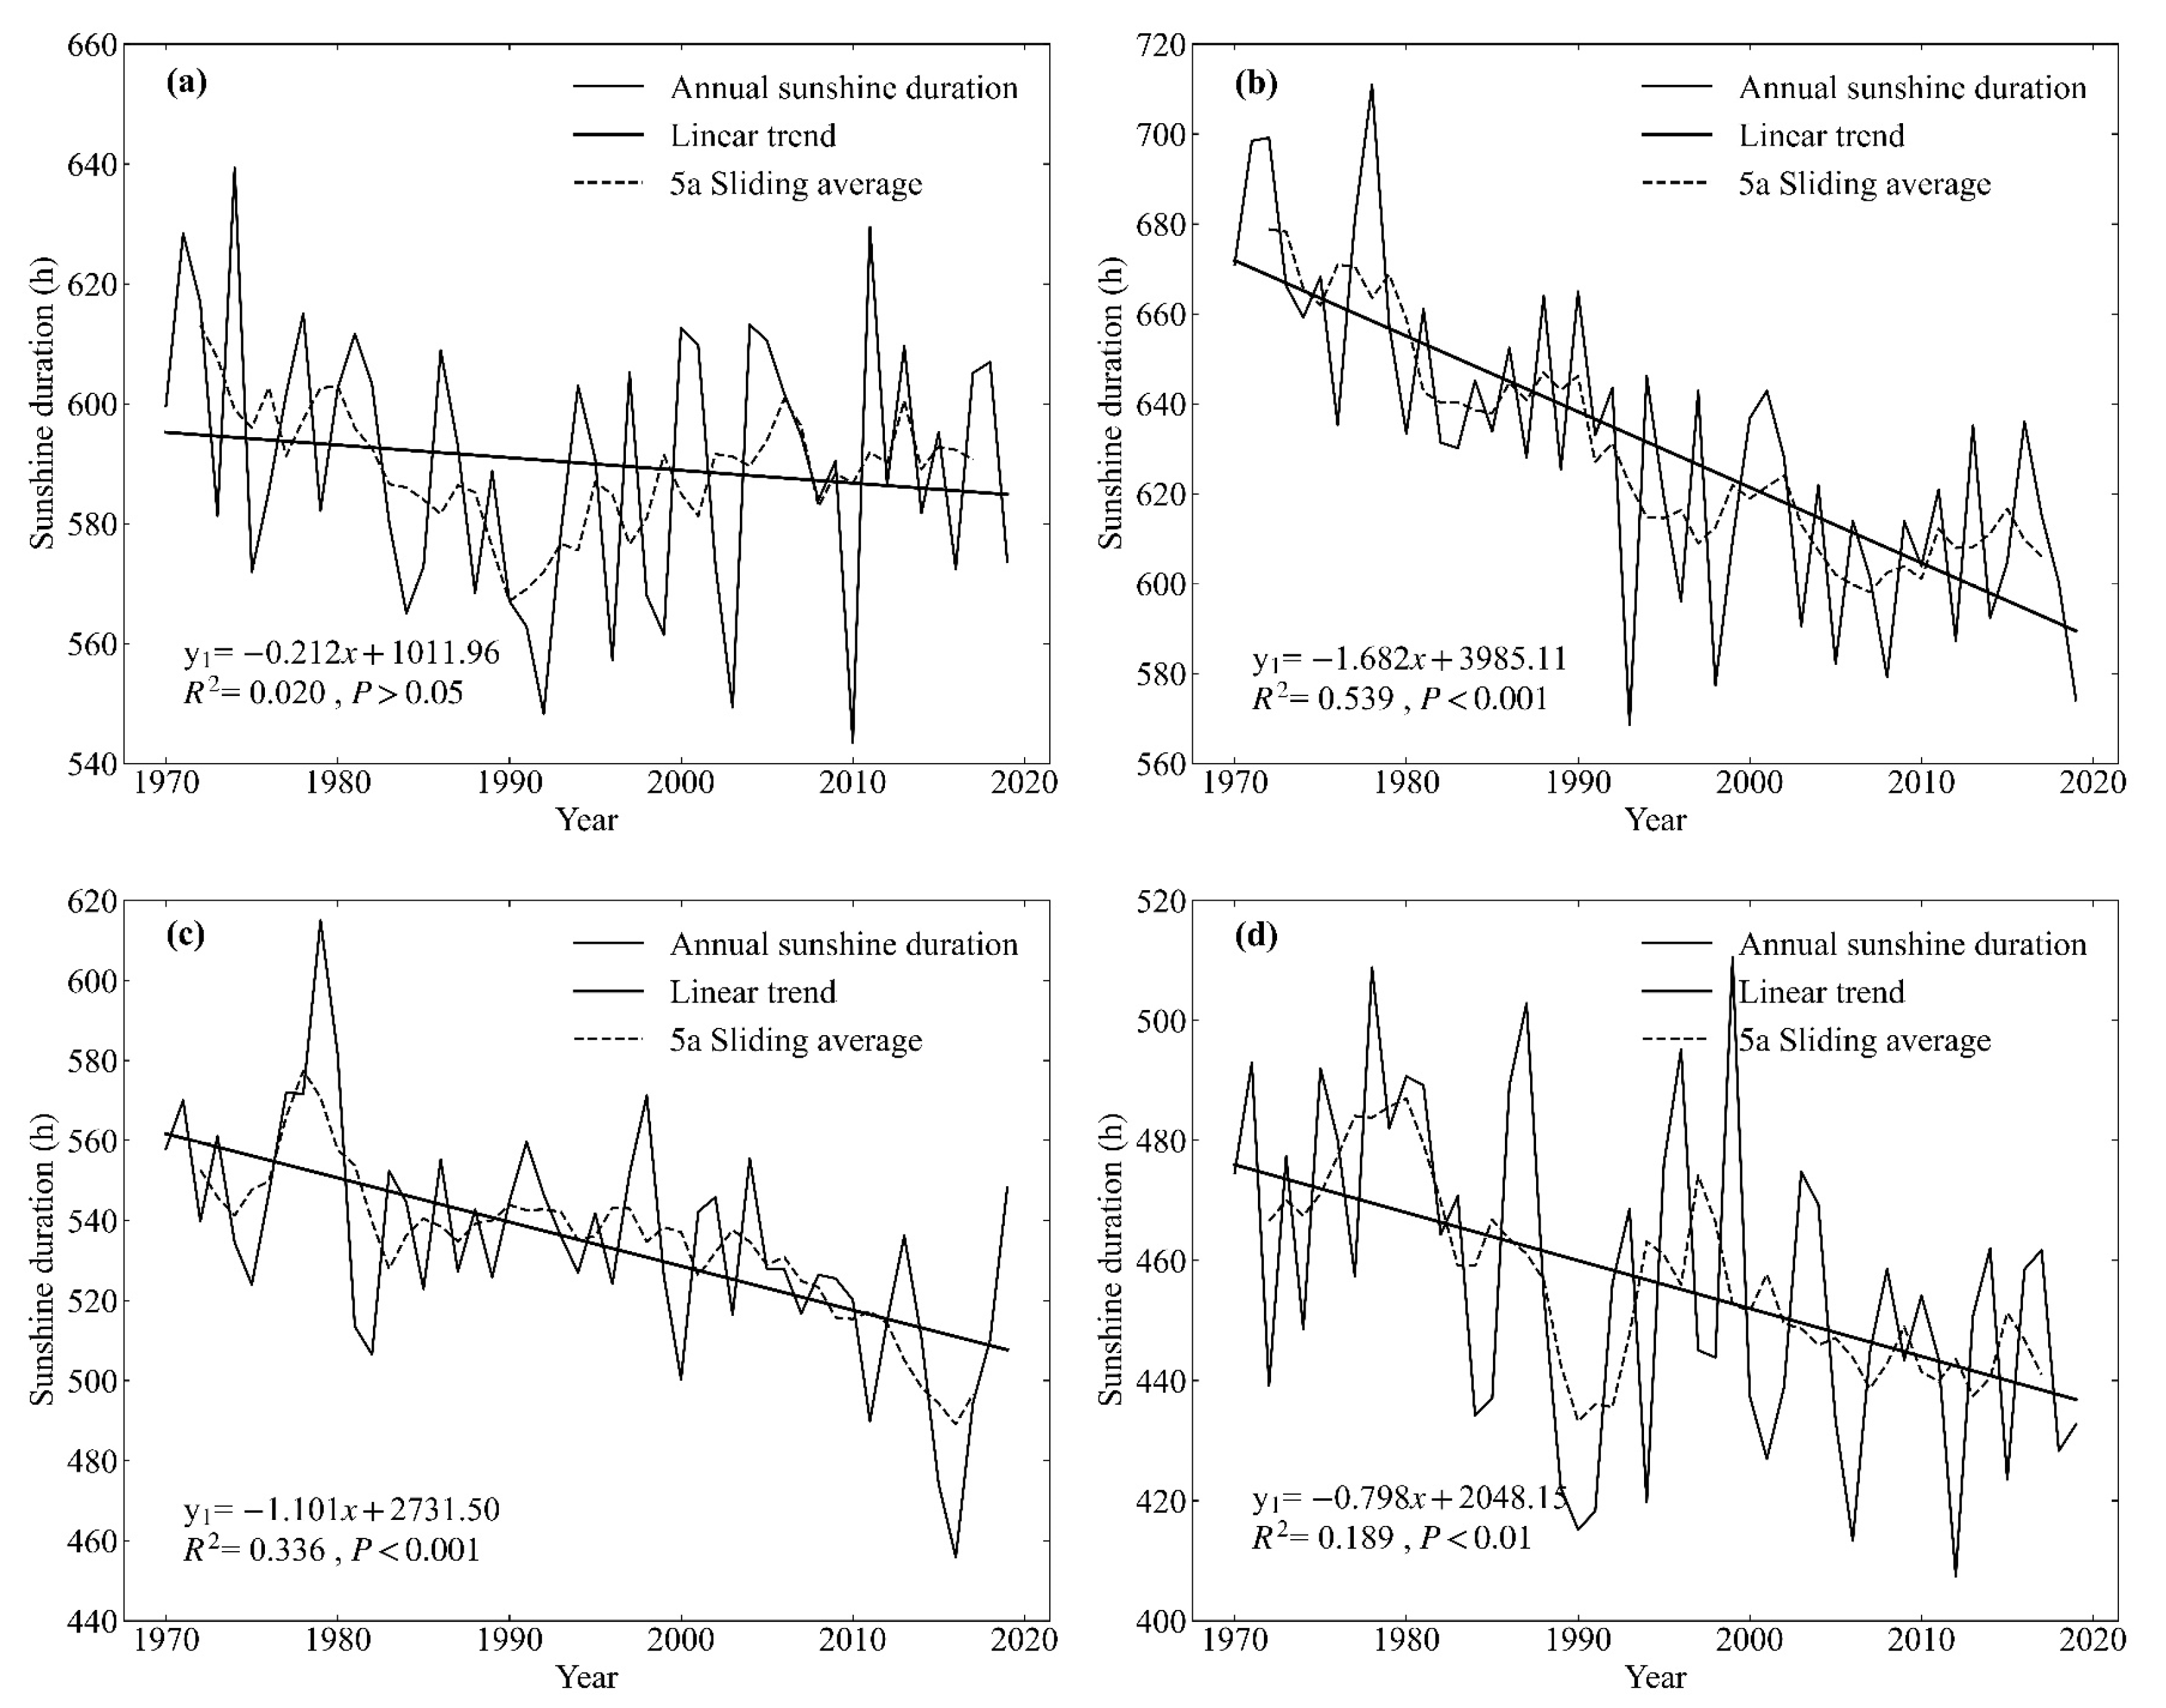
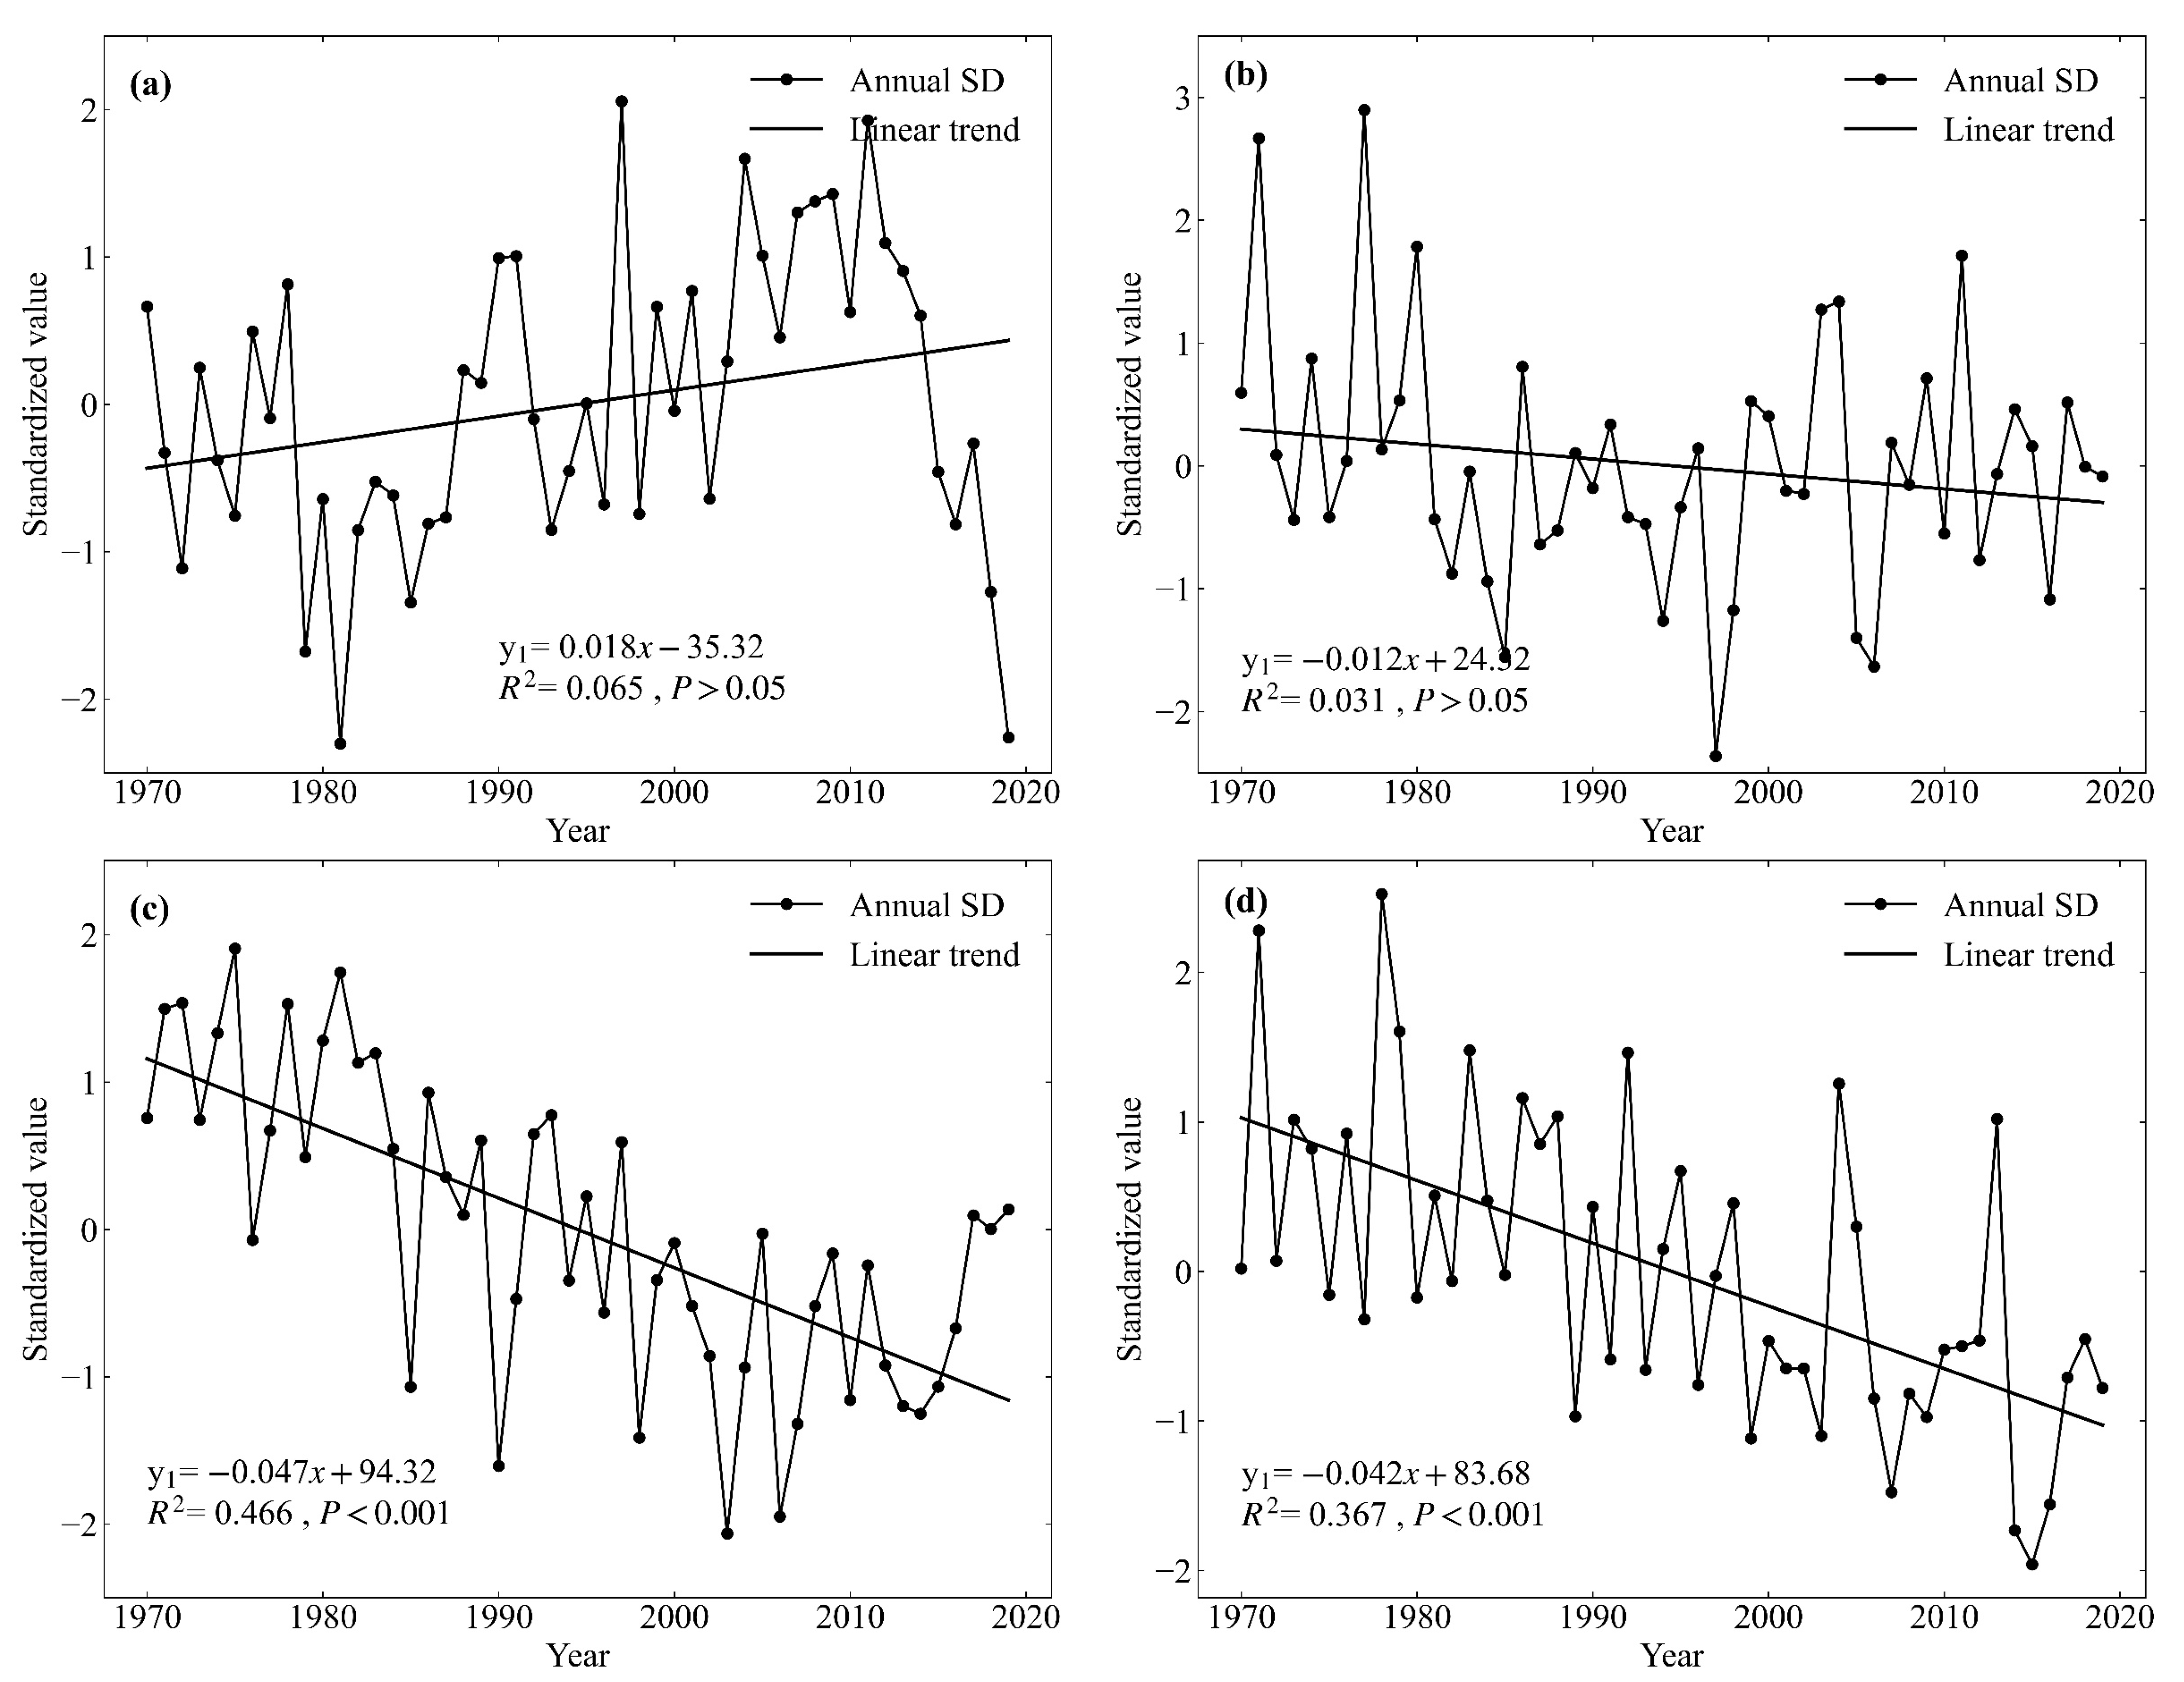
There are obvious seasonal characteristics of SD in China from 1970 to 2019. It can be seen from Figure 2 that the SD in spring, summer, autumn and winter showed a decreasing trend from 1970 to 2019, and summer contributed the most to the decreasing trend of SD throughout the year, followed by autumn and winter. The smallest contribution was in spring. The climate trend rate of SD in summer and autumn was −16.82 h/10a and −11.01 h/10a, respectively, and the decreasing trend passed the 0.001 significance test (p < 0.001). The climate trend rate of SD in winter was −7.98 h/10a, and the decreasing trend passed the 0.01 significance test (p < 0.01). The climate trend rate of SD in spring was −2.12 h/10a, but the decreasing trend failed to pass the 0.05 significance test (p > 0.05).
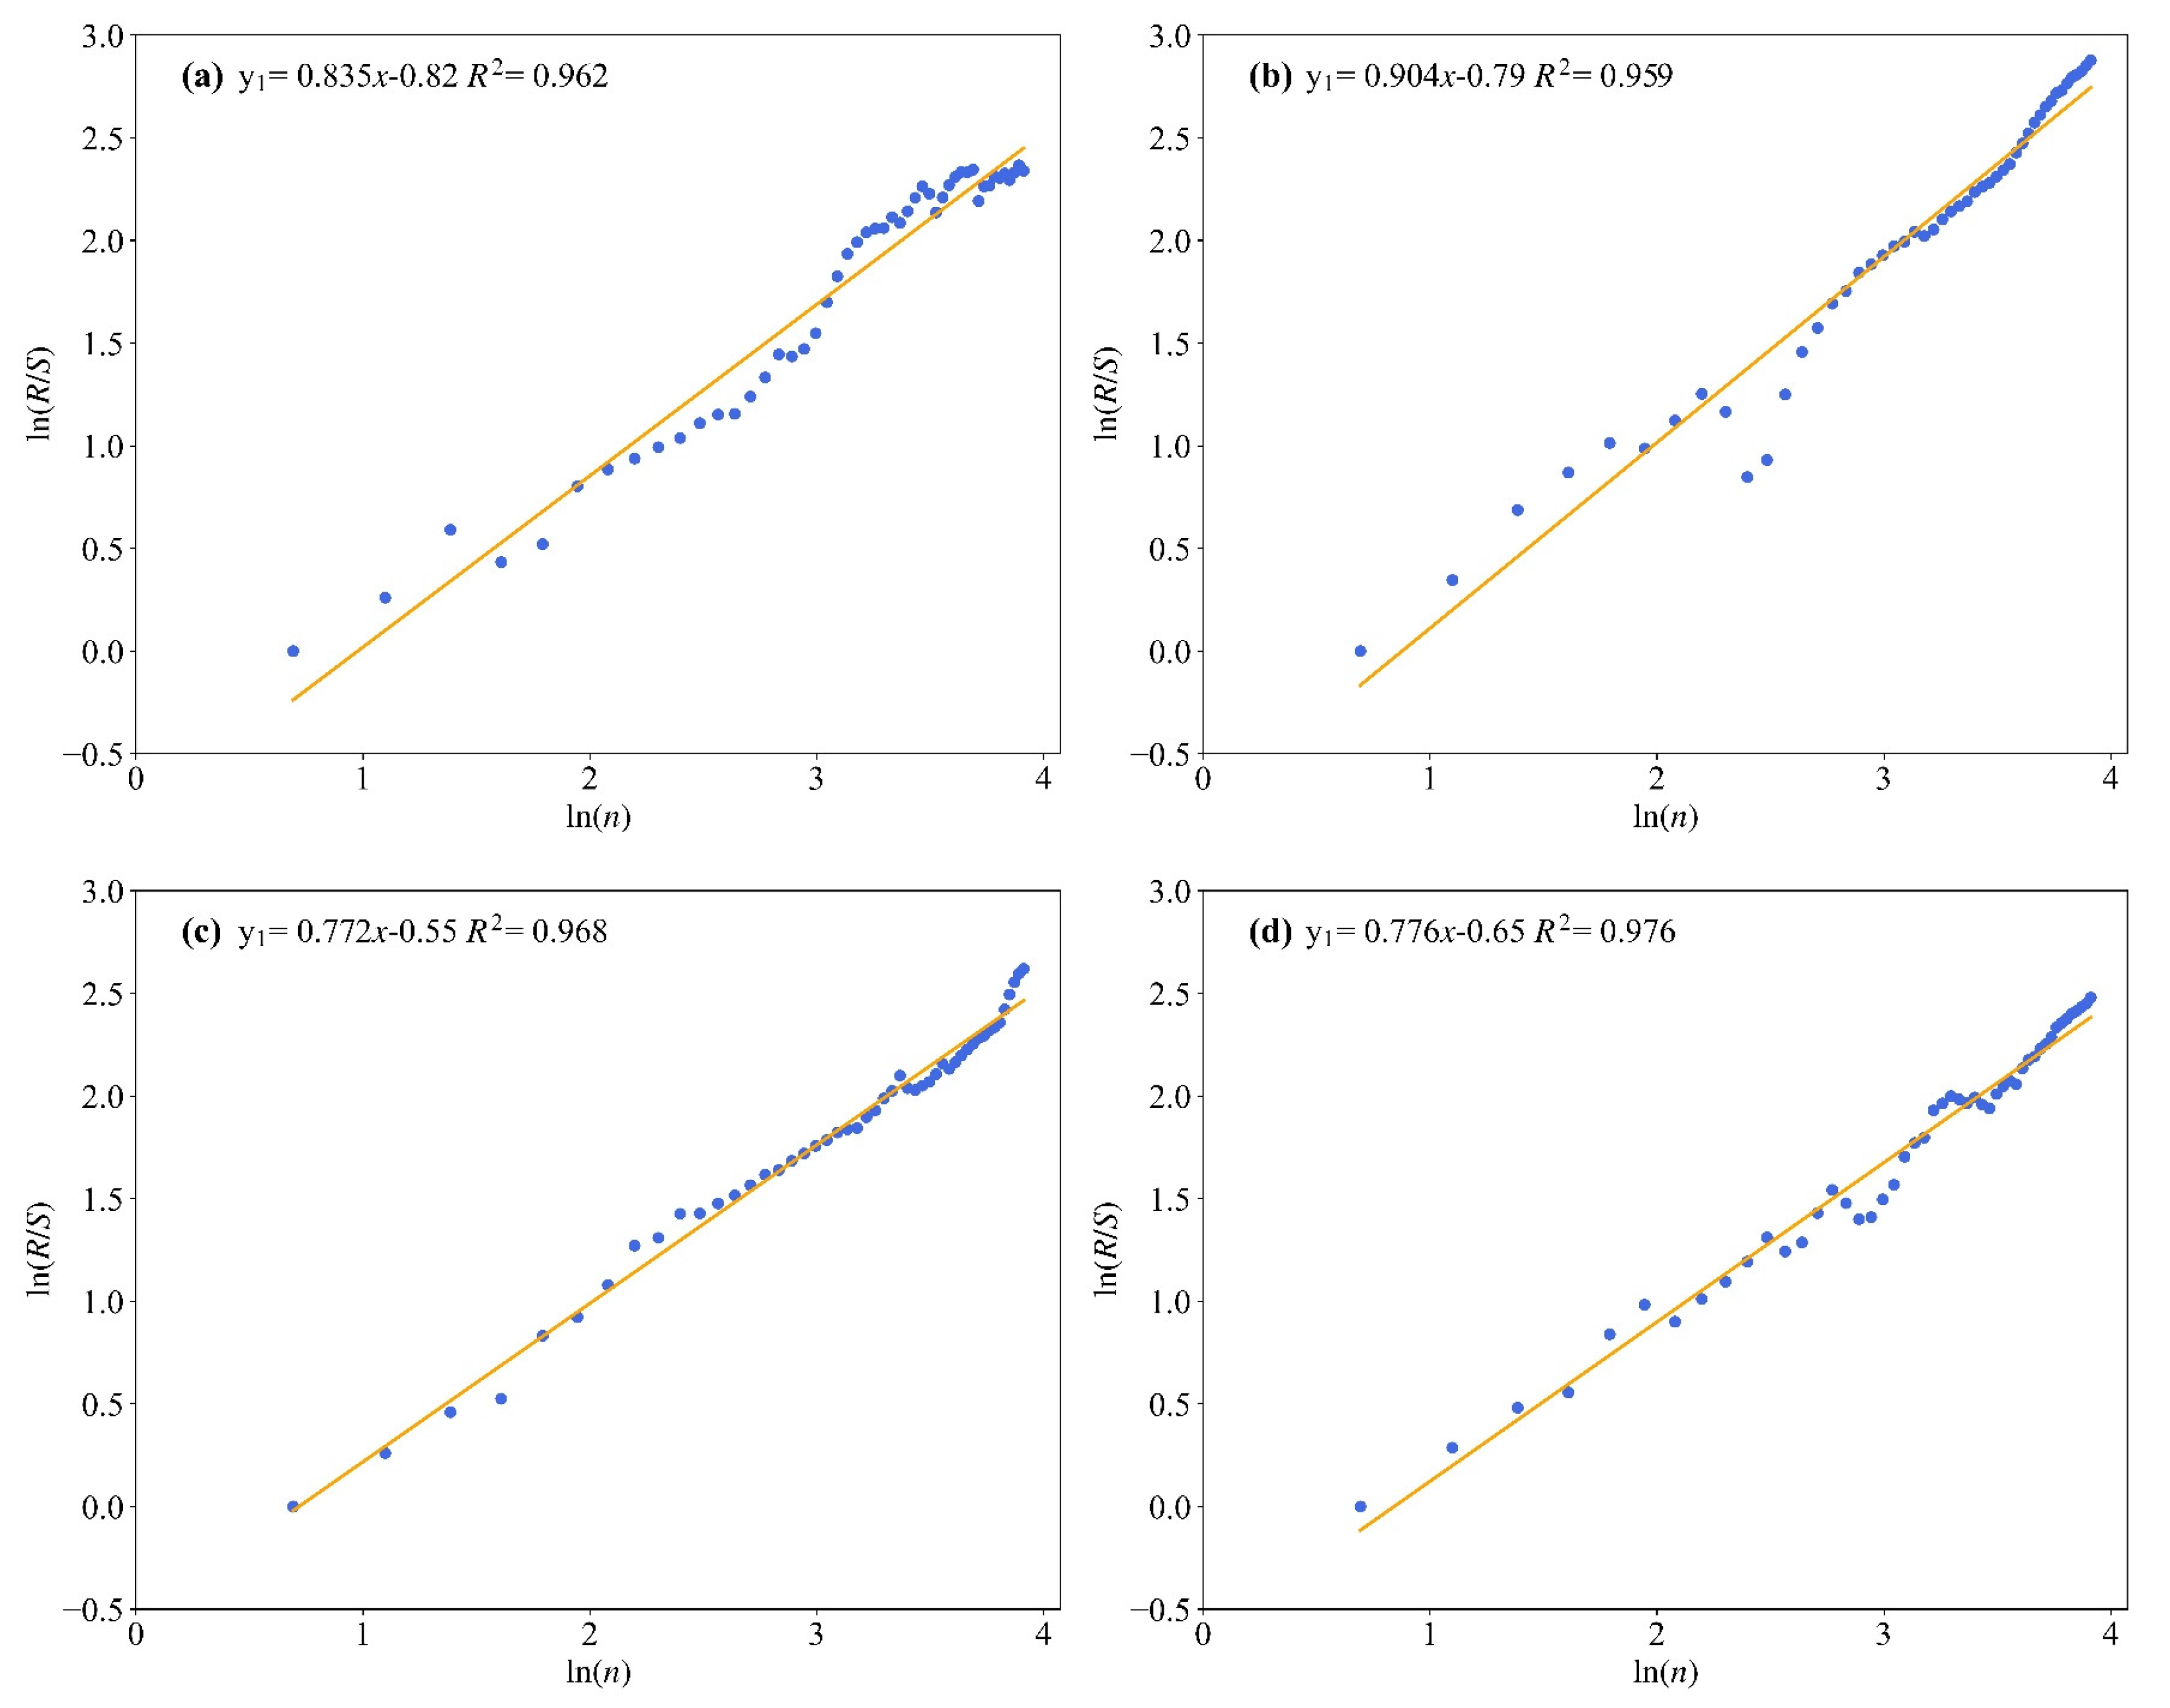
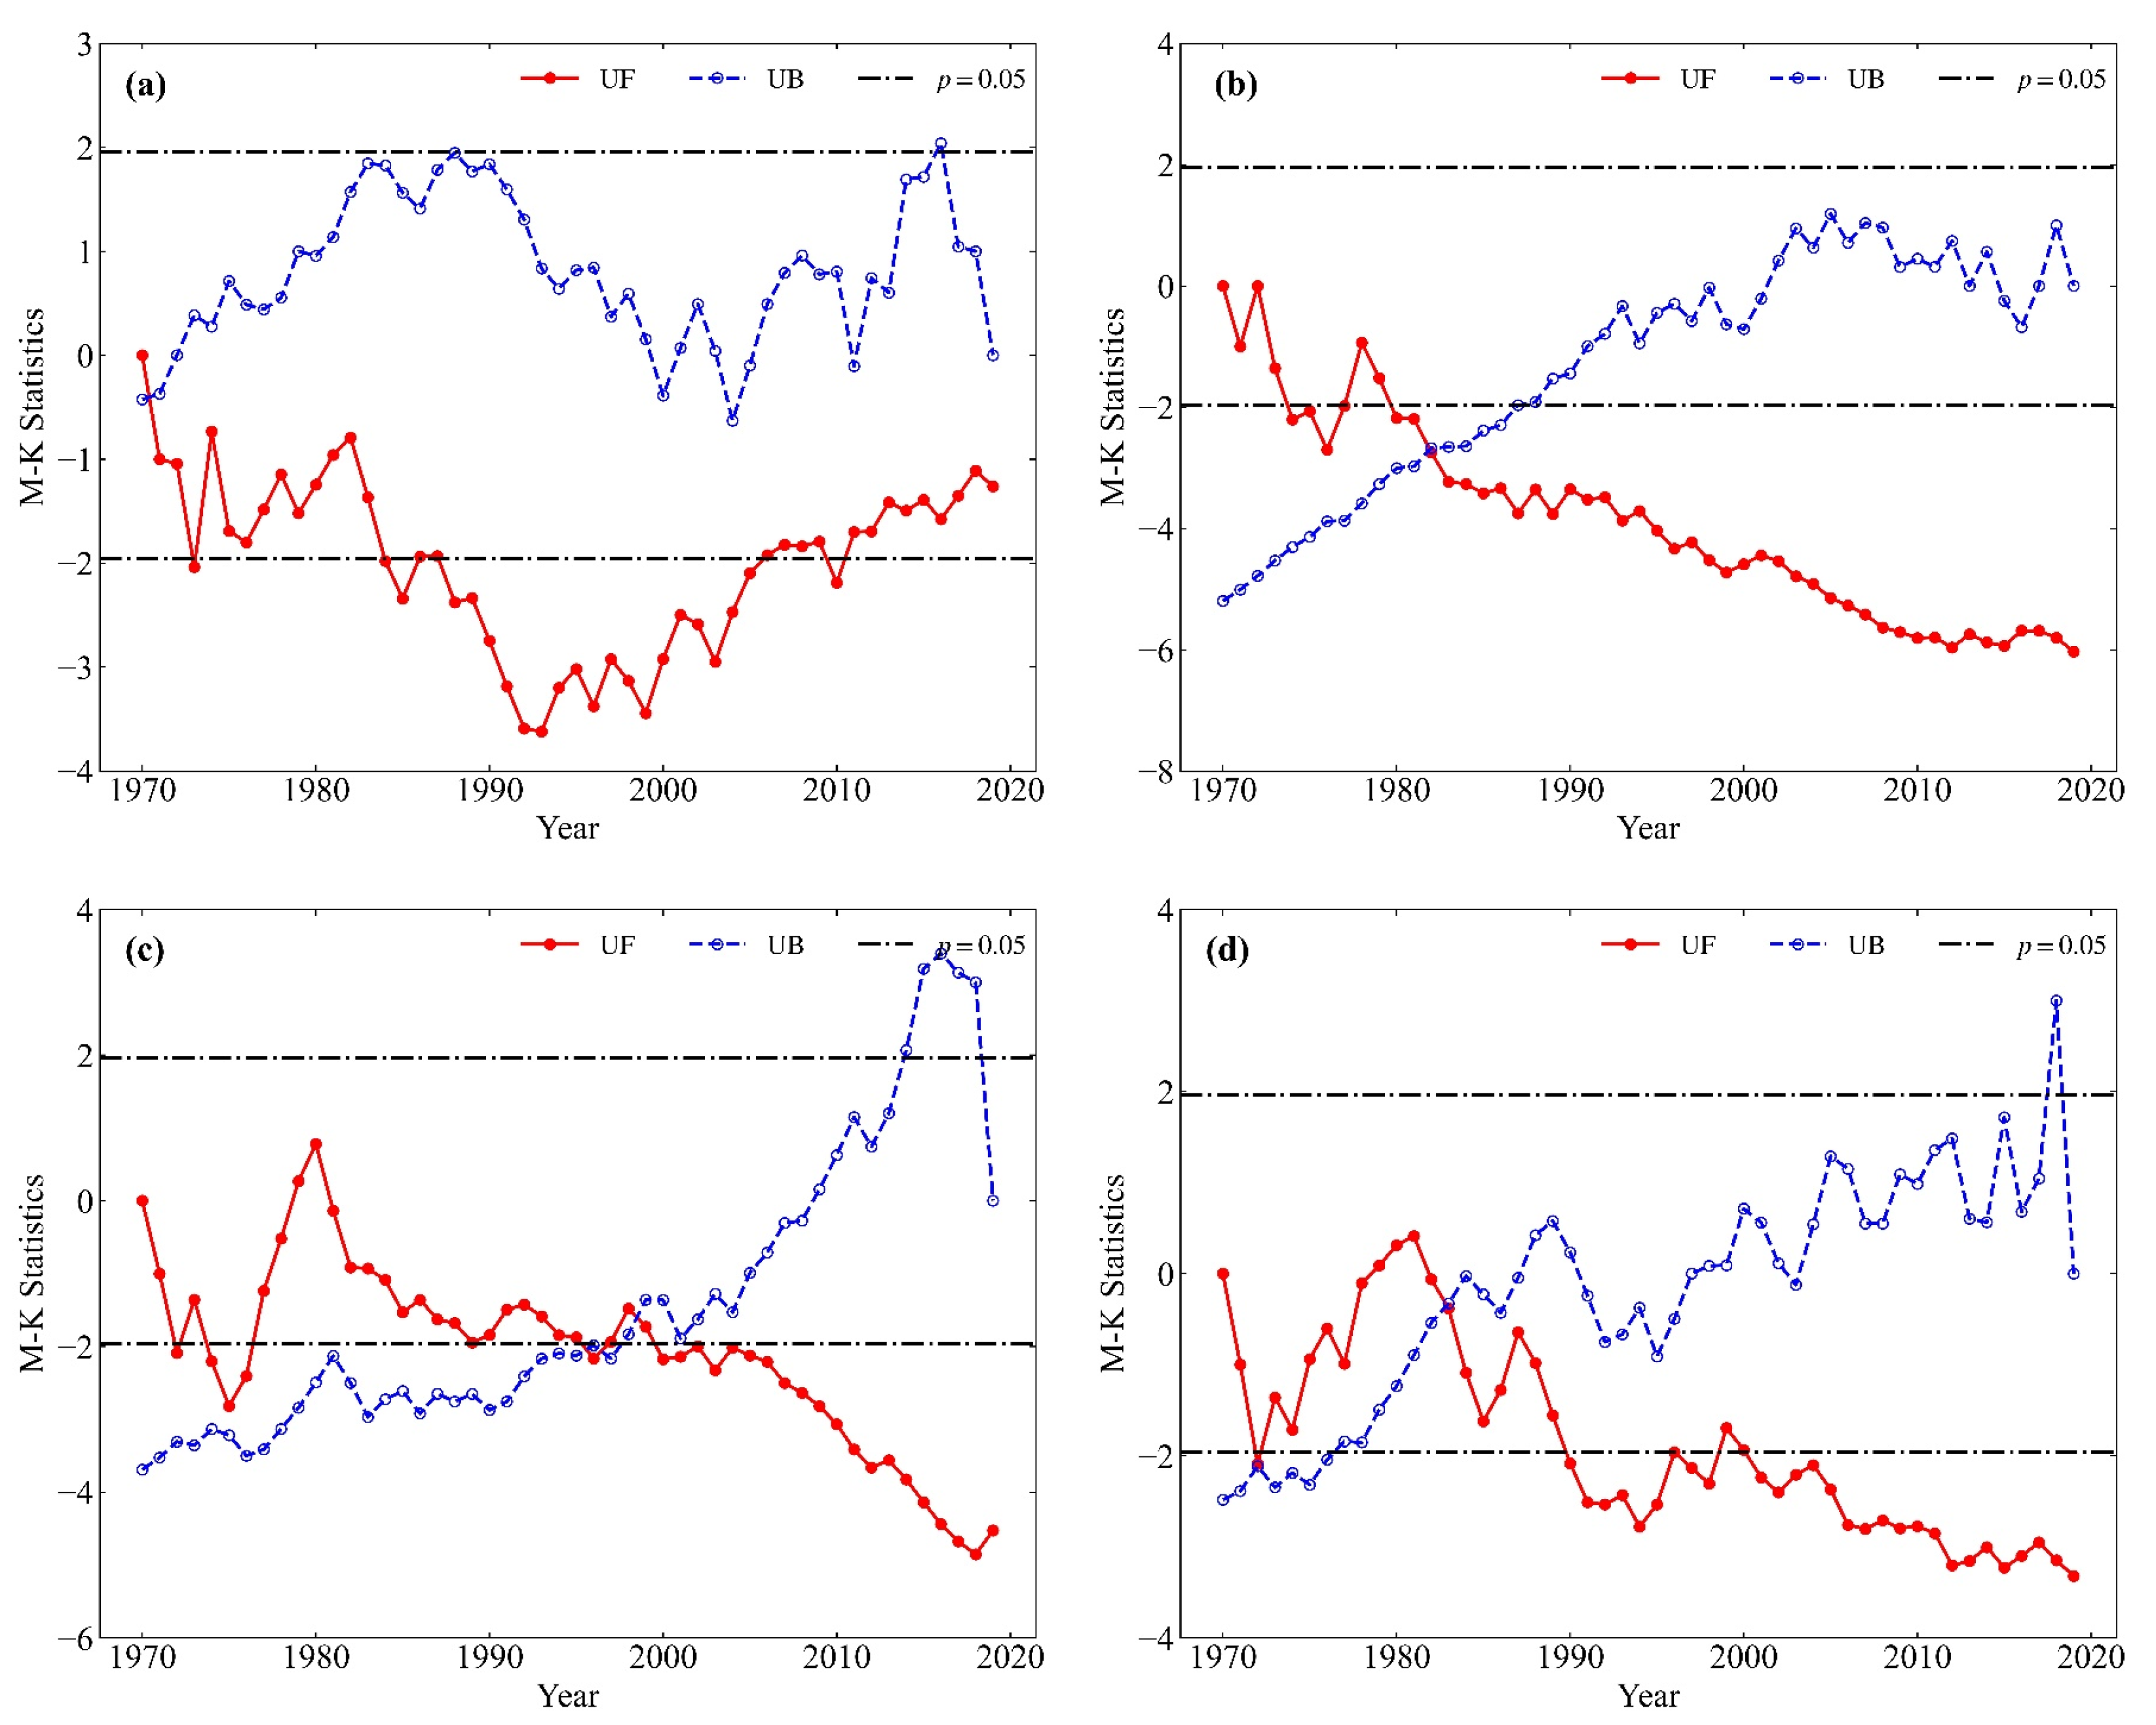
It can be seen from Figure 3 that, under the logarithmic coordinate, the slopes (H value) of SD fitting in spring, summer, autumn and winter are 0.835, 0.904, 0.772 and 0.776, respectively, and are greater than 0.5, which indicates that the future trend of SD in spring, summer and autumn is consistent with the previous trend. In other words, the SD in spring, summer, autumn and winter will continue to show a decreasing trend, and the decreasing trend is the most obvious in summer. It can be seen from Figure 4 that the UF positive sequence curve of the four seasons in spring, summer, autumn and winter are basically below 0 from 1970 to 2019, which shows that the SD in spring, summer, autumn and winter all show a decreasing trend. At the same time, the UF positive sequence curve exceeded the p = 0.05 significance level after 1986, 1980, 1999 and 2000, respectively, which indicates that the SD in spring, summer, autumn and winter decreased significantly after 1986, 1980, 1999 and 2000, respectively. In addition, the positive and reverse sequence curves of the UF and UB curves of spring, summer, autumn and winter intersected in 1970, 1982, 1998 and 1982, respectively, and the intersection points of the other seasons were all within the p = 0.05 significance level, except for summer, which indicated that the SD in summer did not change suddenly. In contrast, the decreasing mutations in spring, autumn and winter occurred in 1970, 1998 and 1982, respectively.

3.2. Spatial Variation Characteristics of Sunshine Duration

3.2.1. Spatial Variation of Sunshine Duration

From the perspective of the spatial distribution of the annual SD (Figure 5a), in the past 50 years, the annual SD has gradually decreased from the northwest to the southeast in China, and the annual SD is relatively long in areas with high altitudes. At the same time, the longest SD values are mainly distributed in the northwest region, and the annual SD is more than 2700 h, which may be related to latitude, altitude and human activities. On the contrary, the shortest SD is mainly distributed in the Sichuan Basin and its surrounding areas, the Sichuan Basin is the low-value central area and the annual SD is less than 1200 h, which may be related to the lower terrain and thicker cloud cover. Figure 5b shows that the overall annual SD in China shows an obvious decreasing trend (except for western Tibet and parts of southwestern Yunnan), and the decrease is the largest in the eastern region, followed by the central region. The smallest decrease is in the western region, which may be related to the dense population and economic development of the eastern region. In addition, the most significant decreasing trend is mainly distributed in the junction and the surrounding areas of Shandong, Henan and Hebei provinces, with the greatest decreasing degree being nearly 82 h/10a.

3.2.2. EOF Analysis of Sunshine Duration

The anomaly field of the annual SD is decomposed by EOF, and then the variance contribution rate and cumulative variance contribution rate of the first 10 modes are obtained (as shown in Table 1). As can be seen from the table, although the cumulative variance contribution rate of the first eight modes is 68.47%, only the first two modes pass the North significance test. Therefore, in this study, the first two modes are used as the research objects.
The variance contribution rate of the eigenvectors of the first mode is 29.81% (Table 2), which is much higher than that of the other modes, and it is also the main spatial distribution form of SD in China. It can be seen from Figure 6a that the eigenvectors of the first mode are generally negative (except for some areas in southwestern Yunnan), which indicates that the overall spatial variation in SD in China is consistent (increase or decrease uniformly). The negative centers are mainly distributed in Henan, Shandong and their surrounding areas, which shows that the changes in SD in these areas are more severe than those in other areas. It can be seen from Figure 6b that, because the first modal eigenvector is negative and the time coefficient is on the rise, the SD showed a decreasing trend in China from 1970 to 2019. The time coefficient was the smallest in 1978, which means that the SD uniformly increased in 1978, and on the contrary, it was the largest in 2015, which means that the SD uniformly decreased in 2015. These results are basically consistent with the analysis results of inter-annual variation characteristics.
The variance contribution rate of the eigenvectors of the second mode is 8.93% (Table 2). The eigenvector space of the second mode is oppositely distributed in the north–south direction, with the Yellow River from Ningxia to Shandong as the boundary (Figure 7a). At the same time, negative values appeared in some regions such as Xinjiang and Northeast China, which indicates that the changes in SD in this region are complex and may be affected by terrain and latitude. In addition, the centers of negative values are mainly distributed in Fujian, Jiangxi, Sichuan Basin and its surrounding areas, while the centers of positive values are mainly distributed in northern Shandong, which shows that the changes in SD in these areas are more violent than those in other areas. Figure 7b shows that the time coefficient is basically positive from 1981 to 2000, which shows that SD shows a decreasing trend in the area south of the dividing line, and on the contrary, it shows an increasing trend in the area north of the dividing line. In addition, the time coefficient is basically negative before 1981 and after 2000, which shows that SD shows an increasing trend in the area south of the dividing line, and on the contrary, it shows a decreasing trend in the area north of the dividing line.

3.3. Analysis of the Influencing Factors of the Sunshine Duration Change

A lot of research shows that the change in sunshine duration is related to many factors [12,17,19,20,21,22,23,25]—mainly, cloud cover, aerosol, precipitation, wind speed, etc. Due to the limitation of ground meteorological observation data, this paper mainly analyzes the relationship between SD and temperature, relative humidity, precipitation and wind speed.

3.3.1. Correlation Analysis between Sunshine Duration and Influencing Factors

It can be seen from Table 2 that the annual SD is significantly negatively correlated with temperature (p < 0.001) and precipitation (p < 0.05), significantly positively correlated with wind speed (p < 0.001) and positively correlated with relative humidity. In addition, seasonal SD was negatively correlated with temperature, except for the positive correlation in spring. There was a significant negative correlation between the annual SD and relative humidity in spring (p < 0.001), autumn (p < 0.01) and winter (p < 0.01), but there was a positive correlation in summer. In addition, seasonal SD was significantly negatively correlated with precipitation but positively correlated with wind speed, especially in summer (p < 0.001), autumn (p < 0.01) and winter (p < 0.001).

3.3.2. Partial Correlation Analysis of Sunshine Duration and Influencing Factors

It can be seen from Table 3 that annual and seasonal SD are significantly positively correlated with wind speed and negatively correlated with precipitation, and both have passed the significance test. Annual and seasonal SD were positively correlated with temperature and only passed the significance test in spring, summer and winter. Annual and seasonal SD were negatively correlated with relative humidity and only passed the significance test in spring and summer.
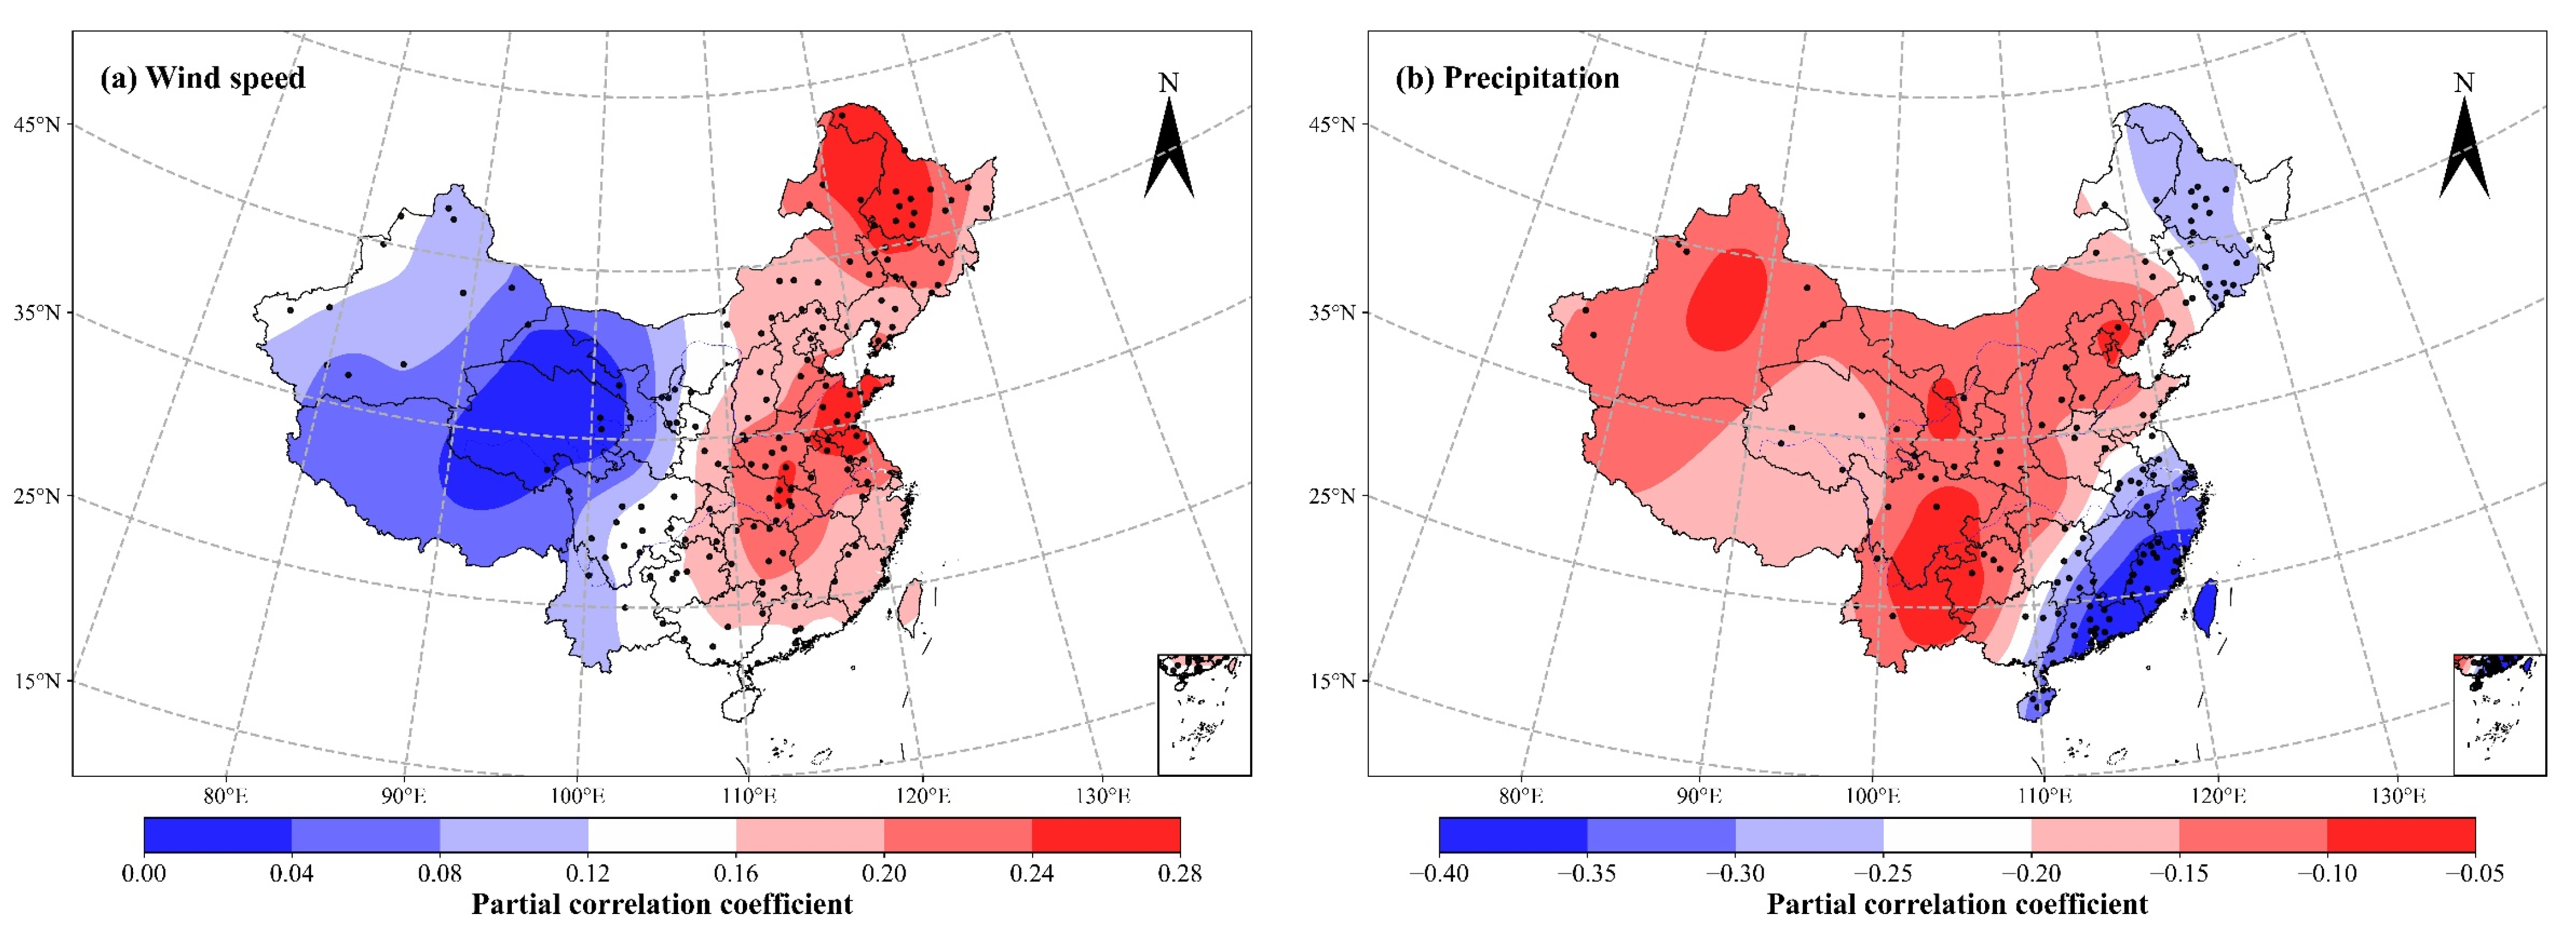
The above analysis shows that the change in SD is closely related to wind speed and precipitation, especially wind speed, and has no obvious correlation with temperature and relative humidity. Therefore, in order to better understand the relationship between SD and wind speed and precipitation, partial correlation analysis and significance tests can be carried out for them in space. The results are shown in Figure 8. It can be seen from Figure 8a that the annual SD and wind speed are positively correlated in the spatial distribution and are most obvious in the east and northeast (p < 0.05). Because the wind speed is low, the water vapor and pollutants in the air are not easy to diffuse, leading to the increase in aerosol concentration near the surface and the decrease in atmospheric transparency, which leads to the decrease in SD. Figure 8b shows that the spatial distribution of annual SD and precipitation are negatively correlated, which is most obvious in the southeast coastal provinces of China (p < 0.05). This is because the increase in precipitation, accompanied by an increase in the cloud amount in the sky, leads to the decrease in solar radiation received near the ground, which leads to the decrease in SD. In addition, the negative correlation between annual SD and precipitation is most obvious in the southeast, which may be related to the excessive precipitation in the south. This is because there is more precipitation in the south, and the rainy season lasts for a long time, especially in summer and autumn.

3.4. The Relationship between Sunshine Duration and Human Activities

The change in sunshine hours is affected not only by meteorological factors (wind speed, precipitation, temperature, etc.) but also by human activities (urbanization, air pollution, etc.). However, compared with meteorological factors, the analysis of human activities is more complex, but it is still a hot spot in the study of climate change. The change in sunshine hours can reflect the impact of human activities to a certain extent, and the impact of human activities is most prominent in densely populated and economically active areas. Therefore, this paper selects regions with a small population and weak economic activities and regions with a dense population and strong economic activities for comparative analysis. The analysis results are shown in Figure 9. It can be seen from Figure 9 that the annual SD of the Pearl River Delta, Beijing–Tianjin–Hebei and the Yangtze River Delta is on the decline, while that of Xinjiang is on the rise. The annual SD climate tendency rates of Beijing–Tianjin–Hebei and Yangtze River Delta are −0.47 h/10a and −0.42 h/10a, respectively, with a significant downward trend, and both have passed the significance test (p < 0.001). The annual SD climate tendency rates in Xinjiang and the Pearl River Delta are 0.18 h/10a and −0.12 h/10a, respectively, and both fail the significance test (p > 0.05). It can be seen that the SD change trend of densely populated and economically strong regions is basically consistent with the SD decrease trend of the whole region, that is, the SD decrease is closely related to human activities, and the more active the human activities are, the more obvious the performance is.

4. Discussion

The annual SD of China showed a downward trend from 1970 to 2019 and a significant downward trend after 1980, which is basically consistent with the conclusion of Wang et al. [29]. The seasonal SD shows a decreasing trend from 1970 to 2019, and the decreasing range is the largest in summer and the smallest in winter, which is basically consistent with the results obtained by Xia et al. [12]. In the early 20th century, the downward trend slowed down, which may be related to the “early brightening” of solar radiation [41]. From the perspective of space, SD gradually decreased from the western region to the southern region. The maximum annual SD is mainly distributed in northwest China, with an annual SD of more than 2700 h. The minimum annual SD is mainly distributed in the south, especially in the Sichuan Basin and its surrounding areas, with the annual SD being less than 1200 h. This may be related to the latitude or altitude where the meteorological observation station is located, because, generally speaking, SD is relatively long in high-altitude or high-latitude areas [19].
By analyzing the influencing factors of SD change, it is found that there is a significant positive correlation between SD and wind speed, and the significant areas are mainly distributed in the east and northeast, which is consistent with the results of Feng et al. [19]. As the east is a densely populated and economically developed area, and the northeast is a heavy industrial area, the pollutant content in these areas is relatively high, but the increase in wind speed will accelerate its diffusion speed, and this regulation mechanism will be enhanced with the increase in pollutants [42,43]. Because the increase or decrease in wind speed will affect the diffusion speed of water vapor and pollutants in the air, this affects the atmospheric transparency, finally affecting the change in SD. There is a significant negative correlation between annual SD and precipitation, which is mainly distributed in the southeast coastal provinces of China. On the one hand, this may be related to the long duration of the rainy season in the southern region and the concentration of precipitation in summer and autumn. On the other hand, usually, the precipitation increases, the cloud amount is relatively greater and the SD will also decrease. In addition, we used correlation analysis and partial correlation analysis to analyze the correlation between annual SD and temperature and relative humidity. The results are inconsistent, but the results of the correlation analysis are basically consistent with the results of Feng et al. [19] and Ren et al. [23]. This indicates that the relationship between SD and temperature and relative humidity is complex and needs to be determined in future research.
The decrease in SD may also be related to volcanic eruption [44]. After 1980, there were several volcanic eruptions (1980, St. Helens, England; 1982, Elchicon, Mexico; 1985, Ruiz, Colombia; 1986, Oshima, Japan). During this period, the annual SD also declined rapidly, so this may be related to volcanic eruptions [45].
In addition, we compared the changes in SD in different regions and found that the decrease in SD was closely related to human activities and was most obvious in densely populated and economically developed regions. The main reason may be that the industries in these regions are relatively developed, and there are many air pollutants emitted artificially, which makes it difficult for water vapor and pollutants in the air to diffuse and reduces the atmospheric transparency, leading to the decrease in SD [46,47]. Although we have preliminarily analyzed the relationship between SD and human activities, human activities are complex and diverse, and we only rely on a single SD data for analysis, which leads to a certain degree of subjectivity in the conclusion, but there is no complete and accurate evaluation method for the analysis of human activities. Therefore, how to build an appropriate evaluation method and make an objective and detailed quantitative analysis of human activities will be the focus of our future research. This paper only analyzes the relationship between SD and the four influencing factors and does not analyze the influence of other factors such as cloud cover and air pollution. Therefore, in the later stage, we will further consider the influence of air pollution characteristics, urban development, terrain and other factors on SD in combination with these factors.

5. Conclusions

In the study, based on data from 415 meteorological stations, the spatiotemporal characteristics of SD and its relationship with climate change and human activities in China from 1970 to 2019 were analyzed by using the methods of linear trend analysis, the M–K mutation test, the Hurst index, EOF decomposition and correlation analysis and other methods. The conclusions and summaries of this study are as follows: The annual SD of China shows a downward trend, with a climate tendency rate of −37.93 h/10a, which decreased significantly from 1982 to 2019, and there was a suspected mutation point around 1985. Except for the fact that the downward trend in spring is not obvious, the seasonal SD in China shows a significant downward trend, with the most obvious downward trend being in summer (−16.82 h/10a), followed by autumn (−11.01 h/10a) and winter (−7.98 h/10a), and the lowest trend being in spring (−2.12 h/10a). The seasonal SD has a significant downward trend in 1986, 1980, 1999 and 2000, respectively. The H value of annual and seasonal SD is greater than 0.5 and less than 1, so the change trend of annual and seasonal SD is consistent with that of the past 50 years, that is, the annual and seasonal SD will still show a downward trend in the future. The spatial distribution of SD not only has an overall consistent distribution but also takes the Yellow River from Ningxia to Shandong as the boundary, showing a north–south opposite distribution. Annual SD is closely related to wind speed (R = 0.76, p < 0.001) and precipitation (R = −0.53, p < 0.001), especially wind speed, and has no obvious correlation with temperature (R =0.138, p > 0.05) and relative humidity (R = −0.061, p > 0.05). The SD change trend of densely populated and economically strong areas is basically consistent with the SD decline trend of the whole region, which indicates that the SD decline may be closely related to human activities, and the stronger the human activities, the more obvious the performance.

Author Contributions

C.T.: Writing—review and editing. Y.Z.: Methodology, Writing—original draft. Y.W.: Software, Visualization, Funding acquisition. F.Z.: Investigation, Validation. X.W.: Investigation, Validation. X.T.: Investigation, Resources. All authors have read and agreed to the published version of the manuscript.

Funding

This study is supported by the Open Project of the Advanced Laser Technology Laboratory of AnHui Province (No. AHL2021KF02), the University Natural Science Research Project of Anhui Province of China (No. KJ2021A0447), the Anhui Province Key R&D Program of China (No. 202004i07020011) and the National Key Research and Development Program (No. 2017YFD0700501).

Institutional Review Board Statement

Not applicable.

Informed Consent Statement

Not applicable.

Data Availability Statement

The Meteorological Data Center of the China Meteorological Administration data are downloaded from http://data.cma.cn/ (Recently accessed date: 25 October 2022).

Acknowledgments

We would like to thank the Meteorological Data Center of the China Meteorological Administration for the data support.

Conflicts of Interest

The authors declare that there are no conflict of interest regarding the publication of this paper.

References

  1. Yu, S.; Zheng, Y.; Li, L. A comprehensive evaluation of the development and utilization of China’s regional renewable energy. Energy Policy 2019, 127, 73–86. [Google Scholar] [CrossRef]
  2. Chao, B.; Fang, C.-H. Geographical and environmental perspectives for the sustainable development of renewable energy in urbanizing China. Renew. Sustain. Energy Rev. 2013, 27, 464–474. [Google Scholar] [CrossRef]
  3. Moheimani, N.R.; Parlevliet, D. Sustainable solar energy conversion to chemical and electrical energy. Renew. Sustain. Energy Rev. 2013, 27, 494–504. [Google Scholar] [CrossRef]
  4. Razykov, T.M.; Ferekides, C.S.; Morel, D.; Stefanakos, E.; Ullal, H.S.; Upadhyaya, H.M. Solar photovoltaic electricity: Current status and future prospects. Sol. Energy 2011, 85, 1580–1608. [Google Scholar] [CrossRef]
  5. Liang, Y.; Yu, B.; Wang, L. Costs and benefits of renewable energy development in China’s power industry. Renew. Energy 2019, 131, 700–712. [Google Scholar] [CrossRef]
  6. Choudhary, P.; Srivastava, R.K. Sustainability perspectives-a review for solar photovoltaic trends and growth opportunities. J. Clean. Prod. 2019, 227, 589–612. [Google Scholar] [CrossRef]
  7. Yu, L.; Zhang, M.; Wang, L.; Qin, W.; Jiang, D.; Li, J. Variability of surface solar radiation under clear skies over Qinghai-Tibet Plateau: Role of aerosols and water vapor. Atmos. Environ. 2022, 287, 119286. [Google Scholar] [CrossRef]
  8. Feng, Y.; Zhang, X.; Jia, Y.; Cui, N.; Hao, W.; Li, H.; Gong, D. High-resolution assessment of solar radiation and energy potential in China. Energy Convers. Manag. 2021, 240, 114265. [Google Scholar] [CrossRef]
  9. Jahani, B.; Mohammadi, B. A comparison between the application of empirical and ANN methods for estimation of daily global solar radiation in Iran. Theor. Appl. Climatol. 2019, 137, 1257–1269. [Google Scholar] [CrossRef]
  10. Ağbulut, Ü.; Gürel, A.E.; Biçen, Y. Prediction of daily global solar radiation using different machine learning algorithms: Evaluation and comparison. Renew. Sustain. Energy Rev. 2021, 135, 110114. [Google Scholar] [CrossRef]
  11. Yao, W.; Zhang, C.; Wang, X.; Zhang, Z.; Li, X.; Di, H. A new correlation between global solar radiation and the quality of sunshine duration in China. Energy Convers. Manag. 2018, 164, 579–587. [Google Scholar] [CrossRef]
  12. Xia, X. Spatiotemporal changes in sunshine duration and cloud amount as well as their relationship in China during 1954–2005. J. Geophys. Res. Atmos. 2010, 115. [Google Scholar] [CrossRef] [Green Version]
  13. Ghanghermeh, A.; Roshan, G.; Halabian, A. Projecting spatiotemporal variations of sunshine duration with regards to climate change in Iran as a step towards clean energy. Sustain. Energy Technol. Assess. 2022, 53, 102630. [Google Scholar] [CrossRef]
  14. Sanchez-Lorenzo, A.; Calbó, J.; Martin-Vide, J. Spatial and temporal trends in sunshine duration over Western Europe (1938–2004). J. Clim. 2008, 21, 6089–6098. [Google Scholar] [CrossRef]
  15. Dobesch, H. On the variations of sunshine duration in Austria. Theor. Appl. Climatol. 1992, 46, 33–38. [Google Scholar] [CrossRef]
  16. Power, H.C. Trends in solar radiation over Germany and an assessment of the role of aerosols and sunshine duration. Theor. Appl. Climatol. 2003, 76, 47–63. [Google Scholar] [CrossRef]
  17. Angell, J.K. Variation in United States cloudiness and sunshine duration between 1950 and the drought year of 1988. J. Clim. 1990, 3, 296–308. [Google Scholar] [CrossRef]
  18. Inoue, T.; Matsumoto, J. Seasonal and secular variations of sunshine duration and natural seasons in Japan. Int. J. Climatol. 2003, 23, 1219–1234. [Google Scholar] [CrossRef]
  19. Feng, Z.; Guo, B.; Ren, S.; Li, Y. Reduction in Sunshine Duration and Related Factors over Mainland China during 1961–2016. Energies 2019, 12, 4718. [Google Scholar] [CrossRef] [Green Version]
  20. Zheng, X.; Kang, W.; Zhao, T.; Luo, Y.; Duan, C.; Chen, J. Long-term trends in sunshine duration over Yunnan-Guizhou Plateau in Southwest China for 1961–2005. Geophys. Res. Lett. 2008, 35. [Google Scholar] [CrossRef]
  21. Yang, Y.H.; Zhao, N.; Hao, X.H.; Li, C.Q. Decreasing trend of sunshine hours and related driving forces in North China. Theor. Appl. Climatol. 2009, 97, 91–98. [Google Scholar] [CrossRef]
  22. You, Q.; Kang, S.; Flügel, W.A.; Sanchez-Lorenzo, A.; Yan, Y.; Huang, J.; Martin-Vide, J. From brightening to dimming in sunshine duration over the eastern and central Tibetan Plateau (1961–2005). Theor. Appl. Climatol. 2010, 101, 445–457. [Google Scholar] [CrossRef]
  23. Ren, J.; Lei, X.; Zhang, Y.; Wang, M.; Xiang, L. Sunshine duration variability in haihe river basin, China, during 1966–2015. Water 2017, 9, 770. [Google Scholar] [CrossRef] [Green Version]
  24. Marin, L.; Birsan, M.V.; Bojariu, R.; Dumitrescu, A.; Micu, D.M.; Manea, A. An overview of annual climatic changes in Romania: Trends in air temperature, precipitation, sunshine hours, cloud cover, relative humidity and wind speed during the 1961–2013 period. Carpathian J. Earth Environ. Sci. 2014, 9, 253–258. [Google Scholar]
  25. Bartoszek, K.; Matuszko, D.; Soroka, J. Relationships between cloudiness, aerosol optical thickness, and sunshine duration in Poland. Atmos. Res. 2020, 245, 105097. [Google Scholar] [CrossRef]
  26. Bartoszek, K.; Matuszko, D. The influence of atmospheric circulation over Central Europe on the long-term variability of sunshine duration and air temperature in Poland. Atmos. Res. 2021, 251, 105427. [Google Scholar] [CrossRef]
  27. Power, H.C.; Mills, D.M. Solar radiation climate change over southern Africa and an assessment of the radiative impact of volcanic eruptions. Int. J. Climatol. 2005, 25, 295–318. [Google Scholar] [CrossRef]
  28. Song, Z.; Chen, L.; Wang, Y.; Liu, X.; Lin, L.; Luo, M. Effects of urbanization on the decrease in sunshine duration over eastern China. Urban Clim. 2019, 28, 100471. [Google Scholar] [CrossRef]
  29. Wang, Y.; Yang, Y.; Zhao, N.; Liu, C.; Wang, Q. The magnitude of the effect of air pollution on sunshine hours in China. J. Geophys. Res. Atmos. 2012, 117. [Google Scholar] [CrossRef]
  30. Chen, Y.; Zhao, Y.; Fu, J.; Liu, Y.; Tang, S.; Han, Y.; Fan, Z. Association of sunshine duration with acute myocardial infarction hospital admissions in Beijing, China: A time-series analysis within-summer. Sci. Total Environ. 2022, 828, 154528. [Google Scholar] [CrossRef]
  31. Gu, S.; Huang, R.; Yang, J.; Sun, S.; Xu, Y.; Zhang, R.; Wang, Y.; Lu, B.; He, T.; Wang, A.; et al. Exposure-lag-response association between sunlight and schizophrenia in Ningbo, China. Environ. Pollut. 2019, 247, 285–292. [Google Scholar] [CrossRef] [PubMed]
  32. Han, Y.; Ma, Y.; Wang, Z.; Xie, Z.; Sun, G.; Wang, B.; Ma, W.; Su, R.; Hu, W.; Fan, Y. Variation characteristics of temperature and precipitation on the northern slopes of the Himalaya region from 1979 to 2018. Atmos. Res. 2021, 253, 105481. [Google Scholar] [CrossRef]
  33. Zhu, D.; Yang, Q.; Xiong, K.; Xiao, H. Spatiotemporal Variations in Daytime and Night-Time Precipitation on the Yunnan–Guizhou Plateau from 1960 to 2017. Atmosphere 2022, 13, 415. [Google Scholar] [CrossRef]
  34. Mozafari, M.; Hosseini, Z.; Fijani, E.; Eskandari, R.; Siahpoush, S.; Ghader, F. Effects of climate change and human activity on lake drying in Bakhtegan Basin, southwest Iran. Sustain. Water Resour. Manag. 2022, 8, 1–18. [Google Scholar] [CrossRef]
  35. Zhang, W.; Jin, H.; Shao, H.; Li, A.; Li, S.; Fan, W. Temporal and spatial variations in the leaf area index and its response to topography in the Three-River Source Region, China from 2000 to 2017. Isprs Int. J. Geo-Inf. 2021, 10, 33. [Google Scholar] [CrossRef]
  36. Ersi, C.; Bayaer, T.; Bao, Y.; Bao, Y.; Yong, M.; Zhang, X. Temporal and Spatial Changes in Evapotranspiration and Its Potential Driving Factors in Mongolia over the Past 20 Years. Remote Sens. 2022, 14, 1856. [Google Scholar] [CrossRef]
  37. Zhou, Y.; Yu, D.; Yang, Q.; Pan, S.; Gai, Y.; Cheng, W.; Liu, X.; Tang, S. Variations of water transparency and impact factors in the Bohai and Yellow Seas from satellite observations. Remote Sens. 2021, 13, 514. [Google Scholar] [CrossRef]
  38. Ma, Q.; Zhang, Q.; Wang, Q.; Yuan, X.; Yuan, R.; Luo, C. A comparative study of EOF and NMF analysis on downward trend of AOD over China from 2011 to 2019. Environ. Pollut. 2021, 288, 117713. [Google Scholar] [CrossRef]
  39. Zaib, S.; Lu, J.; Bilal, M. Spatio-Temporal Characteristics of Air Quality Index (AQI) over Northwest China. Atmosphere 2022, 13, 375. [Google Scholar] [CrossRef]
  40. Wang, M.; Fu, J.E.; Wu, Z.; Pang, Z. Spatiotemporal variation of NDVI in the vegetation growing season in the source region of the Yellow River, China. ISPRS Int. J. Geo-Inf. 2020, 9, 282. [Google Scholar] [CrossRef] [Green Version]
  41. Wild, M. Global dimming and brightening: A review. J. Geophys. Res. Atmos. 2009, 114. [Google Scholar] [CrossRef]
  42. O’Dowd, C.D.; Smith, M.H. Physicochemical properties of aerosols over the northeast Atlantic: Evidence for wind-speed-related submicron sea-salt aerosol production. J. Geophys. Res. Atmos. 1993, 98, 1137–1149. [Google Scholar] [CrossRef]
  43. Wang, Y.W.; Yang, Y.H.; Zhou, X.Y.; Zhao, N.; Zhang, J.H. Air pollution is pushing wind speed into a regulator of surface solar irradiance in China. Environ. Res. Lett. 2014, 9, 054004. [Google Scholar] [CrossRef]
  44. Simon, P.; Ceglar, A.; Levanič, T. Long-term summer sunshine/moisture stress reconstruction from tree-ring widths from Bosnia and Herzegovina. Clim. Past 2013, 9, 27–40. [Google Scholar]
  45. Sun, C.; Liu, Y.; Song, H.; Cai, Q.; Li, Q.; Wang, L.; Mei, R.; Fang, C. Sunshine duration reconstruction in the southeastern Tibetan Plateau based on tree-ring width and its relationship to volcanic eruptions. Sci. Total Environ. 2018, 628, 707–714. [Google Scholar] [CrossRef]
  46. Kaiser, D.P.; Qian, Y. Decreasing trends in sunshine duration over China for 1954–1998: Indication of increased haze pollution? Geophys. Res. Lett. 2002, 29, 38-1. [Google Scholar] [CrossRef]
  47. Chen, L.X.; Li, W.L.; Zhu, W.Q.; Zhou, X.J.; Zhou, Z.J.; Liu, H.L. Seasonal trends of climate change in the Yangtze Delta and its adjacent regions and their formation mechanisms. Meteorol. Atmos. Phys. 2006, 92, 11–23. [Google Scholar] [CrossRef]
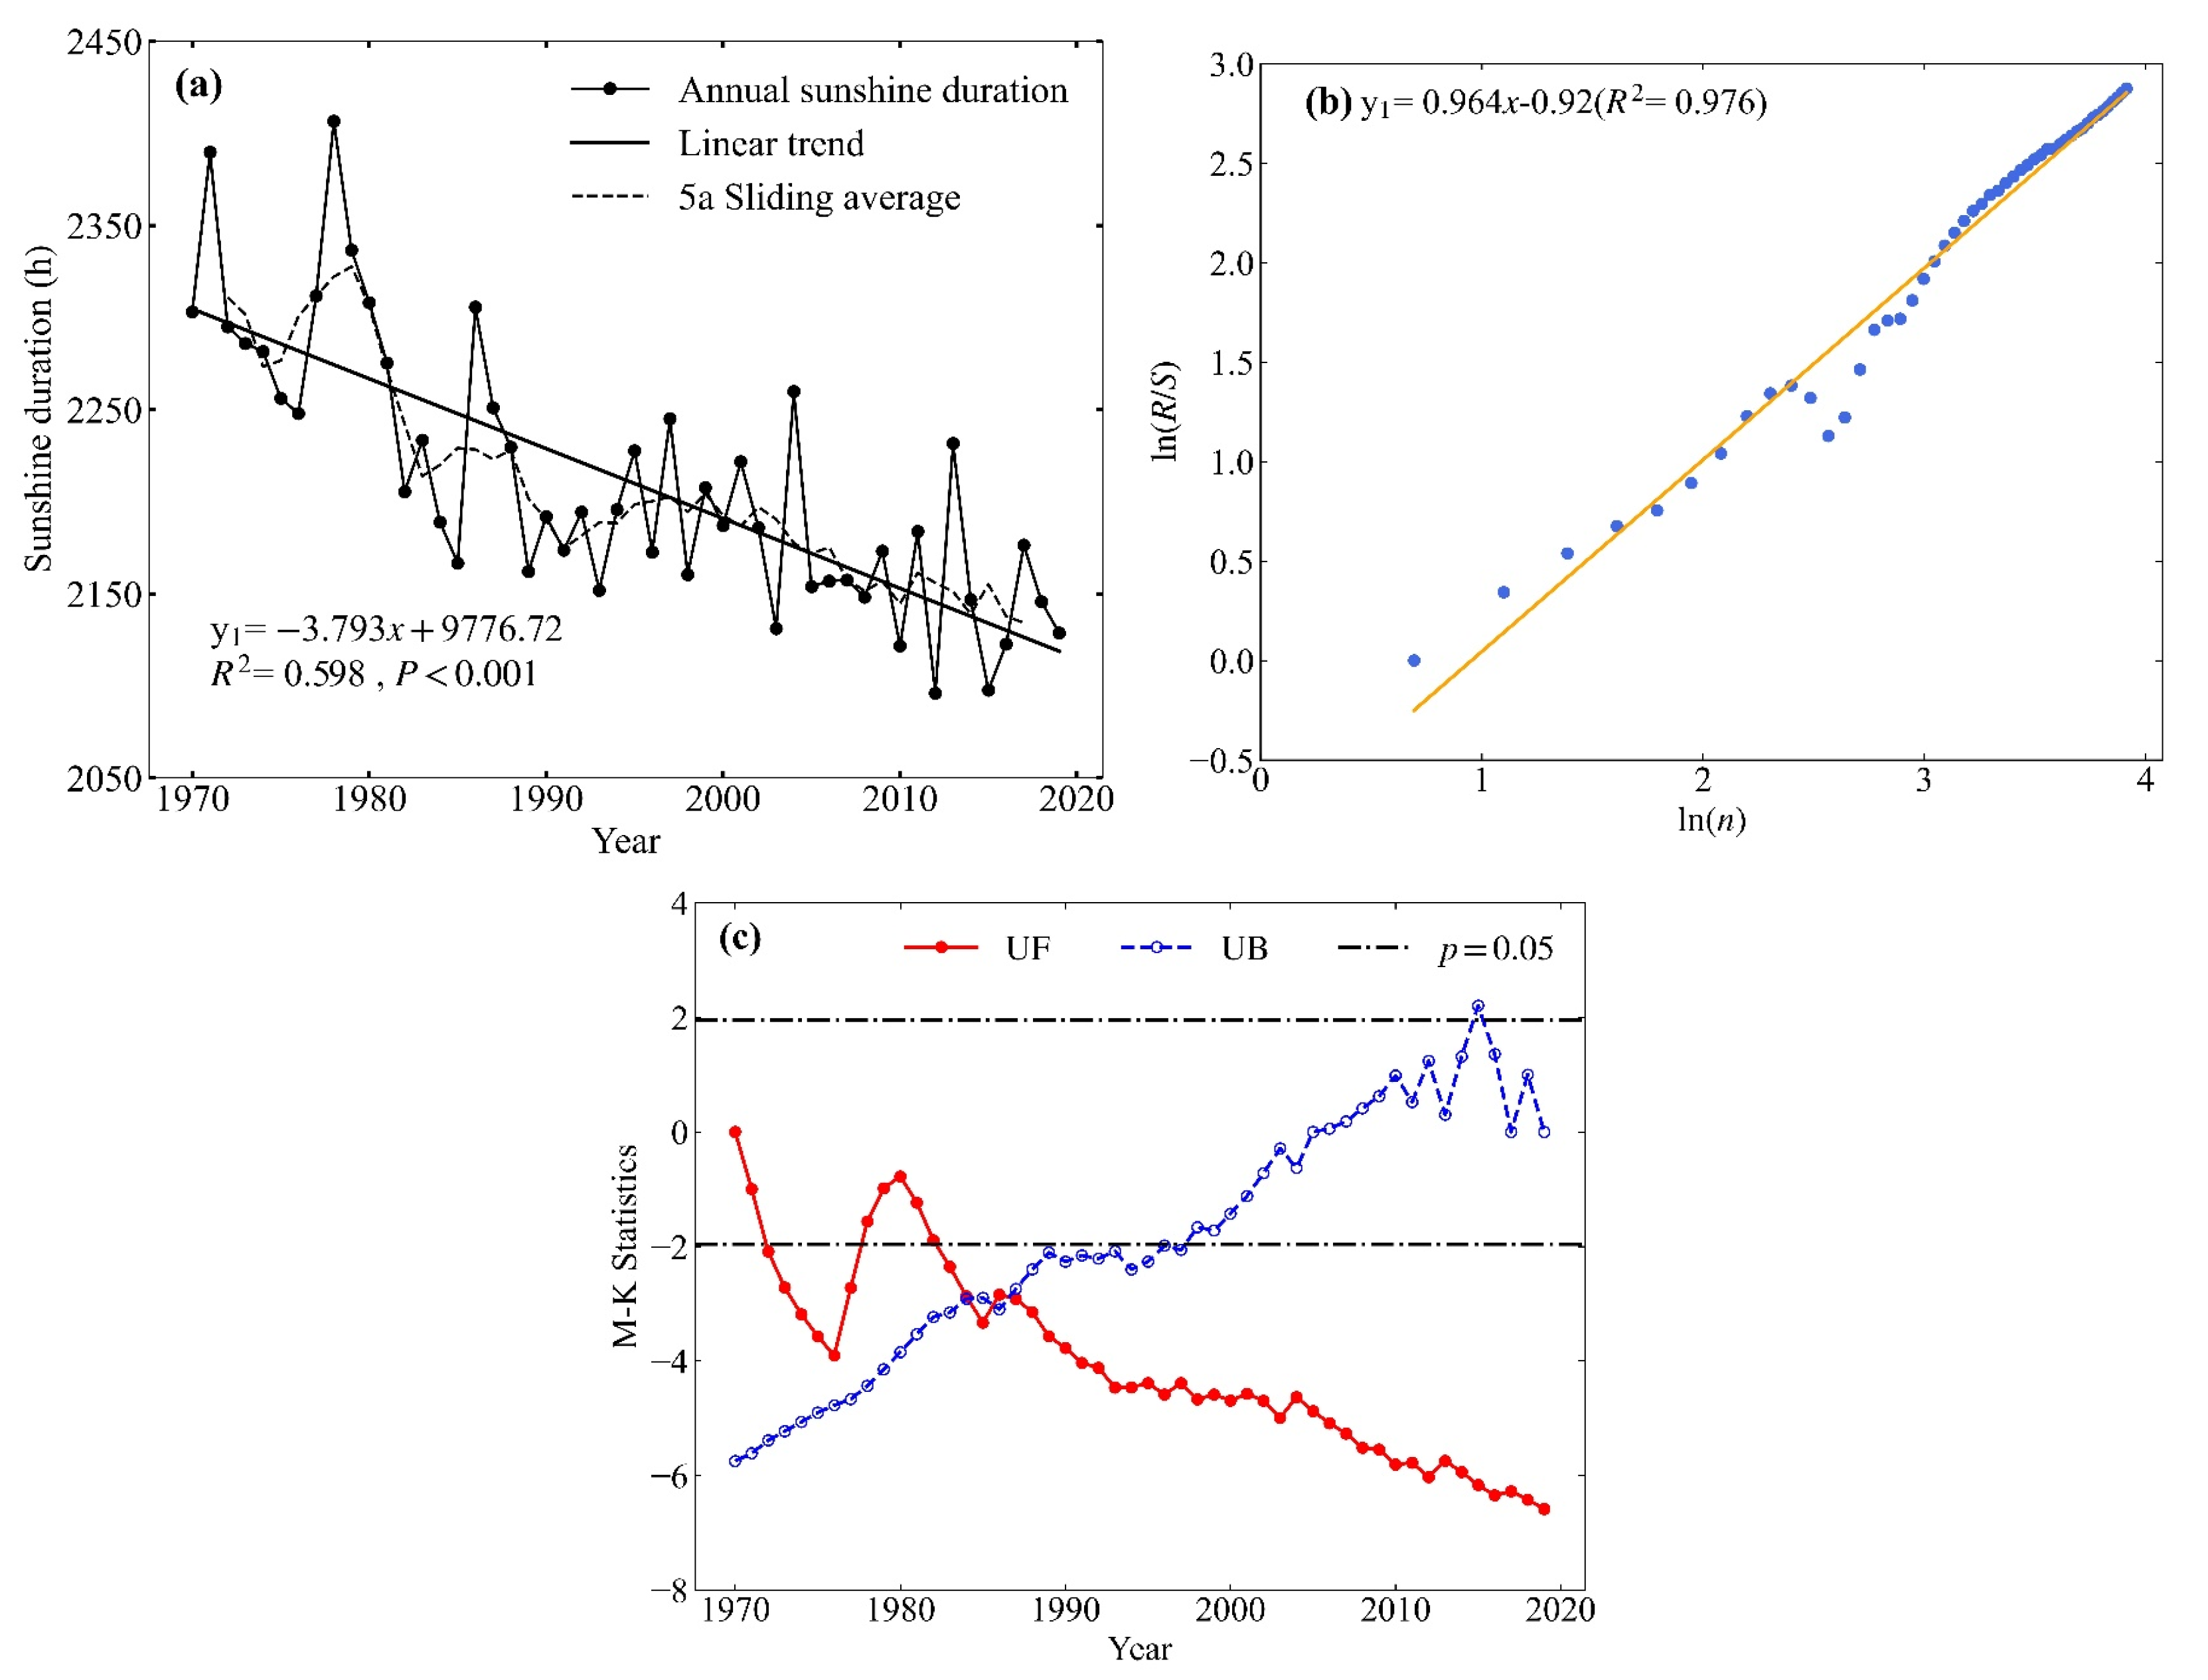
Figure 1. (a) Inter-annual variation, (b) Hurst index and (c) M–K mutation test of the annual SD in China (UF and UB refer to the positive sequence curve and reverse sequence curve, respectively; the same is true below).
Atmosphere 13 02015 g001
Figure 2. Variations of SD in (a) Spring, (b) Summer, (c) Autumn and (d) Winter.
Atmosphere 13 02015 g002
Figure 3. Hurst index of SD in (a) Spring, (b) Summer, (c) Autumn and (d) Winter.
Atmosphere 13 02015 g003
Figure 4. M–K mutation test of SD in (a) Spring, (b) Summer, (c) Autumn, and (d) Winter.
Atmosphere 13 02015 g004
Figure 5. Spatial distribution of SD (a) and climate tendency rate (b) in China.
Atmosphere 13 02015 g005
Figure 6. Spatial distribution (a) and time coefficient (b) of the first mode.
Atmosphere 13 02015 g006
Figure 7. Spatial distribution (a) and time coefficient (b) of the second mode.
Atmosphere 13 02015 g007
Figure 8. Partial correlation coefficient of SD with wind speed (a) and precipitation (b) (• indicates sites that passed the p < 0.05 significance test).
Atmosphere 13 02015 g008
Figure 9. Inter-annual variations of SD in (a) Xinjiang, (b) Pearl River Delta, (c) Beijing-Tianjin-Hebei and (d) Yangtze River Delta.
Atmosphere 13 02015 g009
Table 1. The variance contribution rate and cumulative variance rate (unit: %) of the first eight modes.
ModeVariance Contribution RateCumulative Variance Rate
EOF129.8129.81
EOF28.9338.74
EOF37.1945.93
EOF46.1152.04
EOF55.7357.77
EOF64.1061.88
EOF73.5165.39
EOF83.0868.47
Table 2. Correlation coefficient between annual and seasonal SD and influencing factors (*, ** and *** refer to passing the p < 0.05, p < 0.01 and p < 0.001 significance tests, respectively).
TimeInfluencing Factors
TemperatureRelative HumidityPrecipitationWind Speed
Spring0.097−0.499 ***−0.45 **0.271
Summer−0.2690.113−0.483 ***0.739 ***
Autumn−0.278−0.41 **−0.548 ***0.368 **
Winter−0.012−0.406 **−0.602 ***0.482 ***
Annual−0.563 ***0.236−0.34 *0.773 ***
Table 3. Partial correlation coefficient between annual and seasonal SD and influencing factors (*, ** and *** refer to passing the p < 0.05, p < 0.01 and p < 0.001 significance tests, respectively).
TimeInfluencing Factors
TemperatureRelative HumidityPrecipitationWind Speed
Spring0.462 **−0.524 ***−0.49 ***0.732 ***
Summer0.413 **0.314 *−0.556 ***0.735 ***
Autumn0.029−0.25−0.523 ***0.582 ***
Winter0.341 *−0.236−0.426 **0.564 ***
Annual0.138−0.061−0.53 ***0.76 ***
Publisher’s Note: MDPI stays neutral with regard to jurisdictional claims in published maps and institutional affiliations.