Article

Coupling Effects of Sandstorm and Dust from Coal Bases on the Atmospheric Environment of Northwest China

1
School of Soil and Water Conservation, Beijing Forestry University, Beijing 100083, China
2
Forest and Grass Investigation and Planning Institute, National Forestry and Grassland Administration, Beijing 100083, China
*
Authors to whom correspondence should be addressed.
Atmosphere 2022, 13(10), 1629; https://doi.org/10.3390/atmos13101629
Submission received: 20 September 2022 / Revised: 30 September 2022 / Accepted: 30 September 2022 / Published: 6 October 2022

Abstract

:
The coupling effects of sandstorm and dust from coal bases themselves can have a major impact on the atmospheric environment as well as on human health. The typical coal resource city of Wuhai in Inner Mongolia was selected in order to study these impacts during a severe sandstorm event in March 2021. Particulate matter (PM1, PM2.5 and PM10) and total suspended particulate matter (TSP) samples were collected during the sandstorm event of 15–19 March 2021 and non-sandstorm weather (11–13 March 2021) and analyzed for their chemical composition. The concentrations of PM1, PM2.5, PM10 and TSP in Wuhai city during the sandstorm were 2.2, 2.6, 4.8 and 6.0 times higher than during non-sandstorm days, respectively. Trace metals concentrations in particles of different sizes generally increased during the sandstorm, while water-soluble ions decreased. Positive matrix fraction (PMF) results showed that the main sources of particles during both sandstorm and non-sandstorm days were industrial emissions, traffic emissions, combustion sources and dust. The proportion of industrial emissions and combustion sources increased compared with non-sandstorm days, while traffic emissions and dust decreased. The backward trajectory analysis results showed that airflows were mainly transported over short distances during non-sandstorm days, and high concentration contribution source areas were from southern Ningxia, southeast Gansu and western Shaanxi. The airflow was mainly transported over long distances during the sandstorm event, and high concentration contribution source areas were from northwestern Inner Mongolia, southern Russia, northern and southwestern Mongolia, and northern Xinjiang. A health risk analysis showed that the risk to human health during sandstorm days related to the chemical composition of particles was generally 1.2–13.1 times higher than during non-sandstorm days. Children were more susceptible to health risks, about 2–6.3 times more vulnerable than adults to the risks from heavy metals in the particles under both weather conditions.

1. Introduction

Sandstorms usually occur when strong winds draw large amounts of sand and dust from exposed dry soil into the atmosphere. This can cause wind erosion, sand burial and land degradation. At the same time, the accumulation of large amounts of dust particles can reduce atmospheric visibility [1], damage crop growth and pollute the natural environment. In addition, dust containing various toxic chemicals, germs, etc. can penetrate the human mouth, nose, eyes and ears through protective layers of clothing, and cause respiratory diseases [2,3,4]. Sandstorms often occur in arid and semi-arid areas due to the sparse vegetation and loose soil on the underlying surface [5,6,7,8]. Although some studies have found an overall decreasing trend in the number and intensity of spring sandstorm events in East Asia [9], the study of several dust events in Asia in recent years has shown that the pollution caused by dust aerosols may still have significant impacts on the regional atmosphere, health conditions and socio-economic activities [10,11,12,13,14].
Northwest China has a dry climate and frequent high winds, making it a sandstorm-prone area. Sandstorms mainly occur in spring [15]. With the rapid socio-economic development and urbanization of the area, excessive land development and cultivation have resulted in a large amount of bare and loose soil, which provides a large source of dust to feed sandstorms. In addition, the region is rich in coal resources, with coal production accounting for 30% of the total coal production in China. The region is dotted with numerous open-pit and underground coal mines. Predatory and extensive mining of coal resources has resulted in surface subsidence, reduced vegetation cover and loose soil, the combined effects of which release dust into the atmosphere when sandstorms occur. Coupling effects can occur when sandstorms mix with dust from coal bases themselves, degrading the atmospheric environment in affected regions and even globally [16]. The coupling effects are mainly reflected in the chemical composition of local atmospheric particulate matter and its concentration and pollutant sources, together with the human health response. For instance, the occurrence of sandstorms can lead to an increase in the concentration of some dust tracers (i.e., Al, Ca, Fe, Ti) [17], while the amount of water-soluble ions varies between particle sizes [17,18]. However, the magnitude of the effects arising from this coupling is unknown. Previous studies mainly focused on sandstorms, including the detection of desert dust [5,19,20], analysis of dust composition and properties [7,21,22,23], and observation and model simulation of long-range dust transport [24,25,26,27]. Few studies have been conducted on the source apportionment of pollutants, the local atmospheric environment and the impact on human health under the coupling effects of sandstorm and local dust.
On 15 March 2021, affected by strong wind behind the frontal cyclone cloud system, a severe sandstorm occurred in Inner Mongolia, northern North China, western Northeast China and eastern Northwest China [28]. This was the most intense and widespread dusty weather process that China had experienced in the past 10 years. The optical properties of aerosols and the changes of weather conditions have been studied in detail during this sandstorm occurrence [16]. However, the influence of this sandstorm coupled with the dust of coal mining cities has not yet been studied. The understanding of this coupling effect can provide a reference basis for the prevention of air pollution in coal resource cities, and for the collaborative management of air pollution across regions. In this study, we compared and analyzed the effects of particulate matter on environment and human health during sandstorm and non-sandstorm weather from the perspective of particle composition. Particulate matter (PM1, PM2.5 and PM10) and total suspended particulate matter (TSP) samples were collected and analyzed for their chemical composition during sandstorm and non-sandstorm days in Wuhai, Inner Mongolia, a typical coal resource city in the northwest arid desert region. The main aims of the study were (1) to compare the changes of particulate matter concentrations and elemental concentrations during sandstorm and non-sandstorm days; and (2) to analyze the difference of pollutant sources and risks to human health during sandstorm and non-sandstorm days using a Positive Matrix Fraction (PMF) model and backward trajectory analysis.

2. Data Sources and Methods

2.1. Study Area

Wuhai City (106.82° E, 39.67° N) is an emerging industrial city in the western part of the Inner Mongolia Autonomous Region, with coal reserves of more than 3 billion tons, mainly high-quality coking coal, accounting for about 60% of the coking coal reserves in the whole autonomous region. It is located in a warm temperate zone, which is a continental monsoon climate area. The temperature range is −28.9 to 40.2 °C; the annual average temperature is 10.1 °C. The average annual precipitation is 159.8 mm, and annual average evaporation is 3289 mm. Westerly and northwesterly winds are prevalent in the region, and high wind activity is mainly concentrated in spring (March to May). The wind direction was NNW during this study. Frequent wind and sandy weather there tends to cause more serious wind and sand disasters. The annual number of sandy days is greater than 80 d.

2.2. Satellite Data and Air Pollution Monitoring Data

Since a previous study has found similar spatial and temporal distribution patterns of PM1, PM2.5, PM10 and TSP in the region in spring [29], we presume that their transport and source trajectories are also comparable, so this study focuses on the spatio-temporal distribution and backward trajectory analysis of PM2.5 and PM10. Sandstorm transport data via satellite came from the Desertification Monitoring Center of the National Forestry and Grassland Administration of China. Hourly average PM2.5 and PM10 data were obtained from China Air Quality Online Monitoring and Analysis Platform (https://www.aqistudy.cn/). Four mid-volume atmospheric integrated samplers (YR-6120 for PM1 and PM2.5, KC-6120 for PM10, TH-150D II for TSP) were mounted 6.5 m above the ground surface in the urban area (106.83° E, 39.69° N) of Wuhai at the same time to collect PM1, PM2.5, PM10 and TSP, respectively, at a flow rate of 100 L·min−1. The sampling membrane used 90 mm diameter quartz filters. Air samples were collected during days of sandstorm (15–19 March 2021) and non-sandstorm (11–13 March 2021). Samples were collected twice per day in the daytime (08: 00 to 19:00 local time) and nighttime (19:00 to 08:00 local time), respectively. A total of 64 samples were collected. Before and after sampling, the filter was weighed after being equilibrated in a desiccator for 24 h. The weighed filter was placed in a ziplock bag and stored at 4 °C until the sample was analyzed.

2.3. Chemical Analysis

2.3.1. Metal Elements

One-quarter of the filter membrane sample was selected and placed in a PTFE ablation tube, and 5 mL hydrofluoric acid, 5 mL nitric acid, 5 mL perchloric acid were added. The sample was digested at 200 °C for 4 h until the sample was clarified without precipitation. The cap of the digestion tube was removed, and the process continued to drive the acid at 200 °C until about 1 mL of sample remained, and the volume was fixed to 47 mL. Al, Ba, Fe, Mg, Sr, Ti, Zn, Cr, Cu, Mn, Pb and Sn contents were measured by inductively coupled plasma mass spectrometry (ICP-MS, NexION 350X, PerkinElmer, Germany).

2.3.2. Water-Soluble Inorganic Ions

One-quarter of the filter membrane sample was carefully cut, weighed on an analytical balance, and placed in a sample bottle. Then 100.0 mL of deionized water was added to immerse the filter membrane, which was then covered and soaked for 30 min. It was then placed in an ultrasonic cleaner for ultrasonic extraction for 20 min and the extraction liquid was filtered off by a suction filter and poured into a sample tube. A suite of water-soluble ions (Ca2+, Mg2+, Na+, K+, F, Cl, NO3 and SO42−) was measured by ion chromatography (ICS-900, Thermo, USA).

2.4. Source Identification Methods

2.4.1. PMF

PMF version 3.0 model software as recommended by the U.S. Environmental Protection Agency (USEPA) requires no source list and does not limit the number of sources [30]. With these strengths, it has been widely applied in source apportionment analyses. In this experiment, samples of the various elements and inorganic water-soluble ions in PM1, PM2.5, PM10 and TSP were selected for analysis to determine the main sources of airborne particulate matter components from Wuhai city. The detailed principles of PMF model are described in Supplementary S1.

2.4.2. Backward Clustering Trajectory

MeteoInfo software, based on the HYSPLIT4 model developed by the Chinese Academy of Meteorological Sciences [31] was used to simulate the backward trajectory of air masses. In this study, Wuhai City (106.57° E, 38.19° N) was selected as the receptor point of the backward trajectory. The trajectory was extended backward for 72 h for the sandstorm periods (15–19 March 2021) and non-sandstorm periods (11–13 March 2021). The simulated altitude was 500 m, which represents the effect of pollutant transport above the inversion layer, and optimizes the simulated effect [32,33]. GDAS meteorological data with a spatial resolution of 1° × 1° was provided by the U.S. National Center for Environmental Prediction. Weighted potential source contribution function (PSCF) and Weighted concentration weight trajectories (CWT) can further analyze the source of pollutants, and principles are shown in Supplementary S2 (including Table S1 and Table S2.).

2.5. Health Risk Assessment

Since atmospheric pollutants enter the human body mainly by respiration, this study mainly considers the health risks of metals via the respiratory route for adult males, adult females and children. The calculation of carcinogenic risk (CR) and non-carcinogenic risk (HQ) are shown in Supplementary S3.

3. Results

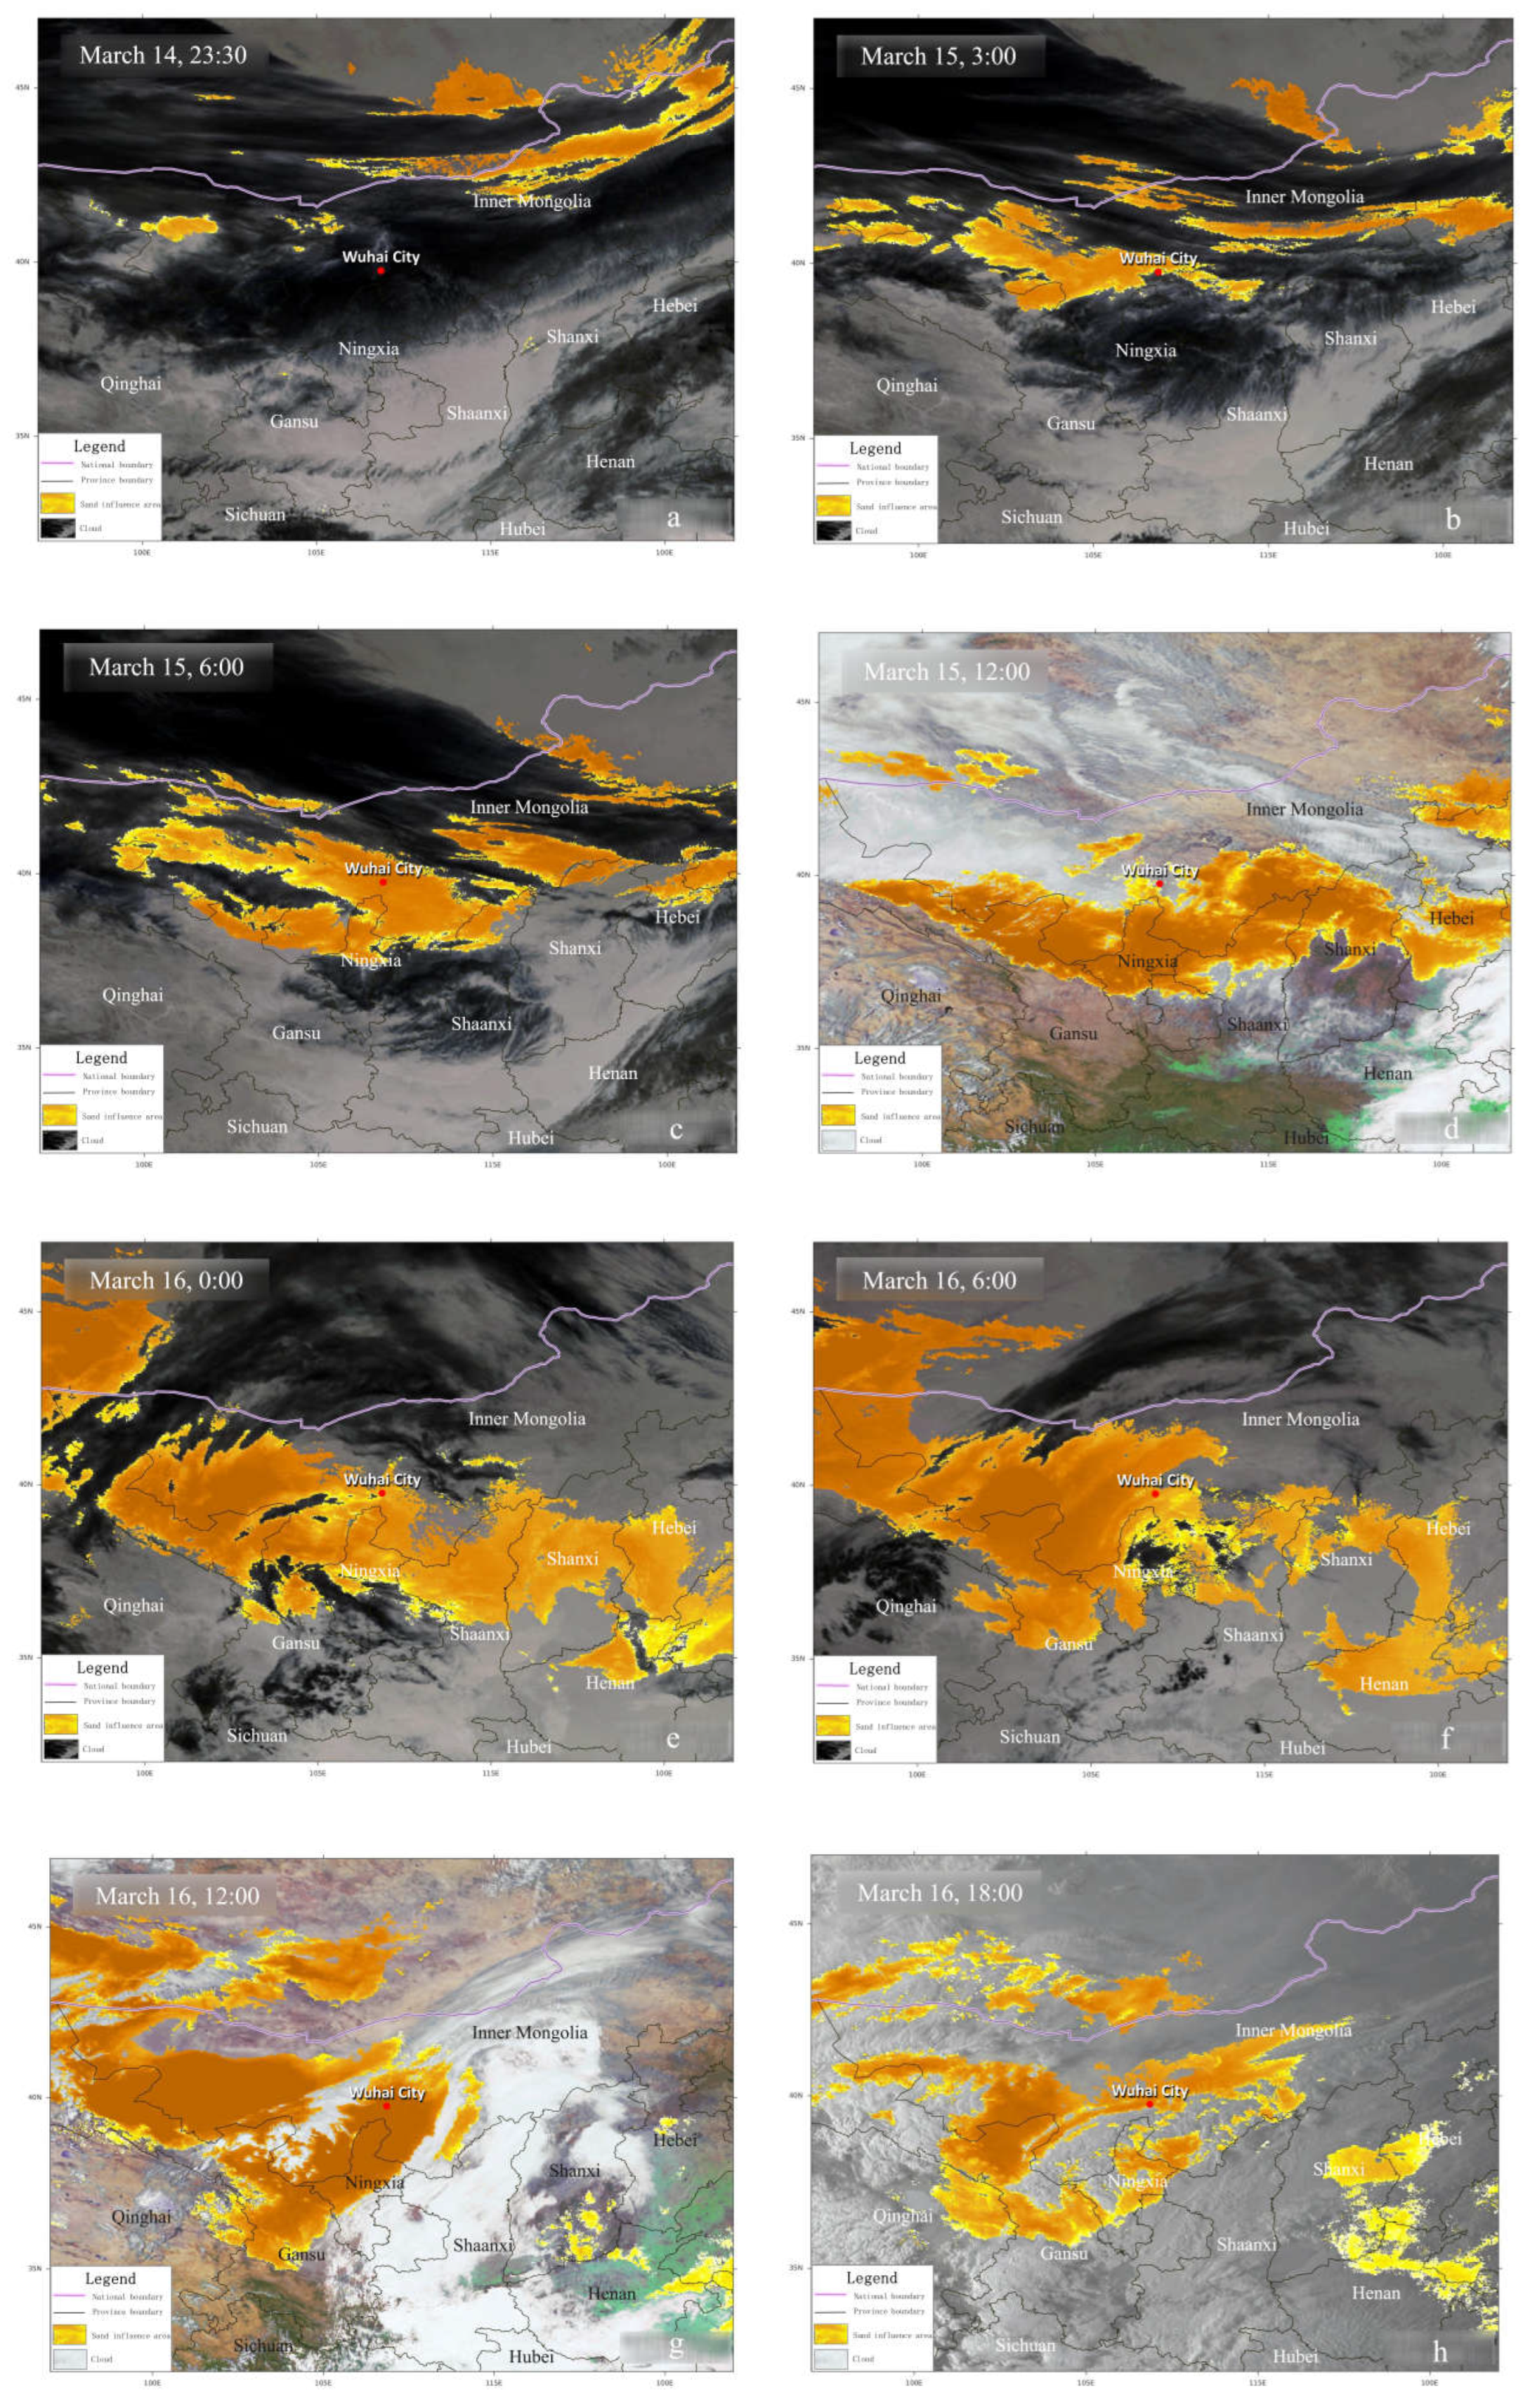
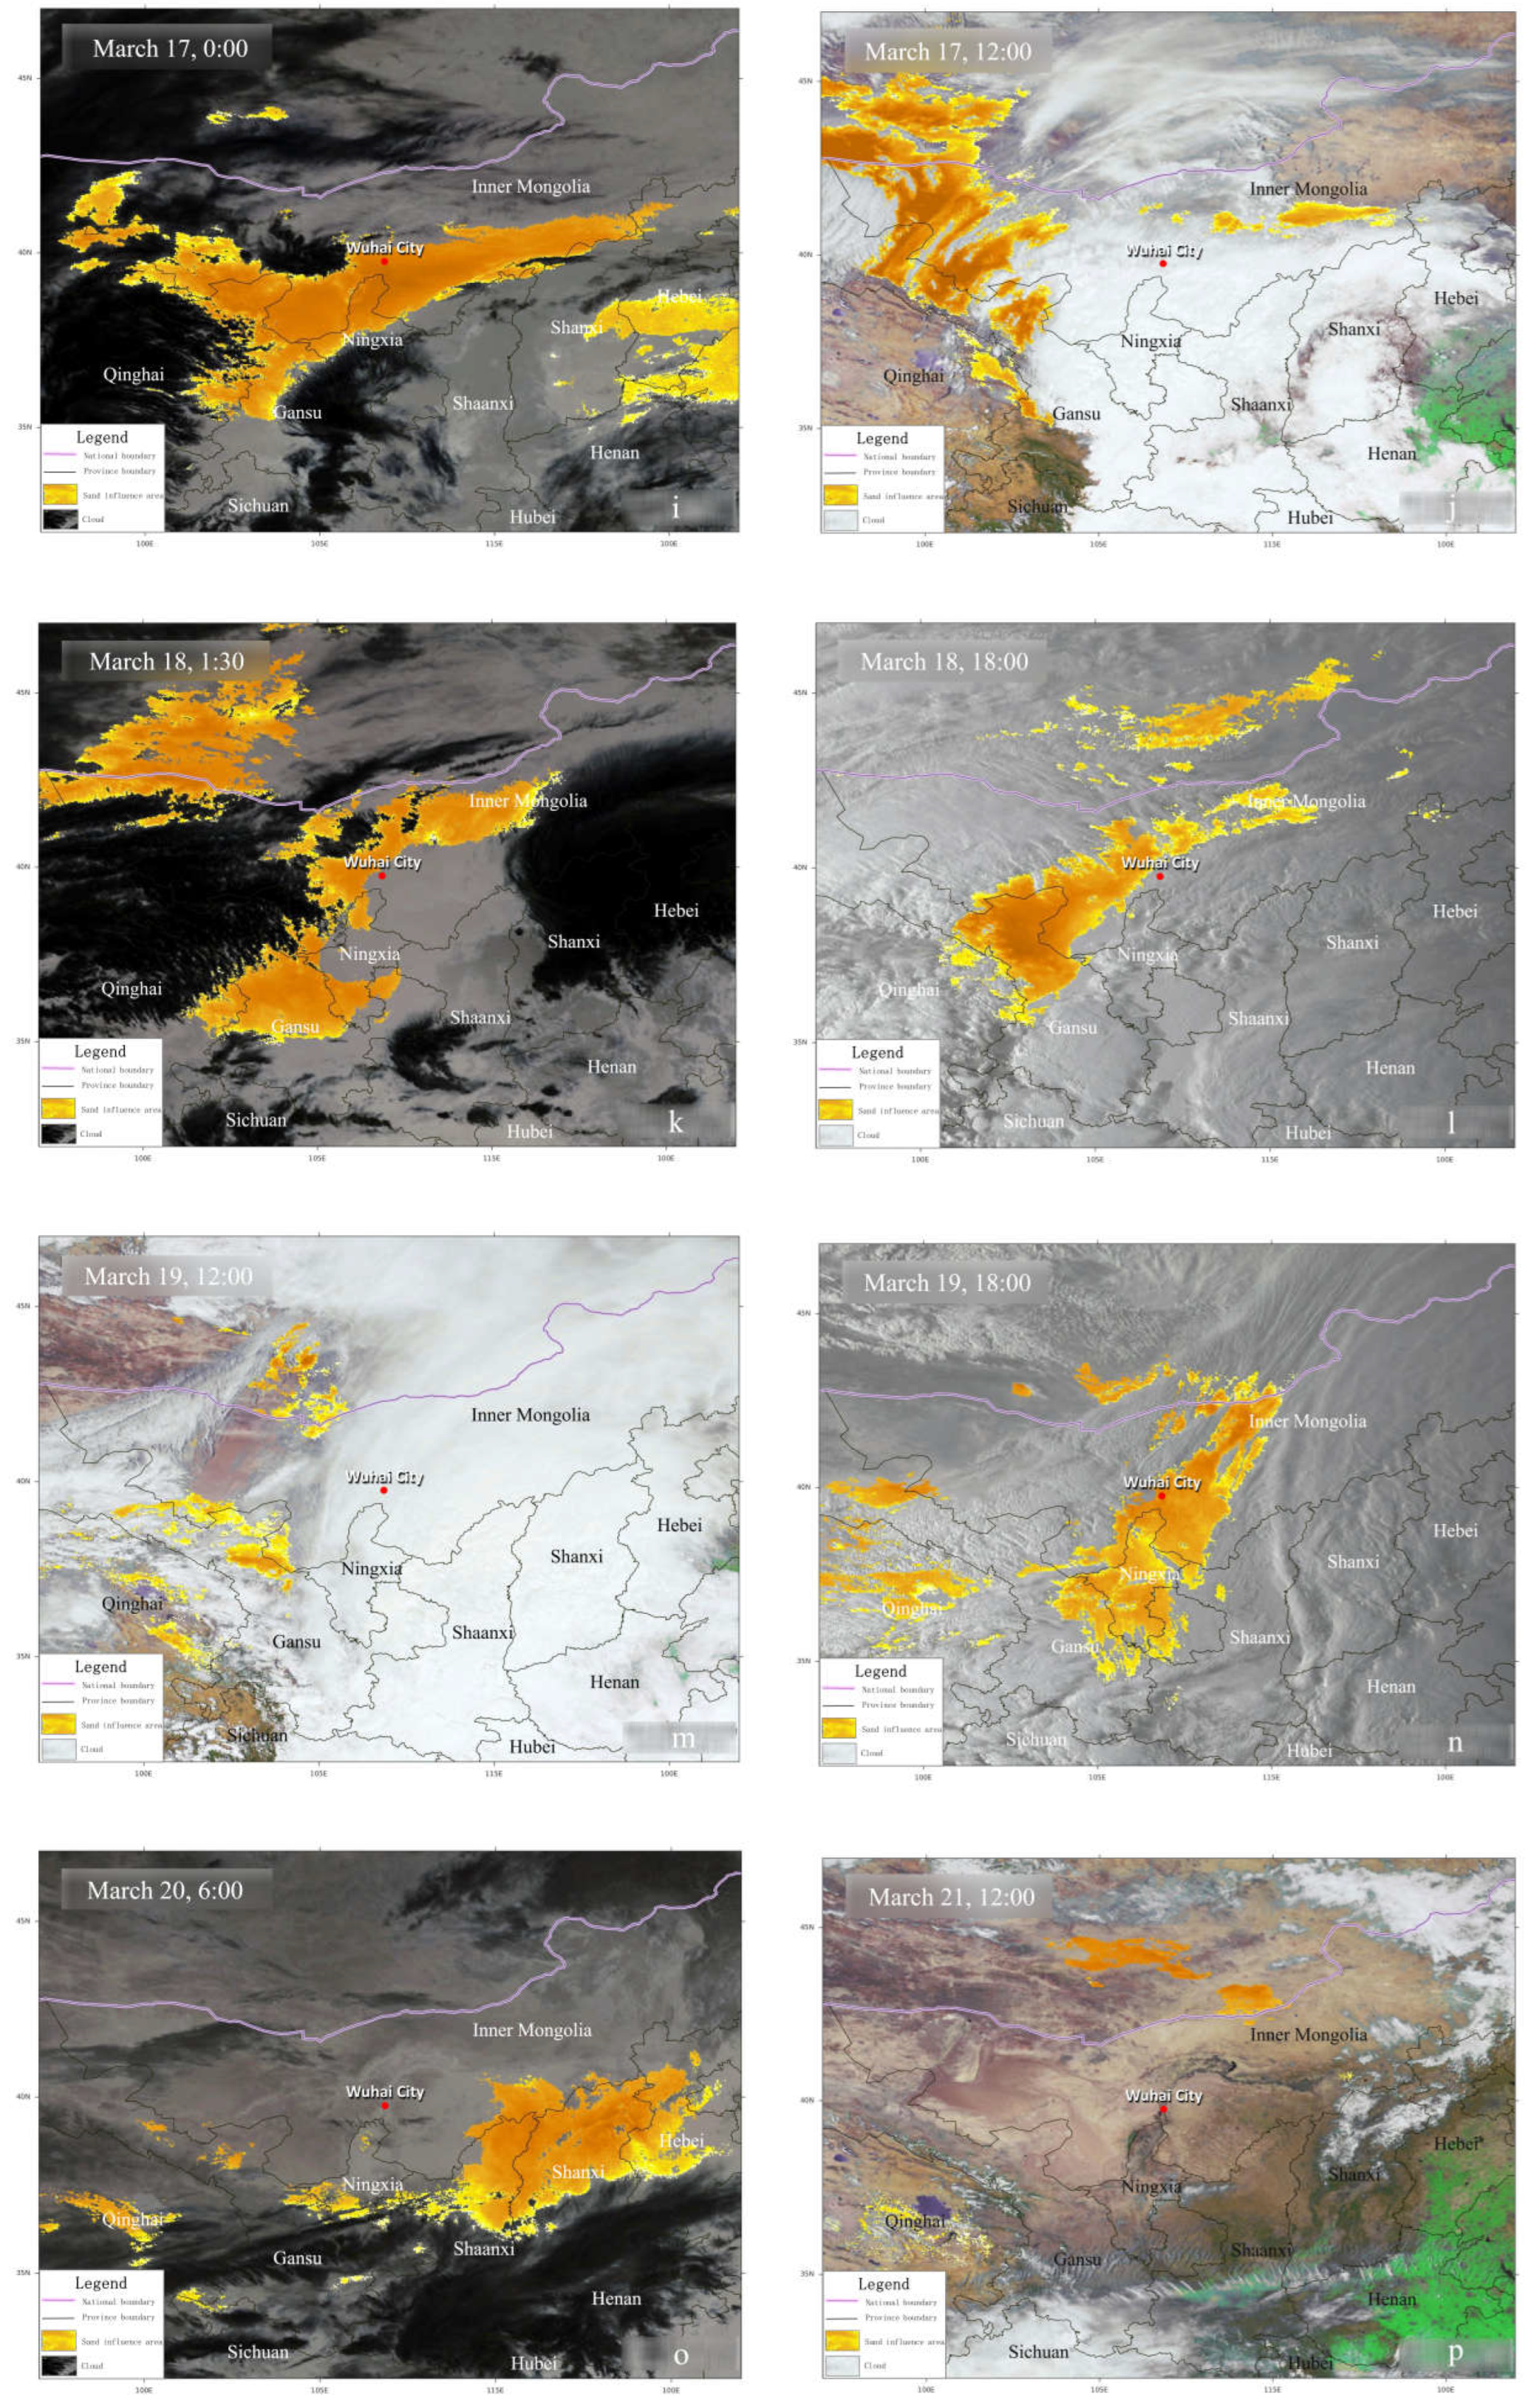
3.1. Sandstorm Transport Process Based on Remote Sensing Observations

A series of images observed by the Sunflower 8 satellite clearly depicted the transport process of this sandstorm event and the main impact areas in northwest China (Figure 1). The sandstorm event began during the night of 14–15 March 2021 (Figure 1a,b). The dust moved eastward and southward from Mongolia and affected most of northern China. The sandstorm continued from March 15 to 19 (Figure 1c–n), and the most severe dust impact was from March 15 to 16. The sandstorm had the widest impact on 15 March at 6 pm to 16 March at 6 pm (Figure 1c–f), involving eastern Gansu, southern Inner Mongolia, northern Shaanxi, north central Ningxia, northern Shanxi, Hebei and other areas. Wuhai was in the center of the sandstorm at this time and was strongly affected by the sandstorm. From 12:00 to 18:00 on 16 March (Figure 1g,h), the dust continued to affect the northwest including Wuhai and surrounding area, while the impact on the central region decreased. During the night of 17 March (Figure 1i), the dust mainly affected eastern Gansu, southern Inner Mongolia and other areas, while during the daytime (Figure 1j), the dust was mainly concentrated in eastern Gansu, western Inner Mongolia and other areas. Dust in Wuhai also dispersed in the daytime on 17 March. The impact of the dust on Inner Mongolia, Gansu, Ningxia and other areas weakened on 18 March (Figure 1k,l), and Wuhai was near the sandstorm but not affected. The impact of the sandstorm on the northwest region diminished significantly on 19 March (Figure 1m). However, dust seriously impacted Inner Mongolia and Ningxia in the evening (18:00) of the 19th (Figure 1n), while Wuhai was also in the center of the sandstorm. The sandstorm then moved eastward (Figure 1o) and dissipated significantly on the 21st (Figure 1p).

3.2. Particulate Matter Concentration Observation

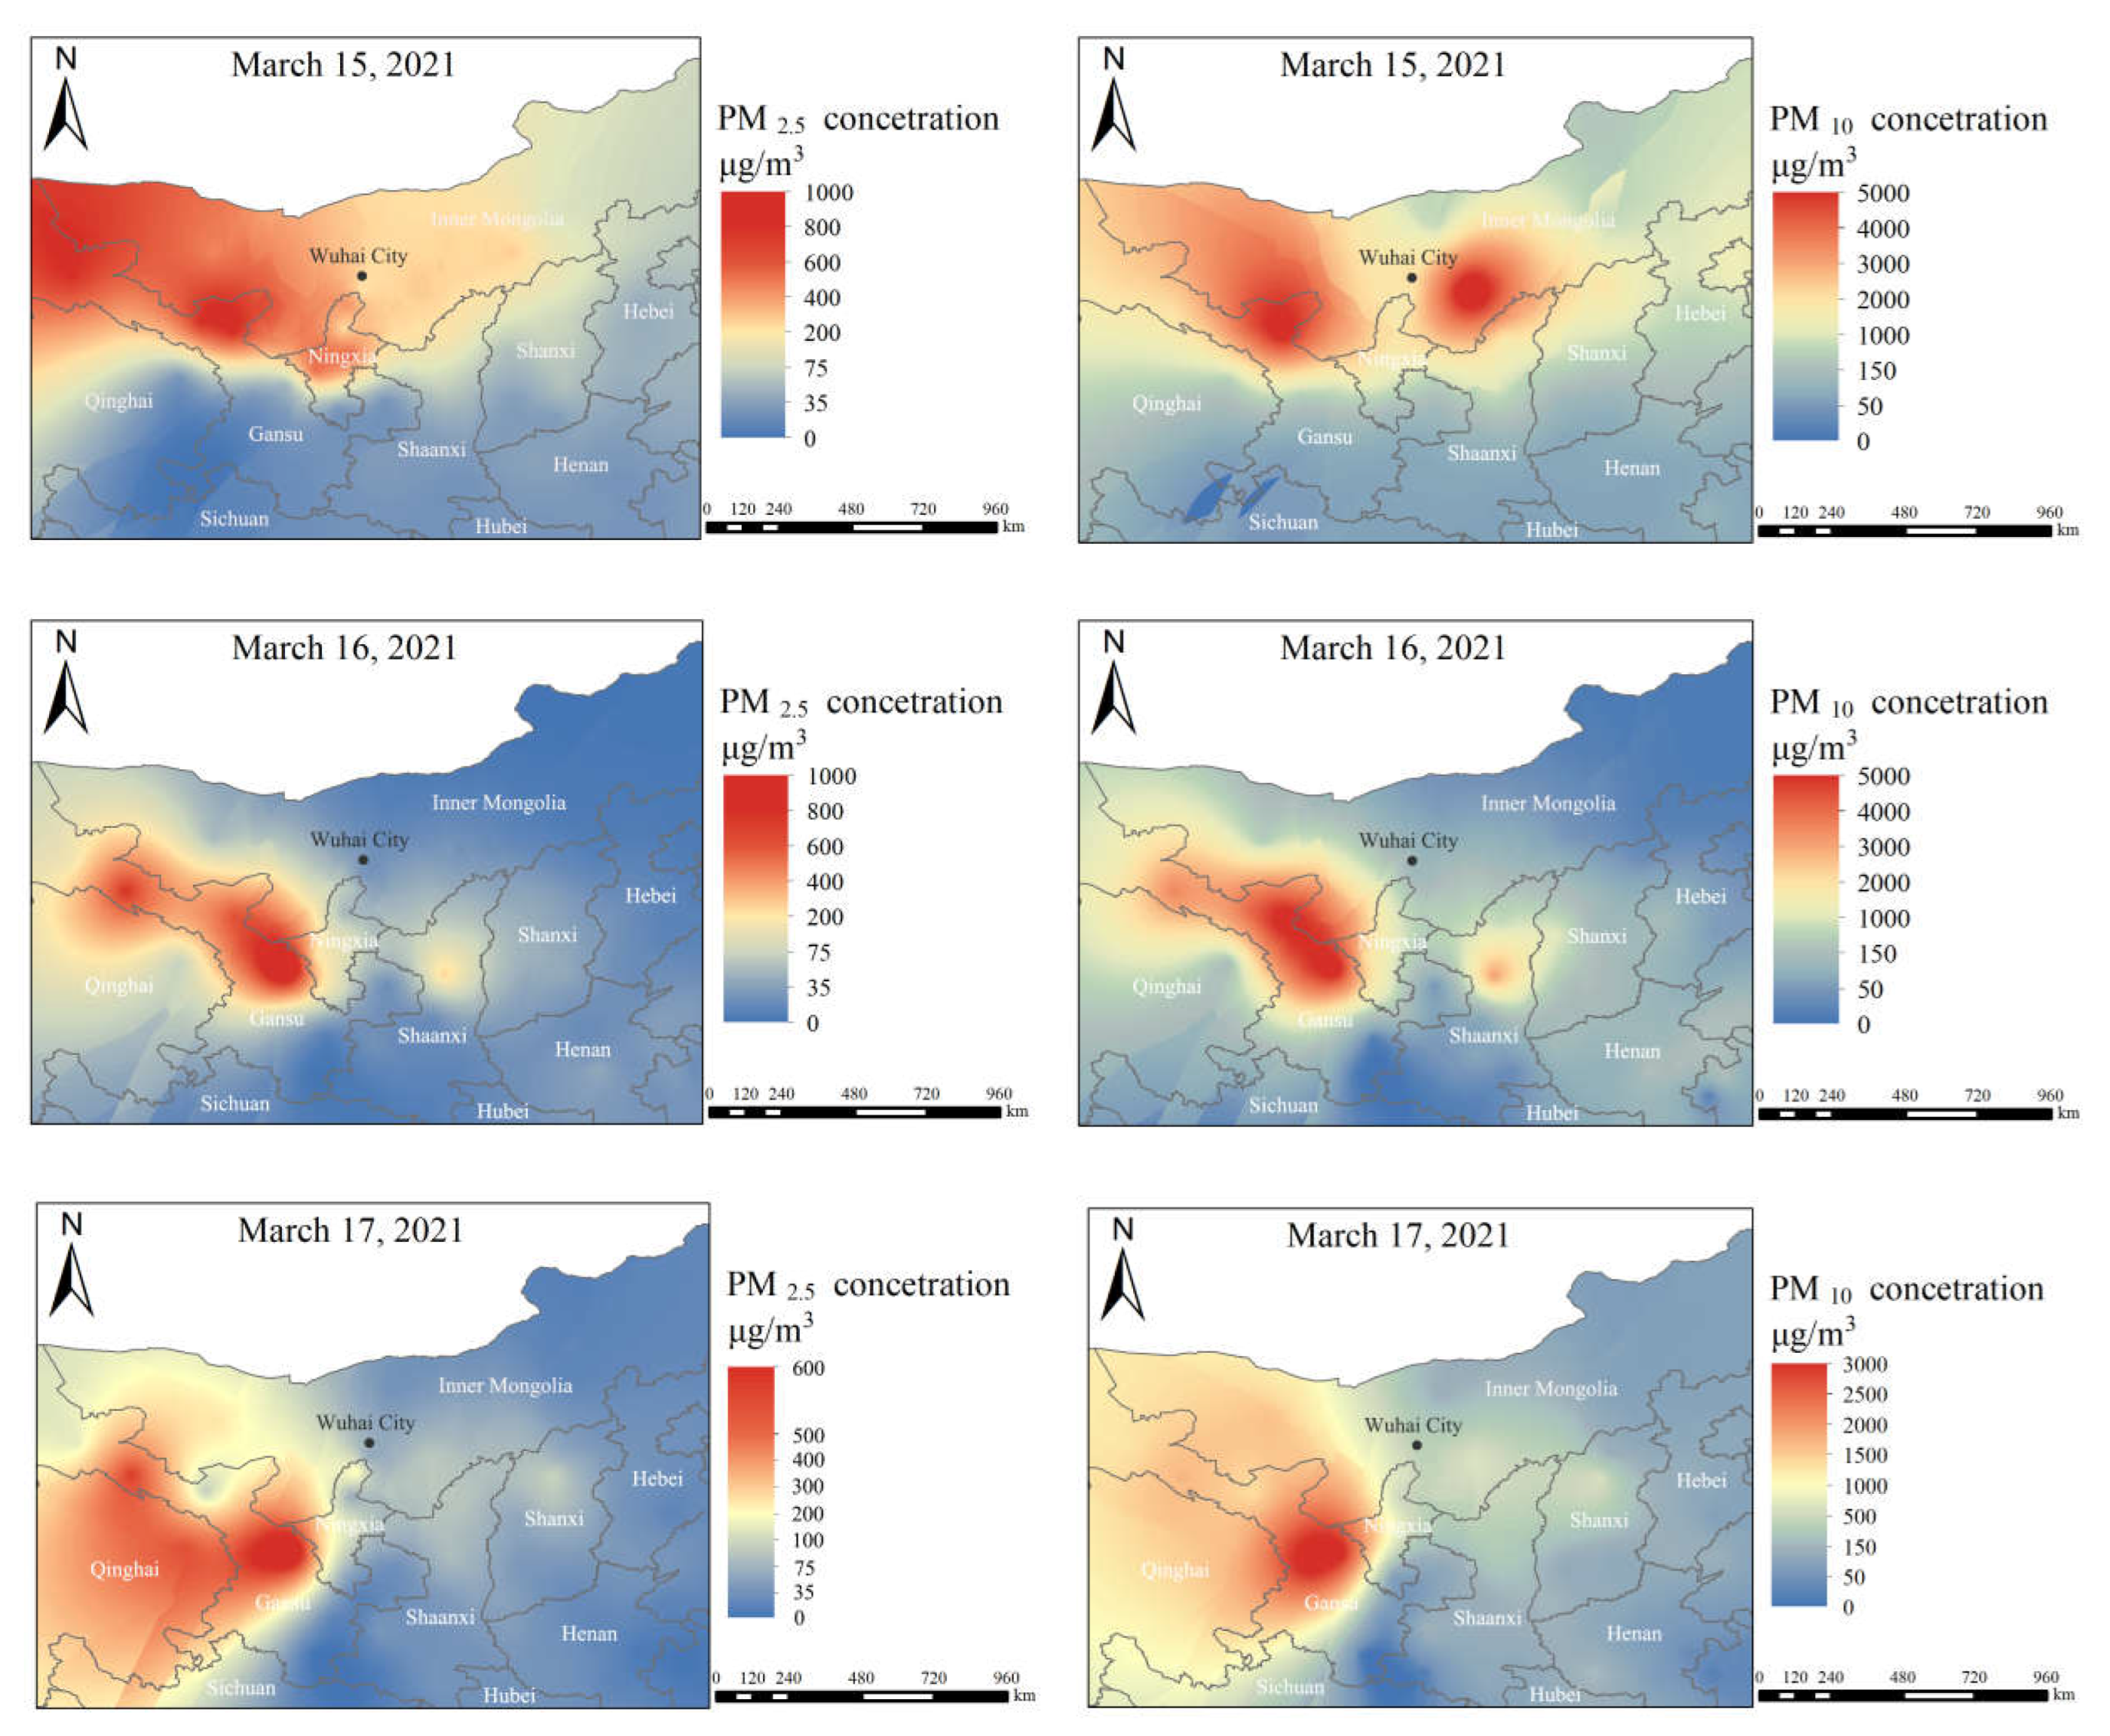
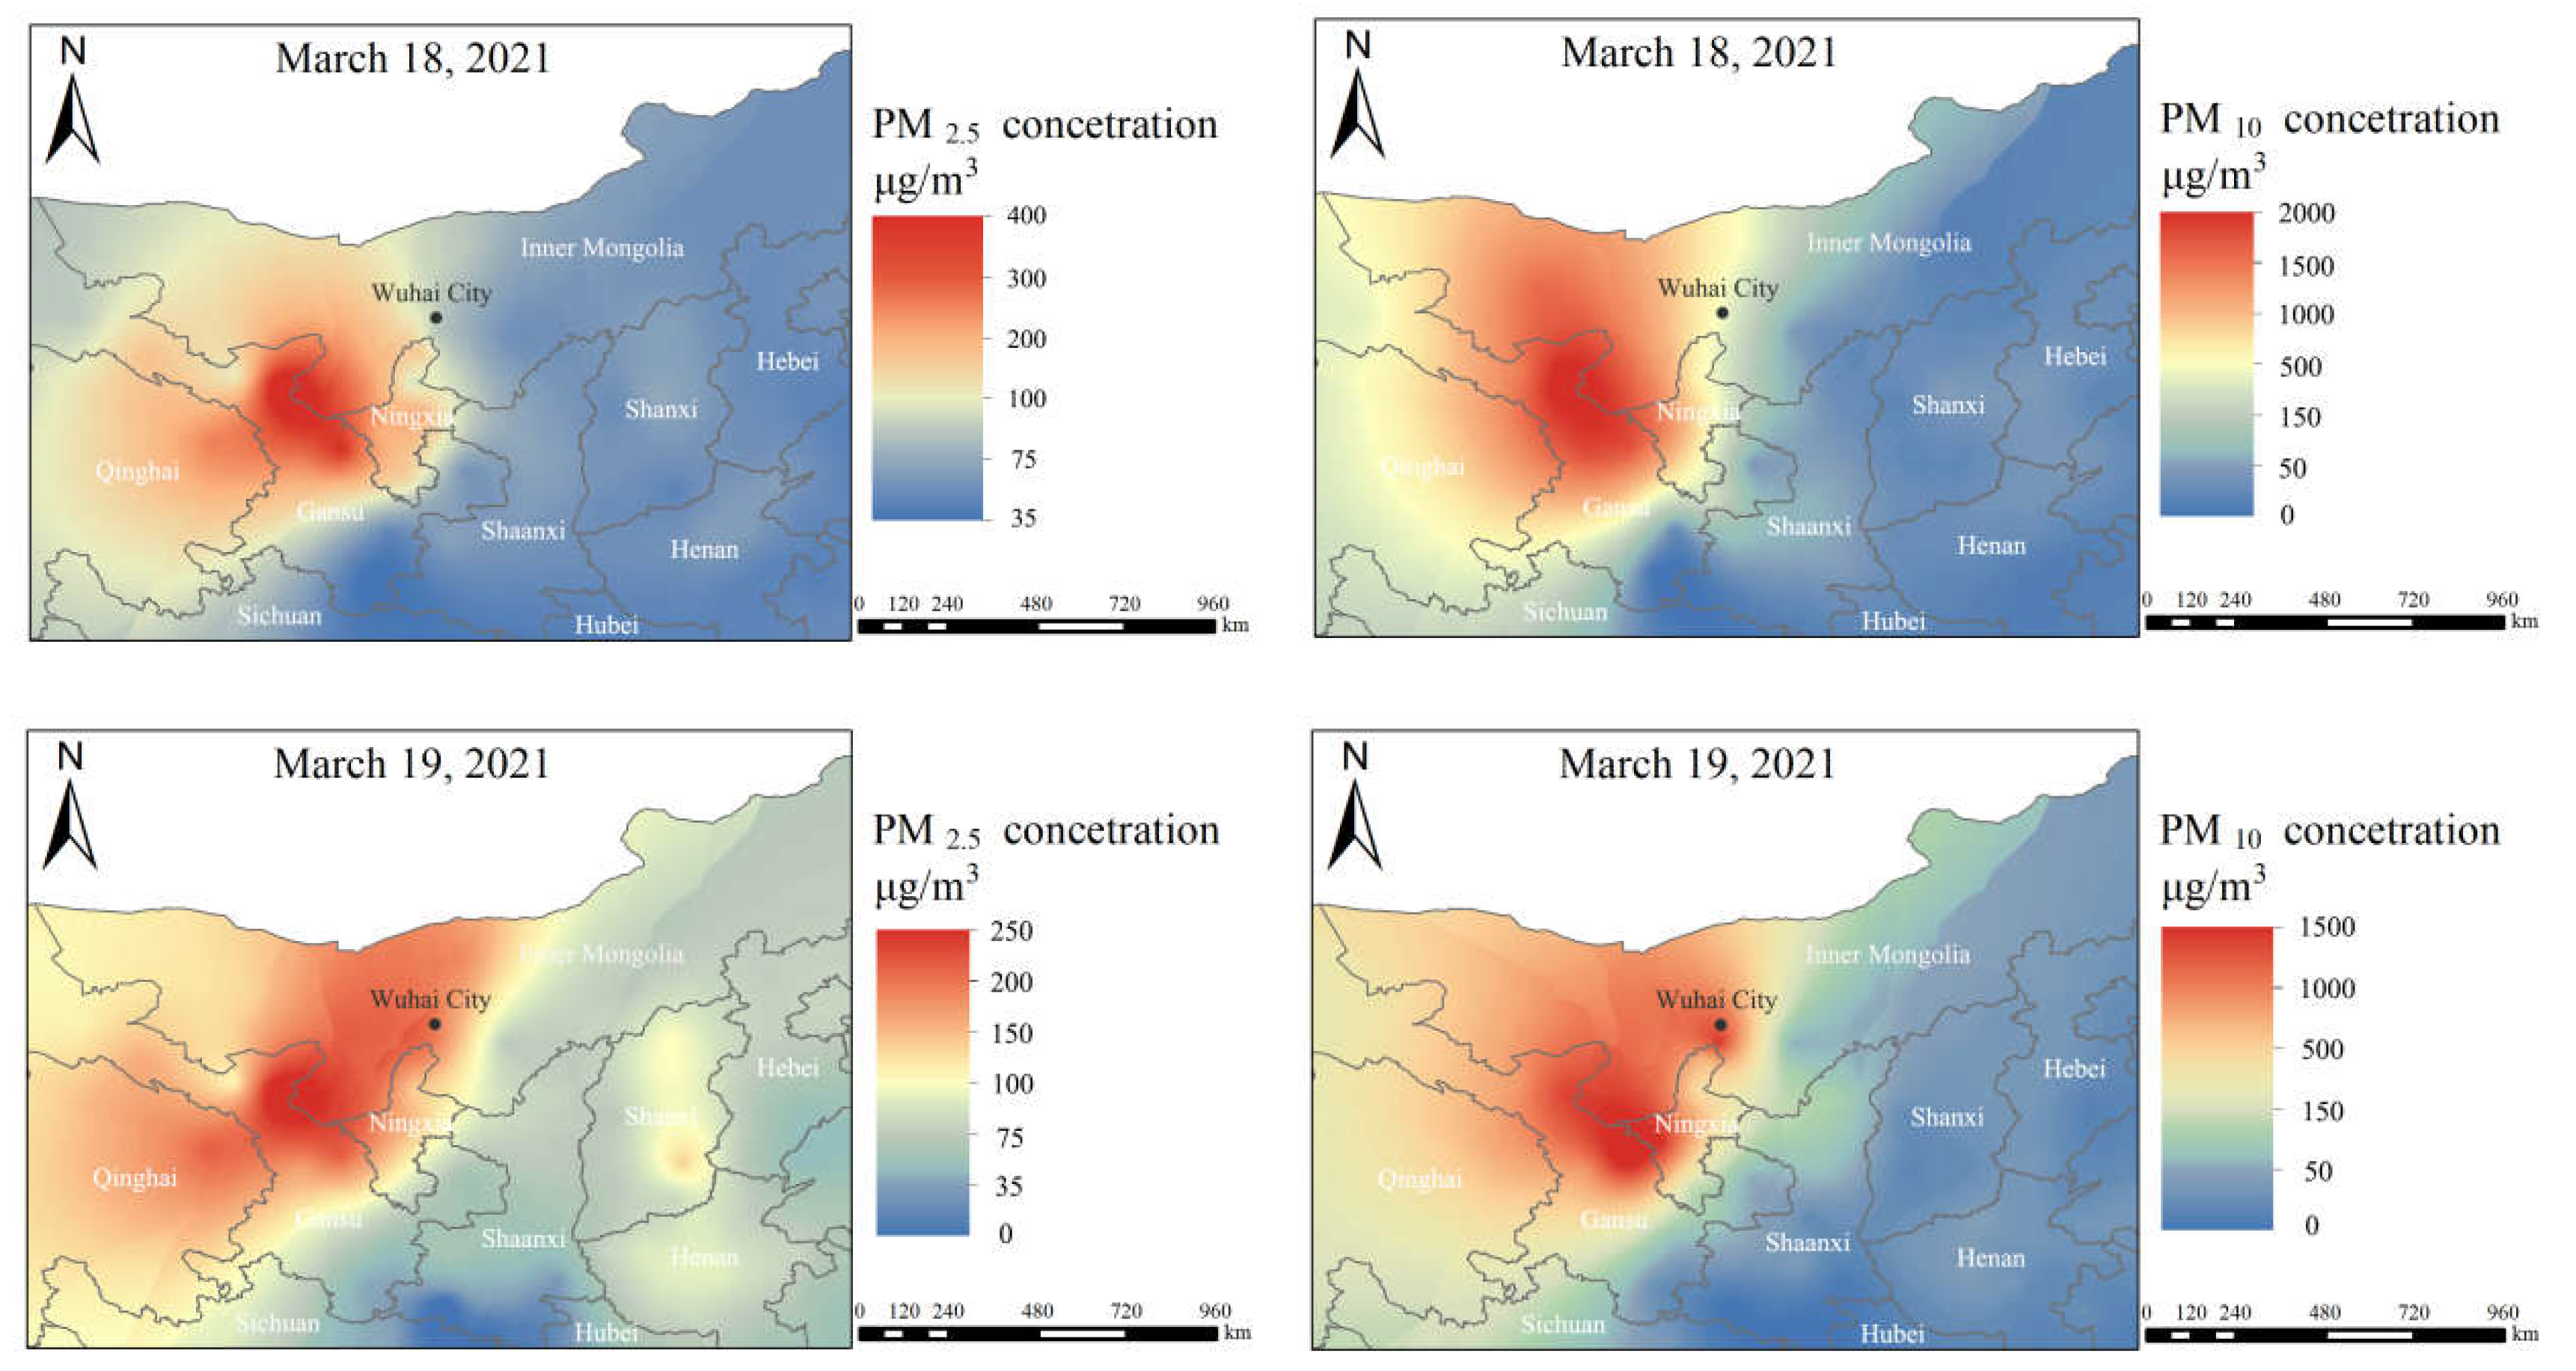
3.2.1. Spatial Distribution

The spatial distribution of particulate matter concentration during the sandstorm (15–19 March) was mapped to study the intensity and extent of this sandstorm (Figure 2). The results showed that the spatial distribution patterns of PM2.5 and PM10 concentrations were similar. The high concentration values were mainly distributed in the Inner Mongolia, Gansu and Ningxia areas. The PM concentrations in most cities in these areas were well above the Level II limit values set by the Standard for Daily Average Concentration Limit (DACL) of China (GB3095–2012) (75, 150 μg m−3; 24-h average) [34]. The high concentration values on March 15 were distributed in north-central Gansu, northern Ningxia and west-central Inner Mongolia, where PM2.5 and PM10 concentrations were above 400 μg/m3 and 1000 μg/m3, respectively. Correspondingly, PM2.5 and PM10 concentrations in Wuhai also reached 451 μg/m3 and 1450 μg/m3, 6 and 10 times higher than DACL (China), respectively. The high concentration values region moved westward on March 16, mainly in east-central Gansu. Correspondingly, PM2.5 and PM10 concentrations in Wuhai were 112 μg/m3 and 790 μg/m3, respectively, which also far exceeded DACL (China). PM concentration gradually decreased from 17–19 March. Areas of high particulate matter concentration were mainly distributed in east-central Gansu and western Inner Mongolia, where PM2.5 and PM10 concentrations reached more than 200 μg/m3 and 1000 μg/m3, respectively. PM2.5 and PM10 concentrations in Wuhai on 17–18 March remained at around 100 μg/m3 and 700 μg/m3, respectively. However, the pollution worsened on March 19, with PM2.5 and PM10 concentrations in Wuhai reaching 160 μg/m3 and 1,074 μg/m3, respectively, two and seven times higher than DACL (China).

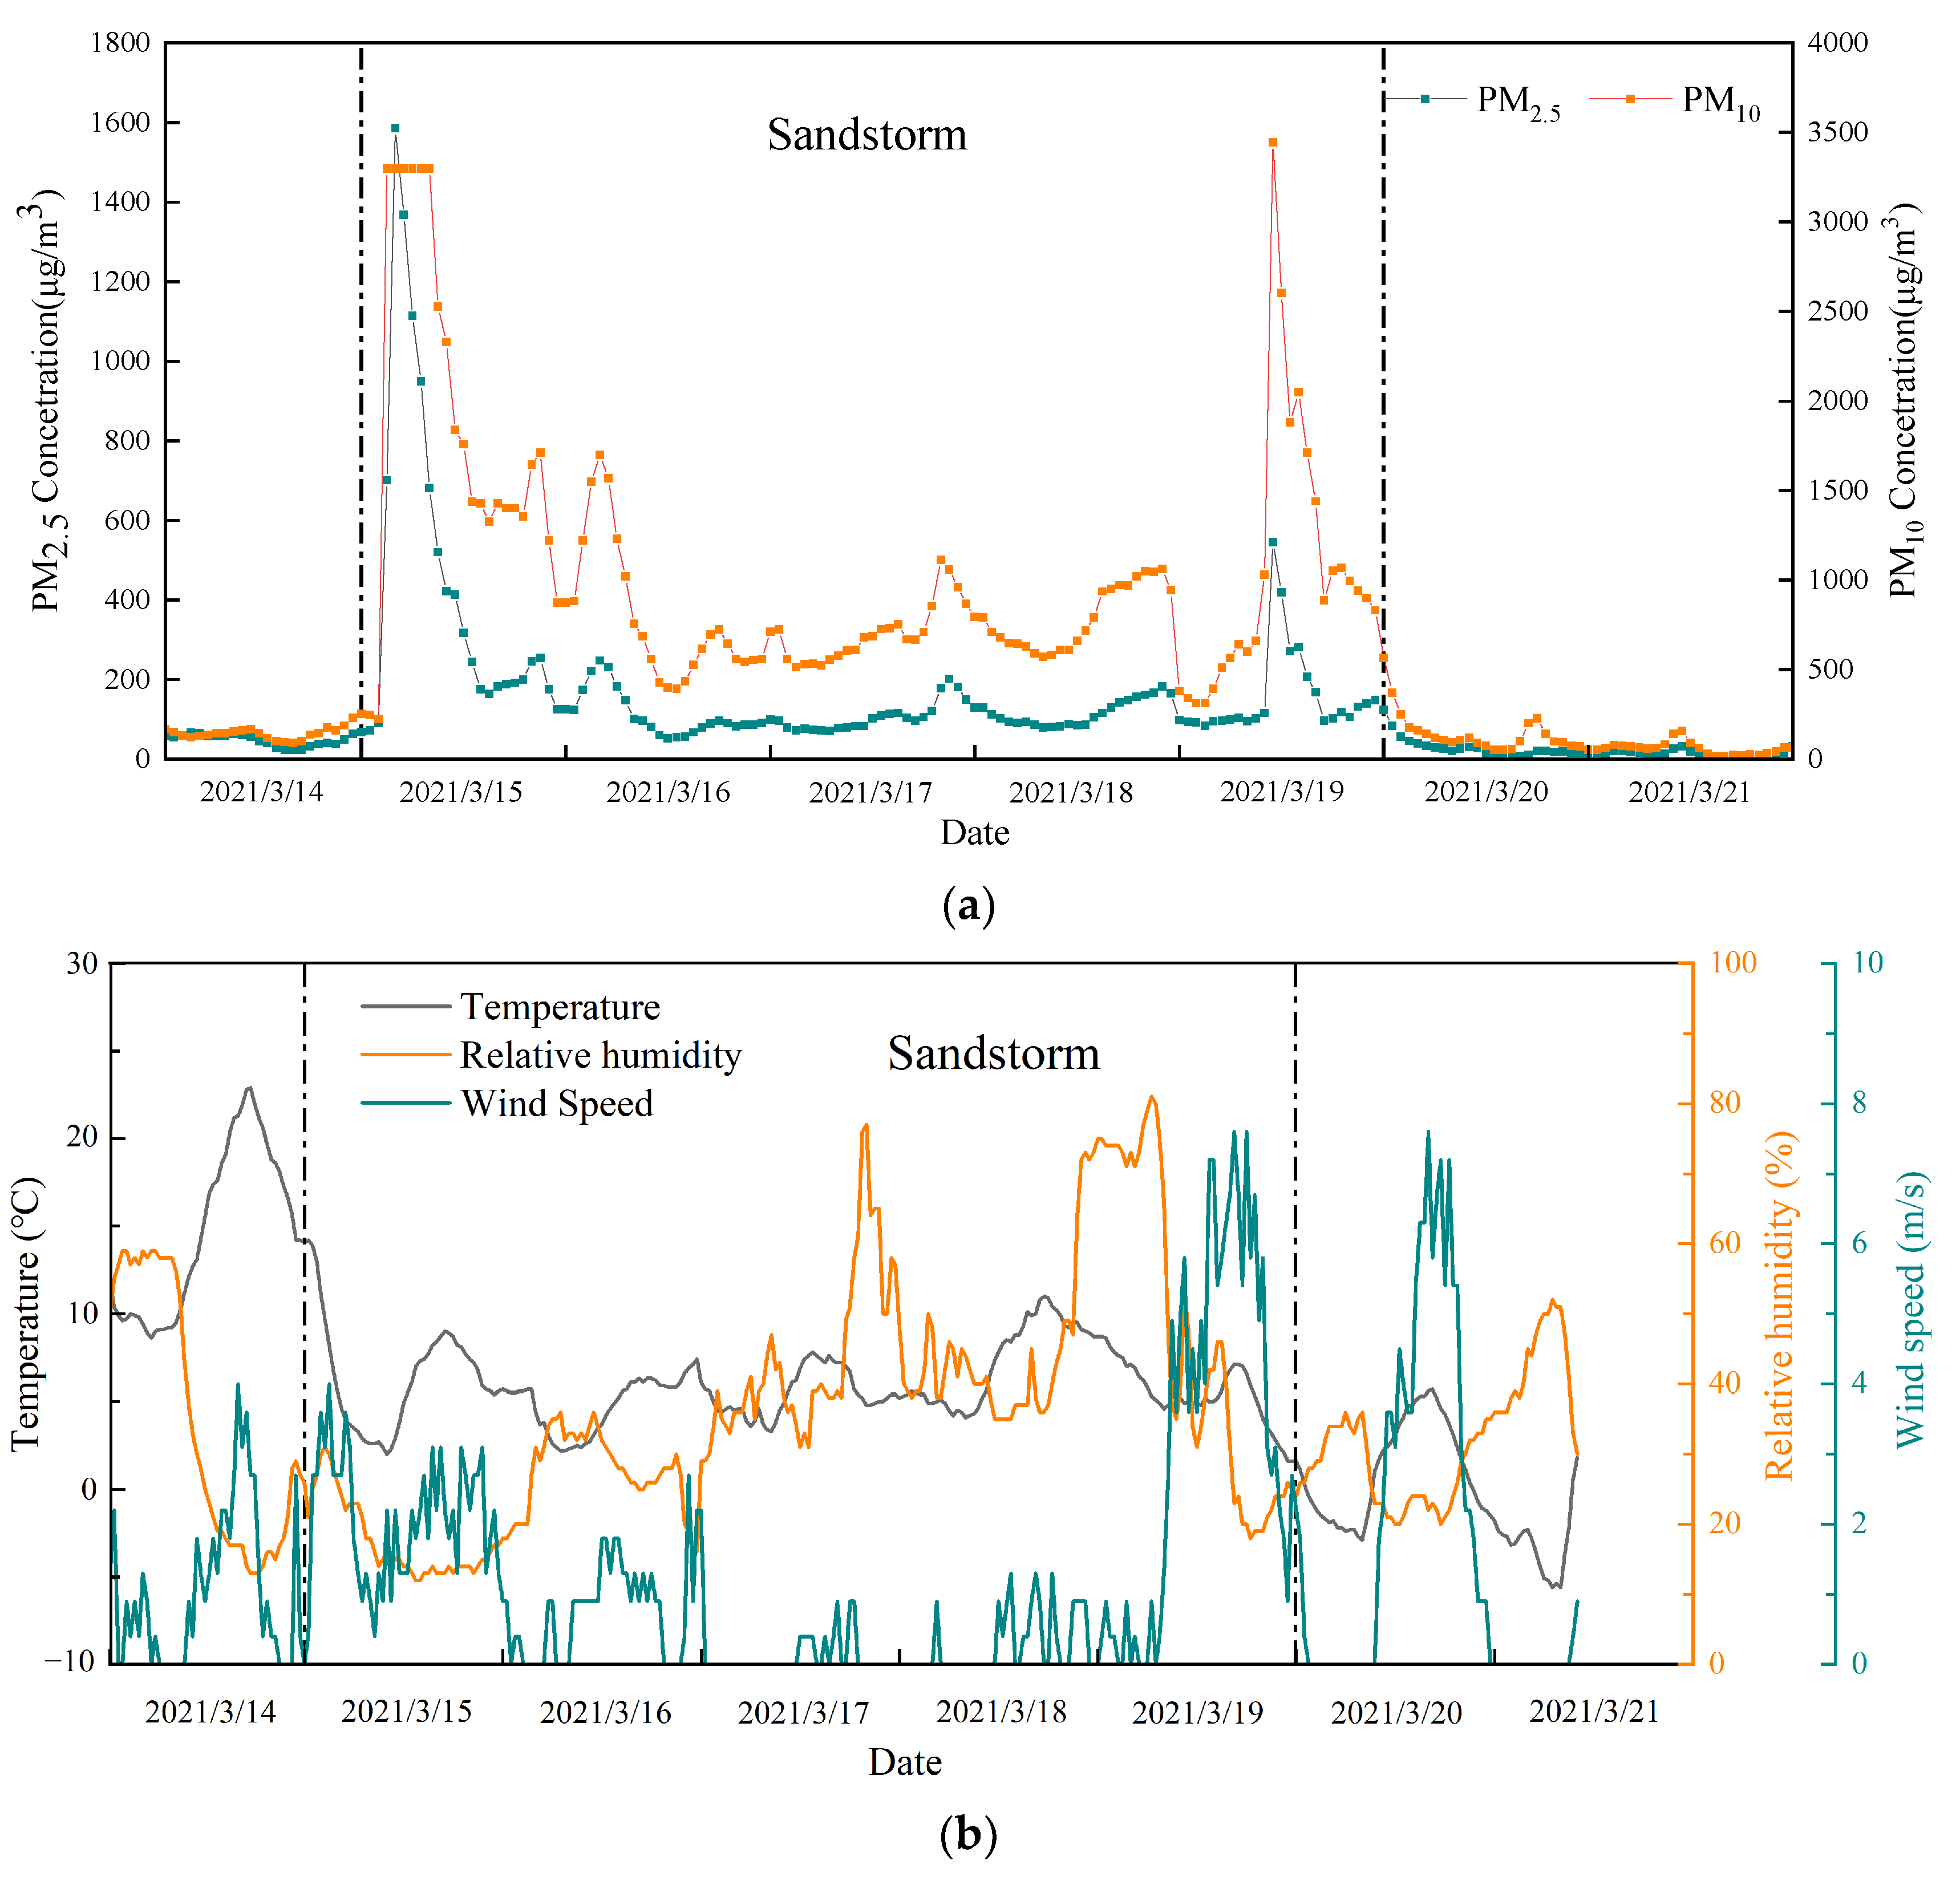
3.2.2. Temporal Variation

The daily changes in PM concentrations before and during the sandstorm event in Wuhai (Figure 3a) showed that PM2.5 and PM10 concentrations were less than the Level II limit values (75μg/m3 and 150μg/m3), with high temperature and humidity and low wind speed before the occurrence of the sandstorm (Figure 3b). The temperature and humidity decreased during the most severe hours of the sandstorm (15–16 March), while the wind speed increased. PM2.5 concentration surged to 701μg/m3 at 2:00 on March 15 and then continued to increase to 1585 μg/m3 at 3:00. The following day, there was a continuous downward trend until the concentration dropped to 183 μg/m3 at 15:00. PM2.5 concentration remained between 100–300 μg/m3 from 16:00 on the 15th to 23:00 the following day. PM10 concentration spiked to 3298 μg/m3 at 2:00 on March 15 and remained at this level until 7:00; then decreased from 8:00 on the 15th to 6:00 on the 16th, but was still at a very high level between 1020–2528 μg/m3. Then, the concentration decreased to less than 1000 μg/m3 from 7:00 to 23:00 on the 16th, but the lowest concentration still reached 394 μg/m3. Humidity increased and wind speed decreased on March 17 and 18. PM2.5 and PM10 concentrations remained at low levels, below 200 μg/m3 and 1000 μg/m3,respectively during this period. PM2.5 and PM10 concentrations surged again to 545 μg/m3 and 3444 μg/m3,respectively, at 10:00 on 19 March, with high concentrations (97 μg/m3–545 μg/m3, 566 μg/m3–2602 μg/m3) lasting until 23:00, during which time the temperature and humidity dropped while the wind speed increased. Air quality improved significantly from March 20, with both PM2.5 and PM10 concentrations dropping significantly to below the Level II limit, and even below the Level Ⅰ limit (35 μg/m3, 50 μg/m3) at certain times.

3.2.3. Chemical Composition of Particulate Matter

The content of each chemical component increased with increasing particle size (Supplementary Table S3). Compared with non-sandstorm days, trace metal concentrations in particles of different particle sizes generally increased on sandstorm days, and the patterns were similar for different trace metals. Al and Zn were the most abundant trace metals. Moderate concentrations of Ba, Fe, Sr and Mg were found, followed by Ti, Cr, Cu, Pb, Mn and Sn. Water-soluble ion concentrations in particles generally decreased on sandstorm days. Na+ content in different particle sizes differed significantly, with concentrations of only 1.39 μg/m3 in PM1 and up to 70.88 μg/m3 in TSP. Meanwhile, the concentrations of SO42− in different particle sizes, Ca2+ and Mg2+ in PM10 and Ca2+, K+, Mg2+ and Cl in TSP during the sandstorm were also higher than on non-sandstorm days. The patterns of the content of water-soluble ions were also similar during sandstorm and non-sandstorm. Ca2+ was the most abundant water-soluble ion, followed by Na+, SO42−, K+ and Mg2+. F, Cl and NO3 were the least abundant water-soluble ions.

3.3. Analysis of Pollutants Sources
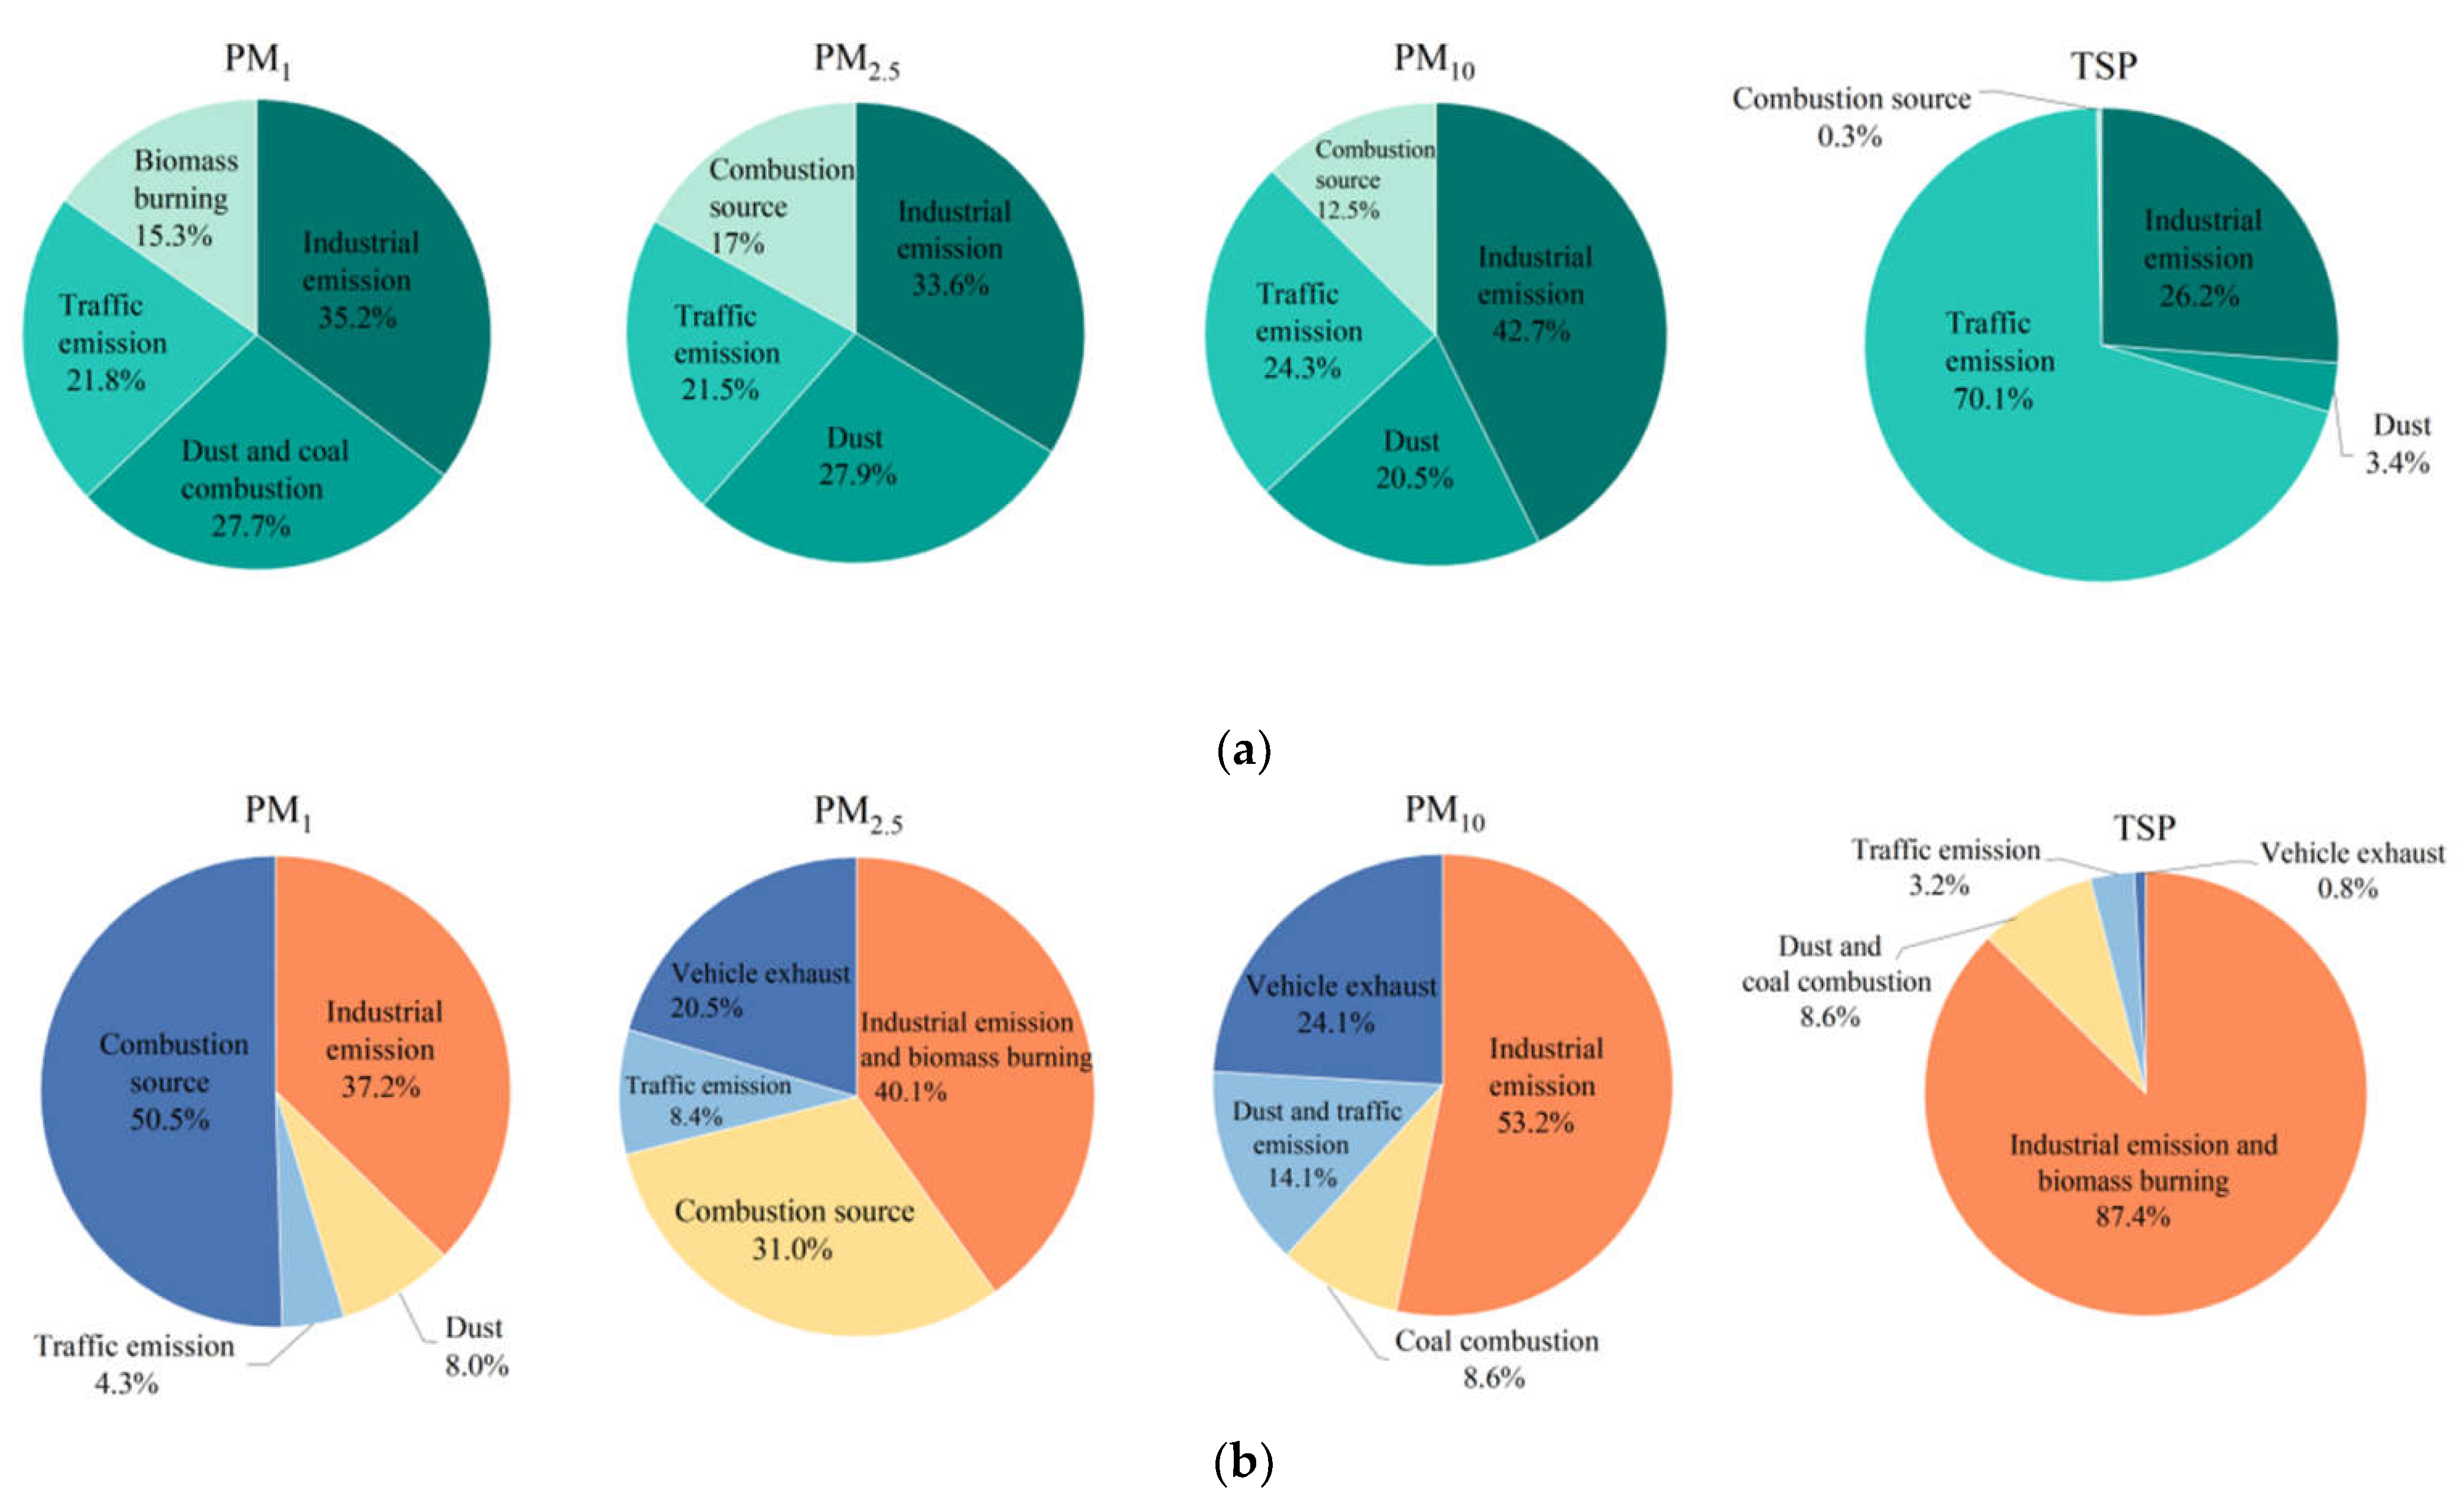
3.3.1. PMF

In this study, we used a PMF model combined with an analysis of emission sources of different chemical components in particulate matter to apportion the pollution sources of eleven metal elements and seven water-soluble ions, during non-sandstorm (Figure 4a) and sandstorm days (Figure 4b). Four main sources were identified for the metals and water-soluble ions for PM1, PM2.5, PM10 and TSP, combined with analysis of emission sources of different chemical components in particulate matter (Supplementary Table S4). The characteristic elements of each source of PM1, PM2.5, PM10 and TSP during both sandstorm and non-sandstorm days are shown in Supplementary Table S5 and Supplementary Figure S1. During non-sandstorm days, the main sources of pollutants for PM1 were from industrial emissions (35.2%), dust and coal combustion (27.7%), traffic emissions (21.8%) and biomass burning (15.3%). Similar to PM1, the largest sources of PM2.5 and PM10 were industrial emissions (content 33.6% and 42.7%, respectively) with the other portion came from dust (content 27.9% and 20.5%, respectively), traffic emissions (content 21.5% and 24.3%, respectively) and combustion sources (content 17.0% and 12.5%, respectively). Traffic emissions (70.1%) was the main source of TSP, followed by industrial emissions (26.2%), dust (3.4%) and combustion sources (0.3%).
The sources of pollutants during sandstorm days were essentially similar to those during non-sandstorm days. The proportion of industrial emissions and combustion sources increased compared with non-sandstorm days, with combustion sources including coal combustion, biomass burning and vehicle exhaust emissions, while traffic emissions and dust from roads and construction decreased. During sandstorm days, the main sources of pollutants for PM1 were from combustion sources (50.5%), industrial emissions (37.2%), dust (8.0%) and traffic emissions (4.3%). Both PM2.5 and TSP were mainly from industrial emissions and biomass burning (content 40.1% and 87.4%, respectively), traffic emissions (content 8.4% and 3.2%, respectively) and vehicle exhaust (content 20.5% and 0.8%, respectively). The other portion of PM2.5 came from combustion sources (31.0%), while TSP came from dust and coal combustion (8.6%). PM10 was mainly from industrial emissions (53.2%), vehicle exhaust (24.1%), dust and traffic emissions (14.1%) and coal combustion (8.6%).

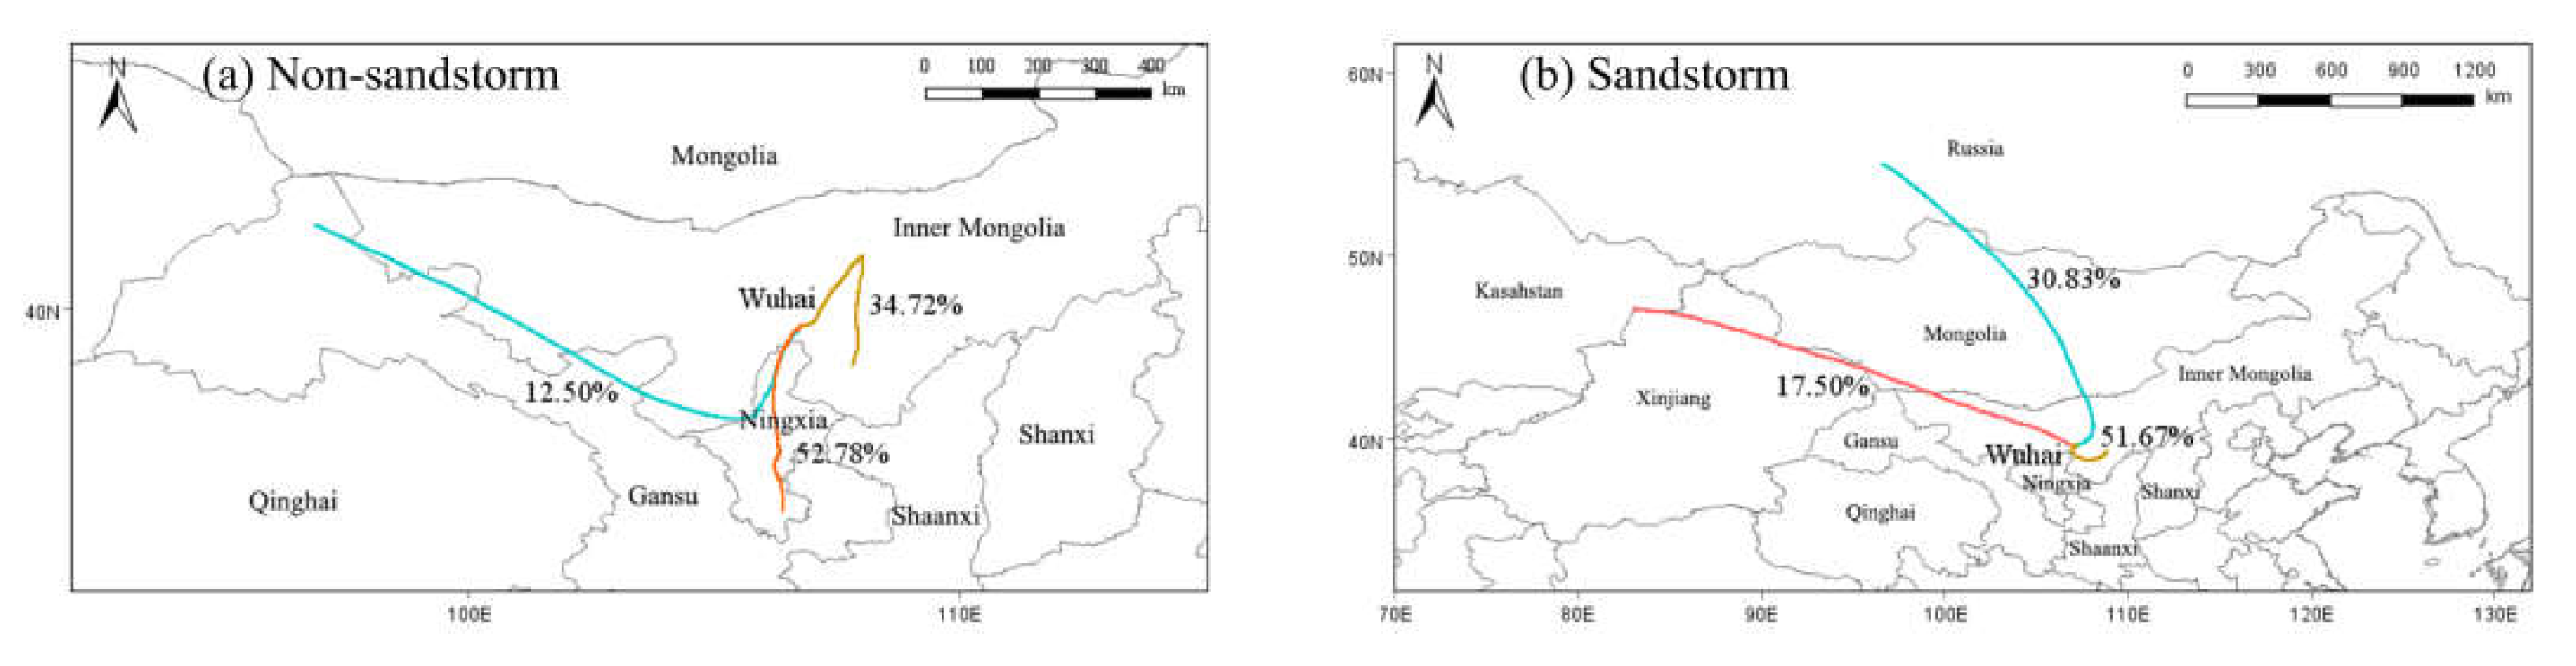
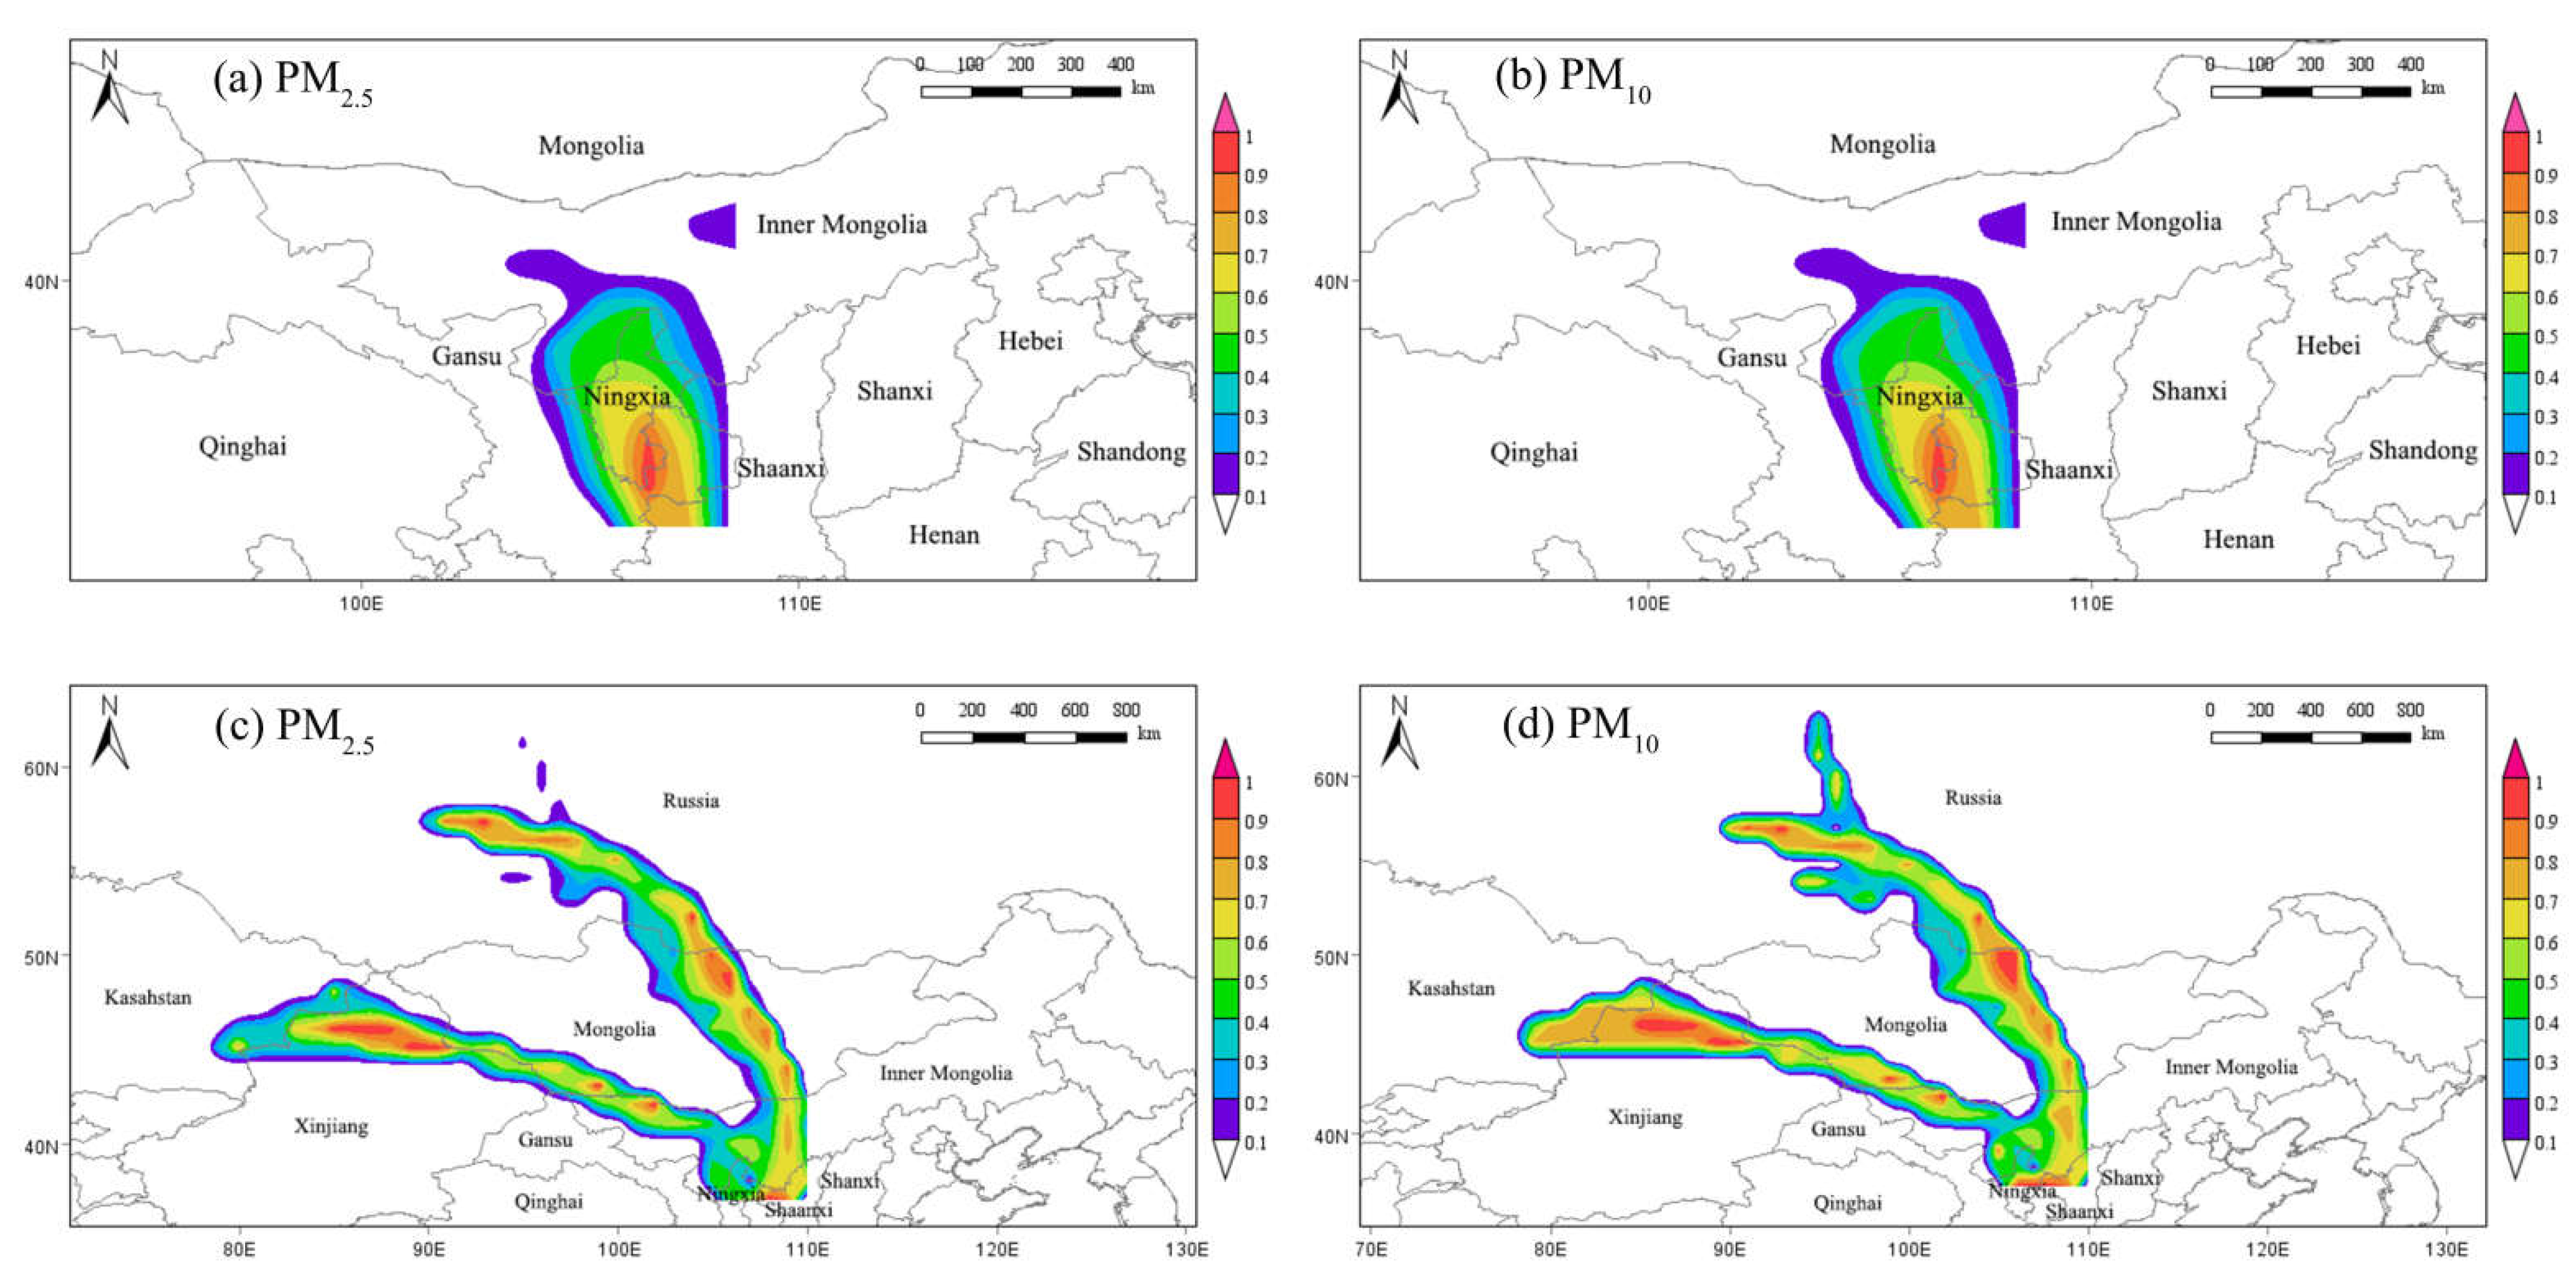
3.3.2. Analysis of Dust Transport Paths Based on MeteoInfo Trajectory Model

To further investigate the airflow transport characteristics in Wuhai during non-sandstorm and sandstorm days, 72-h backward airflow trajectories arriving at Wuhai were clustered and analyzed using MeteoInfo software (Figure 5). The results showed that two clusters during non-sandstorm periods were dominated by short-distance transport, from southern Ningxia (52.78%) and south-central Inner Mongolia (34.72%). Another cluster (12.50%) came from northern Gansu, passing through the southwest edge of Inner Mongolia to reach Wuhai with long-distance transport. However, two clusters were dominated by long-distance transport and were characterized by rapidly moving speeds during the sandstorm. One of the clusters (30.83%) came from the south of Russia and reached Wuhai via central Mongolia and northern Inner Mongolia. Another cluster (17.50%) came from the northern border of Xinjiang, passing through north and central Xinjiang in a northwesterly direction, crossing a small part of southwestern Mongolia and northwestern Inner Mongolia to reach Wuhai. The highest percentage (51.67%) of the cluster from south-central Inner Mongolia was dominated by short-distance transport, and the cluster moved slowly, passing through Ertokqi and Hainan district of Wuhai city.
By assigning the corresponding PM2.5 and PM10 hourly concentration data to each airflow, the potential pollution source areas in Wuhai were further analyzed (Figure 6). PSCF results showed that the potential pollution source areas for both PM2.5 and PM10 during non-sandstorms were mainly from southern Ningxia, southeastern Gansu and western Shaanxi and the contribution values decreased gradually to the north. However, the potential pollution sources of PM2.5 and PM10 expanded and the sources were located further during sandstorm days, but their distributions were basically similar. The potential pollution source areas in Wuhai were distributed along three clusters and the contribution values decreased gradually to both sides of the airflow, mainly in southern Russia, north-central and south-western Mongolia, northern Xinjiang, west-central and north-western Inner Mongolia. Northern Shaanxi also contributed to particulate matter in Wuhai.
Compared to the PSCF method, the CWT method is more intuitive to identify potential source areas with high concentration contributions (Figure 7). The results showed that the high CWT areas of PM2.5 and PM10 (>120 μg·m−3, 600 μg·m−3, respectively) during non-sandstorm days were mainly in southern Ningxia, southeast Gansu and western Shaanxi. The concentration contribution values of particulate matter during sandstorm days were all much higher. The high CWT area (>240 μg·m−3) of PM2.5 was mainly in northwestern Inner Mongolia. The contributions of southern Russia, northern and southwestern Mongolia, and northern Xinjiang to the PM2.5 mass concentration in Wuhai were also in the range of 160–240 μg·m−3. All regions contributed more than 200 μg·m−3 to the PM10 concentration. Among them, the contribution of northwestern Inner Mongolia was as high as 1800 μg·m−3. The contribution to PM10 mass concentrations of southern and southwestern Russia, northern Mongolia and parts of northern Inner Mongolia also ranged from 1200–1800 μg·m−3.

3.4. Health Risk Assessment

The assessment of health risk due to heavy metals in particles of different particle sizes entering the human body through the respiratory route is shown in Table 1. The concentrations of the heavy metal (Cr) in atmospheric particles all exceeded 10–4, indicating a high risk of carcinogenicity in humans whether there is a sandstorm or not. Our study found that the human carcinogenic risk of heavy metals was similar during sandstorm and non-sandstorm days. The magnitude of the carcinogenic effect of Cr in different particle sizes on the human body showed that the coarse particles (PM10 and TSP) were larger than the fine particles (PM1 and PM2.5). Moreover, the risk coefficient showed that children were at greater risk than adult males and adult females, in that order. The carcinogenic risk of Cr in PM1, PM2.5, PM10 and TSP for children during sandstorm and non-sandstorm days was about two times higher than for adult males and adult females. The carcinogenic risk of Cr in PM1, PM10 and TSP for all populations increased during sandstorm days. The risk was 1.2, 1.5 and 2.3 times higher than on non-sandstorm days for PM1, PM10 and TSP, respectively, while Cr in PM2.5 was less than on non-sandstorm days.
Of all the heavy metal elements (Cr, Cu, Mn, Pb and Zn), only Cr and Mn pose a non-carcinogenic risk to humans. The effects of these elements on human non-carcinogenic risk were also similar under both weather conditions. The effects of Cr and Mn on non-carcinogenic risk were manifested mostly in children, then in adult males and females, in that order. The non-carcinogenic risks of Cr and Mn in PM1, PM2.5, PM10 and TSP for children were about 5.6 and 6.3 times higher than for adult males and females, respectively. The magnitude of the carcinogenic effect of Cr and Mn in different particle sizes on the human body was in this order: TSP>PM10>PM2.5>PM1. The non-carcinogenic risks of Cr and Mn related to different particle sizes during sandstorm days were generally greater than on non-sandstorm days, except for Cr in PM2.5. The non-carcinogenic risk of Cr in PM1, PM10 and TSP for all populations was 1.2, 1.5 and 2.3 times higher than on non-sandstorm days, while the risk of Mn in PM1, PM10 and TSP for all populations was 1.9, 10.0 and 13.1 times higher than on non-sandstorm days, respectively.

4. Discussion

4.1. Comparison of Pollutant Characteristics

Due to the coupling effect of local dust and regional transportation, the concentrations of PM1, PM2.5, PM10 and TSP in Wuhai City during the sandstorm period significantly increased, and were 2.2, 2.6, 4.8 and 6.0 times higher than during the non-sandstorm period, respectively. This can be attributed to the fact that the study area is located in the arid desert area of northwest China, with dry weather, low precipitation and severe wind erosion, coupled with a large number of minerals distributed in the region. The process of mining leads to looser soil and higher accumulation of ground dust resulting in reduced air quality. Moreover, particle concentration is also related to meteorological factors. Meteorological conditions in Wuhai during the sandstorm event (Figure 3b) showed that the low humidity on March 15 led to dry ground, while higher wind speed was more likely to carry ground dust, leading to an increase in the concentration of particulate matter in the atmosphere. PM concentrations were still at a high level on March 16–18, caused by high humidity and low wind speed conditions unfavorable to the diffusion of dust. As the wind speed increased on March 20, it accelerated the dispersion of particulate matter and led to a rapid decrease in PM concentration.
Compared with the non-sandstorm period, the occurrence of sandstorm caused the accumulation of large amounts of particulate matter in the atmosphere, resulting in an increase in the content of metallic elements in particulate matter. Liu et al. [17] also found that the sum of dust tracers (i.e., Al, Ca, Fe, Ti) concentrations were increased during sandstorm days. Conversely, water-soluble ions content generally decreased, probably due to the fact that these ions are mainly from local pollution sources. It is also possible that the enrichment of water-soluble ions varies between particle sizes [18], leading to an increase of water-soluble ions in some particle sizes. For instance, the concentration of Na+ during sandstorm days were much higher than during non-sandstorm days because Na+ may come from crustal sources such as construction and road dust. Ca2+ is mainly concentrated in coarse particles [35]. Windy and dusty weather can lead to higher Ca2+ concentrations in atmospheric particles. The dry and sandy environment around Wuhai is also one of the reasons for higher Ca2+ concentrations in PM10 and TSP during sandstorm events. Mg2+ content which mainly comes from soil is normally relatively low in atmospheric particulate matter. The large accumulation of ground dust during sandstorm days may increase the Mg2+ content in PM10 and TSP. SO42− is mainly derived from the combustion of fossil fuels such as coal, and the superposition of high concentrations of dust during long-distance transport with anthropogenic emissions of typical sulphur-containing pollutants may be responsible for its increased concentration. Due to the different elements had different degrees of enrichment in the particles, the content of each chemical component in different particles increased with the increase of particle size during both sandstorm and non-sandstorm days. The composition testing showed that PM1, PM2.5, PM10, and TSP in the study area contained large amounts of Al, Zn, and Ca2+ during both sandstorm and non-sandstorm days, tentatively indicating that the sources of pollutants may be similar, dust and industrial emissions had a certain contribution.

4.2. Comparison of Pollutants Sources

During non-sandstorm days, the airflow was mainly transported over short distances, and potential pollution sources were mainly from southern Ningxia, southeast Gansu and western Shaanxi. These areas are rich in mineral resources and have developed numerous industries such as coal mining, chemical industries and metal smelting. The exhaust gas and particulate matter emitted from these industries seriously pollute the local environment and thus become a potential source of transported pollution in Wuhai area. The predominance of long-distance transport of airflow during sandstorms is due to the influence of meteorological conditions, coupled with the combined effects of local dust and regional transport. The potential source areas that had a large impact on PM2.5 and PM10 concentrations in Wuhai during sandstorm days were basically similar and were mainly distributed in three directions. The first direction was southern Russia, north-central and southwestern Mongolia. Influenced by Mongolian cyclonic activity, this was the main direction for the occurrence of the sandstorm, passing through the Mongolian plateau, carrying a large concentration of particulate matter affecting the Wuhai area. The second direction was northern Xinjiang, west-central and northwestern Inner Mongolia. Airflow transport went through four of the eight major deserts in China, in order Gurbantunggut Desert, Batangilin Desert, Tengri Desert and Ulan Buh Desert. Furthermore, a large number of minerals are distributed within these source areas, accompanied by massive pollutants generated during industrial processes. Coupled with factors such as drought and little rain, low vegetation cover and severe desertification, airflow passing through these areas is likely to carry large amounts of particulate matter and is transported over long distance from the northwest to bring particulate matter to Wuhai City, affecting its air quality. The third direction was northern Shaanxi. The airflow trajectory showed the highest percentage of air mass trajectory from south-central Inner Mongolia (51.67%), which was dominated by short-distance transport. This indicated that the potential source area in this direction was mainly from local emissions. At the same time, the Kubuqi Desert is in the south-central part of Inner Mongolia, and cities in the northwest region have centralized heating in the form of coal combustion, which leads to high soot content in the atmosphere and affects the air quality.
The results showed that the sources of pollutants in different particle sizes during the sandstorm event were mainly from industrial and traffic emissions, combustion sources and dust, of which industrial emissions and combustion sources account for a large proportion. As a typical coal resource-based city, Wuhai area has many exposed mines after mineral extraction, accompanied by a large number of industrial and mining emissions. The occurrence of sandstorms accompanied by the transport of regional pollutants further aggravates local pollution. Therefore the proportion of industrial emissions and combustion sources of particulate matter increased compared with non-sandstorm days. However, the sources of traffic emissions and dust from roads and construction decreased during sandstorm days. This may indicate the impact of human activities, especially the industrialization process on the environment. Accompanied by extreme weather conditions, pollutants emitted by industrial production are more likely to diffuse and thus affect the regional eco-environmental. Combined with the results of CWT, the maximum high concentration contribution source areas of PM2.5 and PM10 during sandstorm days were from northwestern Inner Mongolia, which further indicated that air pollution was affected by both local pollutant emissions and cross-regional transport [36,37]. Therefore, the control of atmospheric environment in the study area should strengthen the control of mineral exploitation in local areas, but one should also pay attention to pollutants transported from external areas. The implementation of afforestation, windbreak and sand fixation and mitigation of land desertification policies, improved vegetation coverage in arid desert areas of northwest China and reduced desertification area can impede the long-distance transport of particulate matter. In addition, the development of clean energy, green production and other technologies to reduce emissions of SO2, NOx and soot from coal combustion in northwest China can help to improve local air quality.

4.3. Impact of Pollutants on Human Health

The risk evaluation results showed that among the heavy metals selected for evaluation, only Cr pose a carcinogenic risk. Cr and Mn also have respiratory toxicity, which poses non-carcinogenic risks to human health [38]. Cr can precipitate some proteins in the blood, and long-term contact with this substance can cause respiratory tract inflammation and induce lung cancer [39]. Industrial production and coal mining activities are intense in Wuhai, which is a coal resource-based city, and thus the atmosphere continuously contains Cr and Mn. These elements can have an impact on human health in both sandstorm and non-sandstorm days, and pose greater risks to children’s health than adults’ health [40]. Masks should also be worn during non-sandstorm days, especially by infants and coal miners. Dust production in open coal mines can be limited by optimizing the coal mining process and deploying dust suppression measures to reduce the impact on human health. The risk of these elements to human health in sandstorm weather was generally higher than in non-sandstorm days because of the increased concentration of particulate matter in the atmosphere. Dusty weather can lead to allergies and respiratory diseases. It is recommended to minimize outdoor activities during sandstorms and to avoid outdoor activities for a few days after the sandstorm has passed, especially on the second day. Protective measures should be taken outdoors, such as wearing masks, hats, wind goggles and other protective devices to prevent dust from entering the respiratory tract. In addition, due to the different enrichment of elements in different particle sizes, heavy metal elements in different particle sizes had different effects on human health. The chemical content of heavy metals generally increased with the increase in particle size. However, due to the larger specific surface area of small particles, they are easier to adsorb into the human body, resulting in greater toxicity [41,42]. Therefore, the study of the enrichment of PM1 during sandstorm events is essential to further understand the influence mechanism of small particle size particles on human health.

5. Conclusions

The concentrations of PM1, PM2.5, PM10 and TSP in Wuhai City during sandstorm days were significantly increased due to the coupling effects of local dust and regional transportation. Compared with non-sandstorm days, trace metals concentrations in particles of different particle sizes generally increased during sandstorm days, while water-soluble ions decreased. PMF results showed that the sources of pollutants during both sandstorm days and non-sandstorm days mainly came from industrial and traffic emissions, combustion sources and dust. The proportion of industrial emissions and combustion sources increased compared with non-sandstorm days, while traffic emissions and dust decreased. The airflows were mainly transported over short distances during non-sandstorm days, and high concentration contribution source areas were from southern Ningxia, southeast Gansu and western Shaanxi. While the airflows were mainly transported over long distances during sandstorm days, and high concentration contribution source areas were from northwestern Inner Mongolia, southern Russia, northern and southwestern Mongolia, and northern Xinjiang. Therefore, the management and prevention to the local pollutant emissions and the cross-regional pollutant transport should be paid more attention at the same time. Moreover, the risk of elements to human health during sandstorm days was generally higher than during non-sandstorm days. It is recommended that protective measures should be taken during both sandstorm and non-sandstorm days, especially for the infants and coal miners.

Supplementary Materials

The following supporting information can be downloaded at: https://www.mdpi.com/article/10.3390/atmos13101629/s1, Supplement S1: PMF; Supplement S2: Backward clustering trajectory; Supplement S3: Health risk assessment; Table S1: The meaning and value of each parameter in the exposure formula; Table S2: Values of SF and RfD for related elements; Table S3: Mean concentrations and standard deviations of elements during the sandstorm and non-sandstorm; Table S4: Emission sources of different chemical components in particulate matters; Table S5: The characterizing elements of each source for PM1, PM2.5, PM10 and TSP based on PMF model; Figure S1: Profiles of four sources identified from the PMF model for PM1, PM2.5, PM10 and TSP during the (a) non-sandstorm and (b) sandstorm. References [43,44,45,46,47,48,49,50,51,52,53,54,55,56,57,58,59,60,61,62,63] are cited in Supplementary Materials.

Author Contributions

Conceptualization, Y.L., T.Z. and R.W.; Data curation, Y.L.; Formal analysis, Y.L.; Funding acquisition, T.Z. and R.W.; Investigation, Y.L. and M.W.; Methodology, Y.L. and Q.J.; Project administration, R.W.; Resources, T.S.; Software, X.A.; Writing—original draft, Y.L.; Writing—review & editing, R.W. All authors have read and agreed to the published version of the manuscript.

Acknowledgments

This work was supported by the National Key Research and Development Plan Project of China (2017YFC0504403). We thank our colleagues for their help with the experiments.

Conflicts of Interest

The authors declare no conflict of interest.

References

  1. Yassin, M.F.; Almutairi, S.K.; Al-Hemoud, A. Dust storms backward Trajectories’ and source identification over Kuwait. Atmos. Res. 2018, 212, 158–171. [Google Scholar] [CrossRef]
  2. Kang, J.H.; Keller, J.J.; Chen, C.S.; Lin, H.C. Asian dust storm events are associated with an acute increase in pneumonia hospitalization. Ann. Epidemiol. 2012, 22, 257–263. [Google Scholar] [CrossRef] [PubMed]
  3. Trianti, S.M.; Samoli, E.; Rodopoulou, S.; Katsouyanni, K.; Papiris, S.A.; Karakatsani, A. Desert dust outbreaks and respiratory morbidity in Athens, Greece. Environ. Health 2017, 16, 72. [Google Scholar] [CrossRef] [Green Version]
  4. Vodonos, A.; Friger, M.; Katra, I.; Avnon, L.; Krasnov, H.; Koutrakis, P.; Schwartz, J.; Lior, O.; Novack, V. The impact of desert dust exposures on hospitalizations due to exacerbation of chronic obstructive pulmonary disease. Air Qual. Atmos. Health 2014, 7, 433–439. [Google Scholar] [CrossRef]
  5. Akinwumiju, A.S.; Ajisafe, T.; Adelodun, A.A. Airborne particulate matter pollution in Akure Metro city, southwestern Nigeria, West Africa: Attribution and meteorological influence. J. Geovis. Spat. Anal. 2021, 5, 11. [Google Scholar] [CrossRef]
  6. Fernández, A.J.; Sicard, M.; Costa, M.J.; Guerrero-Rascado, J.L.; Gómez-Amo, J.L.; Molero, F.; Barragán, R.; Basart, S.; Bortoli, D.; Bedoya-Velásquez, A.E.; et al. Extreme, wintertime Saharan dust intrusion in the Iberian Peninsula: Lidar monitoring and evaluation of dust forecast models during the February 2017 event. Atmos. Res. 2019, 228, 223–241. [Google Scholar] [CrossRef]
  7. Filonchyk, M.; Peterson, M.; Hurynovich, V. Air pollution in the Gobi Desert region: Analysis of dust-storm events. Q. J. R. Meteorol. Soc. 2021, 147, 1097–1111. [Google Scholar] [CrossRef]
  8. Liu, L.; Guo, J.; Gong, H.; Li, Z.; Chen, W.; Wu, R.; Wang, L.; Xu, H.; Li, J.; Chen, D.; et al. Contrasting influence of Gobi and Taklimakan deserts on the dust aerosols in western North America. Geophys. Res. Lett. 2019, 46, 9064–9071. [Google Scholar] [CrossRef]
  9. An, L.; Che, H.; Min, X.; Zhang, T.; Wang, H.; Wang, Y.; Zhou, C.; Zhao, H.; Gui, K.; Zheng, Y.; et al. Temporal and spatial variations in sand and dust storm events in East Asia from 2007 to 2016: Relationships with surface conditions and climate change. Sci. Total Environ. 2018, 633, 452–462. [Google Scholar] [CrossRef] [PubMed]
  10. Barbulescu, A.; Nazzal, Y. Statistical analysis of dust storms in the United Arab Emirates. Atmos. Res. 2020, 231, 104669. [Google Scholar] [CrossRef]
  11. Chen, Q.C.; Wang, M.M.; Sun, H.Y.; Wang, X.; Wang, Y.Q.; Lim, Y.G.; Zhang, L.X.; Mu, Z. Enhanced health risks from exposure to environmentally persistent free radicals and the oxidative stress of PM2.5 from Asian dust storms in Erenhot, Zhangbei and Jinan, China. Environ. Int. 2018, 121, 260–268. [Google Scholar] [CrossRef] [PubMed]
  12. Ismail, S.; Jean-François, L.; Mar, S.; Benjamin, G.; Carmen, C.J.; Amaury, D.S.; Faisal, A.S. Dust and dust storms over Kuwait: GROUND-BASED and satellite observations. J. Atmos. Sol.-Terr. Phys. 2018, 179, 105–113. [Google Scholar]
  13. Soleimani, Z.; Teymouri, P.; Boloorani, A.D.; Mesdaghinia, A.; Middleton, N.; Griffin, D.W. An overview of bioaerosol load and health impacts associated with dust storms: A focus on the Middle East. Atmos. Environ. 2020, 223, 117187. [Google Scholar] [CrossRef]
  14. Tiwari, S.; Kumar, A.; Pratap, V.; Singh, A.K. Assessment of two intense dust storm characteristics over indo-gangetic basin and their radiative impacts: A case study. Atmos. Res. 2019, 228, 23–40. [Google Scholar] [CrossRef]
  15. Tang, G.L.; Chao, Q.C. Analysis on Sandstorm Variation in China for Last 49 Years. Meteorol. Mon. (China) 2005, 5, 8–11. [Google Scholar]
  16. Filonchyk, M. Characteristics of the severe March 2021 Gobi Desert dust storm and its impact on air pollution in China. Chemosphere 2021, 287, 132219. [Google Scholar] [CrossRef] [PubMed]
  17. Liu, Q.Y.; Liu, Y.J.; Zhao, Q.C.; Zhang, T.T.; Schauer, J.J. Increases in the formation of water soluble organic nitrogen during asian dust storm episodes. Atmos. Res. 2021, 253, 105486. [Google Scholar] [CrossRef]
  18. Wang, G.H.; Cheng, C.L.; Huang, Y.; Tao, J.; Ren, Y.Q.; Wu, F.; Meng, J.J.; Li, J.J.; Cheng, Y.T.; Cao, J.J.; et al. Evolution of aerosol chemistry in Xi’an, inland China, during the dust storm period of 2013—Part 1: Sources, chemical forms and formation mechanisms of nitrate and sulfate. Atmos. Chem. Phys. 2014, 14, 11571–11585. [Google Scholar] [CrossRef] [Green Version]
  19. Tao, M.; Gui, L.; Li, R.; Wang, L.; Liang, S.; Li, Q.; Wang, L.; Yu, C.; Chen, L. Tracking prevailing dust aerosol over the air pollution in central China with integrated satellite and ground observations. Atmos. Environ. 2021, 253, 118369. [Google Scholar] [CrossRef]
  20. Zhou, L.; Dang, X.; Mu, H.; Wang, B.; Wang, S. Cities are going uphill: Slope gradient analysis of urban expansion and its driving factors in China. Sci. Total Environ. 2021, 775, 145836. [Google Scholar] [CrossRef] [PubMed]
  21. Titos, G.; Ealo, M.; Pandolfi, M.; Perez, N.; Sola, Y.; Sicard, M.; Comerón, A.; Querol, X.; Alastuey, A. Spatiotemporal evolution of a severe winter dust event in the western Mediterranean: Aerosol optical and physical properties. J. Geophys. Res. Atmos. 2017, 122, 4052–4069. [Google Scholar] [CrossRef] [Green Version]
  22. Wang, Q.; Dong, X.; Fu, J.S.; Xu, J.; Deng, C.; Jiang, Y.; Fu, Q.; Lin, Y.; Huang, K.; Zhuang, G. Environmentally dependent dust chemistry of a super Asian dust storm in March 2010: Observation and simulation. Atmos. Chem. Phys. 2018, 18, 3505–3521. [Google Scholar] [CrossRef]
  23. Zheng, S.; Singh, R.P. Aerosol and meteorological parameters associated with the intense dust event of 15 April 2015 over Beijing, China. Remote Sens. 2018, 10, 957. [Google Scholar] [CrossRef] [Green Version]
  24. Francis, D.; Eayrs, C.; Chaboureau, J.P.; Mote, T.; Holland, D.M. Polar jet associated circulation triggered a Saharan cyclone and derived the poleward transport of the African dust generated by the cyclone. J. Geophys. Res. Atmos. 2018, 123, 11-899. [Google Scholar] [CrossRef]
  25. She, L.; Xue, Y.; Guang, J.; Che, Y.; Fan, C.; Li, Y.; Xie, Y. Towards a comprehensive view of dust events from multiple satellite and ground measurements: Exemplified by the May 2017 East Asian dust storm. Nat. Hazards Earth Syst. Sci. 2018, 18, 3187–3201. [Google Scholar] [CrossRef] [Green Version]
  26. Tan, S.C.; Li, J.; Che, H.; Chen, B.; Wang, H. Transport of East Asian dust storms to the marginal seas of China and the southern North Pacific in spring 2010. Atmos. Environ. 2017, 148, 316–328. [Google Scholar] [CrossRef]
  27. Yuan, T.; Chen, S.; Huang, J.; Zhang, X.; Luo, Y.; Ma, X.; Zhang, G. Sensitivity of simulating a dust storm over Central Asia to different dust schemes using the WRF-Chem model. Atmos. Environ. 2019, 207, 16–29. [Google Scholar] [CrossRef]
  28. Li, G.; Lu, D.; Yang, X.; Zhang, H.; Guo, Y.; Qu, G.; Wang, P.; Chen, L.; Ruan, T.; Hou, X.; et al. Resurgence of sandstorms complicates China’s air pollution situation. Environ. Sci. Technol. 2021, 55, 11467–11469. [Google Scholar] [CrossRef]
  29. Liu, Y.; Wang, R.S.; Zhang, Y.; Zhao, T.N.; Wang, J.H.; Wu, H.X.; Hu, P. Temporal and spatial distributions of particulate matters around mining areas under two coal mining methods in arid desert region of northwest China. Environ. Technol. Innov. 2020, 19, 101029. [Google Scholar] [CrossRef]
  30. Cheng, M.T.; Tang, G.Q.; Lv, B.; Li, X.R.; Wu, X.R.; Wang, Y.M.; Wang, Y.S. Source apportionment of PM2.5 and visibility in Jinan, China. J. Environ. Sci. (China) 2021, 102, 207–215. [Google Scholar] [CrossRef]
  31. Wang, Y.Q. MeteoInfo: GIS software for meteorological data visualization and analysis. Meteorol. Appl. 2012, 21, 360–368. [Google Scholar] [CrossRef]
  32. Lee, S.; Ashbaugh, L. The impact of trajectory starting heights on the MURA trajectory source apportionment (TSA) method. Atmos. Environ. 2007, 41, 7022–7036. [Google Scholar] [CrossRef]
  33. Sapkota, A.; Symons, J.M.; Kleissl, J.; Wang, L.; Parlange, M.B.; Ondov, J.; Breysse, P.N.; Diette, G.B.; Eggleston, P.A.; Buckley, T.J. Impact of the 2002 Canadian forest fires on particulate matter air quality in Baltimore City. Environ. Sci. Technol. 2005, 39, 24–32. [Google Scholar] [CrossRef] [PubMed] [Green Version]
  34. GB 3095-2012; CNRAES (Chinese Research Academy Environmental Sciences). Ambient Air Quality Standards. Chinese Research Academy Environmental Sciences: Beijing, China, 2012.
  35. Yang, Y.J.; Zhou, R.; Yan, Y.; Yu, Y.; Liu, J.; Di, Y.; Du, Z.; Wu, D. Seasonal variations and size distributions of water-soluble ions of atmospheric particulate matter at Shigatse, Tibetan Plateau. Chemosphere 2016, 145, 560–567. [Google Scholar] [CrossRef] [PubMed]
  36. Wang, W.D.; Chen, H.S.; Wu, Q.Z.; Wei, L.F.; Wang, Z.F.; Li, C.; Chen, D.H.; Jiang, Z.M.; Wu, W.W. Numerical study of PM2.5 regional transport over Pearl River Delta during a winter heavy haze event. Acta Sci. Circumstantiae (China) 2016, 36, 2741–2751. [Google Scholar]
  37. Yu, G.M.; Xu, J.Z.; Kang, S.C.; Ren, J.W.; Cui, X.Q. Trajectory analysis of atmospheric transport of particles in Laohugou area, Western Qilian Mountains. Arid Zone Res. (China) 2020, 37, 671–679. [Google Scholar]
  38. Xie, J.W.; Jin, L.; Cui, J.L.; Luo, X.S.; Li, J.; Zhang, G.; Li, X.D. Health risk oriented source apportionment of PM2.5-associated trace metals. Environ. Pollut. 2020, 262, 114655. [Google Scholar] [CrossRef]
  39. Lin, Y.C.; Li, Y.C.; Amesho, K.T.T.; Chou, F.C.; Cheng, P.C. Filterable PM2.5, metallic elements, and organic carbon emissions from the exhausts of diesel vehicles. Aerosol Air Qual. Res. 2020, 20, 1319–1328. [Google Scholar] [CrossRef]
  40. Elif, Y.; Akif, A.; Ahmet, A. Land application of municipal sewage sludge: Human health risk assessment of heavy metals. J. Clean. Prod. 2021, 319, 128568. [Google Scholar]
  41. Guo, G.; Zhang, D.; Wang, Y. Characteristics of heavy metals in size-fractionated atmospheric particulate matters and associated health risk assessment based on the respiratory deposition. Environ. Geochem. Health 2021, 43, 285–299. [Google Scholar] [CrossRef]
  42. Penttinen, P.K.; Timonen, K.L.; Tiittanen, P.; Mirme, A.; Ruuskanen, J.; Pekkanen, J. Ultrafine particles in urban air and respiratory health among adult asthmatics. Eur. Respir. J. 2001, 17, 428–435. [Google Scholar] [CrossRef] [Green Version]
  43. He, R.-D.; Zhang, Y.-S.; Chen, Y.-Y.; Jin, M.-J.; Han, S.-J.; Zhao, J.-S.; Zhang, R.-Q.; Yan, Q.-S. Heavy Metal Pollution Characteristics and Ecological and Health Risk Assessment of Atmospheric PM2. 5 in a Living Area of Zhengzhou City. Huan Jing ke Xue= Huanjing Kexue. 2019, 40, 4774–4782. [Google Scholar]
  44. Beijing Quality and Technology Supervision Bureau. Environmental Site Assessment Guideline; DB11/T 656-2009; Beijing Quality and Technology Supervision Bureau: Beijing, China, 2009. [Google Scholar]
  45. Kuo, S.-C.; Hsieh, L.-Y.; Tsai, C.-H.; Tsai, Y.I. Characterization of PM2.5 fugitive metal in the workplaces and the surrounding environment of a secondary aluminum smelter. Atmos. Environ. 2007, 41, 6884–6900. [Google Scholar] [CrossRef]
  46. Li, S.L. Characteristics and Source Analysis of Dust Pollution in Jinan City; Shandong Jianzhu University: Jinan, China, 2019. [Google Scholar]
  47. Amato, F.; Viana, M.; Richard, A.; Furger, M.; Prévôt, A.S.H.; Nava, S.; Lucarelli, F.; Bukowiecki, N.; Alastuey, A.; Reche, C.; et al. Size and time-resolved roadside enrichment of atmospheric particulate pollutants. Atmos. Chem. Phys. 2011, 11, 2917–2931. [Google Scholar] [CrossRef] [Green Version]
  48. Grigoratos, T.; Martini, G. Brake wear particle emissions: A review. Environ. Sci. Pollut. Res. 2014, 22, 2491–2504. [Google Scholar] [CrossRef] [PubMed] [Green Version]
  49. Lin, Y.C.; Zhang, Y.L.; Song, W.; Yang, X.; Fan, M.Y. Specific sources of health risks caused by size-resolved pm-bound metals in a typical coal-burning city of northern China plain during the winter haze event. Sci. Total Environ. 2020, 734, 138651. [Google Scholar] [CrossRef] [PubMed]
  50. Altıntas, Y.; Kaygısız, Y.; Öztürk, E.; Aksöz, S.; Keşlioğlu, K.; Maraşlı, N. The measurements of electrical and thermal conductivity variations with temperature and phonon component of the thermal conductivity in Sn-Cd-Sb, Sn-In-Cu, Sn-Ag-Bi and Sn-Bi-Zn alloys. Int. J. Therm. Sci. 2016, 100, 1–9. [Google Scholar] [CrossRef]
  51. Bozkurt, Z.; Gaga, E.O.; Taşpınar, F.; Arı, A.; Pekey, B.; Pekey, H.; Döğeroğlu, T.; Üzmez, Ö.Ö. Atmospheric ambient trace element concentrations of PM10 at urban and sub-urban sites: Source apportionment and health risk estimation. Environ. Monit. Assess. 2018, 190, 1–17. [Google Scholar] [CrossRef]
  52. Ledoux, F.; Kfoury, A.; Delmaire, G.; Roussel, G.; El Zein, A.; Courcot, D. Contributions of local and regional anthropogenic sources of metals in PM2.5 at an urban site in northern France. Chemosphere 2017, 181, 713–724. [Google Scholar] [CrossRef]
  53. Zhang, X.; Chen, W.; Ma, C.; Zhan, S. Modeling particulate matter emissions during mineral loading process under weak wind simulation. Sci. Total Environ. 2013, 449, 168–173. [Google Scholar] [CrossRef]
  54. Zhang, R.J.; Jing, J.; Tao, J.; Hsu, S.C.; Wang, G.; Cao, J. Chemical characterization and source apportionment of PM2.5 in Beijing: Seasonal perspective. Atmos. Chem. Phys. 2013, 13, 7053–7074. [Google Scholar] [CrossRef] [Green Version]
  55. Lin, Y.-C.; Tsai, C.-J.; Wu, Y.-C.; Zhang, R.; Chi, K.-H.; Huang, Y.-T.; Lin, S.-H.; Hsu, S.-C. Characteristics of trace metals in traffic-derived particles in Hsuehshan Tunnel, Taiwan: Size distribution, potential source, and fingerprinting metal ratio. Atmos. Chem. Phys. 2015, 15, 4117–4130. [Google Scholar] [CrossRef] [Green Version]
  56. Minguillón, M.; Monfort, E.; Escrig, A.; Celades, I.; Guerra, L.; Busani, G.; Sterni, A.; Querol, X. Air quality comparison between two European ceramic tile clusters. Atmos. Environ. 2013, 74, 311–319. [Google Scholar] [CrossRef] [Green Version]
  57. Xue, G.-Q.; Zhu, B.; Wang, H.-L. Size distributions and source apportionment of soluble ions in aerosol in Nanjing. Huan jing ke xue=Huanjing kexue 2014, 35, 1633–1643. [Google Scholar] [PubMed]
  58. Kong, S.; Han, B.; Bai, Z.; Chen, L.; Shi, J.; Xu, Z. Receptor modeling of PM2.5, PM10 and TSP in different seasons and long-range transport analysis at a coastal site of Tianjin, China. Sci. Total Environ. 2010, 408, 4681–4694. [Google Scholar] [CrossRef]
  59. Wang, Y.; Zhuang, G.; Sun, Y.; An, Z. The variation of characteristics and formation mechanisms of aerosols in dust, haze, and clear days in Beijing. Atmos. Environ. 2006, 40, 6579–6591. [Google Scholar] [CrossRef]
  60. Guo, W.; Zhang, Z.-Y.; Zhang, N.J.; Luo, L.; Xiao, H.Y.; Xiao, H.W. Chemical characterization and source analysis of water-soluble inorganic ions in PM2.5 from a plateau city of Kunming at different seasons. Atmos. Res. 2020, 234, 104687. [Google Scholar] [CrossRef]
  61. Zhao, J.; Zhang, F.; Xu, Y.; Chen, J. Characterization of water-soluble inorganic ions in size-segregated aerosols in coastal city, Xiamen. Atmos. Res. 2011, 99, 546–562. [Google Scholar] [CrossRef]
  62. Eliani, E.; Nicola, M.; Jonathan, G.; Tara, K.B.; Zoe, K.S.; Iain, J.B. Measurement of diesel combustion-related air pollution downwind of an experimental unconventional natural gas operations site. Atmos. Environ. 2018, 189, 30–40. [Google Scholar]
  63. McCulloch, A.; Aucott, M.L.; Benkovitz, C.M.; E Graedel, T.; Kleiman, G.; Midgley, P.M.; Li, Y.-F. Global emissions of hydrogen chloride and chloromethane from coal combustion, incineration and industrial activities: Reactive Chlorine Emissions Inventory. J. Geophys. Res. Earth Surf. 1999, 104, 8391–8403. [Google Scholar] [CrossRef]
Figure 1. Sandstorm transport process based on remote sensing observations: (a,b) sandstorm occurred; (cn) sandstorm continued; (o,p) sandstorm dissipation.
Atmosphere 13 01629 g001aAtmosphere 13 01629 g001b
Figure 2. Spatial distribution of PM2.5 and PM10 concentrations during the sandstorm.
Atmosphere 13 01629 g002aAtmosphere 13 01629 g002b
Figure 3. (a) Daily change of PM2.5 and PM10 concentrations in Wuhai during the sandstorm; (b) changes of meteorological conditions in Wuhai during the sandstorm.
Atmosphere 13 01629 g003
Figure 4. Source apportionment of PM1, PM2.5, PM10 and TSP during the (a) non-sandstorm and (b) sandstorm.
Atmosphere 13 01629 g004
Figure 5. Analytical results of 72 h backward trajectories cluster of air mass in Wuhai during non-sandstorm (a) and sandstorm (b) intervals.
Atmosphere 13 01629 g005
Figure 6. Weighted potential source contribution function (PSCF) for PM2.5 and PM10 during non-sandstorm (a,b) and sandstorm (c,d) intervals.
Atmosphere 13 01629 g006
Figure 7. Weighted concentration weight trajectories (CWT) for PM2.5 and PM10 during non-sandstorm (a,b) and sandstorm (c,d) intervals.
Atmosphere 13 01629 g007
Table 1. Health risk assessment of toxic metal elements in atmospheric particulates to different populations.
ElementCRHQ
Adult MaleAdult WomenChildrenAdult MaleAdult WomenChildren
PM1Non-sandstormCr6.57 × 10−36.25 × 10−31.53 × 10−22.312.06 12.98
Cunenene3.19 × 10−52.84 × 10−51.79 × 10−4
Mnnenene1.72 1.53 9.66
Pbnenene1.82 × 10−21.62 × 10−21.02 × 10−1
Znnenene7.69 × 10−36.84 × 10−34.3 × 10−2
SandstormCr8.17 × 10−37.77 × 10−31.90 × 10−22.80 2.56 16.14
Cunenene2.07 × 10−51.84 × 10−51.16 × 10−4
Mnnenene3.25 2.89 18.22
Pbnenene3.64 × 10−53.25 × 10−52.04 × 10−4
Znnenene7.67 × 10−36.83 × 10−34.3 × 10−2
PM2.5Non-sandstormCr8.77 × 10−38.35×10−32.04×10−23.09 2.75 17.33
Cunenene5.94 × 10−55.29 × 10−53.33 × 10−4
Mnnenene0.58 1.41 8.87
Pbnenene1.56 × 10−21.39 × 10−28.78 × 10−2
Znnenene7.87 × 10−37.01 × 10−34.41 × 10−2
SandstormCr5.91 × 10−35.63×10−31.37×10−22.08 1.86 11.69
Cunenene4.84 × 10−54.31 × 10−52.71 × 10−4
Mnnenene5.89 5.24 33.02
Pbnenene7.44 × 10−36.62 × 10−44.17 × 10−4
Znnenene6.2 × 10−35.52 × 10−33.48 × 10−2
PM10Non-sandstormCr6.08 × 10−35.79 × 10−31.41 × 10−22.14 1.91 12.02
Cunenene6.13 × 10−55.45 × 10−53.44 × 10−4
Mnnenene1.29 1.15 7.25
Pbnenene8.95 × 10−37.97 × 10−35.02 × 10−2
Znnenene7.75 × 10−36.90 × 10−34.34 × 10−2
SandstormCr9.12×10−38.68×10−32.12×10−23.21 2.86 18.03
Cunenene9.92 × 10−58.83 × 10−55.57 × 10−4
Mnnenene12.80 11.37 71.62
Pbnenene3.24 × 10−32.89 × 10−31.82 × 10−2
Znnenene6.90×10−36.14×10−33.87 × 10−2
TSPNon-sandstormCr4.61×10−34.39×10−31.07×10−21.62 1.45 9.11
Cunenene2.54 × 10−52.27×10−51.43×10−4
Mnnenene1.23 1.10 6.90
Pbnenene6.68 × 10−35.95 × 10−33.75 × 10−2
Znnenene7.82 × 10−36.96 × 10−34.38 × 10−2
SandstormCr1.05 × 10−21.00 × 10−22.45 × 10−23.71 3.31 20.83
Cunenene9.14 × 10−58.13 × 10−55.13 × 10−4
Mnnenene16.08 14.32 90.20
Pbnenene6.39 × 10−35.69 × 10−33.59 × 10−2
Znnenene9.17 × 10−38.17 × 10−35.14 × 10−2
CR: carcinogenic risk; HQ: non-carcinogenic risk; ne: no effect. CR < 1 × 10⁻⁶, no carcinogenic risk; 1 × 10⁻⁶ < CR < 1×10⁻⁴, acceptable range; CR > 1 × 10⁻⁴ , high risk of causing cancer. HQ ≥ 1, a possible non-cancer risk, with higher values increasing the risk.
Publisher’s Note: MDPI stays neutral with regard to jurisdictional claims in published maps and institutional affiliations.

